")
Back to Journals » Breast Cancer: Targets and Therapy » Volume 7
Identification of genes involved in breast cancer and breast cancer stem cells
Authors Apostolou P , Toloudi M, Papasotiriou I
Received 21 March 2015
Accepted for publication 14 May 2015
Published 15 July 2015 Volume 2015:7 Pages 183—191
DOI https://doi.org/10.2147/BCTT.S85202
Checked for plagiarism Yes
Review by Single anonymous peer review
Peer reviewer comments 5
Editor who approved publication: Professor Pranela Rameshwar
Panagiotis Apostolou, Maria Toloudi, Ioannis Papasotiriou
Research and Development Department, Research Genetic Cancer Centre Ltd, Florina, Greece
Abstract: Breast cancer is the most frequent type of cancer in women. Great progress has been made in its treatment but relapse is common. One hypothesis to account for the high recurrence rates is the presence of cancer stem cells (CSCs), which have the ability to self-renew and differentiate into multiple malignant cell types. This study aimed to determine genes that are expressed in breast cancer and breast CSCs and to investigate their correlation with stemness. RNA was extracted from established breast cancer cell lines and from CSCs derived from five different breast cancer patients. DNA microarray analysis was performed and any upregulated genes were also studied in other cancer types, including colorectal and lung cancer. For genes that were expressed only in breast cancer, knockdown-based experiments were performed. Finally, the gene expression levels of stemness transcription factors were measured. The outcome of the analysis indicated a group of genes that were aberrantly expressed mainly in breast cancer cells with stemness properties. Knockdown experiments confirmed the impact of several of these on NANOG, OCT3/4, and SOX2 transcription factors. It seems that several genes that are not directly related with hormone metabolism and basic signal transduction pathways might have an important role in relapse and disease progression and, thus, can be targeted for new treatment approaches for breast cancer.
Keywords: breast cancer, cancer stem cells, stemness, DNA microarray
Introduction
Breast cancer is the most frequent type of cancer among women, with more than 230,000 new cases diagnosed in the US in 2013. It is the leading cause of death in women worldwide, and the second highest cause in the US among all cancer types.1,2 The treatment of breast carcinoma mainly involves conserving surgery or mastectomy, depending on the localization of the tumor and the stage.3,4 Chemotherapy and/or radiation therapy, as well as hormone-dependent therapies, is also used, depending on stage, histology, and biomarkers.5
One of the major problems in cancer treatment is multidrug resistance, as many breast tumors either possess or develop resistance to chemotherapeutic drugs.6 The recurrence of breast cancer is also an important issue in the treatment, and the ability to predict a pattern for breast cancer recurrence is of high priority for many researchers.7 According to previously published literature and experimental data, resistance and recurrence of breast cancer could be due to the existence of cancer stem cells (CSCs), the epithelial–mesenchymal transition, and the signaling transduction pathways as well as microRNAs.8–11
CSCs have the ability to self-renew and initiate differentiation into heterogenic cancer cells, which may cause metastasis and relapse.12 In breast cancer, it has been demonstrated that there is a linear relationship between the gene expression of stemness markers and the stage of the disease.13
Because these cells are correlated with the progression of the disease, as well as with resistance and recurrence of breast cancer, it is essential to investigate and identify new markers or new targets correlated with them. The present study aims to identify genes that are overexpressed in breast CSCs using samples from different patients and to ascertain any associations with stemness transcription factors.
The experimental data indicated a group of genes with high gene expression in breast CSCs, but not in breast, colon, and lung cancer cells. A possible relationship between these genes and stemness was ultimately demonstrated.
Materials and methods
Cell lines
Human breast CSCs (36102-29P; Celprogen, CA, USA), colon CSCs (36112-39P; Celprogen), and lung CSCs (36107-34P; Celprogen) were cultured in appropriate growth medium provided by the manufacturer (M36102-29E, M36112-39E, M36107-34E; Celprogen) in 25 cm2 flasks (E36102-29-T25, E36112-39-T25, E36107-34-T25; Celprogen). The human carcinoma cell lines used were obtained from the European Collection of Cell Cultures – Health Protective Agency (ECACC-HPA, Salisbury, UK): MDA-MB 231, T47D, and MCF-7 are human breast cancer lines, COLO699N is a nonsmall-cell lung carcinoma line (NSCLC), and HCT-116 is a colorectal cancer line. Cells were cultured in 75 cm2 flasks (5520200; Orange Scientific, Braine-l’Alleud, Belgium) in the recommended media supplemented with the appropriate amount of heat-inactivated fetal bovine serum (10106-169; Thermo Fisher Scientific, Waltham, MA, USA) and 2 mM l-glutamine (G5792; Sigma-Aldrich, Munich, Germany). The cells were incubated at 37°C in a 5% CO2 environment.
Peripheral blood mononuclear cells were obtained from five breast cancer patients as well as from a healthy 30-year-old male. The blood samples were collected, placed in tubes with Ethylenediaminetetraacetic acid (EDTA) as an anticoagulant (Vacutainer K3E 7.2mg, Fisher Scientific, Pittsburgh, PA, USA), and rotated for 30 minutes to prevent coagulation. To isolate peripheral blood mononuclear cells, whole blood cells were centrifuged with polysucrose solution (Biocoll separating solution 1077; Biochrom, Germany). Mononuclear cells, lymphocytes, platelets, and granulocytes were collected after centrifugation and washed twice with phosphate-buffered saline (P3813; Sigma-Aldrich, Munich, Germany). Cells from the healthy donor were then incubated at 4°C for 30 minutes with EpCAM magnetic beads (39-EPC-50; Gentaur, Belgium), while those from patients were incubated with pan-cytokeratin (39-CUST; Gentaur) at 4°C for 30 minutes. EpCAM is an epithelial cell adhesion molecule-associated antigen that is expressed in the vast majority of carcinomas.14 Following incubation, the samples were placed in a magnetic field, selected, and then washed with phosphate-buffered saline. The EpCAM-negative selected cells (noncancerous) and the pan-cytokeratin-positive cells were isolated and cultured in 25-cm2 flasks with RPMI-1640 medium (R6504; Sigma). The endothelial cells were removed with CD31 beads (CD31-50; Gentaur).
After a few passages, spheres were observed in patient samples. They were collected and cultured in STEMPRO human embryonic stem cells (hESC) serum-free media (SFM) (A10007-01; Thermo Fisher Scientific), which contained Dulbecco’s modified Eagle’s medium (DMEM)/F12 supplemented with glutamax, mercaptoethanol, bovine serum albumin 25%, and STEMPRO hESC supplement. According to the recommended protocol, fibroblast growth factor (10 μg/mL) was added to the culture. The cells were then incubated at 37°C in a 5% CO2 environment.
Patients
The first patient was a 67-year-old woman with early diagnosed breast cancer of an unknown stage who had received no previous therapies. The second cell line was derived from a 64-year-old woman with stage II breast cancer who had undergone chemotherapy and surgery treatment. The third sample was derived from a 58-year-old woman with stage II/III breast cancer who had been subjected to partial mastectomy and who had also undergone immunotherapy. The next patient was a 45-year-old woman with stage IV breast cancer. She had undergone adjuvant chemotherapy followed by radiotherapy. She had also received a modified radical mastectomy 5 years earlier. The last cell line was derived from a 43-year-old woman with stage IV breast cancer.
Each patient has consented writing and has given their permission for storage of samples as for their use in Research and Development purposes. This study is not a clinical trial and does not include intervention in patients. All procedures were conducted according to the standards of Safety, Bioethics, and Validation.
Evaluation of cells
Cells were tested using both cellular and molecular assays. The cellular assays were based on the ability of CSCs to form microspheres in semisuspension, as detected with an inverted light microscope. The cultivated cells have previously been evaluated with molecular analysis, including gene expression analysis for specific transcription factors.15–18 The authentication of the control cell line was tested each time using molecular-based assays, such as short tandem repeats profiling, which was compared with the manufacturer’s profile. The cultivation step was continued for >30 passages to exclude the possibility of any embryonic stem cells (ESCs) being included. CSCs are immortal, unlike ESCs.
RNA extraction
RNA was extracted from cells using a Magnetic mRNA Isolation Kit (S1550S; New England Biolabs, Hertfordshire, UK). The RNA samples were evaluated both spectrophotometrically and on agarose gels by checking the 18S–28S rRNA bands.
DNA microarrays
A total of 1 μg of the extracted RNA was prepared for DNA microarray experiments using the Amino Allyl MessageAmp II kit (AM1753; Ambion, TX, USA) according to the manufacturer’s protocol. The dye was performed by using the Amersham CyDye Post-labeling Reactive Dye Pack (RPN5661; GE Healthcare, Freiburg, Germany). The noncancerous sample was labeled with Cy3, while the breast samples were labeled with Cy5. For each sample, the noncancerous and cancerous samples were mixed together and hybridized on a Human Ready Array platform (HS1100; Microarrays Inc., AL, USA). The prehybridization, hybridization, and washing procedures were automated on the HS400Pro (TECAN, Switzerland). Finally, the slides were imaged on the InnoScan 710 (Innopsys, France) with 5 μM resolution.
Data analysis
Scanned microarray image data were used to process expression data by Array-Pro Analyzer 6.3 Software. The microarray gene expression data were normalized using background subtraction. All data were represented as a log2 ratio for the expression analysis of gene transcription. Analysis of variance and t-test were used to evaluate the variant significance of gene expression in different groups. Genes with log2 ratios of means >2 in all samples were further examined.
Molecular analysis
A total of 1 μg of RNA of each sample was used as a template for cDNA synthesis using an iScript cDNA synthesis kit (1708891; Bio-Rad Laboratories Inc., CA, USA). Genomic DNA had been previously removed using an RNase-Free DNase Set (79254; Qiagen NV, Venlo, the Netherlands). The top strand was used as template for the real-time polymerase chain reaction (PCR) reaction, which was performed using iTaq Universal SYBR Green Supermix (1725124; Bio-Rad Laboratories Inc.). Specific primers for each marker and for the endogenous control gene (18S rRNA) were designed with Genamics Expression 1.1 software. The sequence of primers was run on BLAST to exclude those that amplified undesired genes. The sequences of the primers are presented in Table 1.
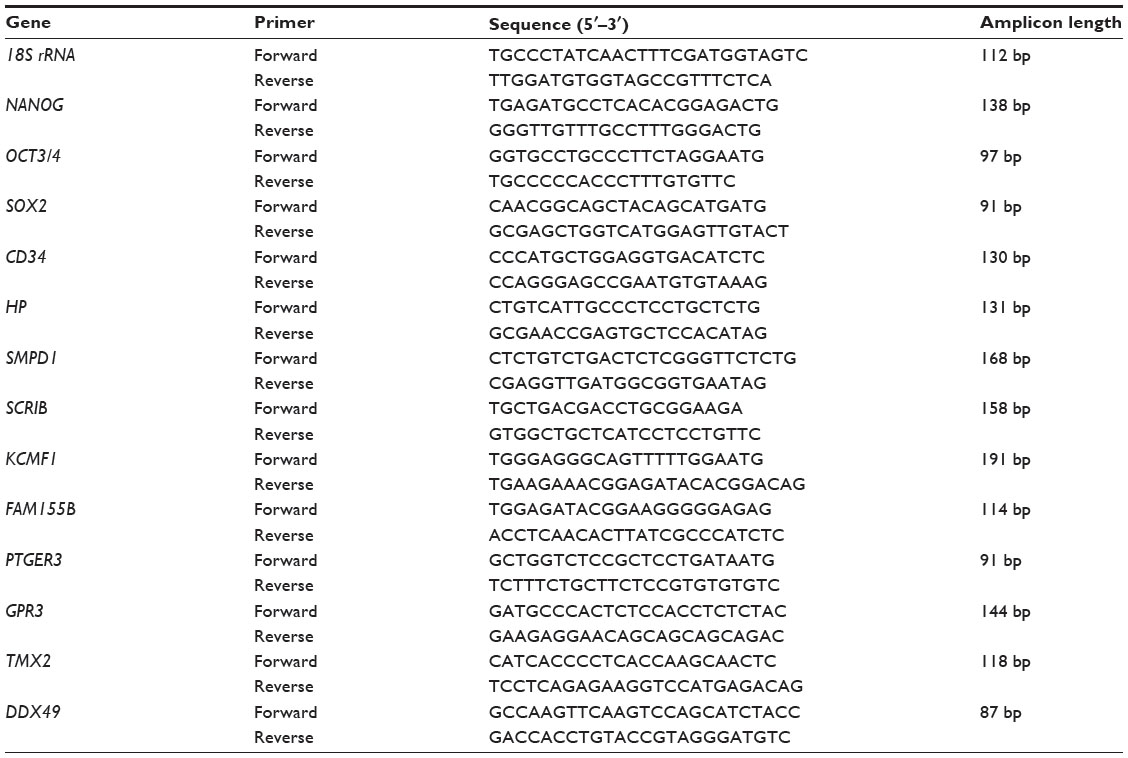 | Table 1 Primer pairs used in qPCR analysis |
The PCR reaction program was set as follows: initial denaturation at 95°C, 50 cycles of denaturation at 95°C for 10 seconds followed by annealing at 59°C for 30 seconds. A final extension step was performed at 72°C for 10 minutes followed by melting curve analysis. Data were analyzed according to the Livak method.19 In all PCR reactions, positive and negative controls were used. The positive control was cDNA from a Universal Human Reference RNA (740000-41; Agilent Technologies, Santa Clara, CA, USA), and negative controls were no-template, no-enzyme, and controls that included human genomic DNA (G304A; Promega, WI, USA). Finally, a no-reverse transcription control was used in cDNA synthesis.
Knockdown
During the exponential phase of proliferation, commercial breast CSCs cells were plated in 24-well plates (E36102-29-24Well; Celprogen) and transfected with gene-specific small interfering RNAs (siRNAs) using Lipofectamine 2000 Reagent (11668-027; Thermo Fisher Scientific), according to the manufacturer’s instructions. The siRNA molecules were designed in accordance with the rules of Reynolds et al.20 The siRNA sequences were as follows:
HP: 5′ UAAGGCUGUUGGAGAUAAAdTdT 3′,
SMPD1: 5′ UGAGGCUGCUGUCCUUUCAdTdT 3′,
SCRIB: 5′ GGACACACCUCACUACAAAdTdT 3′,
KCMF1: 5′ CCAAUGCAGUGCAUAUUAAdTdT 3′,
FAM155B: 5′ ACCUCGUGCUGCAUAAAUAdTdT 3′,
PTGER3: 5′ GAAUGCAACUUCUUCUUAAdTdT 3′,
GPR3: 5′ CAAAGACAGUGUCUAUUUAdTdT 3′,
TMX2: 5′ UGCAGCUUCUGAUUUUAAAdTdT 3′, and
DDX49: 5′ CACGAGGACUGGUCCAUUAdTdT 3′.
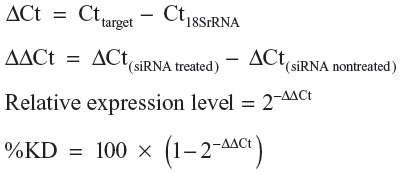
All sequences were run on BLAST to ensure that there was no risk of off-target effects. Following 48 hours incubation, cells were harvested by trypsinization (15090-046; Thermo Fisher Scientific). Samples incubated with Lipofectamine alone (without siRNA) were also tested to study the effect of compound alone on gene expression. Finally, samples incubated with nonspecific siRNA were tested to study the specificity of the particular siRNA. The mRNA knockdown was calculated relative to a nontargeting control siRNA in each experiment. The experiments were repeated three times in triplicate. The expression level of the gene of interest and its percentage knockdown was calculated using the comparative threshold cycle (Ct) method:
Statistical analysis
The quantitative PCR (qPCR) results were assessed according to the Kolmogorov–Smirnov test; all samples had normal distribution. Median values were used for the analysis. Mann–Whitney tests were also performed on the qPCR data. All the reactions (molecular assays, knockdown) were performed in triplicate three times. A P-value of <0.05 was considered significant. To ensure the differential expression of genes in knockdown experiments, t-test was run and the statistical significance was set to 0.05.
Results
DNA microarray
DNA microarray analysis of breast CSCs and patient cell lines demonstrated nine different genes with log ratios of >2. These genes included haptoglobin (HP), sphingomyelin phosphodiesterase 1, acid lysosomal (SMPD1), scribbled homolog (Drosophila) (SCRIB), potassium channel modulatory factor 1 (KCMF1), family with sequence similarity 155, member B (FAM155B), prostaglandin E receptor 3 (subtype EP3) (PTGER3), G protein-coupled receptor 3 (GPR3), thioredoxin-related transmembrane protein 2 (TMX2), and DEAD (Asp-Glu-Ala-Asp) box polypeptide 49 (DDX49). The positive controls, as well the housekeeping genes, were expressed in all samples, while the negative controls were not. The heat map of genes with log ratio >2 are presented in Figure 1.
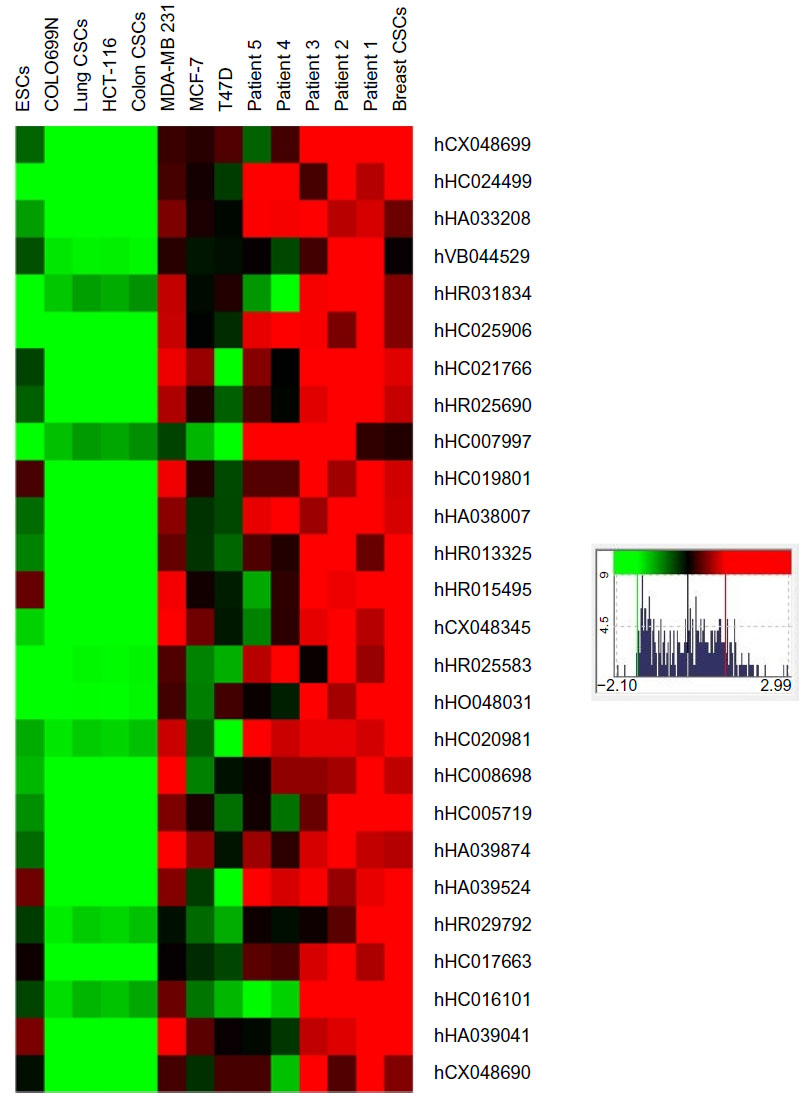 | Figure 1 Microarray clustering analysis. |
qPCR validation of DNA microarrays
The above genes were validated with qPCR assays for all samples. qPCR assays were also performed on other samples including normal samples, ESCs, colorectal and lung cancer cells, and CSCs of other cell lines representing lung and colorectal cancer. The relative analysis revealed that some of the genes were expressed only in breast cancer while others were also expressed in lung and colon cancer. Among them, HP, SMPD1, and FAM155B were overexpressed in MCF-7 and MDA-MB 231 cell lines and in all patients. A lower level of overexpression was also observed in ESCs. SCRIB was overexpressed in four of the patients and in MCF-7 and MDA-MB 231 cell lines, as well as in ESCs. Low levels were evident in differentiated lung and colorectal cell lines. KCMF1 was overexpressed in four patients, in MCF-7 and MDA-MB 231 cell lines, and at lower levels in ESCs. PTGER3 was overexpressed in two of the patients and in T47D cells. Upregulation was observed in three of the patients for GPR3. The expression rates were similar in MDA-MB 231 cells and lower in MCF-7 and ESCs. TMX2 was overexpressed in all breast samples, both in patient-derived and commercial cell lines, but was not expressed in ESCs and in lung and colon cancer. Almost the same results were obtained for DDX49. Among all the patients, the expression levels did not show great difference (Figure 2).
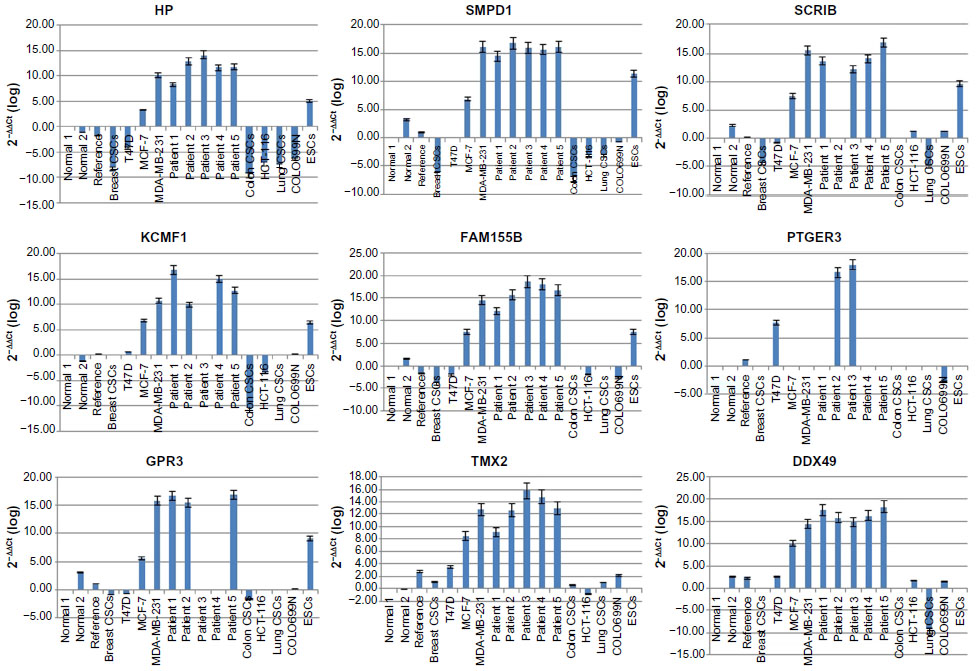 | Figure 2 Gene expression among different cancer types. |
Knockdown assays
The knockdown experiments were satisfactory only for FAM155B, PTGER3, GPR3, TMX2, and DDX49. The reduction in expression ranged from 20% to 40% for FAM155B, 35%–40% for PTGER3, 35%–50% in GPR3, 10%–25% in TMX2, and around 40% for DDX49. The phenotype of the cells was not particularly affected, except in those in which TMX2 was knocked down (Figure 3). After TMX2 knockdown, the cells seem to obtain more rounded formation, compared with the control. However, the change is not too great, so be considered significant. The cell population also was not affected in all cells.
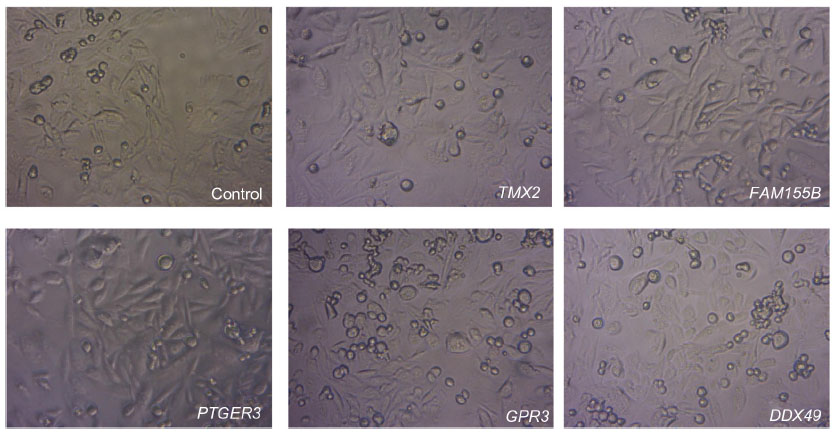 | Figure 3 Breast CSCs pre- and post-siRNA knockdown. |
Relative gene expression in stemness transcription factors
In the knocked-down samples, further qPCR experiments were performed to study the gene expression of NANOG, OCT3/4, SOX2, and CD34, both pre- and postknockdown. The knockdown of FAM155B led to a decrease in CD34 and a small increase in the other transcription factors. The reduction in GPR3 gene expression led to upregulation of NANOG transcription factor, and OCT3/4 and CD34 to lesser extent; no change was observed for SOX2. An increase in gene expression of NANOG and OCT3/4 was observed post-PTGER3 knockdown, while a decrease was observed in CD34. The reduction in NANOG was observed only after the knockdown of TMX2. Following suppression of TMX2, a decrease in OCT3/4 and SOX2 was also observed. Finally, the suppression of DDX49 led to the lowest levels of SOX2 and OCT3/4 in parallel with an increase in NANOG and CD34 (Figure 4).
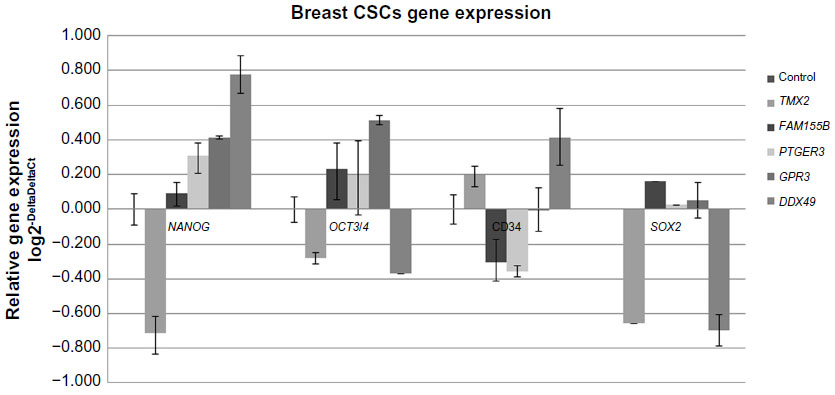 | Figure 4 Gene expression of stemness transcription factors in breast CSCs. |
Discussion
Breast cancer affects the highest proportion of women compared with other types of cancers. Although progress has been made in its diagnosis and treatment, much research continues on its recurrence and drug resistance mechanisms. According to previous experiments, CSCs may provide clues. By exhibiting specific features, such as self-renewal, initiation of cancer, and propagation of metastasis, they may be the ideal target for new therapeutic approaches.21
However, CSCs are affected by many factors, and many signal transduction pathways are implicated in their function. Notch1 is implicated in breast tumorigenesis, thus new molecules against Notch1 are a research focus.22 According to another study based on colon CSCs, the suppression of Notch receptors led to an increase in stemness transcription factors.23 Wnt1 and STAT1/3 are involved in drug and radio resistance.24,25 Amplification or overexpression of human epidermal growth factor receptor 2 (HER2) has been shown to play an important role in the progression of breast cancer, and it is also implicated in resistance to chemotherapeutics.26
Microarray technology enables the study of thousands of genes and the outcome of gene expression signatures in many types of cancer. There are many studies relating to specific gene expression signatures among different phenotype characteristics, histology subtypes, and invasiveness.27 However, there are few existing data with reference to gene expression patterns in breast CSCs. The present study aimed to examine which genes are overexpressed in breast CSCs derived from patients and compare them with differentiated breast cancer cells as well as with colorectal and lung cancer.
It is noteworthy that the genes that were overexpressed in all samples (CSCs) were not directly correlated with breast cancer. Moreover, some were found to not be involved in signal transduction pathways, and others were not included in hormone metabolism.
Abundant levels of HP are associated with advanced breast cancer; furthermore, it is also used as a marker in squamous cell carcinoma of the lung.28 However, according to Gast et al, the HP phenotype cannot be used as a predictor of recurrence-free survival in high-risk breast cancer.29 Our study confirms the increased expression of HP in breast and breast CSCs and its absence in NSCLC. The SMPD1 gene has been linked with Parkinson’s disease,30 but other studies have linked ceramides with cell signaling pathways.31 In a previous epidemiology study, it was demonstrated that among patients with a primary diagnosis of Parkinson’s disease, increased risks were observed for breast cancer.32 Asymmetric cell division plays an important role in the CSC hypothesis,33 and SCRIB seems to be involved in this process, as it was found that it regulates cortical polarity and mitotic asymmetry in Drosophila neuroblasts.34 The KCMF1 is a critical factor for cancer development in pancreatic cancer,35 and it affects the proliferation and colony formation of human colon CSCs.36 In the present study, its overexpression was also observed in breast CSCs and in ESCs, confirming its role in development. The transmembrane protein, FAM155B, has been demonstrated to be affected by a microduplication at X chromosome in breast cancer patients.37 The PTGER3 gene is upregulated in triple-negative breast cancer subtypes,38 but it was also upregulated in nontriple-negative breast cancer subtypes in the present study. Another transmembrane protein, GPR3, which is involved in signal transduction, was overexpressed in breast CSCs and ESCs. This is a critical factor for the maintenance of meiotic prophase arrest in oocytes; however, it also seems to interact with stemness transcription factors by affecting NANOG and OCT3/4.39
DDX49 is a helicase that is upregulated in lymphocytes irradiated with γ rays.40 There are no reports in the literature correlating breast cancer with DDX49; however, knockdown experiments revealed that SOX2 and OCT3/4 transcription factors were downregulated, and NANOG was upregulated upon its suppression. DDX49 gene expression was not observed in ESCs, in contrast to the above genes, indicating that it may only be involved in breast CSCs and not in stem cells.
Finally, the TMX2 gene seems to be implicated in a stemness pathway to a greater extent than any of the other factors, by affecting NANOG, OCT3/4, and SOX2 in the same way. TMX2 is a thioredoxin-related transmembrane protein that possesses not only a thioredoxin consensus pattern, but also an endoplasmic reticulum membrane retention signal, an N-terminal signal peptide, and a Myb DNA-binding domain repeat signature.41 The participation of thioredoxin in redox reactions explains its role in cell signaling and homeostasis. Any abnormal regulation could contribute to carcinogenesis. Direct or indirect interaction with stemness transcription factors could explain the role of TMX2 in carcinogenesis.
According to the above data, it seems that many little- studied genes that were not correlated directly with breast cancer and basic transduction pathways are overexpressed only in breast cancer and breast CSCs. Some of these might affect the stemness pathway and are thus involved in disease progression. Although qPCR data are informative and quantitative, further experiments at the protein level need to be performed. More experiments on a larger number of patients will also provide more precise data to draw reliable conclusions.
Conclusion
The identification of novel biomarkers for breast cancer has been a focus for research for many years. The implication of CSCs in drug resistance and recurrence is also well known. Because the gene expression of NANOG, OCT3/4, SOX2, and CD34 stemness transcription factors is implicated in the progression of breast cancer, the identification of genes that affect the above factors is essential. The present study aimed to determine genes that were overexpressed in breast cancer and particularly in breast CSCs and to determine their relationship with stemness pathways. We detected two main groups of genes: those that were expressed only in breast CSCs and that could be used as potential biomarkers and those that affect specific transcription factors, that are essential for stemness maintenance, and that might be used as new therapeutic targets.
Disclosure
The authors report no conflicts of interest in this work.
References
Jemal A, Bray F, Center MM, Ferlay J, Ward E, Forman D. Global cancer statistics. CA Cancer J Clin. 2011;61(2):69–90. | |
Siegel R, Desantis C, Jemal A. Colorectal cancer statistics, 2014. CA Cancer J Clin. 2014;64(2):104–117. | |
Jatoi I, Proschan MA. Randomized trials of breast-conserving therapy versus mastectomy for primary breast cancer: a pooled analysis of updated results. Am J Clin Oncol. 2005;28(3):289–294. | |
McGuire KP, Santillan AA, Kaur P, et al. Are mastectomies on the rise? A 13-year trend analysis of the selection of mastectomy versus breast conservation therapy in 5865 patients. Ann Surg Oncol. 2009;16(10):2682–2690. | |
Maughan KL, Lutterbie MA, Ham PS. Treatment of breast cancer. Am Fam Physician. 2010;81(11):1339–1346. | |
Wind NS, Holen I. Multidrug resistance in breast cancer: from in vitro models to clinical studies. Int J Breast Cancer. 2011;2011:967419. | |
Saphner T, Tormey DC, Gray R. Annual hazard rates of recurrence for breast cancer after primary therapy. J Clin Oncol. 1996;14(10):2738–2746. | |
Ahmad A. Pathways to breast cancer recurrence. ISRN Oncol. 2013;2013:290568. | |
Abdullah LN, Chow EK. Mechanisms of chemoresistance in cancer stem cells. Clin Transl Med. 2013;2(1):3. | |
Dave B, Mittal V, Tan NM, Chang JC. Epithelial-mesenchymal transition, cancer stem cells and treatment resistance. Breast Cancer Res. 2012;14(1):202. | |
Takahashi RU, Miyazaki H, Ochiya T. The role of microRNAs in the regulation of cancer stem cells. Front Genet. 2014;4:295. | |
Apostolou P, Toloudi M, Ioannou E, et al. AP-1 gene expression levels may be correlated with changes in gene expression of some stemness factors in colon carcinomas. J Signal Transduct. 2013;2013:497383. | |
Apostolou P, Toloudi M, Chatziioannou M, Ioannou E, Papasotiriou I. Cancer stem cells stemness transcription factors expression correlates with breast cancer disease stage. Curr Stem Cell Res Ther. 2012;7(6):415–419. | |
Munz M, Baeuerle PA, Gires O. The emerging role of EpCAM in cancer and stem cell signaling. Cancer Res. 2009;69(14):5627–5629. | |
Liu C, Cao X, Zhang Y, et al. Co-expression of Oct-4 and Nestin in human breast cancers. Mol Biol Rep. 2012;39(5):5875–5881. | |
Nagata T, Shimada Y, Sekine S, et al. Prognostic significance of NANOG and KLF4 for breast cancer. Breast Cancer. 2014;21(1):96–101. | |
Rodda DJ, Chew JL, Lim LH, et al. Transcriptional regulation of nanog by OCT4 and SOX2. J Biol Chem. 2005;280(26):24731–24737. | |
Bonnet D, Dick JE. Human acute myeloid leukemia is organized as a hierarchy that originates from a primitive hematopoietic cell. Nat Med. 1997;3(7):730–737. | |
Livak KJ, Schmittgen TD. Analysis of relative gene expression data using real-time quantitative PCR and the 2(-Delta Delta C(T)) method. Methods. 2001;25(4):402–408. | |
Reynolds A, Leake D, Boese Q, Scaringe S, Marshall WS, Khvorova A. Rational siRNA design for RNA interference. Nat Biotechnol. 2004; 22(3):326–330. | |
Carrasco E, Alvarez PJ, Prados J, et al. Cancer stem cells and their implication in breast cancer. Eur J Clin Invest. 2014;44(7):678–687. | |
Qiu M, Peng Q, Jiang I, et al. Specific inhibition of Notch1 signaling enhances the antitumor efficacy of chemotherapy in triple negative breast cancer through reduction of cancer stem cells. Cancer Lett. 2013; 328(2):261–270. | |
Apostolou P, Toloudi M, Ioannou E, et al. Study of the interaction among Notch pathway receptors, correlation with stemness, as well as their interaction with CD44, dipeptidyl peptidase-IV, hepatocyte growth factor receptor and the SETMAR transferase, in colon cancer stem cells. J Recept Signal Transduct Res. 2013;33(6):353–358. | |
Zhan JF, Chen LH, Yuan YW, et al. STAT1 promotes radioresistance of CD44(+)/CD24(−/low) cells in breast cancer. Exp Biol Med (Maywood). 2011;236(4):418–422. | |
Yin ZQ, Liu JJ, Xu YC, et al. A 41-gene signature derived from breast cancer stem cells as a predictor of survival. J Exp Clin Cancer Res. 2014;33(1):49. | |
Oak PS, Kopp F, Thakur C, et al. Combinatorial treatment of mammospheres with trastuzumab and salinomycin efficiently targets HER2-positive cancer cells and cancer stem cells. Int J Cancer. 2012;131(12):2808–2819. | |
Pedraza V, Gomez-Capilla JA, Escaramis G, et al. Gene expression signatures in breast cancer distinguish phenotype characteristics, histologic subtypes, and tumor invasiveness. Cancer. 2010;116(2):486–496. | |
Dowling P, Clarke C, Hennessy K, et al. Analysis of acute-phase proteins, AHSG, C3, CLI, HP and SAA, reveals distinctive expression patterns associated with breast, colorectal and lung cancer. Int J Cancer. 2012;131(4):911–923. | |
Gast MC, van Tinteren H, Bontenbal M, et al. Haptoglobin phenotype is not a predictor of recurrence free survival in high-risk primary breast cancer patients. BMC Cancer. 2008;8:389. | |
Foo JN, Liany H, Bei JX, et al. Rare lysosomal enzyme gene SMPD1 variant (p.R591C) associates with Parkinson’s disease. Neurobiol Aging. 2013;34(12):2890. e13–e50. | |
Henry B, Moller C, Dimanche-Boitrel MT, Gulbins E, Becker KA. Targeting the ceramide system in cancer. Cancer Lett. 2013;332(2):286–294. | |
Olsen JH, Friis S, Frederiksen K, McLaughlin JK, Mellemkjaer L, Moller H. Atypical cancer pattern in patients with Parkinson’s disease. Br J Cancer. 2005;92(1):201–205. | |
Morrison SJ, Kimble J. Asymmetric and symmetric stem-cell divisions in development and cancer. Nature. 2006;441(7097):1068–1074. | |
Albertson R, Doe CQ. Dlg, Scrib and Lgl regulate neuroblast cell size and mitotic spindle asymmetry. Nat Cell Biol. 2003;5(2):166–170. | |
Beilke S, Oswald F, Genze F, Wirth T, Adler G, Wagner M. The zinc-finger protein KCMF1 is overexpressed during pancreatic cancer development and downregulation of KCMF1 inhibits pancreatic cancer development in mice. Oncogene. 2010;29(28):4058–4067. | |
Zou J, Mi L, Yu XF, Dong J. Interaction of 14-3-3sigma with KCMF1 suppresses the proliferation and colony formation of human colon cancer stem cells. World J Gastroenterol. 2013;19(24):3770–3780. | |
Krepischi AC, Achatz MI, Santos EM, et al. Germline DNA copy number variation in familial and early-onset breast cancer. Breast Cancer Res. 2012;14(1):R24. | |
Burstein MD, Tsimelzon A, Hilsenbeck SG, et al. Expression and DNA copy number profiling suggest novel therapeutic approaches for triple negative breast cancer subtypes. Cancer Res. 2013;73(24 Suppl):Abstract nr 4-06-01. | |
Zhang B, Ding J, Li Y, et al. The porcine Gpr3 gene: molecular cloning, characterization and expression level in tissues and cumulus-oocyte complexes during in vitro maturation. Mol Biol Rep. 2012;39(5):5831–5839. | |
Fachin AL, Mello SS, Sandrin-Garcia P, et al. Gene expression profiles in human lymphocytes irradiated in vitro with low doses of gamma rays. Radiat Res. 2007;168(6):650–665. | |
Meng X, Zhang C, Chen J, et al. Cloning and identification of a novel cDNA coding thioredoxin-related transmembrane protein 2. Biochem Genet. 2003;41(3–4):99–106. |
 © 2015 The Author(s). This work is published and licensed by Dove Medical Press Limited. The full terms of this license are available at https://www.dovepress.com/terms.php and incorporate the Creative Commons Attribution - Non Commercial (unported, v3.0) License.
By accessing the work you hereby accept the Terms. Non-commercial uses of the work are permitted without any further permission from Dove Medical Press Limited, provided the work is properly attributed. For permission for commercial use of this work, please see paragraphs 4.2 and 5 of our Terms.
© 2015 The Author(s). This work is published and licensed by Dove Medical Press Limited. The full terms of this license are available at https://www.dovepress.com/terms.php and incorporate the Creative Commons Attribution - Non Commercial (unported, v3.0) License.
By accessing the work you hereby accept the Terms. Non-commercial uses of the work are permitted without any further permission from Dove Medical Press Limited, provided the work is properly attributed. For permission for commercial use of this work, please see paragraphs 4.2 and 5 of our Terms.