")
Back to Journals » International Journal of General Medicine » Volume 14
Identification of Gene Co-Expression Modules and Core Genes Related to Immune Disorders in Major Depression Disorder
Authors Zhang L, Zhang H, Xie J , Wang X
Received 3 September 2021
Accepted for publication 26 October 2021
Published 10 November 2021 Volume 2021:14 Pages 7983—7993
DOI https://doi.org/10.2147/IJGM.S336686
Checked for plagiarism Yes
Review by Single anonymous peer review
Peer reviewer comments 2
Editor who approved publication: Dr Scott Fraser
Lei Zhang,1,* Haibo Zhang,2,* Jiadong Xie,3,* Xu Wang4
1School of Public Administration, Hohai University, Nanjing, People’s Republic of China; 2Organization of Personnel Division, Jiangsu Provincial People’s Hospital (The First Affiliated Hospital of Nanjing Medical University), Nanjing, People’s Republic of China; 3School of Artificial Intelligence and Information Technology, Nanjing University of Chinese Medicine, Nanjing, People’s Republic of China; 4Xuzhou Medical University, Xuzhou, People’s Republic of China
*These authors contributed equally to this work
Correspondence: Xu Wang
Xuzhou Medical University, Xuzhou, People’s Republic of China
Email [email protected]
Introduction: Various studies have confirmed the connection between the mental state and the immune system, that is, mental activities can regulate immune function, and immune system disorders can not only lead to bodily diseases but also changes related to mentality, behavior, personality, and aging. However, the specific regulatory mechanism and key genes are still unclear.
Methods: We obtained the peripheral blood gene sequencing data from patients with major depression and normal volunteers from the GEO database and evaluated the scores of different immune cells by immune scoring algorithm. Using the immune scores as clinical data, a weighted gene co-expression network analysis (WGCNA) was carried out to study the association between the clinical characteristics and modules. Therefore, providing an opportunity to lock modules and core genes which are highly related to the immune regulation of major depression.
Results: Thirteen co-expression modules were clustered from 20,011 genes, the yellow module had a positive correlation with CD4+ T cell, CD8+ T cell, B cell, and NK cell immune scores, and a negative correlation with purple module. Functional annotation and signaling pathway analysis illustrated that the yellow module is mostly enriched in thymus development, T cell co-stimulation and differentiation, and B cell activation. Genes in the purple module were primarily related to inhibition of protein phosphorylation, leukocyte migration, promotion of apoptosis and hypoxia and other signaling pathways. Additionally, hub genes in the yellow and purple modules were detected, in which SKAP1 and RALB may be important regulatory genes affecting the immune status of patients with depression.
Discussion: In general, our study reveals the key genes related to the decrease in CD4+ T cells, CD8+ T cells, and B cells, in the peripheral blood of patients with depression, which provides some new insights and understandings for the clinical treatment and diagnosis of major depression. Drug design targeting these targets may provide the possibility for the treatment of major depression.
Keywords: major depression disorder, bioinformatic analysis, WGCNA, immune disorders
Introduction
Depression is a psychological and mental illness that is very harmful to humans, often coinciding with an immune function disorder.1 A number of patients receiving cytokine immunotherapy have been clinically observed to exhibit a series of depressive symptoms, and antidepressants can block these symptoms.2–4 Animal studies have also revealed a series of changes in neuropsychological behavioral changes following the injection of inflammatory cytokines or endotoxins: anorexia, somnolence, lack of pleasure, weight loss, decreased activity, and even lack of cognitive function, commonly referred to as “pathological behavior”.5,6 These pathological behavior and depressive symptoms are very similar to some extent, and their mechanisms are also similar with the mechanisms of stress-induced depression. Antidepressant effects are similar with the mechanism of pathological behavior, and antidepressants have a significant effect on pathological behavior. On the other hand, patients with chronic immune diseases often also present with depression, while anti-cytokines are associated with the improvement of depression accompanied by chronic immune diseases.7–9 In 1999, the “inflammatory response model of depression” was proposed,10 which was considered to be associated with the activation of the inflammatory response system; it is a kind of psychoneuroimmunology disorder. The activation of the peripheral immune can lead to several behaviors related to depression as well as neuroendocrine and neurobiochemical changes by releasing inflammatory cytokines. The internal molecular mechanism of immune disorders and depression is not yet clear. The purpose of this research was to analyze the molecular mechanism and the key target of immune disorders in patients with depression by means of the combination of an immune scoring algorithm and WGCNA.
Methods and Materials
Data Collection
A data chip named GSE98793 was downloaded from the GEO database.11 The study investigated the changes in gene expression in whole blood samples from donors diagnosed with severe depression (MDD) and from healthy controls. We could obtain microarray data of whole blood for the MDD patients (N = 128, 64 patients with extensive anxiety disorder; the diagnosis was made through a MINI questionnaire; 64 patients without anxiety disorder) and the healthy control group (N =64). The RMA algorithm was used to normalize the chip data to obtain the standardized gene expression values.
Evaluating the Proportion of Peripheral Blood Immune Cells
The proportion of different peripheral blood immune cells of patients with depression and normal volunteers was calculated by the Xcell database,12 and then the proportions of different peripheral blood immune cells of normal volunteers and patients with severe depression were compared and analyzed, which was used as clinical data in co-expression network analysis.
Co-Expression Network Construction
Initially, all the samples and genes in the expression profile excelled at the test of high-quality genes or good samples. Then, a scale-free network of all genes was constructed by utilizing the WGCNA R software package.13 First, the genes with expression indicated as “NA” were removed according to the expression profile, the variance in each gene in each sample was calculated, the genes with a standard deviation greater than 0.2 were screened, all the samples were further analyzed by cluster analysis, and the outlier samples were eliminated according to the clustering distance. The scale-free co-expression network was realized when the soft threshold corresponded to 6 and the correlation coefficient increased to 0.8. The expression matrix was converted into an adjacent matrix, which was later transformed into a topological matrix. Premised on topological overlap matrix (TOM), we utilized the average-linkage hierarchical clustering technique to cluster genes, in accordance with the criterion for a mixed dynamic shear tree and established the minimum number of bases per gene network module at 30. After determining the gene module utilizing the dynamic shear method, we computed the eigenvector value for each of the modules in turn. Subsequently, we performed cluster analysis on the modules, combined close modules into new modules, and fixed height=0.25.
Enrichment Analysis of Key Co-Expression Modules
Gene ontology (GO) enrichment analysis was carried out utilizing the Database for Annotation, Visualization and Integrated Discovery (DAVID, https://david.ncifcrf.gov/home.jsp), which is thought to be the commonly utilized functional annotation tool.14,15 The Kyoto Encyclopedia of Genes and Genomes (KEGG) pathway was employed as a reference, and the enrichment analysis was performed by DAVID. The genes in key co-expression modules with a high correlation with neutrophils were uploaded to study potential roles, and P < 0.05 was considered to represent significant differences.
Identification of Key Genes in the Modules
In the process of WGCNA of key genes in the modules, the interaction network of genes in the key module was derived, and the protein-protein interaction network was drawn by Cytoscape. The degree value of the key nodes in the network was calculated by Cytoscape,16 and the key nodes in the network were screened according to the degree value. In addition, the correlation between all genes in the module and the module could be analyzed, and the key genes in the module could be assessed in accordance with the correlation score between the genes and the module.
Results
Patients with Major Depression Disorder Show Visible Immune Cell Disorders
We utilized the Xcell database to analyze the scores of 11 common peripheral blood immune cells of patients with depression and normal volunteers. As shown in Figure 1, the proportion of CD4+ T cells, CD8+ T cells, B cells, and NK cells in the peripheral blood of MDD patients decreased significantly, while the proportion of macrophages in the peripheral blood of MDD patients increased. Previously, various studies have reported that depression patients tend to be immunosuppressed.17–19 However, the molecular mechanism under immunosuppressed conditions is still unknown. It was reported that changes in the leukocyte subgroup in the peripheral blood of patients with depression, usually accompanied by disruption of neutrophil phagocytosis, inhibition of cytotoxicity of NK cells, and decrease in proliferation of lymphocytes. This is consistent with our analysis results. Furthermore, the increase in macrophage score may also be related to the increase in inflammatory factor level.20,21 Overall, the characteristics of peripheral blood immune cells in depressed patients tend to be immunosuppressed, and the molecular mechanism needs to be further explored.
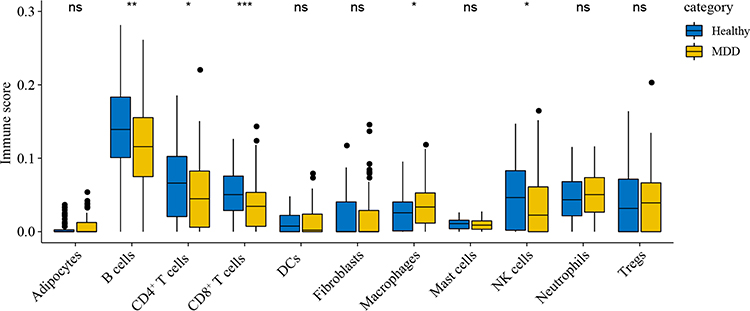 |
Figure 1 Comparison of immune cell fraction between normal volunteers and patients with major depression disorder. |
Construction of a Peripheral Blood Gene Co-Expression Network for MDD Patients
To systematically explain the relationship between MDD patients and immune cells and the underlying mechanism. Firstly, we obtained expression profile data containing 128 samples and 21,138 genes, which was analyzed by cluster analysis. The clustering results with sample characteristics are illustrated in Figure 2A. The red representation in the figure is marked as a nonzero sample in the table Finally, by eliminating outliers, we obtained a novel data expression profile, including a total of 125 samples and 20,011 genes. We employed the R software package WGCNA to build a weighted co-expression network. The soft threshold of β = 6 was chosen as illustrated in Figure 2B in order to make sure that the network was scale-free. An aggregate of 13 modules was revealed by clustering. As shown in Figure 2C, these modules display and contain different numbers of genes in different colors, whereby, the gray module comprises a set of genes that could not be merged into other modules. Based on the eigenvectors of each module, we computed the correlation between these modules. As shown in Figure 2D, each module is separated from the other in the network, while there is a correlation between some modules. These results suggest that some modules have significant differences between each other, and some modules have similar expression patterns. The above data suggests that we have successfully constructed a gene co-expression network of blood samples from MDD patients, which can be used for subsequent in-depth analysis.
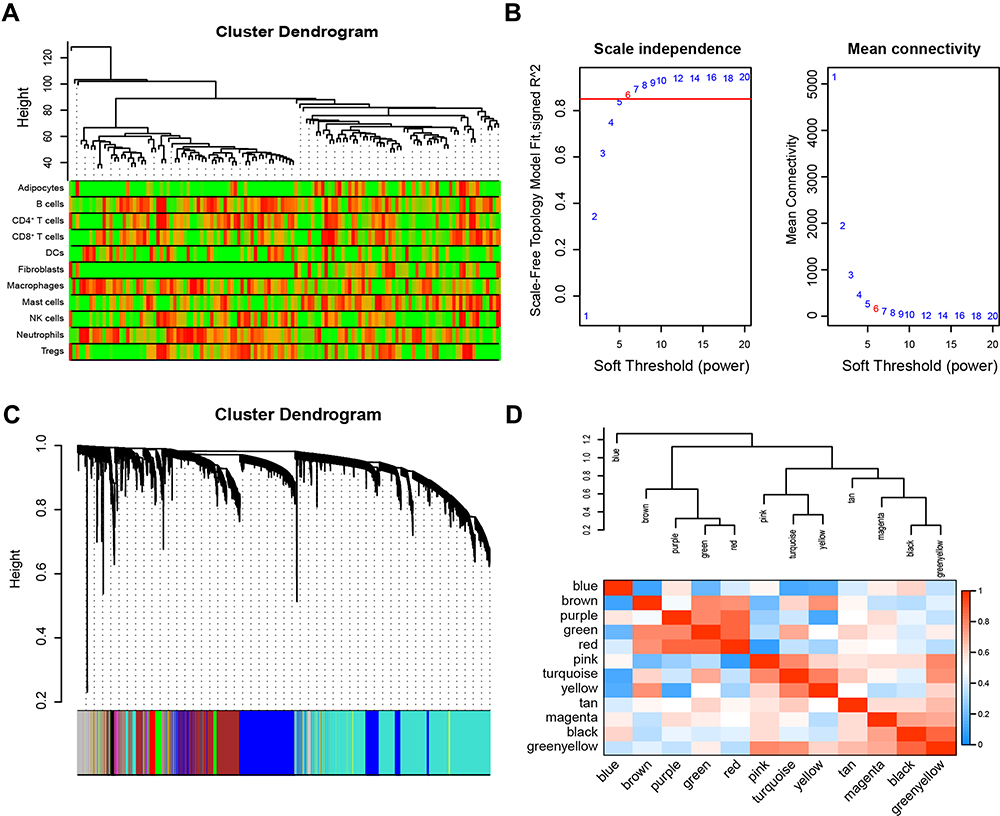 |
Figure 2 Construction of a WGCNA co-expression network of MDD patients. (A) Sample clustering molecular map; red representation of samples is marked as nonzero in the table. (B) Calculation and selection of the optimal soft threshold power. The influence of different powers on scale Independence (left), and the effect of different powers on mean connectivity (right). (C) Tree diagram of clustering of 20,011 genes and 13 combined modules in 125 MDD patients. (D) Correlation heat map of 13 modules. |
Modules Related to Immunosuppressive Status in MDD Patients
In order to further understand which genes can affect the peripheral blood immunosuppression of depressed patients, we computed the relationship between clustered modules and each phenotype index (Immune cell scores). As depicted in Figure 3, we can see the correlation and statistical significance between the phenotype and each module. Among them, CD4+ T cells, CD8+ T cells, B cells, and NK cells were positively correlated with the yellow module but negatively correlated with the purple module. Immune cells scores in the peripheral blood of MDD patients were considerably reduced than those in the healthy volunteers. In addition, we also analyzed the correlation of the module genes and phenotypes. As shown in Figure 4, we can see the correlation between the CD4+ T cells, CD8+ T cells, B cells, and NK cells with each module, in which the yellow and purple modules are the two modules with high correlation. Figure 5 shows the correlation scatter diagram of several immune cells (CD4+ T cells, CD8+ T cells, B cells, and NK cells) with genes in interested modules, which show a positively correlated trend. All in all, we have explored the connection between key immune cells and key genes from different angles, in order to further lock key genes.
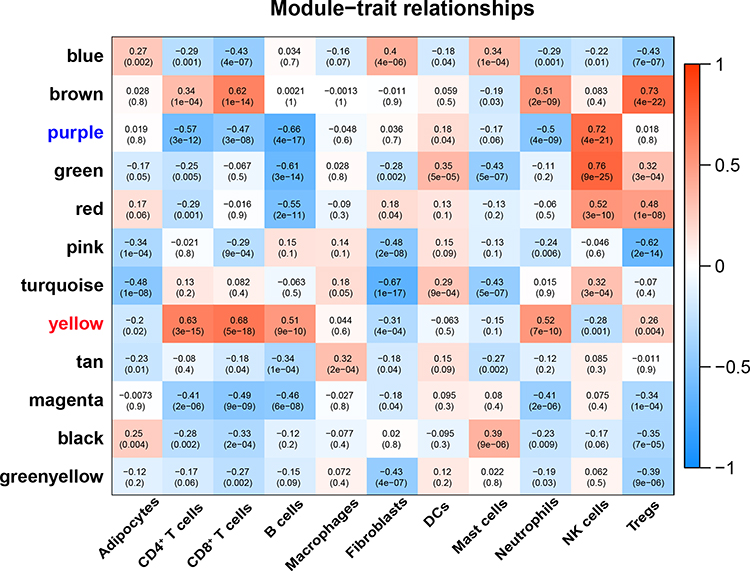 |
Figure 3 Correlation heatmap of Co-expression module and immunocyte score of MDD patients. Heatmap of the correlation between each module and the blood immune cell scores of MDD patients, red represents positive correlation, blue represents negative correlation. Each unit contains the corresponding correlation coefficient and P-value. |
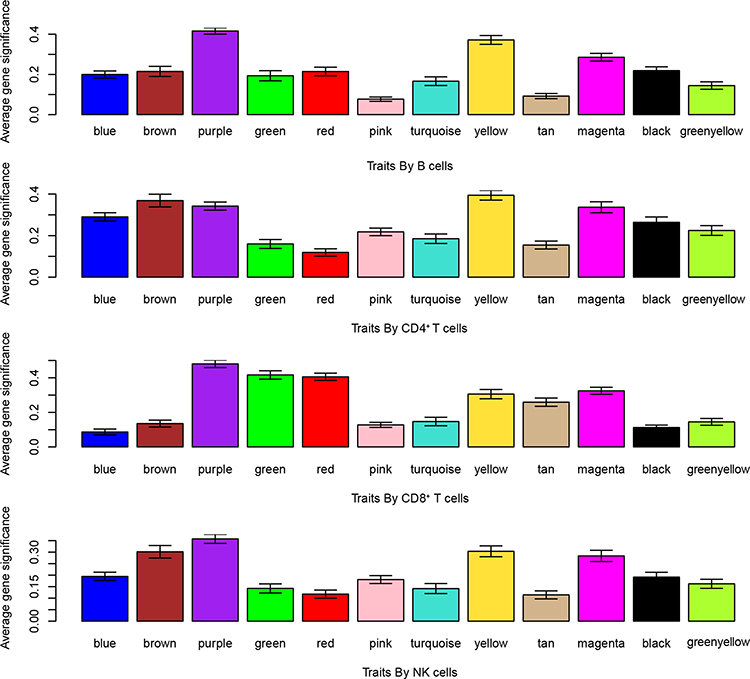 |
Figure 4 The correlation histogram of genes in the modules and immunocyte scores. There were significant levels of 13 co-expression modules related to B cells, CD4+ T cells, CD8+ T cells, and NK cells. |
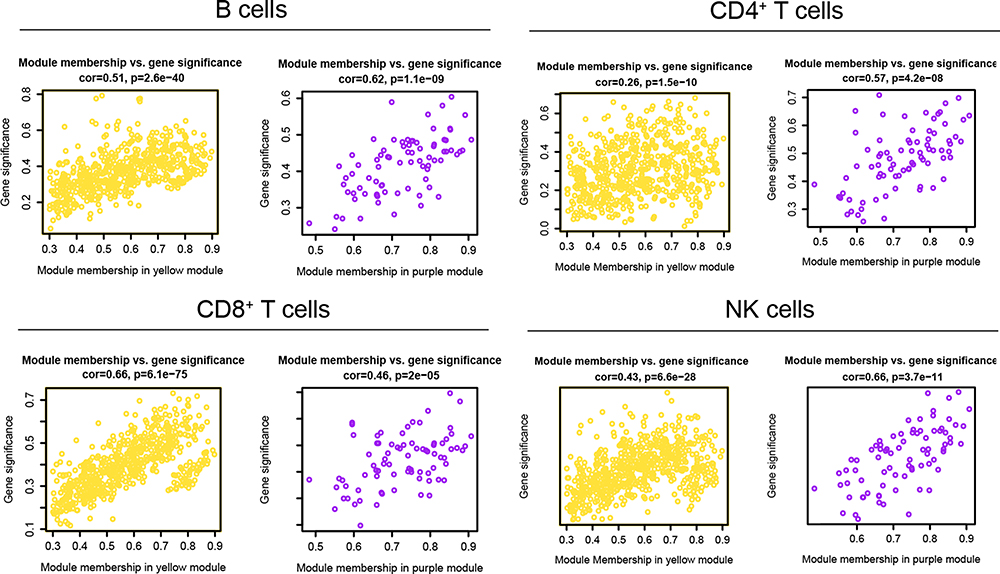 |
Figure 5 Scatter diagram of the correlation between genes and immunocyte scores. Scatter diagram of the correlation between genes and four immunocyte scores (B cells, CD4+ T cells, CD8+ T cells, NK cells) in the yellow and purple module. |
Gene Function Enrichment Analysis in Key Modules Related to Immune Disorder
As mentioned above, the specific molecular mechanism of immunosuppression in depressed patients is not yet clear, so we conducted an in-depth analysis of the yellow and purple models to explore their potential molecular mechanism. According to DAVID enrichment analysis of genes in the yellow and purple models, as illustrated in Figure 6A, the yellow module is predominantly concentrated in thymic development, T cell co-stimulation and differentiation, B cell activation, and the peripheral nervous system myelin maintenance. The KEGG signaling pathway analysis for the yellow module is mainly enriched in primary immunodeficiency signaling pathways, as seen in Figure 6B. While, genes in the purple module are mainly responsible for protein phosphorylation, leukocyte migration, and promoting apoptosis (Figure 6C). They also relate to the Rap1 signaling pathway (Figure 6D) and the HIF-1 signaling pathway. Some studies have shown that the HIF-1 signaling pathway takes part in immunosuppression.22 The above analysis shows that genes in the yellow module are more connected to the positive regulation process of immunity, while those in the purple module are mainly related to the process and pathway of immune negative regulation. The following work can focus on the core genes in these two modules, and the study of these genes may provide new ideas for the treatment of MDD patients.
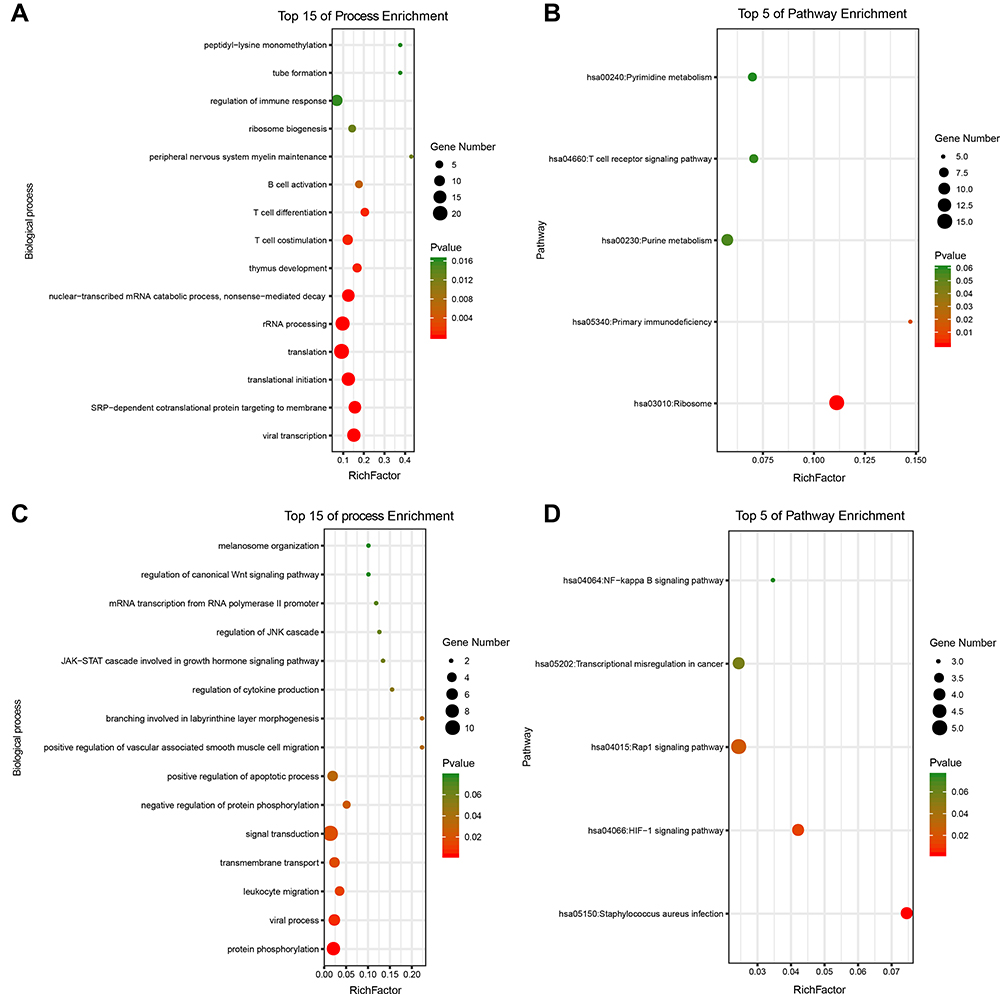 |
Figure 6 GO and KEGG pathway enrichment for genes in the immune related modules. (A) The top 15 enriched biological processes of genes in the yellow module. (B) The top 5 enriched signaling pathways of genes in the yellow module. (C) The top 15 enriched biological processes of genes in the purple module. (D) The top 5 enriched signaling pathways of genes in the purple module. |
Key Genes Related to the Immunosuppressive State in MDD Patients
To discover the core genes in the yellow and purple modules, we performed protein network analysis on these two modules respectively. The PPI network of the yellow module contains 583 genes and 49,683 interaction relations (Figure 7A). The purple module contains 79 genes and 1827 interaction relations (Figure 7B). As shown in Figure 7A and B, nodes’ colors are connected to the degree value of each node. The red color denotes a higher degree while the green color denotes a lower degree. Finally, we defined the 10 genes with the uppermost degree value in the network as key genes as previously described.23 In addition, module genes with MS score greater than 0.85 were also included as key nodes. As shown in Figure 8, the intersection of the two criteria was together used to find the key genes in each module. The key genes in the yellow module are IARS, SKAP1, LCK, PEBP1, FAM162A, ILF3, LDHB, RPSA, CD247, and EEF1B2. LDHB encodes the B subunit of the lactate dehydrogenase enzyme and is vital in the anaerobic conversion of lactate to pyruvate, NADH to NAD+, and conversion between NAD+ and NADH. An increase in LDHB protein expression has been identified in peripheral blood mononuclear cells of initial onset antipsychotic naive schizophrenics.24 GWAS analysis based on MDD patient samples showed that significant GWS signals were found around the LDHB gene in European American samples, suggesting that there is a close association between LDHB and MDD.25 Furthermore, SKAP1 is an adaptor with a peculiar N terminus, a C terminal SH3 domain, and a PH domain.26 SKAP1 can act as a scaffold for PLK1 in regulating the cell cycle of T-cells.27 Existing studies indicate that SKAP1 has a positive regulatory effect on immunity.28,29 In addition, LCK, RPSA, and CD274 have been reported to be related to immune activation.
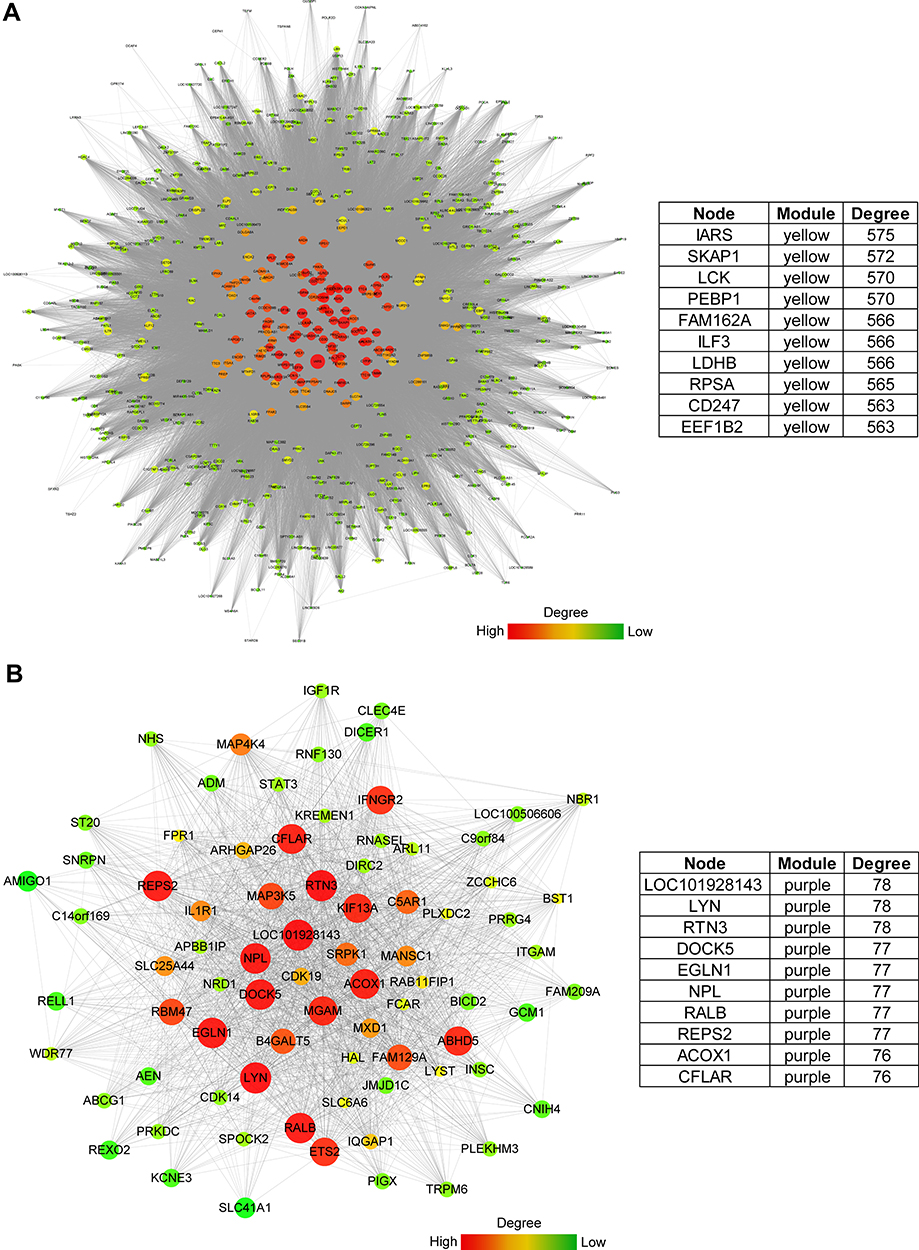 |
Figure 7 Hub genes in immune related key modules. (A) Gene PPI analysis, visualization, and 10 core genes in the yellow module. (B) Gene PPI analysis, visualization, and 10 core genes in the purple module. |
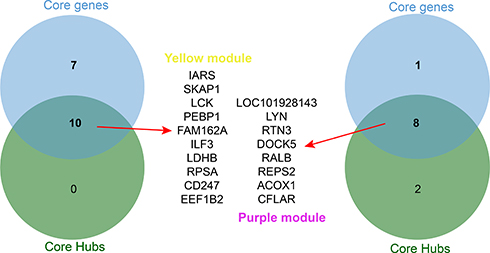 |
Figure 8 Core genes in immune related key modules. The key genes in the PPI network and the genes whose correlations with modules were higher than 0.85 were analyzed by a Venn diagram and screening of the core genes that were consistent in both. The top is the Venn diagram of the yellow module, and the bottom is the Venn diagram of the purple module. |
The most critical genes in the purple module are LOC101928143, LYN, RTN3, DOCK5, RALB, REPS2, ACOX1, CFLAR. In a study involving patients with MDD, SNP analysis showed a rare heterozygous mutation in exon 31 of DOCK5 (c.3170A>G, p.E1057G). The convergent functional genomics analysis illustrated that DOCK5 was recorded among the biomarkers for suicidality and mood state.30 The RAS-like GTPase RALB employs SEC5 to trigger innate immunity signaling and build a bridge between inflammation and immunity.31,32 Furthermore, LOC101928143, in the Purple module is an RNA gene, which belongs to the lncRNA class.33 Currently, there is a lack of reports on the function of this gene, which deserves further study. In general, we have screened some genes that are closely related to MDD, some of which play a role in immune activation, and some play a role in immunosuppression, which provides the possibility for subsequent in-depth research.
Conclusion
This study confirmed that the proportion of CD4+ T cells, CD8+ T cells, B cells, and NK cells in the peripheral blood of patients with depression were noticeably lower than that in the peripheral blood of normal volunteers by the immune scoring algorithm. As depression is the comorbidity of many diseases including thyroid disease,34 cancer,35 diabetes,36 cardiovascular37 and nervous system disease. Immune cells such CD4+ T cells, CD8+ T cells, B cells, and NK cells also play an important role in other disease progression. The pathogenesis of polycystic ovary syndrome is related to immune cells including T, CD4+ T, and NK cells.38 Moreover, patients with pancreatic ductal adenocarcinoma M0 macrophages, gamma delta T cells and naive CD4 T cells were independent predictive factors of a poor outcome for PDAC patients.39 Similar to these diseases, our research also confirmed that these types of immune cells play an important role in the progression of MDD. In addition, we found gene expression modules closely related to the decrease of these cells by WGCNA and screened and analyzed the key genes in these two modules. Among them, SKAP1 and RALB may be essential regulatory genes affecting the immune status of patients with depression, which is worthy of further experimental study.
Copyright/Ethics
The study was conducted in accordance with the Declaration of Helsinki (as was revised in 2013). The study was approved by Ethics Committee of the Xuzhou Medical University.
Acknowledgments
We kindly express our appreciation to XiaoYaHuaTu for the R scripts related to bioinformatics analysis. Thanks to Edward T. Bullmore for sharing the data to the GEO database, so we were able to carry out this research. Home for Researchers editorial team provided the language editing services.
Disclosure
The authors have declared that no conflict of interest exists.
References
1. Mattina GF, Van Lieshout RJ, Steiner M. Inflammation, depression and cardiovascular disease in women: the role of the immune system across critical reproductive events. Ther Adv Cardiovasc Dis. 2019;13:1753944719851950. doi:10.1177/1753944719851950
2. Anisman H, Merali Z. Cytokines, stress and depressive illness: brain-immune interactions. Ann Med. 2003;35:2–11. doi:10.1080/07853890310004075
3. Capuron L, Hauser P, Hinze-Selch D, et al. Treatment of cytokine-induced depression. Brain Behav Immun. 2002;16:575–580. doi:10.1016/S0889-1591(02)00007-7
4. Hayley S, Poulter MO, Merali Z, et al. The pathogenesis of clinical depression: stressor- and cytokine-induced alterations of neuroplasticity. Neuroscience. 2005;135:659–678.
5. Anisman H, Merali Z, Poulter MO, et al. Cytokines as a precipitant of depressive illness: animal and human studies. Curr Pharm Des. 2005;11:963–972. doi:10.2174/1381612053381701
6. Sudom K, Turrin NP, Hayley S, et al. Influence of chronic interleukin-2 infusion and stressors on sickness behaviors and neurochemical change in mice. Neuroimmunomodulation. 2004;11:341–350. doi:10.1159/000079415
7. Gibney SM, Drexhage HA. Evidence for a dysregulated immune system in the etiology of psychiatric disorders. J Neuroimmune Pharmacol. 2013;8:900–920.
8. Slusarczyk J, Trojan E, Chwastek J, et al. A Potential Contribution of Chemokine Network Dysfunction to the Depressive Disorders. Curr Neuropharmacol. 2016;14:705–720. doi:10.2174/1570159X14666160219131357
9. Taler M, Bar M, Korob I, et al. Evidence for an inhibitory immunomodulatory effect of selected antidepressants on rat splenocytes: possible relevance to depression and hyperactive-immune disorders. Int Immunopharmacol. 2008;8:526–533. doi:10.1016/j.intimp.2007.12.003
10. Smith RS. The macrophage theory of depression. Med Hypotheses. 1991;35:298–306. doi:10.1016/0306-9877(91)90272-Z
11. Leday GGR, Vertes PE, Richardson S, et al. Replicable and Coupled Changes in Innate and Adaptive Immune Gene Expression in Two Case-Control Studies of Blood Microarrays in Major Depressive Disorder. Biol Psychiatry. 2018;83:70–80. doi:10.1016/j.biopsych.2017.01.021
12. Aran D, Hu Z, Butte AJ. xCell: digitally portraying the tissue cellular heterogeneity landscape. Genome Biol. 2017;18:220. doi:10.1186/s13059-017-1349-1
13. Langfelder P, Horvath S. WGCNA: an R package for weighted correlation network analysis. BMC Bioinform. 2008;9:559. doi:10.1186/1471-2105-9-559
14. Huang da W, Sherman BT, Lempicki RA. Systematic and integrative analysis of large gene lists using DAVID bioinformatics resources. Nat Protoc. 2009;4:44–57. doi:10.1038/nprot.2008.211
15. Huang da W, Sherman BT, Lempicki RA. Bioinformatics enrichment tools: paths toward the comprehensive functional analysis of large gene lists. Nucleic Acids Res. 2009;37:1–13. doi:10.1093/nar/gkn923
16. Shannon P, Markiel A, Ozier O, et al. Cytoscape: a software environment for integrated models of biomolecular interaction networks. Genome Res. 2003;13:2498–2504. doi:10.1101/gr.1239303
17. Cukor D, Newville H, Jindal R. Depression and immunosuppressive medication adherence in kidney transplant patients. Gen Hosp Psychiatry. 2008;30:386–387. doi:10.1016/j.genhosppsych.2007.12.003
18. Karayurt O, Ordin YS, Unek T, et al. Immunosuppressive Medication Adherence, Therapeutic Adherence, School Performance, Symptom Experience, and Depression Levels in Patients Having Undergone a Liver Transplant During Childhood. Exp Clin Transplant. 2015;13:247–255.
19. Li R, Yang J, Yang J, et al. Depression in older patients with advanced colorectal cancer is closely connected with immunosuppressive acidic protein. Metab Brain Dis. 2014;29:87–92. doi:10.1007/s11011-013-9429-8
20. Guo L, Ren L, Zhang C. Relationship between depression and inflammatory factors and brain-derived neurotrophic factor in patients with perimenopause syndrome. Exp Ther Med. 2018;15:4436–4440.
21. Xie ZM, Wang XM, Xu N, et al. Alterations in the inflammatory cytokines and brain-derived neurotrophic factor contribute to depression-like phenotype after spared nerve injury: improvement by ketamine. Sci Rep. 2017;7:3124. doi:10.1038/s41598-017-03590-3
22. You L, Wu W, Wang X, et al. The role of hypoxia-inducible factor 1 in tumor immune evasion. Med Res Rev. 2021;41:1622–1643. doi:10.1002/med.21771
23. Gao X, Chen Y, Chen M, et al. Identification of key candidate genes and biological pathways in bladder cancer. PeerJ. 2018;6:e6036. doi:10.7717/peerj.6036
24. Herberth M, Koethe D, Cheng TM, et al. Impaired glycolytic response in peripheral blood mononuclear cells of first-onset antipsychotic-naive schizophrenia patients. Mol Psychiatry. 2011;16:848–859. doi:10.1038/mp.2010.71
25. Levey DF, Polimanti R, Cheng Z, et al. Genetic associations with suicide attempt severity and genetic overlap with major depression. Transl Psychiatry. 2019;9:22. doi:10.1038/s41398-018-0340-2
26. Marie-Cardine A, Hendricks-Taylor LR, Boerth NJ, et al. Molecular interaction between the Fyn-associated protein SKAP55 and the SLP-76-associated phosphoprotein SLAP-130. J Biol Chem. 1998;273:25789–25795. doi:10.1074/jbc.273.40.25789
27. Raab M, Strebhardt K, Rudd CE. Immune adaptor SKAP1 acts a scaffold for Polo-like kinase 1 (PLK1) for the optimal cell cycling of T-cells. Sci Rep. 2019;9:10462. doi:10.1038/s41598-019-45627-9
28. Smith X, Taylor A, Rudd CE. T-cell immune adaptor SKAP1 regulates the induction of collagen-induced arthritis in mice. Immunol Lett. 2016;176:122–127. doi:10.1016/j.imlet.2016.04.007
29. Raab M, Lu Y, Kohler K, et al. LFA-1 activates focal adhesion kinases FAK1/PYK2 to generate LAT-GRB2-SKAP1 complexes that terminate T-cell conjugate formation. Nat Commun. 2017;8:16001. doi:10.1038/ncomms16001
30. Umehara H, Nakamura M, Nagai M, et al. Correction to: positional cloning and comprehensive mutation analysis of a Japanese family with lithium-responsive bipolar disorder identifies a novel DOCK5 mutation. J Hum Genet. 2021;66:345. doi:10.1038/s10038-020-00856-z
31. Simicek M, Lievens S, Laga M, et al. The deubiquitylase USP33 discriminates between RALB functions in autophagy and innate immune response. Nat Cell Biol. 2013;15:1220–1230. doi:10.1038/ncb2847
32. Mantovani A, Balkwill F. RalB signaling: a bridge between inflammation and cancer. Cell. 2006;127:42–44. doi:10.1016/j.cell.2006.09.019
33. Fei Q, Bai X, Lin J, et al. Identification of aberrantly expressed long non-coding RNAs in postmenopausal osteoporosis. Int J Mol Med. 2018;41:3537–3550.
34. Ittermann T, Volzke H, Baumeister SE, et al. Diagnosed thyroid disorders are associated with depression and anxiety. Soc Psychiatry Psychiatr Epidemiol. 2015;50:1417–1425. doi:10.1007/s00127-015-1043-0
35. Bortolato B, Hyphantis TN, Valpione S, et al. Depression in cancer: the many biobehavioral pathways driving tumor progression. Cancer Treat Rev. 2017;52:58–70. doi:10.1016/j.ctrv.2016.11.004
36. Kalra G, Gill S, Tang TS. Depression and Diabetes Distress in South Asian Adults Living in Low- and Middle-Income Countries: a Scoping Review. Can J Diabetes. 2020;44:521–529 e1. doi:10.1016/j.jcjd.2020.06.007
37. Meng R, Yu C, Liu N, et al. Association of Depression With All-Cause and Cardiovascular Disease Mortality Among Adults in China. JAMA Netw Open. 2020;3:e1921043. doi:10.1001/jamanetworkopen.2019.21043
38. He S, Mao X, Lei H, et al. Peripheral Blood Inflammatory-Immune Cells as a Predictor of Infertility in Women with Polycystic Ovary Syndrome. J Inflamm Res. 2020;13:441–450. doi:10.2147/JIR.S260770
39. Xu C, Sui S, Shang Y, et al. The landscape of immune cell infiltration and its clinical implications of pancreatic ductal adenocarcinoma. J Adv Res. 2020;24:139–148. doi:10.1016/j.jare.2020.03.009
 © 2021 The Author(s). This work is published and licensed by Dove Medical Press Limited. The full terms of this license are available at https://www.dovepress.com/terms.php and incorporate the Creative Commons Attribution - Non Commercial (unported, v3.0) License.
By accessing the work you hereby accept the Terms. Non-commercial uses of the work are permitted without any further permission from Dove Medical Press Limited, provided the work is properly attributed. For permission for commercial use of this work, please see paragraphs 4.2 and 5 of our Terms.
© 2021 The Author(s). This work is published and licensed by Dove Medical Press Limited. The full terms of this license are available at https://www.dovepress.com/terms.php and incorporate the Creative Commons Attribution - Non Commercial (unported, v3.0) License.
By accessing the work you hereby accept the Terms. Non-commercial uses of the work are permitted without any further permission from Dove Medical Press Limited, provided the work is properly attributed. For permission for commercial use of this work, please see paragraphs 4.2 and 5 of our Terms.