")
Back to Journals » International Journal of General Medicine » Volume 15
Identification of Gefitinib Resistance-Related lncRNA-miRNA-mRNA Regulatory Networks and Corresponding Prognostic Signature in Patients with Lung Adenocarcinoma
Authors Wang T, Wu Z , Li S, Chen Z, Chen Y, Yang Z
Received 30 April 2022
Accepted for publication 1 September 2022
Published 11 September 2022 Volume 2022:15 Pages 7155—7168
DOI https://doi.org/10.2147/IJGM.S369718
Checked for plagiarism Yes
Review by Single anonymous peer review
Peer reviewer comments 6
Editor who approved publication: Dr Scott Fraser
Taoli Wang,* Zhulin Wu,* Shiguang Li, Zhong Chen, Yiqi Chen, Zhenjiang Yang
Department of Oncology, The Fourth Clinical Medical College of Guangzhou University of Chinese Medicine, Shenzhen, People’s Republic of China
*These authors contributed equally to this work
Correspondence: Zhenjiang Yang; Taoli Wang, Department of Oncology, The Fourth Clinical Medical College of Guangzhou University of Chinese Medicine, Shenzhen, People’s Republic of China, Tel +86-755-23612697, Email [email protected]; [email protected]
Purpose: To identify and characterize gefitinib resistance-related (GefR-related) lncRNAs and construct a prediction model for lung adenocarcinoma (LUAD).
Methods: Differential expression analysis between PC9 and gefitinib-resistant PC9 (PC9GR) cell samples was performed to screen GefR-related lncRNAs and mRNAs based on the GSE34228 dataset. These lncRNAs, mRNAs, and their corresponding microRNAs (miRNAs) were used to construct the GefR-related network and PPI networks. Functional enrichment analyses were conducted using the STRING database. A prognostic signature was developed using the TCGA dataset. The reliability of the signature was tested using the Kaplan–Meier method and ROC curve. Lastly, the FZD4-associated ceRNA subnetwork was selected to confirm the in vitro expressions of the GefR-related lncRNAs using RT-qPCR assay.
Results: A GefR-related ceRNA network that consists of 35 miRNAs, 26 lncRNAs, and 179 mRNAs was constructed. Then, 20 hub genes were screened from the targeted mRNAs of the constructed PPI network, and enrichment analysis identified relevant enriched pathways. We also constructed a prognostic signature for LUAD based on nine mRNAs in the GefR-related ceRNA network. The 9-mRNA signature was an independent predictor of LUAD, the AUC produced by ROC analysis showed a good predictive power of the model, and Kaplan–Meier analysis showed poorer outcomes in the high-risk group, relative to the low-risk group. Lastly, MIR137HG and ZNF295-AS1 levels were found to be associated with gefitinib resistance and exerted their functions through the ceRNA mechanism.
Conclusion: We established a prognostic signature and identified two lncRNAs (MIR137HG and ZNF295-AS1) with potential significant roles in gefitinib resistance.
Keywords: ceRNA, lncRNA, prognostic signature, EGFR TKIs, NSCLC, lung adenocarcinoma
Introduction
The pathogenesis of lung adenocarcinoma (LUAD) is driven by epidermal growth factor receptor (EGFR) mutations.1,2 Gefitinib, a first-generation, selective EGFR tyrosine kinase inhibitor (TKI), has effectively replaced chemotherapy as a first-line treatment for patients with advanced-LUAD carrying activating EGFR mutations.3–5 Although the response rate of gefitinib therapy is initially impressive, most patients ultimately develop gefitinib resistance, leading to poor outcomes. Presently, the molecular mechanisms underlying gefitinib resistance in LUAD remain unclear. Thus, it is necessary to explore and clarify the underlying mechanism of gefitinib resistance to improve the patients’ treatment outcomes and survival.
Long non-coding RNAs (lncRNAs) belong to non-coding RNAs containing over 200 nucleotides.6 Bioinformatics investigations on lncRNAs are one of the recent hot topics in oncological research. Competing endogenous RNA (ceRNA) was shown to be a critical mechanism of lncRNA-mediated regulation, via which lncRNAs were found to function as sponges for microRNAs (miRNAs) to decrease the expressions of miRNAs, resulting in the increased translational activity of targets of miRNAs.7 Previous research demonstrated that lncRNAs interacted with miRNAs through ceRNA mechanisms and played critical regulatory roles in tumorigenesis, tumor development, and drug resistance.8 Although the roles of lncRNAs on the development of NSCLC have been widely studied,9 the underlying mechanisms via which lncRNAs are involved in gefitinib resistance remain poorly understood. Moreover, the lncRNA-correlated ceRNA regulatory network of gefitinib resistance has not been fully clarified.
We developed a ceRNA network of gefitinib resistance via a series of bioinformatics analyses, established a prognostic signature using target mRNAs in the gefitinib resistance-associated ceRNA network, and performed in vitro experimental analysis to establish lncRNA expressions in ceRNA.
Materials and Methods
Data Collection and Preprocessing
The gene expression profiles between gefitinib-sensitive LUAD cells and -resistant LUAD cells were downloaded from the Gene Expression Omnibus (GEO) website (www.ncbi.nlm.nih.gov/geo) under the accession number GSE34228.10 This dataset included the PC9 LUAD cell line and its derivative cell line, the gefitinib-resistant (GefR) PC9 cell line (PC9GR). The PC9 cells and PC9GR cells were separately classified into four groups: the untreated group, EGF treatment group, gefitinib treatment group, and gefitinib and EGF treatment group. Then, 52 untreated samples, including 26 PC9 (gefitinib-sensitive) and 26 PC9GR (acquired gefitinib-resistant) cell samples, were selected for analysis.
Microarray Probe Annotation
Reannotation of microarray probes was performed to identify new transcripts. The Agilent-014850 Whole Human Genome Microarray probes in the dataset were reannotated based on a previously described method.11 Briefly, using the Perl software (https://www.perl.org/, version 5.30.0), sequence data format obtained from the GEO database (https://www.ncbi.nlm.nih.gov/geo/query/acc.cgi?acc=GPL4133) was transformed to FASTA format. Then, human genomes and associated annotation files were acquired from the GENCODE database (https://www.gencodegenes.org), and sequence alignment was performed using the NCBI-blast software (version 2.13.0). Moreover, the probe matrix file was transformed to the gene symbol matrix file, after which the Perl software was used to classify the genes as lncRNA or mRNA. Probes that were mapped to both protein‐coding genes and lncRNAs were eliminated. In cases where multiple probes were mapped to the same gene, the median value was calculated as a representative of expressions of that gene. The reannotation approach identified the gene expression profiles of 17,417 mRNAs and 1286 lncRNAs.
Differential Expression Analysis of mRNA and lncRNAs
Differential expression analyses between the 26 PC9 and 26 PC9GR cell samples were conducted using limma (https://bioconductor.org/packages/release/bioc/html/limma.html)12 in R (version 4.1.0). Adjusted p-value <0.05 and |log fold change (FC) |≥1 were considered the thresholds for obtaining differentially expressed mRNAs (DE-mRNAs) and differentially expressed lncRNAs (DE-lncRNAs). Heatmaps and volcano plots were constructed using “gplots” in R.
Establishment of GefR-Related lncRNA-miRNA-mRNA ceRNA Network
The GefR-related lncRNA-miRNA-mRNA competing endogenous RNA (ceRNA) network was created as follows: 1) The interacting miRNAs were identified to match the DE-lncRNAs from the above analysis using the mircode database (http://www.mircode.org/).13 2) Putative interactions between miRNA-mRNA were obtained from the miRDB (http://mirdb.org/),14 TargetScan (http://www.targetscan.org/),15 and miRTarBase (https://mirtarbase.cuhk.edu.cn/)16 databases. The ceRNA network was built using only mRNAs included in all three databases and overlapping with the DE-mRNAs. 3) To visualize interaction relationships, the ceRNA network was constructed using the Cytoscape tool (Version 3.8.2).
Construction of the PPI Network and Hub Gene Identification
The mRNAs in the ceRNA network are candidate target mRNAs, which were used to develop the PPI network using STRING (https://string-db.org/), a database for predicting interactions between and among functional proteins using gene symbols. The PPI network was generated with an interaction score of medium confidence >0.4. Highly interacting hub gene clusters in the STRING PPI network were recognized using the CytoHubba algorithm, a plug-in of Cytoscape software.
GO/KEGG Enrichment Analysis
To investigate the biological function dominated by the ceRNA network, functional annotations for the mRNAs in the ceRNA network were determined by GO and KEGG pathways analyses to infer the roles of candidate mRNAs in the GefR-related ceRNA network. Analyses were done using “GOplot” and “clusterProfiler” in R (version 4.1.0). p < 0.05 in both GO and KEGG analyses denoted significance.
Collection of RNA-Seq and Clinical Data of TCGA-LUAD
Transcriptome profiling (RNA-seq) of FPKM (fragments per kilobase per million) data, including 535 tumor samples and 59 normal samples, as well as the clinical data for LUAD, were acquired from The Cancer Genome Atlas (TCGA, https://tcgadata.nci.nih.gov/tcga/; LUAD). To accurately distinguish mRNAs and lncRNAs, Gene Transfer Format (GTF) files were acquired from Ensembl (http://asia.ensembl.org). Only the patients with complete clinical data, including information on survival time and status, pathological stage, age, sex, as well as TNM stages, were used for analysis. In total, 486 LUAD tumor samples were selected for survival analysis. The median (interquartile range) overall survival time for all LUAD patients was 632 (415–1071.75) days. The clinic-pathological features for LUAD patients are presented in Supplementary Table S1. Since clinical and RNA-seq data were directly obtained from TCGA, the waived ethics approval was approved by the Ethics Committee of the Fourth Clinical Medical College of Guangzhou University of Chinese Medicine.
Establishment and Verification of GefR-Related mRNAs Prognostic Signature
The clinical data target mRNAs expression matrix was matched to build a reliable model for prognostic prediction. A Cox proportional hazard model was used for univariate and multivariate analyses using the “survival” package in R software, and potential prognosis-related mRNAs in ceRNA network with p < 0.05 in univariate analysis subjected to multivariate Cox regression analysis, which then determined the prognostic value of specific gene signatures. The stepwise regression approach was implemented to include and exclude variables. The risk scores were calculated based on the GefR-related mRNAs prognostic risk score using the formula:
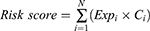
In which, “N” stands for the number of prognostic genes, “Expi” represents the expression of gene profile, and “Ci” means the estimated regression coefficient of genes determined by multivariable Cox analysis.17 Moreover, we further validated the reliability and accuracy of the risk score-related signature. According to the median value of risk score, LUAD patients were classified into high- and low-risk groups, and the Kaplan–Meier approach was conducted to compare the overall survival of the two groups. In addition, univariate and multivariate Cox analyses based on clinical characteristics including age, sex, smoking status, and pathological stage in patients with LUAD to determine whether the risk score model was an independent prognostic factor. The receiver operating characteristic curves (ROC) and its area under the curve (AUC) values were performed to evaluate the specificity and sensitivity of the signature using the “ROC” package in R software.
Construction of Prognosis-Associated ceRNA Regulatory Subnetwork
Prognostic values for the nine GefR-related mRNAs in the prognostic signature were further determined in TCGA LUAD patients via Kaplan–Meier analysis. A prognosis-associated subnetwork was built using the nine mRNAs identified via the Cox regression model and Kaplan–Meier method. The intersection of hub genes in the PPI network and the nine prognosis-associated mRNAs was taken to identify critical genes and regulatory subnetwork. The intersection set was used for key ceRNA regulatory subnetwork construction and further analyses.
Cell Culture and Confirmation of Induced PC9GR Drug Resistance
Gefitinib-sensitive cells (PC9) were purchased from Chinese Type Culture Collection (CTCC). Cells were grown in a DMEM medium (Hyclone, USA) with 10% fetal bovine serum (PAN, USA). The PC9 cells derived from LUAD were sensitive to TKIs (ie, gefitinib and erlotinib). To obtain the PC9GR cells, PC9 cells were cultured with a stepwise increase in the concentrations of gefitinib (Sigma-Aldrich, St Louis, USA) from 5 nM to 5 μM for 6 months. In addition, PC9GR cells were cultured in a medium containing 10 nM of gefitinib to maintain drug resistance. The authentication of both PC9GR and PC9 cell lines was performed through the STR test.
The PC9GR and PC9 cells were seeded into 96-well culture plates with 5000 cells/well. Following incubation of PC9GR and PC9 cells with varying gefitinib doses (0, 0.01, 0.1, 1, 5, 10, 20, and 40 μM) for 48 hours, cell viability was monitored via MTT (Beyotime, China) following the manufacturer’s instruction, and the absorbance value was measured at 450 nm. The concentrations of gefitinib that produced 50% inhibitory concentration (IC50) were used to determine the drug resistance index (RI) RI = (IC50 for PC9GR cells) (IC50 for PC9 cells).
Reverse Transcription-Quantitative PCR (RT-qPCR) Assay
The RT-qPCR assay was done to confirm the expressions of DE-lncRNAs in the key ceRNA subnetwork between PC9 and PC9GR cells. Total RNA was isolated from PC9 and PC9/GR cells using the Trizol reagent (Takara, Japan) as instructed by the manufacturer. Synthesis of cDNA from extracted RNA was performed using the Primescript RT Reagent Kit (Takara, Japan). RT-qPCR was subsequently conducted using the TB Green Premix Ex Taq II Kit (Takara, Japan) in conjunction with a CFX96 Real-time PCR System (bio-rad, Hercules, CA, USA). The PCR conditions were as follows: 95°C for 5 min, followed by 40 cycles of 95°C for 15 sec and 60°C for 1 min. The primers used in this assay are shown in Supplementary Table S2. DE-lncRNAs levels were normalized to those of β-actin, the internal reference. Relative DE-lncRNA expressions were determined using the 2−ΔΔCq method.
Statistical Analysis
The R software (version 4.1.0) was used for analysis. Data processing was implemented in the Perl programming language (Version 5.30.0). Results are expressed as mean ± SD (standard deviation). Student’s t-test was performed to measure the difference between the two groups. p < 0.05 was used to determine significance.
Results
Differentially Expressed lncRNAs and mRNAs Between Gefitinib-Sensitive and -Resistant NSCLC Cell Lines (GSE34228)
Figure 1 shows a schematic illustration of this study. In total, 131 lncRNAs and 1764 mRNAs were differentially expressed between gefitinib-resistant and resistant NSCLC cell lines. Among them, 868 mRNAs and 61 lncRNAs were elevated, while 896 mRNAs and 70 lncRNAs were suppressed. Volcano plots and heatmaps were used for the visualization of differential lncRNA and mRNA expressions between the two cell lines (Figure 2A–D). The top 20 DE-lncRNAs and 50 DE-mRNAs are displayed in the heatmaps of Figure 2A and C, and the volcano plots are used for visualizing the DE-mRNAs and DE-lncRNAs (Figure 2B and D). In addition, the top 20 DE-mRNAs and DE-lncRNAs with their names, log2FC values, and P-values are listed in Supplementary Table S3.
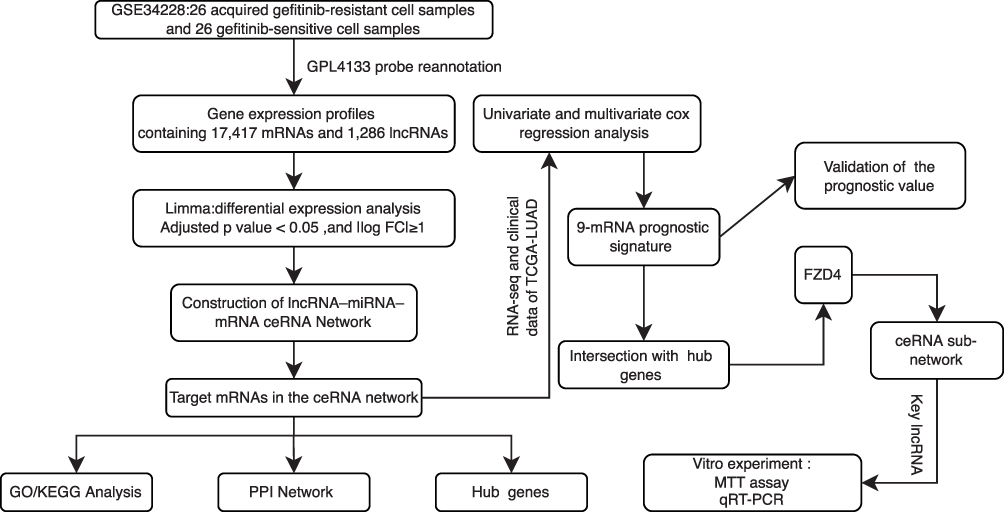 |
Figure 1 Flowchart illustrating the overall study process. |
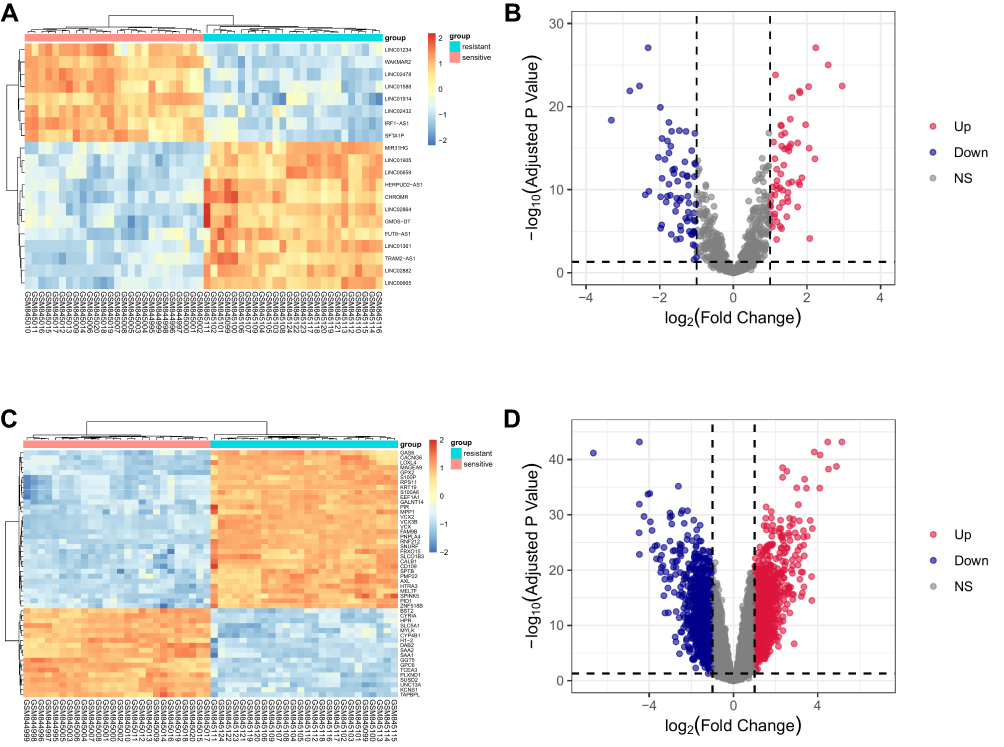 |
Figure 2 Heatmap and volcano plots for DE-mRNAs and lncRNAs in GSE34228. (A) Heatmap of the top 20 DE-lncRNAs. (B) Volcano plot for DE-lncRNAs. (C) Heatmap of the top 50 DE-mRNAs. (D) Volcano plot for DE-mRNAs. |
Construction of GefR-Related lncRNA-miRNA-mRNA ceRNA Regulatory Network and PPI Network
Screening of mRNAs and lncRNAs targeted by miRNAs was based on interactions among DE-lncRNAs, DE-mRNAs, and miRNAs described above. DE-mRNAs and DE-lncRNAs that shared common miRNAs were used to establish the ceRNA network (Figure 3A). A network containing 35 miRNAs, 26 lncRNAs, and 179 mRNAs, was obtained (Supplementary Table S4). This ceRNA network was also composed of 239 pairs of miRNA-lncRNA and 296 pairs of miRNA-mRNA (Supplementary Table S5). A PPI network was built to assess the interactions between targeted mRNAs in the GefR-related ceRNA network. The PPI network of target mRNAs consisted of 31 nodes and 78 edges (Figure 3B), and hub gene identification in the PPI network was performed using CytoHubba in Cytoscape. In addition, the top 20 hub genes (ie, STAT3, KAT2B, FOS, GSK3B, EP300, UBB, FZD4, etc) with the number of adjacent nodes ≥5 were obtained (Figure 3C and D) as they were shown to have potentially critical roles in gefitinib resistance.
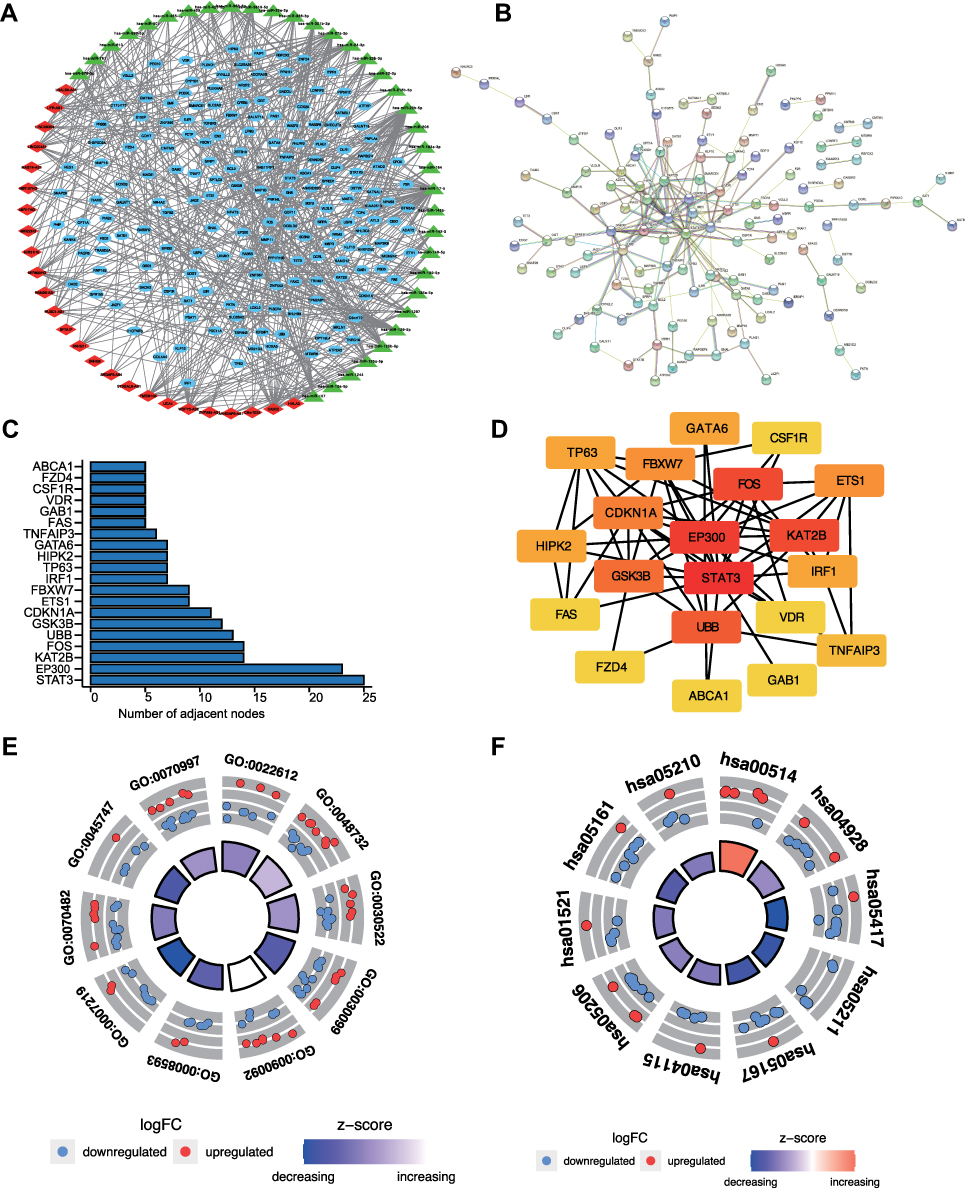 |
Figure 3 Establishment of GefR-related lncRNA-miRNA-mRNA ceRNA network and functional enrichment analyses of target mRNAs. (A) GefR-related lncRNA-miRNA-mRNA ceRNA network (blue oval nodes: mRNAs; red diamond nodes: lncRNAs; green triangle: miRNA). (B) PPI network of target mRNAs. (C) Bar graph for numbers of adjacent nodes of the top target mRNAs in the PPI network. (D) Network of the top 20 hub genes identified by CytoHubba. (E) The top 10 significant GO terms (E) and KEGG pathways (F) enriched by the target mRNAs. Red color represents upregulation, while blue represents downregulation. |
The GO and KEGG analyses were conducted for the target mRNAs to establish the enriched biological functions and signaling pathways. The top 10 GO terms for biological processes (based on the obtained p-values) are shown in Supplementary Table S6 and Figure 3E, and are comprised of gland morphogenesis (GO:0022612), gland development (GO:0048732), intracellular receptor signaling pathway (GO:0030522), myeloid cell differentiation (GO:0030099), regulation of transmembrane receptor protein serine/threonine kinase signaling pathway (GO:0090092), regulation of Notch signaling pathway (GO:0008593), etc. The top 10 KEGG signaling pathways with p < 0.05 are presented in Supplementary Table S7 and Figure 3F, and are comprised of Other types of O-−glycan biosynthesis (hsa00514), Parathyroid hormone synthesis, secretion and action (hsa04928), Lipid and atherosclerosis (hsa05417), Renal cell carcinoma (hsa05211), EGFR tyrosine kinase inhibitor resistance (hsa01521), p53 signaling pathway (hsa04115), Kaposi sarcoma−associated herpesvirus infection (hsa05167), MicroRNAs in cancer (hsa05206), etc. These data provided us with a new perspective on gefitinib resistance in LUAD.
Prognostic Signature Based on Target mRNAs in GefR-Related ceRNA Network
Using TCGA-LUAD data, prognostic analysis was conducted on target mRNAs in the GefR-related ceRNA network. Univariate Cox analysis preliminarily identified 28 mRNAs as significant prognostic factors based on p < 0.05 (Supplementary Table S8). Multivariate Cox regression analysis indicated that nine mRNAs were independent prognostic factors: FSCN1, DCBLD2, KLF10, STK17B, GPR155, FZD4, LBR, PLXND1, and S100P, which were then used to build the prognosis risk score model (Supplement Table S7). The prognostic risk score model for prediction of overall survival was determined as: Risk score = expFSCN1*0.007 + expDCBLD2*0.007 + expKLF10*0.032 + expSTK17B*-0.021 + expGPR155*-0.220 + expFZD4*0.025 + expLBR*0.029 + expPLXND1*-0.014 + expS100P *0.001 (Supplementary Table S9).
The performance of the 9-mRNA prediction signature was tested. Kaplan–Meier survival analysis was done for comparisons of overall survival of the low- and high-risk subgroups, which revealed that OS for the high-risk subgroup was markedly shorter than the low-risk group (p<0.001) (Figure 4A). In Figure 4B, ROC analysis shows that the AUC value for risk score, stage, gender, and age was 0.781, 0.707, 0.418, and 0.527, respectively, indicating a good discriminative ability of the risk score. Moreover, the risk score distribution plot showed that the low-risk group had lower risk scores, relative to the high-risk group, and the scatter plot demonstrated that the mortality rate for LUAD patients increased with increased risk score (Figure 4C). Expressions of the 9 prognosis-correlated target mRNAs between low- and high-risk subgroups are displayed in the heatmap of Figure 4D.
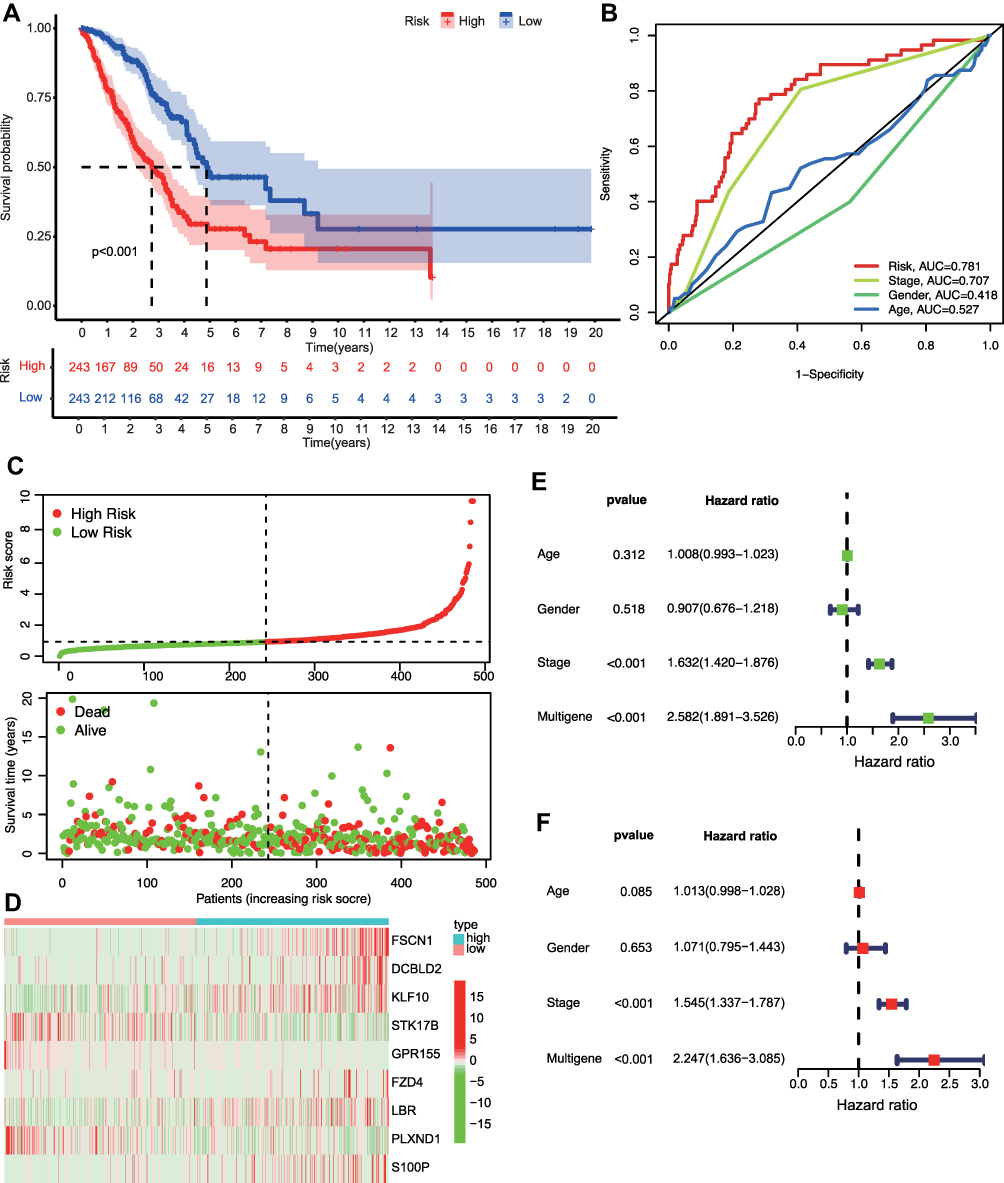 |
Figure 4 Construction and validation of the GefR-related mRNAs prognostic risk score model. (A) Kaplan-Meier survival curves of the TCGA-LUAD patients revealed that the OS rate was markedly poorer in the high-risk subgroup, relative to the low-risk subgroup. (B) Multivariate receiver operating characteristic curves showed that risk score had good predictive accuracy for prognosis (the value of AUC=0.781). (C) The top row (risk score distribution plot) shows the risk score distribution for the high-risk and low-risk score subgroups. The bottom row (scatter plot) shows the TCGA LUAD patients’ distribution and survival status. (D) Heatmap displaying the nine prognostic-correlated mRNAs expression in the high- and low-risk subgroups of the TCGA-LUAD patients. (E) The nine mRNAs-based risk score model with age, gender, and TNM stage was assessed in univariate Cox regression analysis. (F) Multivariate Cox regression analysis showing the nine mRNAs-based risk score model as an independent prognostic factor. |
To explore the combinative prognostic significance of the 9-mRNA prognostic signature with clinical variables, a Cox proportional hazards model integrating the clinical features (including age, gender, and TNM stage) and signature was constructed. Subsequent univariate (Figure 4E) and multivariate Cox analyses (Figure 4F) verified that the 9 mRNAs-based risk score model was an independent predictor of OS (HR: 2.247, 95% CI: 1.636–3.085, p <0.001).
Survival Analysis of Nine mRNAs in the Prognostic Signature and Construction of Prognosis-Associated ceRNA Regulatory Subnetwork
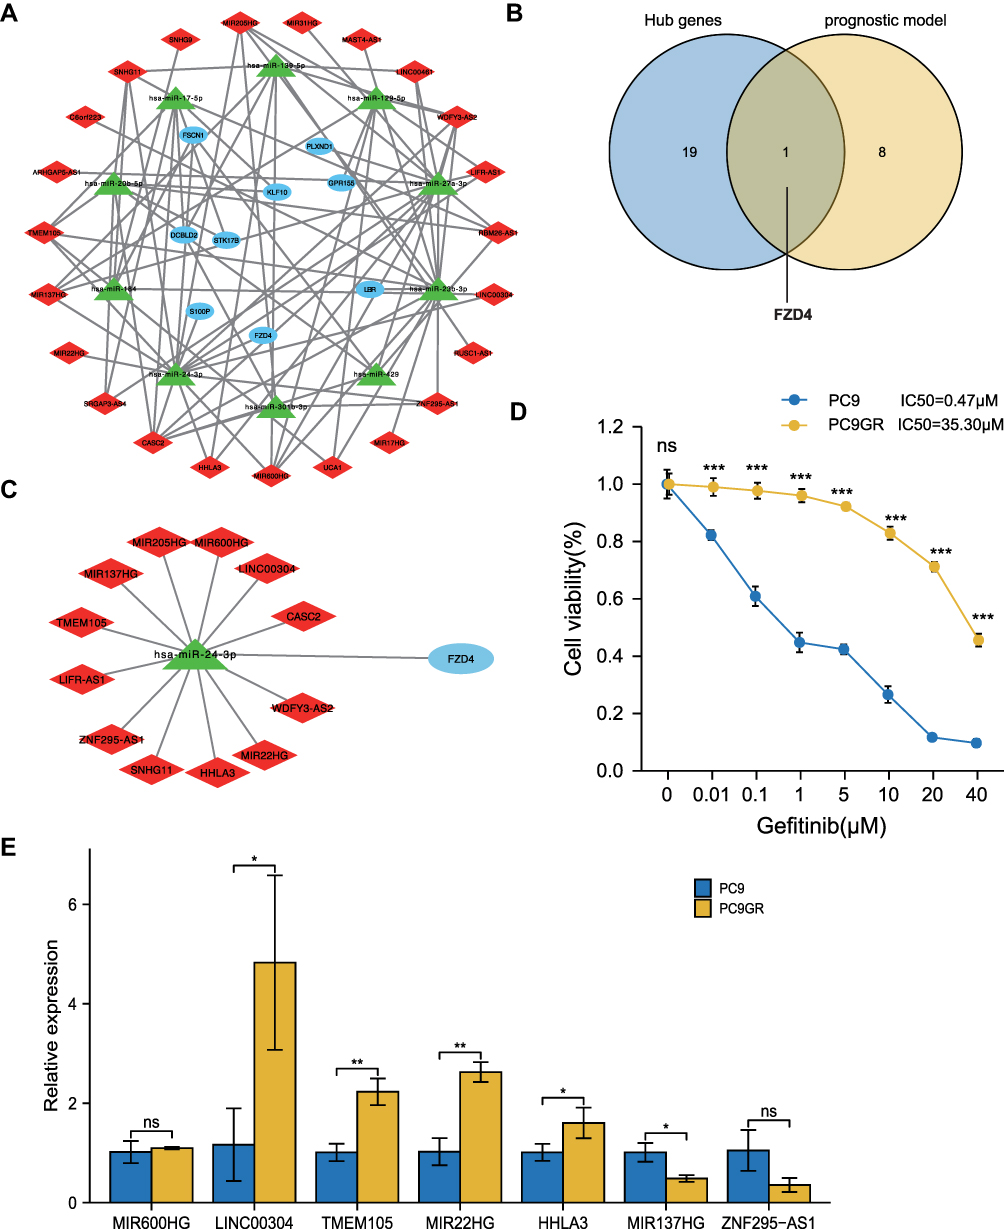
Using Kaplan–Meier survival analysis, prognostic values for the nine GefR-related mRNAs for OS were further determined in the TCGA-LUAD patients, which were shown to be statistically significant (Figure 5A–I). Low expressions of FSCN1, DCBLD2, KLF10, LBR, and S100P were associated with better survival, whereas low expressions of STK17B, GPR155, FZD4, and PLXND1 were associated with poorer survival. Moreover, the prognosis-related lncRNA-miRNA-mRNA ceRNA regulatory subnetwork was established, which contained 23 lncRNAs, 10 miRNAs, and 9 targeted mRNAs (Figure 6A). By intersecting the hub gene with the nine prognosis-associated genes, FZD4 was found to be an essential gene (Figure 6B). Thus, the FZD4-correlated ceRNA subnetwork was used for further analysis, and the differential expressions of lncRNAs in the FZD4-associated ceRNA subnetwork between gefitinib-resistant and the gefitinib-sensitive LUAD cell lines were also analyzed using the dataset GSE34228. As shown in Figure 6C, the FZD4-associated ceRNA subnetwork included 1 mRNA (FZD4), 1 miRNA (has-miR-24-3p), and 12 lncRNAs (LIFR-AS1, TMEM105, MIR137HG, MIR205HG, MIR600HG, LINC00304, CASC2, WDFY3-AS2, MIR22HG, HHLA3, SNHG11, and ZNF295-AS1), and the expressions of FZD4, LINC00304, MIR600HG, MIR137HG, TMEM105, ZNF295-AS1, HHLA3, and MIR22HG were downregulated, while those of MIR205HG, LIFR-AS1, SNHG11, WDFY3-AS2, and CASC2 were upregulated in the gefitinib-resistant LUAD cell line.
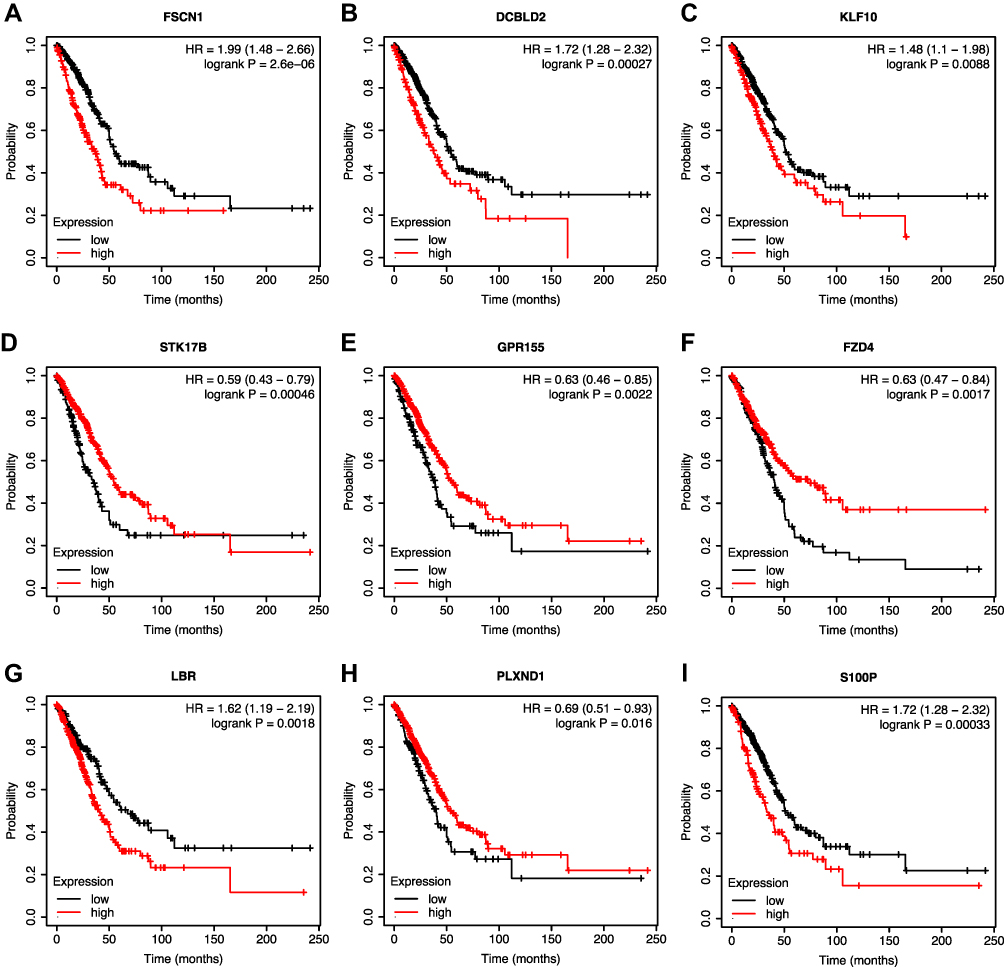 |
Figure 5 KM survival analysis of nine mRNAs involved in the prognostic signature. (A–I) Survival curves of the nine mRNAs. High expressions of FSCN1 (A), DCBLD2 (B), KLF10 (C), LBR (G), and S100P (I) were associated with worse survival, whereas low expressions of STK17B (D), GPR155 (E), FZD4 (F), and PLXND1 (H) were correlated with worse survival. |


Validation of Gefitinib Resistance in PC9GR Cell Lines
The LUAD cell line with acquired resistance to gefitinib, PC9GR, was derived from the PC9 cell line through continuous exposures to stepwise increasing concentrations of gefitinib over 6 months. The gefitinib sensitivity of PC9GR or PC9 cell line was verified via MTT assay. As shown in Figure 6D, after 48h of gefitinib exposure, the IC50 values were 0.47 μM and 35.30 μM in the PC9 and PC9GR cells, respectively, indicating that the PC9GR cell line was highly resistant to gefitinib, relative to the PC9 cell line.
Validation of DE-lncRNAs Between PC9 and PC9GR Cell Lines
According to the theory of ceRNA, members in the ceRNA network compete to bind to the same miRNA response elements to regulate each other’s expression. Further, different RNA transcripts compete with each other to combine with shared miRNA, resulting in negative regulation of miRNA-mediated gene silencing.18 Consequently, lncRNA expressions should be comparable to those of mRNAs. In the FZD4-associated ceRNA subnetwork, the 7 lncRNAs, including MIR600HG, LINC00304, TMEM105, MIR22HG, HHLA3, MIR137HG, and ZNF295-AS1, showed the same pattern of expression as FZD4. To further verify the ceRNA model, we selected the 7 downregulated lncRNAs, which were validated by RT-qPCR. In Figure 6E, MIR137HG and ZNF295-AS1 levels were found to be in tandem with findings from the GSE34228 dataset. Although findings from LINC00304, TMEM105, MIR22HG, and HHLA3 were statistically homogeneous, the expressions of these four lncRNAs exhibited the opposite pattern.
Discussion
Primary LUAD contributes to cancer-associated death globally and accounts for the most commonly diagnosed subtype among NSCLC. In recent years, molecular targeted therapy has been broadly accepted for LUAD, and EGFR-TKIs, including gefitinib, are the standard of care for patients with EGFR-mutant LUAD. Although the initial efficacy of gefitinib is impressive, most patients eventually develop gefitinib resistance, leading to treatment failure and poor prognosis.19 Further, the molecular mechanisms underlying gefitinib resistance in LUAD are still unclear. Thus, elucidating the underlying molecular mechanisms involved in gefitinib resistance is urgently required.
LncRNAs are involved in the ceRNA network, regulating the progression of malignancies.20 Nevertheless, systematic studies for ceRNA networks in gefitinib resistance have been limited. Thus, we evaluated the DE-lncRNAs and DE-mRNAs associated with GefR of LUAD, and intersection analysis was performed to screen candidate lncRNAs, miRNAs, and mRNAs for constructing a GefR-Related lncRNA-miRNA-mRNA ceRNA network. Then, corresponding PPI networks were built to investigate the possible underlying mechanisms based on mRNAs in the ceRNA network, and a GefR-related mRNAs prognostic signature was also constructed, which was shown to be a reliable prognostic model for the prediction of the outcomes of LUAD patients. The intersection of hub genes in the PPI network and the prognosis-associated mRNAs were used to establish the critical regulatory subnetwork, some of which were validated by the RT-qPCR experiment. Moreover, target genes in the ceRNA network were enriched based on GO and KEGG enrichment analyses to confirm their biological functions and downstream pathways, explaining the potential mechanism related to gefitinib resistance.21,22
Preliminary analysis showed the complex relationships between lncRNAs, miRNAs, and mRNAs. The PPI findings indicated that the ceRNA network nodes correlated with gefitinib resistance or LUAD. For instance, it was reported that the STAT3-targeted inhibitor could sensitize resistant cells to gefitinib by depleting STAT3 activity and suppressing the STAT3/ZEB1 pathway.23 An EGFR-targeted antibody was found to exert increased cytotoxicity in both PC9 and PC9/GR cells by suppressing the activating the PI3K/Akt pathway and Myc as well as Fos expressions.24 Previous research showed that NSCLC cells could upregulate their levels of miR-223 expression through the Notch pathway, and miR-223 could regulate the EGFR-TKI (erlotinib) sensitivity in NSCLC cells by targeting FBXW7.25 Accumulating evidence supports the critical role of miRNAs in EGFR-TKIs resistance. Downregulation of miR‑506‑3p and upregulation of miR-181a contributed to gefitinib resistance.26,27 These results indicated that genes in the GefR-related network were involved in the regulation of gefitinib resistance.
To identify prognosis-associated genes among the differentially expressed genes, expressions of candidate target mRNAs and the equivalent clinical data were integrated. Further analyses of the ceRNA network identified nine prognostic-associated mRNAs, which were an independent prognostic factor for LUAD. In addition, the signature was associated with survival outcomes in LUAD. Overall, the proposed GefR-related mRNAs prognostic signature is a useful tool for determining the prognostic outcomes of LUAD patients.
To identify corresponding critical genes and the ceRNA subnetwork, the intersection of hub genes in the PPI network and the nine prognosis-associated mRNAs was performed. We also constructed the FZD4-associated ceRNA subnetwork, and seven lncRNAs were predicted to have the same expression pattern as FZD4. To verify the critical ceRNA subnetwork, we selected the seven downregulated lncRNAs to be validated by RT-qPCR and established that MIR137HG and ZNF295-AS1 expressions were identical to the prediction. FZD4 (frizzled homologue 4) is a transmembrane receptor that can transduce the Wnt signaling, with the dysregulation of the Wnt pathway-mediated cellular processes contributing to tumor development and tumor recurrence in NSCLC patients.28 It is reported that suppression of miR-3127-5p could promote the MET via activation of the Wnt/FZD4/β-catenin pathway, which is a promising therapeutic target for NSCLC metastasis.29 MIR137HG is the host gene of MIR137. The MIR137HG promoter is highly methylated in several malignancies, including colorectal cancer, malignant pleural mesothelioma, and oral squamous cell carcinoma.30 A study previously demonstrated that MIR137HG was correlated with several clinical features and survival outcomes of patients with muscle-invasive bladder cancer based on bioinformatics analysis and experimental validation.31 A previous lncRNA signature containing MIR137HG was also reported to be a reliable prognostic model for HCC patients.32 ZNF295-AS1 was also reported to be highly expressed in human epithelial ovarian cancer via microarrays and RT-qPCR.33 To date, few studies have investigated the correlation of these lncRNAs with gefitinib resistance. Our data identified novel molecular biomarkers that could be used in further research on gefitinib resistance.
There were several limitations associated with this study. First, most of our results were obtained from public database analysis and relied on bioinformatics tools. We only used one TCGA dataset to establish the GefR-related mRNAs prognostic signature, and external data should be used to further validate the proposed prognostic model. Besides, we only conducted a primary validation of lncRNAs levels in the FZD4-associated ceRNA subnetwork, and the effects of MIR137HG and ZNF295-AS1 on has-miR-24-3p and FZD4 expression should be further verified.
To sum up, this present study identified 26 lncRNAs, 35 miRNAs, and 179 mRNAs that could be related to gefitinib resistance. The established GefR-related mRNAs signature showed good predictive ability. Lastly, our results showed that the regulation of FZD4 expression by MIR137HG or ZNF295-AS1 might be completed through the ceRNA mechanism, while the comprehensive regulatory mechanism on underlying gefitinib resistance remains to be further studied.
Conclusion
We developed a GefR-related ceRNA network and prognostic signature and identified two promising lncRNAs, MIR137HG and ZNF295-AS1, associated with gefitinib resistance. The proposed prognostic signature demonstrated promising potential to be a prognostic marker and treatment target.
Abbreviations
NSCLC, non‐small cell lung cancer; LUAD, lung adenocarcinoma; ceRNA, competitive endogenous RNA; GEO, Gene Expression Omnibus; TCGA, The Cancer Genome Atlas; lncRNA, long non-coding RNA; miRNA, micro RNA; mRNA, messenger RNA; PPI, protein–protein interaction; GO, Gene Ontology; KEGG, Kyoto Encyclopedia of Genes and Genomes; ROC, receiver operating characteristic; AUC, area under the curve; OS, overall survival.
Data Sharing Statement
The datasets used and analyzed during the study are available from the corresponding author on reasonable request.
Ethical Approval Statement
TCGA and GEO belong to the public database in which the patients involved have obtained ethical approval. The waived ethics approval was approved by the Ethics Committee of the Fourth Clinical Medical College of Guangzhou University of Chinese Medicine (No. MC2022-001), and the publication of this study is in accordance with the Declaration of Helsinki.
Acknowledgments
The authors gratefully acknowledge the data provided by GEO and TCGA database used in this research.
Funding
This work was supported by Shenzhen Fundamental Research Program (No. JCYJ2019081280001770) and Guangdong Basic and Applied Basic Research Foundation (No. 2020A1515110039).
Disclosure
The authors report no conflicts of interest in this work.
References
1. Bray F, Ferlay J, Soerjomataram I, Siegel RL, Torre LA, Jemal A. Global cancer statistics 2018: GLOBOCAN estimates of incidence and mortality worldwide for 36 cancers in 185 countries. CA Cancer J Clin. 2018;68(6):394–424. doi:10.3322/caac.21492
2. Zhang T, Sun B, Zhong C, et al. Targeting histone deacetylase enhances the therapeutic effect of Erastin-induced ferroptosis in EGFR-activating mutant lung adenocarcinoma. Transl Lung Cancer Res. 2021;10(4):1857–1872. doi:10.21037/tlcr-21-303
3. Herbst RS, Morgensztern D, Boshoff C. The biology and management of non-small cell lung cancer. Nature. 2018;553(7689):446–454. doi:10.1038/nature25183
4. Bell DW, Lynch TJ, Haserlat SM, et al. Epidermal growth factor receptor mutations and gene amplification in non-small-cell lung cancer: molecular analysis of the IDEAL/INTACT gefitinib trials. J Clin Oncol. 2005;23(31):8081–8092. doi:10.1200/JCO.2005.02.7078
5. Petrelli F, Ferrara R, Signorelli D, et al. Immune checkpoint inhibitors and chemotherapy in first-line NSCLC: a meta-analysis. Immunotherapy. 2021;13(7):621–631. doi:10.2217/imt-2020-0224
6. Iyer MK, Niknafs YS, Malik R, et al. The landscape of long noncoding RNAs in the human transcriptome. Nat Genet. 2015;47(3):199–208. doi:10.1038/ng.3192
7. Bartonicek N, Maag JL, Dinger ME. Long noncoding RNAs in cancer: mechanisms of action and technological advancements. Mol Cancer. 2016;15(1):43. doi:10.1186/s12943-016-0530-6
8. de Oliveira JC, Oliveira LC, Mathias C, et al. Long non-coding RNAs in cancer: another layer of complexity. J Gene Med. 2019;21(1):e3065. doi:10.1002/jgm.3065
9. Gong Y, Zhu W, Sun M, Shi L. Bioinformatics analysis of long non-coding RNA and related diseases: an overview. Front Genet. 2021;12:813873. doi:10.3389/fgene.2021.813873
10. Nakata A, Yoshida R, Yamaguchi R, et al. Elevated beta-catenin pathway as a novel target for patients with resistance to EGF receptor targeting drugs. Sci Rep. 2015;5:13076. doi:10.1038/srep13076
11. Teng X, Yang T, Huang W, et al. Bioinformatics analysis for the identification of key genes and long non-coding RNAs related to bone metastasis in breast cancer. Aging. 2021;13(13):17302–17315. doi:10.18632/aging.203211
12. Ritchie ME, Phipson B, Wu D, et al. limma powers differential expression analyses for RNA-sequencing and microarray studies. Nucleic Acids Res. 2015;43(7):e47–e47. doi:10.1093/nar/gkv007
13. Jeggari A, Marks DS, Larsson E. miRcode: a map of putative microRNA target sites in the long non-coding transcriptome. Bioinformatics. 2012;28(15):2062–2063. doi:10.1093/bioinformatics/bts344
14. Chen Y, Wang X. miRDB: an online database for prediction of functional microRNA targets. Nucleic Acids Res. 2019;48(D1):D127–D131. doi:10.1093/nar/gkz757
15. Garcia DM, Baek D, Shin C, Bell GW, Grimson A, Bartel DP. Weak seed-pairing stability and high target-site abundance decrease the proficiency of lsy-6 and other microRNAs. Nat Struct Mol Biol. 2011;18(10):1139–1146. doi:10.1038/nsmb.2115
16. Huang H-Y, Lin Y-C-D, Li J, et al. miRTarBase 2020: updates to the experimentally validated microRNA–target interaction database. Nucleic Acids Res. 2019;48(D1):D148–D154.
17. Hu J, Yu H, Sun L, et al. Identification of an individualized metabolism prognostic signature and related therapy regimens in early stage lung adenocarcinoma. Front Oncol. 2021;11:650853. doi:10.3389/fonc.2021.650853
18. Wei C, Luo T, Zou S, et al. Differentially expressed lncRNAs and miRNAs with associated ceRNA networks in aged mice with postoperative cognitive dysfunction. Oncotarget. 2017;8(34):55901–55914. doi:10.18632/oncotarget.18362
19. Lu X, Zhang Y, Pan Y, Cao M, Zhou X, Zhang T. Overexpression of CTEN is associated with gefitinib resistance in non-small cell lung cancer. Oncol Lett. 2021;21(1):40. doi:10.3892/ol.2020.12301
20. Xia Y, Zhen L, Li H, et al. MIRLET7BHG promotes hepatocellular carcinoma progression by activating hepatic stellate cells through exosomal SMO to trigger Hedgehog pathway. Cell Death Dis. 2021;12(4):326. doi:10.1038/s41419-021-03494-1
21. Li G, Ma Y, Yu M, et al. Identification of hub genes and small molecule drugs associated with acquired resistance to gefitinib in non-small cell lung cancer. J Cancer. 2021;12(17):5286–5295. doi:10.7150/jca.56506
22. Kong X, Hu S, Yuan Y, et al. Analysis of lncRNA, miRNA and mRNA-associated ceRNA networks and identification of potential drug targets for drug-resistant non-small cell lung cancer. J Cancer. 2020;11(11):3357–3368. doi:10.7150/jca.40729
23. Liu Z, Ma L, Sun Y, Yu W, Wang X. Targeting STAT3 signaling overcomes gefitinib resistance in non-small cell lung cancer. Cell Death Dis. 2021;12(6):561. doi:10.1038/s41419-021-03844-z
24. Si Y, Pei X, Wang X, Han Q, Xu C, Zhang B. An anti-EGFR/anti- HER2 bispecific antibody with enhanced antitumor activity against acquired gefitinib-resistant NSCLC cells. Protein Pept Lett. 2021;28(11):1290–1297. doi:10.2174/0929866528666210930170624
25. Zhang H, Chen F, He Y, et al. Sensitivity of non-small cell lung cancer to erlotinib is regulated by the Notch/miR-223/FBXW7 pathway. Biosci Rep. 2017;37(3). doi:10.1042/BSR20160478
26. Ping W, Gao Y, Fan X, Li W, Deng Y, Fu X. MiR-181a contributes gefitinib resistance in non-small cell lung cancer cells by targeting GAS7. Biochem Biophys Res Commun. 2018;495(4):2482–2489. doi:10.1016/j.bbrc.2017.12.096
27. Zhu J, Tao L, Jin L. MicroRNA5063p reverses gefitinib resistance in nonsmall cell lung cancer by targeting Yes associated protein 1. Mol Med Rep. 2019;19(2):1331–1339. doi:10.3892/mmr.2018.9710
28. Lin J, Zandi R, Shao R, et al. A miR-SNP biomarker linked to an increased lung cancer survival by miRNA-mediated down-regulation of FZD4 expression and Wnt signaling. Sci Rep. 2017;7(1):9029. doi:10.1038/s41598-017-09604-4
29. Yang Y, Sun Y, Wu Y, et al. Downregulation of miR-3127-5p promotes epithelial-mesenchymal transition via FZD4 regulation of Wnt/beta-catenin signaling in non-small-cell lung cancer. Mol Carcinog. 2018;57(7):842–853. doi:10.1002/mc.22805
30. Wang C, Zhuang X, Xu J, et al. Variants of MIR137HG genes are associated with liver cancer risk in Chinese li population. Onco Targets Ther. 2020;13:1809–1818. doi:10.2147/OTT.S225669
31. Lyu L, Xiang W, Zhu JY, Huang T, Yuan JD, Zhang CH. Integrative analysis of the lncRNA-associated ceRNA network reveals lncRNAs as potential prognostic biomarkers in human muscle-invasive bladder cancer. Cancer Manag Res. 2019;11:6061–6077. doi:10.2147/CMAR.S207336
32. Sun JR, Kong CF, Xiao KM, Yang JL, Qu XK, Sun JH. Integrated analysis of lncRNA-mediated ceRNA network reveals a prognostic signature for hepatocellular carcinoma. Front Genet. 2020;11:602542. doi:10.3389/fgene.2020.602542
33. Ding Y, Yang DZ, Zhai YN, et al. Microarray expression profiling of long non-coding RNAs in epithelial ovarian cancer. Oncol Lett. 2017;14(2):2523–2530. doi:10.3892/ol.2017.6448
 © 2022 The Author(s). This work is published and licensed by Dove Medical Press Limited. The full terms of this license are available at https://www.dovepress.com/terms.php and incorporate the Creative Commons Attribution - Non Commercial (unported, v3.0) License.
By accessing the work you hereby accept the Terms. Non-commercial uses of the work are permitted without any further permission from Dove Medical Press Limited, provided the work is properly attributed. For permission for commercial use of this work, please see paragraphs 4.2 and 5 of our Terms.
© 2022 The Author(s). This work is published and licensed by Dove Medical Press Limited. The full terms of this license are available at https://www.dovepress.com/terms.php and incorporate the Creative Commons Attribution - Non Commercial (unported, v3.0) License.
By accessing the work you hereby accept the Terms. Non-commercial uses of the work are permitted without any further permission from Dove Medical Press Limited, provided the work is properly attributed. For permission for commercial use of this work, please see paragraphs 4.2 and 5 of our Terms.