")
Back to Journals » Clinical Interventions in Aging » Volume 14
Identification of Frailty and Its Risk Factors in Elderly Hospitalized Patients from Different Wards: A Cross-Sectional Study in China
Authors Liang YD, Zhang YN, Li YM, Chen YH, Xu JY , Liu M, Li J , Ma Z, Qiao LL, Wang Z , Yang JF, Wang H
Received 29 July 2019
Accepted for publication 1 December 2019
Published 19 December 2019 Volume 2019:14 Pages 2249—2259
DOI https://doi.org/10.2147/CIA.S225149
Checked for plagiarism Yes
Review by Single anonymous peer review
Peer reviewer comments 4
Editor who approved publication: Dr Zhi-Ying Wu
Yao-Dan Liang,1,2 Yao-Nan Zhang,3 Yan-Ming Li,4 Yu-Hui Chen,5 Jing-Yong Xu,6 Ming Liu,7 Jing Li,8 Zhao Ma,9 Lin-Lin Qiao,10 Zi Wang,11 Jie-Fu Yang,1 Hua Wang1
1Department of Cardiology, Beijing Hospital, National Center of Gerontology, Beijing, People’s Republic of China; 2Chinese Academy of Medical Sciences, Peking Union Medical College, Beijing, People’s Republic of China; 3Department of Orthopedics; 4Department of Pulmonary and Critical Care Medicine; 5Department of Neurology; 6Department of General Surgery; 7Department of Urology; 8Department of Geriatrics; 9Department of Rehabilitation; 10Department of Traditional Chinese Medicine; 11Department of Cardiac Surgery, Beijing Hospital, National Center of Gerontology, Beijing, People’s Republic of China
Correspondence: Hua Wang; Jie-Fu Yang
Department of Cardiology, Beijing Hospital, National Center of Gerontology, No. 1, Dahua Road, Dongcheng District, Beijing 100730, People’s Republic of China
Tel +86 13911680467; +86 13601292259
Fax +86-010-58115035
Email [email protected]; [email protected]
Objectives: To survey the difference of frailty prevalence in elderly inpatients amongdifferent wards; to compare the diagnostic performance of five frailty measurements (Clinical Frailty Scale [CFS], FRAIL, Fried, Edmonton, Frailty Index [FI]) in identifying frailty; and to explore the risk factors of frailty in elderly inpatients.
Participants and methods: This was a cross-sectional study including 1000 inpatients (mean age 75.2±6.7 years, 51.5% male; 542, 229, and 229 patients from cardiology, non-surgical, and surgical wards, respectively) in a tertiary hospital from September 2018 to February 2019. We applied the combined index to integrate the five frailty measurements mentioned above as the gold standard of frailty diagnosis. Multivariate logistic regression models were used to determine the independent risk factors of frailty.
Results: Frailty prevalence was 32.3% (Fried), 36.2% (CFS), 19.2% (FRAIL), 25.2% (Edmonton), 35.1% (FI) in all patients. The frailty was more common in non-surgical wards, regardless of the frailty assessment tools used (non-surgical wards: 27.5% to 51.5%; cardiology ward: 14.9% to 29.3%; surgical wards: 18.8% to 41.9%). CFS≥5 showed a sensitivity of 94.1% and a specificity of 85.2% for all patients. FI≥0.25 showed a sensitivity of 94.8% and a specificity of 87.0% for all patients. Age [odds ratio (OR) = 1.089, P<0.001], education level (OR = 0.782, P=0.001), heart rate (OR = 1.025, P<0.001), albumin (OR = 0.911, P=0.002), log D-dimer (OR = 2.940, P<0.001), ≥5 comorbidities (OR = 2.164, P=0.002), and ≥5 medications (OR = 2.819, P<0.001) were independently associated with frailty in all participants.
Conclusion: Frailty is common among elderly inpatients, especially in non-surgical wards. CFS is a preferred screening tool and FI may be an optimal assessment tool. Old age, low educational level, fast heart rate, low albumin, high D-dimer, ≥5 comorbidities, and polypharmacy are independent risk factors of frailty in elderly hospitalized patients.
Keywords: frailty, elderly hospitalized patients, wards, risk factor, China
Introduction
Populations around the world are rapidly ageing, but longevity is not being accompanied by an extended period of good health.1 In China, the number of the elderly population, defined as 65 years or older, has reached 160 million, accounting for 11.9% of the total population in the end of 2018.2 Given the ever-expanding older population, frailty is becoming a prominent public health problem.3 Many studies have shown that frail old adults are at higher risk for adverse health outcomes,4 and that intervention can reduce the level of frailty.5,6 Hence, frailty deserves more attention. Data science is increasingly used to explore the potential predictors of frailty,7 and artificial intelligence is used to try to reveal the causal relationships among some phenomena.8
Tools for frailty evaluation are based on two basic concepts of frailty: physical frailty and multidimensional frailty. Frailty phenotype proposed by Fried et al focuses on the physical weakness, which includes grip strength, weight loss, exhaustion, walking speed, and physical activity.9 Jones et al propose frailty index (FI) which quantifies the cumulative burden of multidimensional deficits.10 The Edmonton frail scale (EFS) is a simplified assessment tool also based on the multidimensional frailty.11 Meanwhile, frailty screening tools are developed to save the excessive time spending on the frailty assessment given the busy clinical settings. The most commonly used frailty screening tools are clinical frailty scale (CFS)12 and FRAIL scale.13 However, few studies have simultaneously evaluated different frailty screening and assessment tools in the same cohort of hospitalized patients, especially from different wards. Moreover, there is currently no recognized gold standard measurement of frailty.
Compared with developed countries, frailty researches start late in China, and most of them focus on the community-dwelling elderly population. A recent systematic review indicates an overall pooled prevalence of frailty among Chinese community-dwelling older people of 10%.14 A limited number of studies show that the prevalence of frailty among Chinese hospitalized older patients ranges from 18% to 54%, which are evaluated by different tools, mostly focusing on the department of geriatrics.15–20 However, due to the different characteristics of the disease itself and therapeutic approaches, the results from geriatric ward cannot be simply applied to the situation of other wards. To the best of our knowledge, there is no research comparing the frailty of elderly hospitalized patients from different wards in China, nor in other countries around the world.
The objectives of this study are three-fold: 1. survey the prevalence of frailty in elderly hospitalized patients among different wards to provide evidence for decision-making in hospital management; 2. compare the sensitivity and specificity of different frailty screening and assessment tools to provide suggestions for optimizing the evaluation of frailty in clinical settings; 3. explore the associated risk factors of frailty in elderly hospitalized patients to offer a possible direction for future intervention.
Materials and Methods
Study Design
We conducted a cross-sectional survey study on a comprehensive geriatric evaluation of elderly patients who were consecutively admitted to a tertiary referral hospital (Beijing, China), from September 2018 to February 2019.
Participants
Considering that frailty could be affected by the nature of diseases, we surveyed the elderly patients from ten wards covering medical and surgical departments. Due to the big differences of treatment between cardiology department and traditional medical departments, we divided the ten wards into three groups which were cardiology ward, non-surgical wards (i.e., respiratory ward, geriatric ward, neurology ward, rehabilitation ward, and traditional Chinese medicine ward), and surgical wards (i.e., general surgery ward, orthopedics ward, urology ward, and cardiac surgery ward). Inclusion criteria were: (1) age 65 years or older; (2) hospitalized patients. Exclusion criteria were: (1) could not cooperate with the assessment procedure (such as severe cognitive impairment, deafness, unstable vital signs, etc.); (2) refused to sign the informed consent.
Information Collection
In order to be traceable, we collected the patients’ medical history (especially the diagnosis of diseases) and blood tests’ results from the electronic health records by observers who had medical licenses in mainland China and were trained before participating in this study. As for comprehensive geriatric assessment, including demographic information, frailty assessments, mood, cognition, basic activities of daily living (BADL), instrumental activities of daily living (IADL), medications, geriatric syndrome, grip strength, 4m-walking speed, and others (details were described in the “Frailty Assessments” section), we invited eight experienced nurses who just retired from our hospital to be investigators. Before the beginning of patients’ enrollment, all investigators received three rounds of training for the procedure of comprehensive geriatric assessment, through investigation manuals, videos, and simulated patients. All investigators passed a training test before participating in the formal investigation to ensure the accuracy and consistency of information collection. Study data were collected and managed using the Research Electronic Data Capture (REDCap) hosted at Peking University Clinical Research Institute.21
Frailty Assessments
We used the following tools to assess the frailty of hospitalized elderly patients:
- The clinical frailty scale (CFS, scores between 1 and 9; scores ≥5 defined as frailty)
The Rockwood CFS was a fast frailty screening tool which scored based on semiquantitative evaluation of the patient’s symptoms, inactivity, exhaustion, and disability for BADL and IADL. For example, if an individual with limited dependence on others for IADL, would score 5 on the CFS. Patients with a CFS≥5 were classified as frailty.12
The FRAIL scale was an interview-based instrument that did not need physical performance measures and required less time. The items measured components of fatigue, resistance, ambulation, unintentional weight loss, and illnesses, and a score of ≥3 was classified as frailty.13
The Fried frailty phenotype was widely used as a frailty assessment consisting of 5 criteria: unintentional weight loss, exhaustion, low grip strength, slow walking speed, and low activity. Patients with a score≥3 were classified as frailty.9
The Edmonton frail scale was a multidimensional frailty assessment tool that included 10 domains: cognition, general health status, functional independence, social support, medication use, nutrition, mood, continence, and functional performance (Timed Get Up and Go).11 The reliability and validity of the Chinese version of Edmonton Frail Scale in assessing the frailty of the elderly have been validated.22 The score ranged from 0 to 17. Patients with a score ≥8 were classified as frailty.11
Rockwood proposed frailty as a clinical state resulting from the accumulation of deficits.10 These deficits could be combined in a frailty index (FI) to reflect the proportion of deficits presenting in a person. The key to geriatric medicine was comprehensive geriatric assessment (CGA). In 2008, Rockwood put forward a standard procedure for creating an FI based on the CGA.23 According to the core criteria (associated with health status; prevalence increased with age; did not saturate too early; covered a range of systems),23 we selected 48 variables to construct the CGA-FI. The first 14 items of the CGA-FI were 6-item Katz’s basic activities of daily living (bathing dressing, using the toilet, getting in/out of chair, feeding, and incontinence)24 and 8-item Lawton’s instrumental activities of daily living (shopping, finances, using transportation, using telephone, managing medications, housekeeping, preparing meals, and washing clothes).25 There were 16 items focusing on the chronic diseases, which included hypertension, coronary heart disease, atrial fibrillation, congestive heart failure, peripheral artery disease, chronic lung disease, sleep apnea hypopnea syndrome, diabetes, thyroid dysfunction, peptic ulcer, stroke, chronic kidney disease, osteoarthritis, osteoporosis, Parkinson’s disease, and cancer recorded by electronic health records. Three items focused on the mood, which included depression, anxiety and loneliness. Depression was defined by 5-item Geriatric Depression Scale (GDS-5items, score≥2).26 Anxiety was defined by the Hospital Anxiety and Depression Scale-Anxiety (HADS-A, score≥8).27 The Mini-Mental State Examination (MMSE)28 was an item reflecting the cognition of patients. Seven items assessed geriatric syndrome, which consisted of visual impairment, hearing impairment, chewing impairment, fall history, chronic constipation, chronic pain, and insomnia defined by Athens Insomnia Scale (AIS, score≥6).29 Depending on assistive devices and taking exercise outside were two items rating the ability of activity. The last five items were objective measurements including body mass index (BMI), calf circumference, peak flow, grip strength, and 4m-walking speed. The detail cut-off values were in Appendix Table 1. The CGA-FI was the result of the sum of all variables’ score divided by 48. Patients with a CGA-FI≥0.25 were classified as frailty.23
There was no gold standard in evaluating the frailty of elderly hospitalized patients. Therefore, we used the above mentioned five frailty assessment tools to produce a combined index that we assumed to be the gold standard of frailty tool. Subjects were defined as frail if so identified by at least 3 of the 5 tools, which meant the combined index’s score ≥3. This methodology has been previously suggested by Pablo et al.30
Statistical Analyses
Kolmogorov–Smirnov tests were used to check continuous variables for normal distribution. Data were described as mean ± SD (for normally distributed variables), median and quartiles (for non-normally distributed variables), and frequency and percentiles (for categorical variables). When three groups were involved, the one-way ANOVA test for age, physical examination, hemoglobin, white blood cell and albumin, the Pearson’s chi-squared test for male, education, residence, income, living alone, smoking, drinking, comorbidities, and medications, and the Kruskal–Wallis test for D-dimer and hospital length were used for the comparison. When two groups were considered, the chi-squared test (for categorical data) and the Mann–Whitney U-test (for nonnormally distributed data) were used for the comparison. Tukey’s HSD test was used in conjunction with an ANOVA (post-hoc analysis) to compare the differences from each other. Using the combined index as the gold standard, we calculated the sensitivity and specificity of the other five tools for frailty evaluation. Univariate and multivariate Logistic regression models were utilized to determine independently associated risk factors of frailty which was classified by the combined index. Only factors with P value < 0.05 in univariate analyses entered multivariate model. Results of Logistic regression models were presented as Odds Ratios (ORs) and 95% confidence intervals (95% CIs). A P-value <0.05 was considered statistically significant. All analyses were performed using R version 3.5.3.
Results
Demographic and Baseline Clinical Characteristics in All Subjects
During the study period, a total of 1342 elderly patients from ten different wards were screened, among which 322 patients did not meet the enrollment criteria and 20 patients did not finish the assessments. Hence, a total of 1000 participants were included in the final analysis (Figure 1). Among the 1000 participants, 542 patients were from cardiology ward, 229 patients were from non-surgical wards (i.e., respiratory ward, geriatric ward, neurology ward, rehabilitation ward, and traditional Chinese medicine ward), and 229 patients were from surgical wards (i.e., general surgery ward, orthopedics ward, urology ward, and cardiac surgery ward).
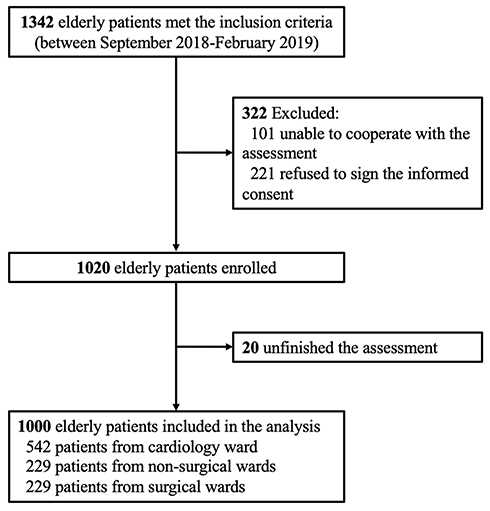 |
Figure 1 Flow chart of the study cohort. |
There were 51.5% males (515/1000) in the study and the average age was 75.2±6.7 years for all participants. About one-third of patients achieved an educational level of university or higher. The vast majority of them (96.4%) were living in cities and 8.6% patients were living alone. The income per month for more than half of the participants was between 4000 and 8000 Renminbi (RMB). There were 11.2% of patients who had 5 or more comorbidities and 50.6% of patients who took 5 or more medications regularly at home. The median of length of hospital stay for all patients was 8 days. The non-surgical wards had the longest median hospital stay of 12 days, while the cardiology wards had the shortest median hospital stay of 6 days (P<0.001). More detailed demographic and clinical information are presented in Table 1.
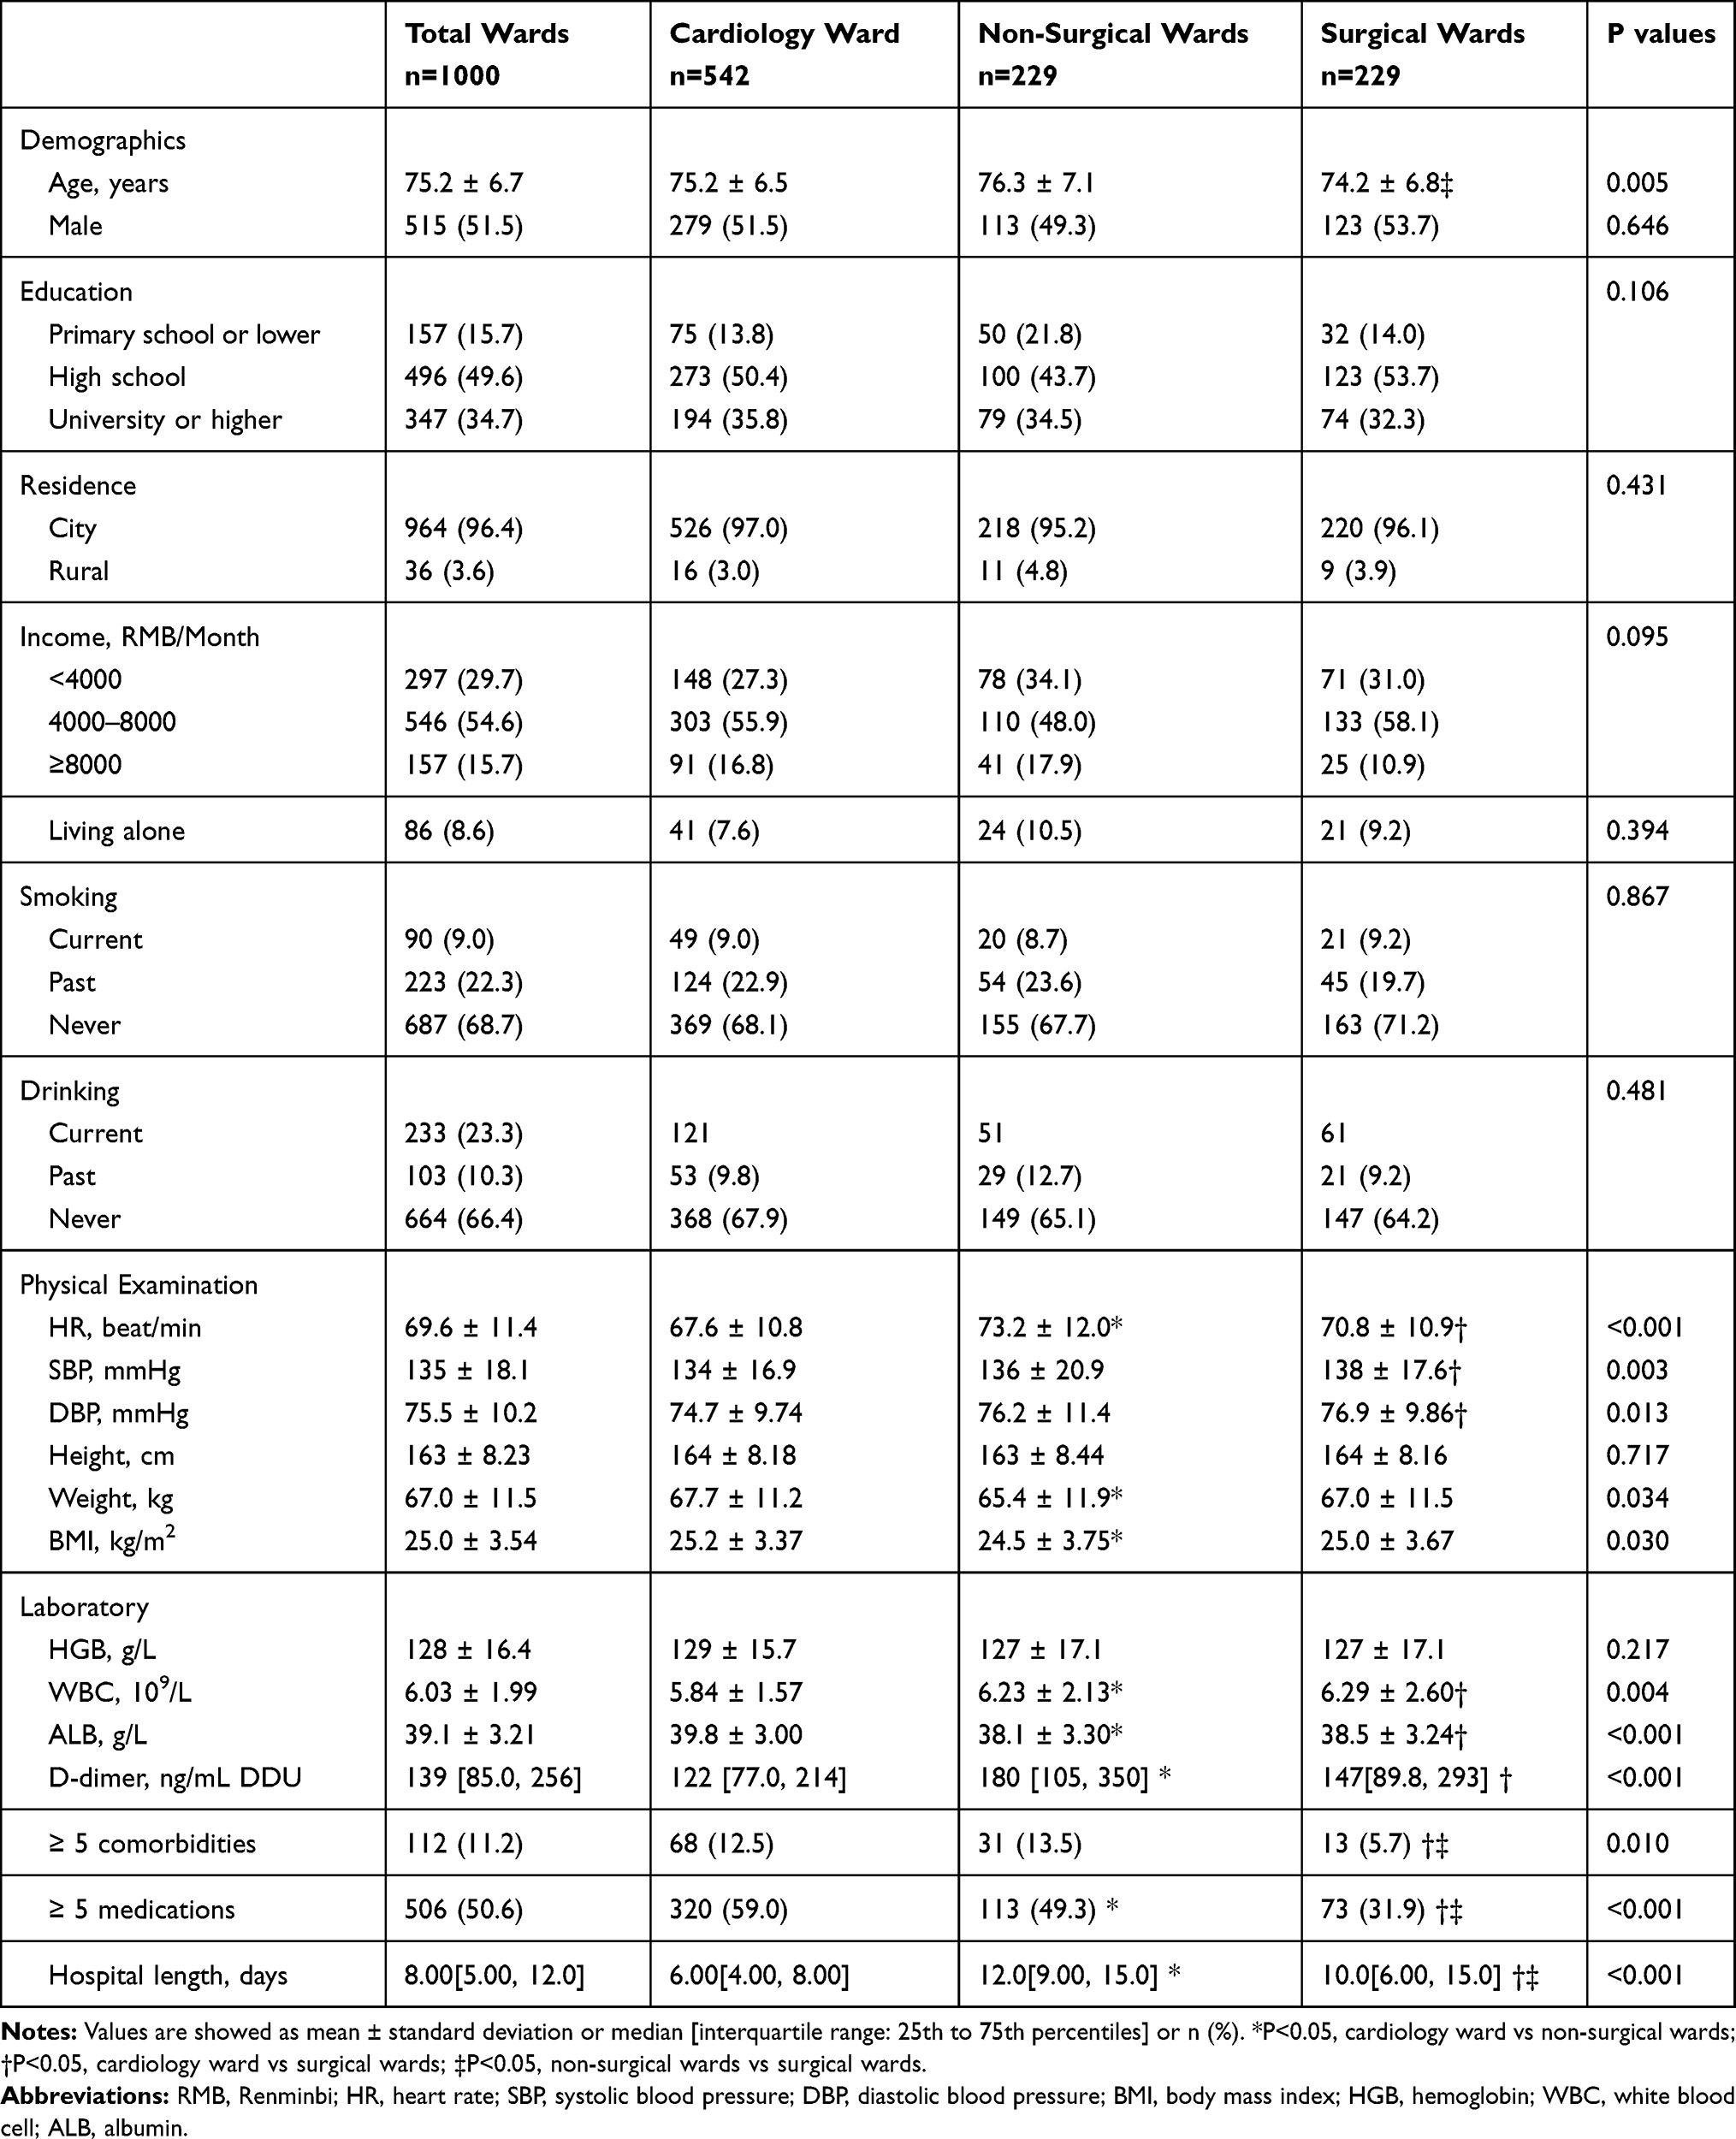 |
Table 1 Demographic and Clinical Characteristics of All Participants |
Identification of Frailty in Elderly Inpatients from Different Wards
Frailty prevalence varied according to frailty assessment tools used. For all participants, frailty prevalence estimates were 32.3% (Fried), 36.2% (CFS), 19.2% (FRAIL), 25.2% (Edmonton), and 35.1% (FI). We used combined index which integrated five above mentioned frailty assessment tools as the presumed gold standard for diagnosis of frailty. We found 27.6% of all participants were frail according to the gold standard. Moreover, non-surgical wards showed the highest frailty prevalence of 42.4%, while the cardiology ward had the lowest frailty prevalence of 20.7% and the surgical wards showed the frailty prevalence of 29.3% (cardiology ward vs non-surgical wards: P<0.001; cardiology ward vs surgical wards: P=0.097; non-surgical wards vs surgical wards: P=0.001). The frailty was much more common in non-surgical wards, regardless of the frailty assessment tool selected (non-surgical wards: 27.5% to 51.5% vs cardiology ward: 14.9% to 29.3% vs surgical wards: 18.8% to 41.9%) (Figure 2).
 |
Figure 2 Frailty prevalence in different wards by different measurements. Abbreviations: CFS, clinical frailty scale; FI, frailty index. |
According to the combined index≥3 as the gold standard for diagnosis of frailty, we found FRAIL≥3 showed the highest specificity (97.0%) and lowest sensitivity (63.0%) and FI≥0.25 showed the highest sensitivity (94.8%) for all participants. As for cardiology ward and non-surgical wards, FRAIL≥3 also showed the highest specificity (96.3% for cardiology ward; 99.2% for non-surgical wards) and lowest sensitivity (58.0% for cardiology ward; 63.9% for non-surgical wards), meanwhile FI≥0.25 showed the highest sensitivity (96.4% for cardiology ward and 95.9% for non-surgical wards). Different from the above two groups, in surgical wards, Edmonton≥8 showed the highest specificity (98.1%) and lowest sensitivity (59.7%) and CFS≥5 showed the highest sensitivity (98.5%) (Table 2).
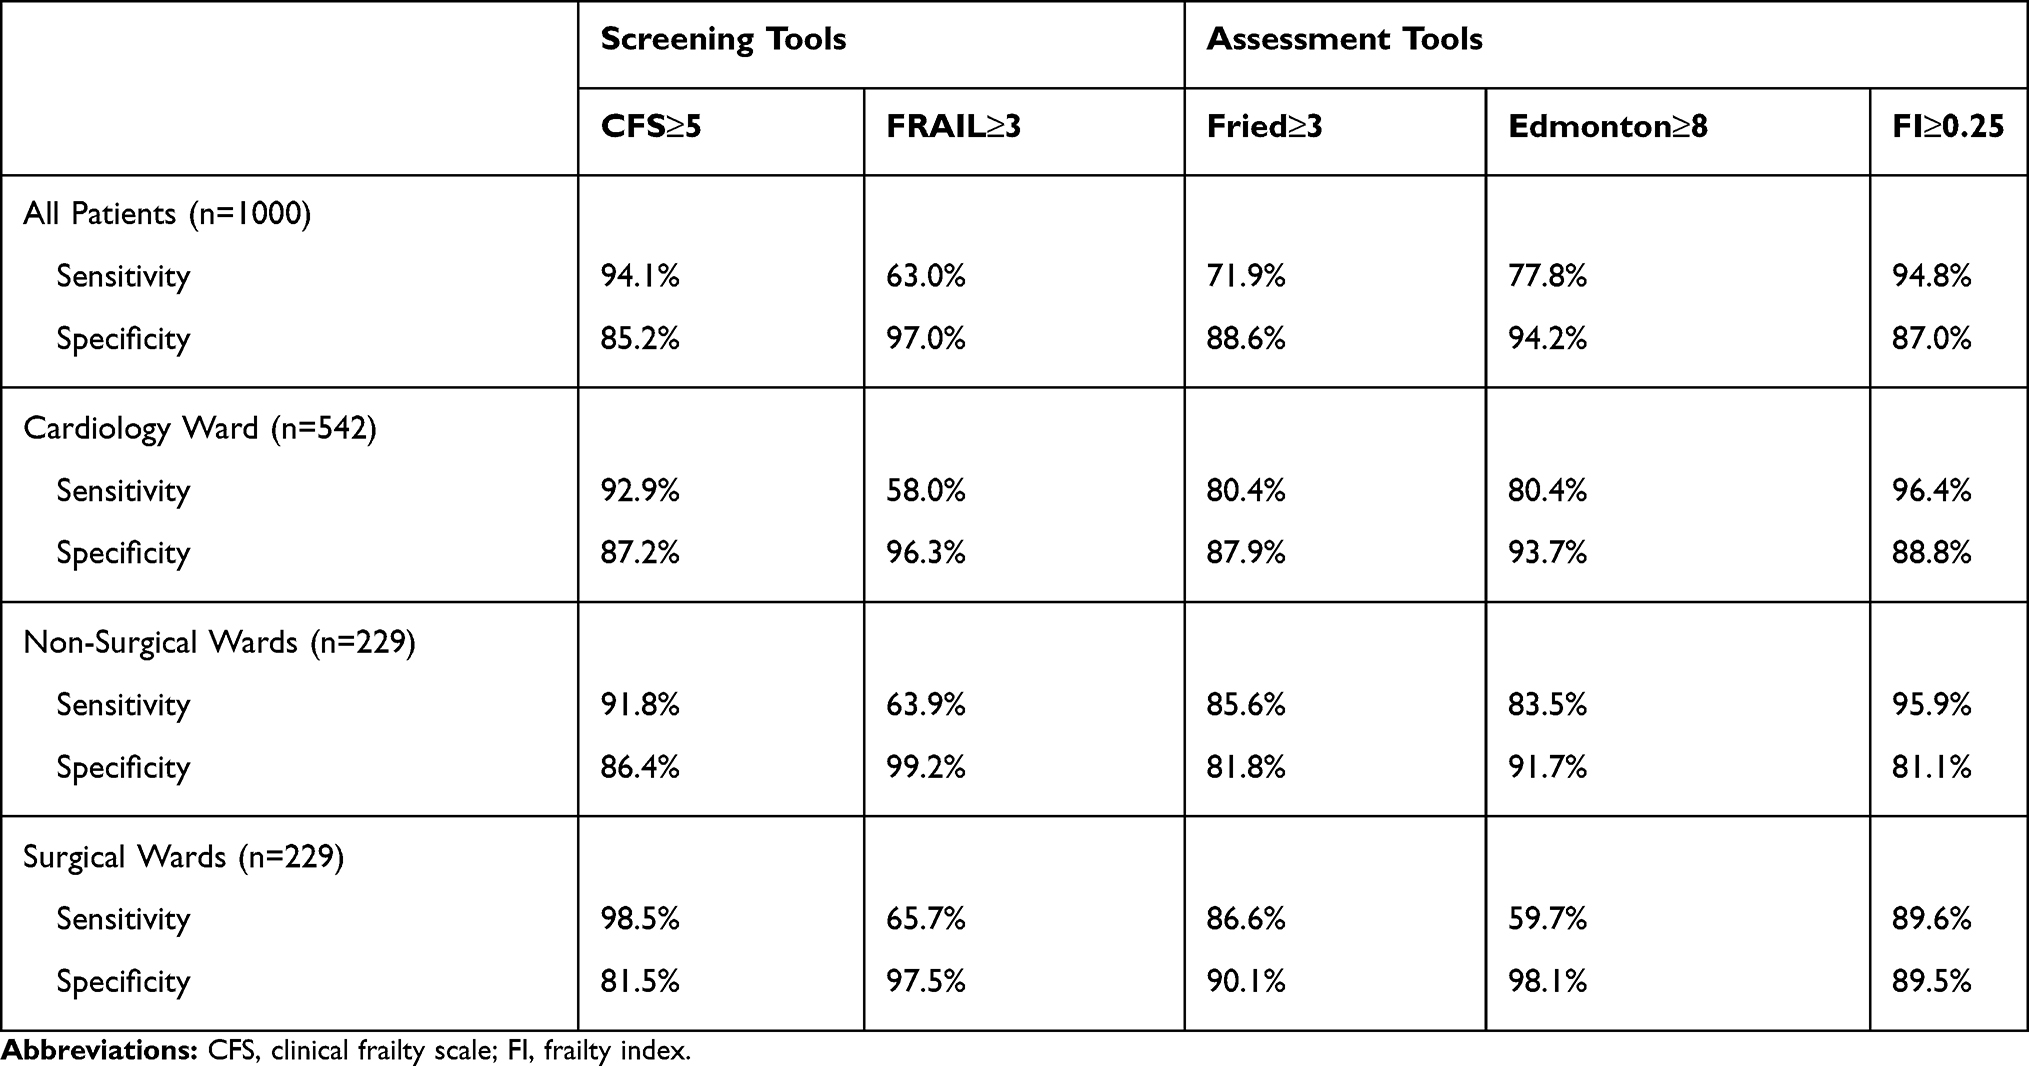 |
Table 2 Sensitivity and Specificity of Different Frailty Tools in Identifying Frailty According to the Combined Index (the Presumed Gold Standard for Identifying Frailty) in Different Wards |
Risk Factors Associated with Frailty in Elderly Inpatients from Different Wards
As for all participants, we found age (P<0.001), gender (P=0.007), education level (P<0.001), heart rate (HR, P<0.001), diastolic blood pressure (P=0.043), BMI (P=0.024), hemoglobin (P<0.001), white blood cell (P=0.007), albumin (P<0.001), log D-dimer (P<0.001), ≥5 comorbidities (P<0.001), and ≥5 medications (P<0.001) showed significant association with the frailty defined by the gold standard using the univariable Logistic regression. By using the multivariable Logistic regression, we found age (OR = 1.089, P<0.001), education level (OR = 0.782, P=0.001), HR (OR = 1.025, P<0.001), albumin (OR = 0.911, P=0.002), log D-dimer (OR = 2.940, P<0.001), ≥5 comorbidities (OR = 2.164, P=0.002), and ≥ 5 medications (OR = 2.819, P<0.001) showed independent association with the frailty for all participants (Table 3). Appendix Table 2 shows the correlation of 16 comorbidities and frailty by univariable and multivariable Logistic regression.
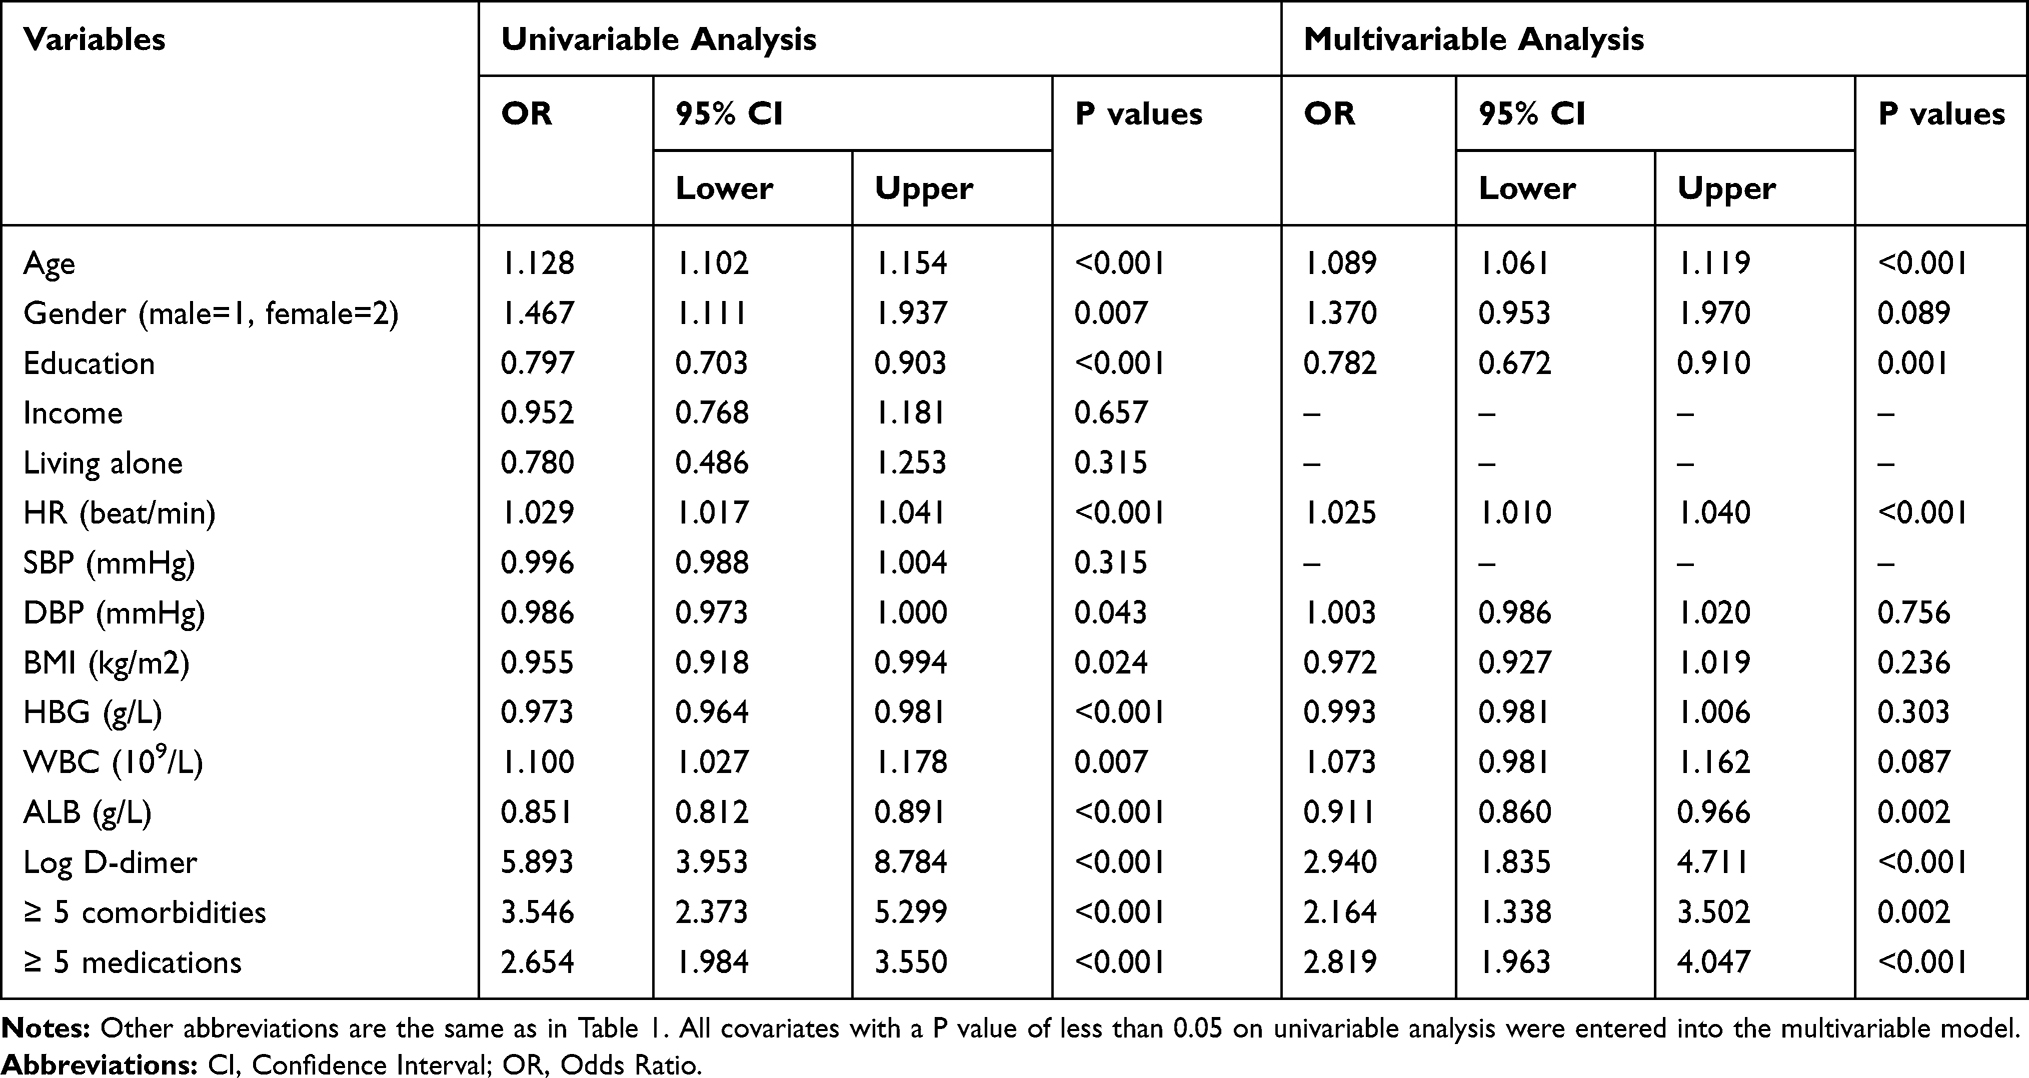 |
Table 3 Risk Factors Associated with Frailty of All Patients by Univariable and Multivariable Logistic Regression |
Discussion
To our best knowledge, this is the first study focusing on the frailty of elderly inpatients from different wards by using various frailty evaluation tools. We found that frailty is common among elderly inpatients, especially in non-surgical wards. CFS is a preferred frailty screening tool due to its high sensitivity and acceptable specificity. As for frailty assessment tools, EFS has the highest specificity but unsatisfactory sensitivity, while FI has the highest sensitivity with good specificity. Old age, low educational level, high HR, low albumin, high log D-dimer, ≥5 comorbidities, and ≥ 5 medications are independently associated with the frailty in hospitalized patients.
Prevalence of Frailty in Elderly Hospitalized Patients
Our study showed that the overall prevalence of frailty of all the elderly hospitalized patients was 27.6% which was evaluated by the combined index. Compared with the pooled prevalence of frailty among community-dwelling older people (10%),14 elderly hospitalized patients deserve more attention on assessment and intervention of frailty. We found that the prevalence of frailty of inpatients from cardiac ward, non-surgical wards, and surgical wards was 20.7%, 42.4%, and 29.3%, respectively. The overall prevalence of frailty in our study was consistent with previous published results which showed that 18% to 54% of elderly inpatients were frail among different regions in China.15–20,31 However, no published results showed the data of frailty from different wards simultaneously, mostly only focusing on the department of geriatrics or only one type of disease. Our results revealed that non-surgical wards had the highest incidence of frailty and longest hospital length among the cardiac ward and surgical wards. This phenomenon might be explained by the differences among the characteristics of different diseases, selective bias of patients in different wards due to the selected treatments, and other relevant facts. For example, a severe frail patient was more likely to choose conservative medical treatment rather than a surgical approach.
Evaluation of Frailty by Different Tools
We found that the prevalence of frailty for all patients varied from 19.2% to 36.2% depending on the evaluation tool applied. Previous studies also showed that different tools for the same cohort of patients would have different results of frailty prevalence.32–36 We used the combined index as the gold standard to evaluate the sensitivity and specificity of two frailty screening tools and three assessment tools. We found CFS as a screening tool has better sensitivity (94.1% for all patients, range from 91.8% to 98.5% for different wards) than FRAIL (only 63.0% for all patients, range from 58.0% to 65.7% for different wards), meanwhile CFS also has an acceptable specificity, ranging from 81.5% to 87.2%. A previous study illustrated that FRAIL also had a lower sensitivity (54.6%) than CFS (89.6%), but FRAIL performed better in predicting in-hospital mortality.32 Another study in comparison of six frailty evaluation tools for patients with chronic heart failure also indicated that CFS was a simple and good screening tool for frailty.34 Considering the shortened screening time and acceptable sensitivity, we also consider CFS as a better frailty screening tool than FRAIL.
As for the frailty assessment tools, we found FI showed the highest sensitivity (89.6–96.4%) and good specificity (81.1–89.5%) for identifying the frailty for all wards, while EFS showed the highest specificity (91.7–98.1%) without good sensitivity (59.7–83.5%) among these three assessment tools. Fried scale showed moderate performance in both sensitivity (71.9–86.6%) and specificity (81.8–90.1%). There were few studies focusing on the comparison of different frailty assessment tools. A previous study has compared four different frailty measurements, using FI as the gold standard directly.32 Another previous study also showed EFS had the highest specificity (98%) but low (62%) sensitivity for patients with chronic heart failure.34 Considering the sensitivity and specificity of frailty diagnosis, we deem FI as the best frailty assessment tool compared to EFS and Fired scale. However, without clinical outcomes at present, we are unable to give the optimal choice of frailty assessment tool with the best prognostic value.
Associated Risk Factors of Frailty
Our study demonstrated that elderly hospitalized patients with older age, lower educational level, more comorbidities, polypharmacy, lower albumin, higher heart rate, and higher log D-dimer were more likely to develop into frailty. Our results were consistent with previous findings which also indicated the association of older age,37 lower educational level,38 more comorbidities, and polypharmacy39 with frailty. Previous studies showed that there was a close relationship between nutritional status and frailty.31 Our study also found lower albumin which reflected nutritional status was independently associated with frailty.
D-dimer is an important clinical assay for the detection of active coagulation and fibrinolysis. It is widely used in clinical practice to rule out clinically suspected deep venous thrombosis and pulmonary embolism. However, a previous study revealed that D-dimer levels increased with age even in the absence of detectable thrombosis.40 Rising levels of D-dimer with age can be explained partially by the high prevalence of pro-inflammatory conditions and increasing burden of lipid abnormalities, anemia and obesity.41 These factors compromise the specificity of D-dimer levels as a diagnostic marker to thrombosis in older individuals but give the possible reasons why D-dimer is independently associated with frailty in elderly patients. A previous study indicates that D-dimer is an independent predictor for incident frailty in post-menopausal women.42 It is consistent with our finding which also concludes D-dimer as an independent risk factor of frailty in elderly patients. The role of markers of coagulation and fibrinolysis in the frailty of elderly patients deserves more attention and exploration in the future.
Surprisingly, we found heart rate was independently associated with frailty. This is a remarkable finding rarely noticed in the frailty related research. In the previous literature, the relationship between heart rate and frailty was mentioned only in the studies on orthostatic hypotension and frailty. However, one study discovered that baseline heart rate and early heart rate responses appeared impaired in frailty,43 while another study did not show obvious differences in heart rate between frail and non-frail groups.44 In the general population, elevated resting heart rate is associated with cardiovascular risk factors45 and increased mortality.46 In the elderly population, elevated heart rate is also an independent risk factor for short-term47 and long-term mortality.48 This phenomenon fits well with the Levine theory that subjects with higher heart rate are dying at an earlier age because of the depletion of their heart rate capital.49 Elevated heart rate may reflect cardiovascular autonomic nervous dysfunction and decreased cardiopulmonary function. These may be the possible reasons why high heart rate is associated with frailty in elderly patients. However, a recent Danish study which enrolled 854 subjects with a median age of 95.2 years demonstrates that elevated heart rate is not associated with increased mortality in very old people.50 According to our current study, we cannot give solid evidence to present a clear causality between heart rate and frailty. But we do consider heart rate as a significant role in frailty, despite of different voices.
Limitations
There are several limitations in our study. First, there is no established “gold standard” measurement of frailty in elderly patients, although we used five frailty tools to balance the bias. Second, our study is a cross-sectional study, so we cannot give the predictive values of different frailty measurements and the causality conclusions. Third, we only selected ten representative departments in a single tertiary hospital, which may have a degree of selection bias for elderly inpatients. Multicenter studies with a larger sample size and longer follow-up are warranted in the future.
Conclusions
In summary, frailty prevalence varies according to different measurements, but is common among elderly hospitalized patients, especially in non-surgical wards. Given the sensitivity and specificity of identifying frailty, CFS is a preferred screening tool and FI may be an optimal assessment tool. Old age, low educational level, fast heart rate, low albumin, high D-dimer, ≥5 comorbidities, and polypharmacy are independently associated with the frailty of elderly hospitalized patients.
Abbreviations
FI, Frailty index; EFS, Edmonton frail scale; CFS, Clinical frailty scale; BADL, Basic activities of daily living; IADL, Instrumental activities of daily living; CGA, Comprehensive geriatric assessment; GDS, Geriatric depression scale; HADS-A, Hospital anxiety and depression scale-anxiety; MMSE, Mini-mental state examination; AIS, Athens insomnia scale; BMI, Body mass index; OR, Odds Ratio; CI, Confidence interval.
Ethics Approval and Informed Consent
The study conformed to the Declaration of Helsinki and was approved by the Ethics Committee of Beijing Hospital (No. 2018BJYYEC-121-02). All participants gave their written informed consent. This study was monitored by Peking University Clinical Research Institute who were entrusted by Beijing Municipal Science & Technology Commission.
Data Sharing Statement
Data will be available upon request from the corresponding authors.
Author Information
Dr. Wang Hua (MSc) is a professor in the Department of Cardiology, Beijing Hospital, National Center of Gerontology. Dr. Yang Jiefu (MSc) is a professor and the director in Department of Cardiology, Beijing Hospital, National Center of Gerontology. Dr. Liang Yaodan (MD) is a postdoctoral scholar in the Department of Cardiology, Beijing Hospital, National Center of Gerontology, No. 1, Dahua Road, Dongcheng District, Beijing, 100730, China.
Acknowledgments
We appreciate sincerely all eight investigators (Ms. Du Pingjing, Ms. Gao Junyan, Ms. Jiao Fengling, Ms. Li Meilan, Ms. Sun Qingyun, Ms. Shen Yueli, Ms. Xu Li, and Ms. Yi Lin) for their dedicated and responsible assessment of every patient; Professor Yang Liu (Nursing College, Wannan Medical College, Wuhu, China) for providing us with the validated Chinese version of the Edmonton Frail Scale; Mr. Jiang Yingkai and Mr. Li Yichao (PhD candidates, Center for Statistical Science, Tsinghua University, Beijing, China) for their friendly support to our statistical analyses; and all participants and patients in every ward for their cooperation.
Disclosure
Dr Hua Wang report grants from Beijing Municipal Science & Technology Commission, grants from CAMS Innovation Fund for Medical Sciences, grants from Chinese Academy of Medical Sciences, during the conduct of the study. The authors report no other conflicts of interest in this work.
References
1. Beard JR, Officer A, de Carvalho IA, et al. The world report on ageing and health: a policy framework for healthy ageing. Lancet. 2016;387(10033):2145–2154. doi:10.1016/S0140-6736(15)00516-4
2. National Bureau of Statistics of China Available from: http://data.stats.gov.cn/easyquery.htm?cn=C01.
3. Clegg A, Young J, Iliffe S, Rikkert MO, Rockwood K. Frailty in elderly people. Lancet. 2013;381(9868):752–762. doi:10.1016/S0140-6736(12)62167-9
4. Ethun CG, Bilen MA, Jani AB, Maithel SK, Ogan K, Master VA. Frailty and cancer: implications for oncology surgery, medical oncology, and radiation oncology. CA Cancer J Clin. 2017;67(5):362–377. doi:10.3322/caac.21406
5. Apostolo J, Cooke R, Bobrowicz-Campos E, et al. Effectiveness of interventions to prevent pre-frailty and frailty progression in older adults: a systematic review. JBI Database System Rev Implement Rep. 2018;16(1):140–232. doi:10.11124/JBISRIR-2017-003382
6. Puts MTE, Toubasi S, Andrew MK, et al. Interventions to prevent or reduce the level of frailty in community-dwelling older adults: a scoping review of the literature and international policies. Age Ageing. 2017;46(3):383–392. doi:10.1093/ageing/afw247
7. Hassler AP, Menasalvas E, Garcia-Garcia FJ, Rodriguez-Manas L, Holzinger A. Importance of medical data preprocessing in predictive modeling and risk factor discovery for the frailty syndrome. BMC Med Inform Decis Mak. 2019;19(1):33. doi:10.1186/s12911-019-0747-6
8. Holzinger A, Langs G, Denk H, Zatloukal K, Müller H. Causability and explainabilty of artificial intelligence in medicine. Wiley Interdiscip Rev Data Min Knowl Discov. 2019;e1312.
9. Fried LP, Tangen CM, Walston J, et al. Frailty in older adults: evidence for a phenotype. J Gerontol a Biol Sci Med Sci. 2001;56(3):M146–M156. doi:10.1093/gerona/56.3.M146
10. Jones DM, Song X, Rockwood K. Operationalizing a frailty index from a standardized comprehensive geriatric assessment. J Am Geriatr Soc. 2004;52(11):1929–1933. doi:10.1111/jgs.2004.52.issue-11
11. Rolfson DB, Majumdar SR, Tsuyuki RT, Tahir A, Rockwood K. Validity and reliability of the edmonton frail scale. Age Ageing. 2006;35(5):526–529. doi:10.1093/ageing/afl041
12. Rockwood K. A global clinical measure of fitness and frailty in elderly people. Can Med Assoc J. 2005;173(5):489–495. doi:10.1503/cmaj.050051
13. Morley JE, Malmstrom TK, Miller DK. A simple frailty questionnaire (FRAIL) predicts outcomes in middle aged African Americans. J Nutr Health Aging. 2012;16(7):601–608. doi:10.1007/s12603-012-0084-2
14. He B, Ma Y, Wang C, et al. Prevalence and risk factors for frailty among community-dwelling older people in China: a systematic review and meta-analysis. J Nutr Health Aging. 2019;23:442–450. doi:10.1007/s12603-019-1179-9
15. Yang Y, Hao Q, Flaherty JH, et al. Comparison of procalcitonin, a potentially new inflammatory biomarker of frailty, to interleukin-6 and C-reactive protein among older Chinese hospitalized patients. Aging Clin Exp Res. 2018;30:1459–1464. doi:10.1007/s40520-018-0964-3
16. Hao Q, Zhou L, Dong B, Yang M, Dong B, Weil Y. The role of frailty in predicting mortality and readmission in older adults in acute care wards: a prospective study. Sci Rep. 2019;9(1):1207. doi:10.1038/s41598-018-38072-7
17. Zou C, Chen S, Shen J, et al. Prevalence and associated factors of depressive symptoms among elderly inpatients of a Chinese tertiary hospital. Clin Interv Aging. 2018;13:1755–1762. doi:10.2147/CIA.S170346
18. Zhang N, Zhu WL, Liu XH, et al. A cross-sectional study on the association between frailty and muscular performances in hospitalized elder patients with coronary artery disease. Zhonghua Nei Ke Za Zhi. 2019;58(4):265–269. doi:10.3760/cma.j.issn.0578-1426.2019.04.006
19. Yang F, Chen QW. Evaluation of frailty and influencing factors in old people in hospital institution: evidence for a phenotype of frailty. Medicine. 2018;97(3):e9634. doi:10.1097/MD.0000000000009634
20. Wei Y, Cao Y, Yang X, Xu Y. Investigation on the frailty status of the elderly inpatients in Shanghai using the FRAIL (fatigue, resistance, ambulation, illness, and loss) questionnaire. Medicine. 2018;97(18):e0581. doi:10.1097/MD.0000000000010581
21. Harris PA, Taylor R, Thielke R, Payne J, Gonzalez N, Conde JG. Research electronic data capture (REDCap)–a metadata-driven methodology and workflow process for providing translational research informatics support. J Biomed Inform. 2009;42(2):377–381. doi:10.1016/j.jbi.2008.08.010
22. Yang L, Bao LH, Zhou Q, Wang CZ, Ma SY. Reliability and validity of edmonton frail scale. Int J Geriatr. 2016;3:135–137.
23. Searle SD, Mitnitski A, Gahbauer EA, Gill TM, Rockwood K. A standard procedure for creating a frailty index. BMC Geriatr. 2008;8:24. doi:10.1186/1471-2318-8-24
24. Katz S, Ford AB, Moskowitz RW, Jackson BA, Jaffe MW. Studies of illness in the aged. The index of ADL: a standardized measure of biological and psychosocial function. JAMA. 1963;185:914–919. doi:10.1001/jama.1963.03060120024016
25. Lawton MP, Brody EM. Assessment of older people: self-maintaining and instrumental activities of daily living. Gerontologist. 1969;9(3):179–186. doi:10.1093/geront/9.3_Part_1.179
26. Hoyl MT, Alessi CA, Harker JO, et al. Development and testing of a five-item version of the geriatric depression scale. J Am Geriatr Soc. 1999;47(7):873–878. doi:10.1111/jgs.1999.47.issue-7
27. Zigmond AS, Snaith RP. The hospital anxiety and depression scale. Acta Psychiatr Scand. 1983;67(6):361–370. doi:10.1111/acp.1983.67.issue-6
28. Folstein MF, Folstein SE, McHugh PR. “Mini-mental state”. A practical method for grading the cognitive state of patients for the clinician. J Psychiatr Res. 1975;12(3):189–198. doi:10.1016/0022-3956(75)90026-6
29. Soldatos CR, Dikeos DG, Paparrigopoulos TJ. Athens insomnia scale: validation of an instrument based on ICD-10 criteria. J Psychosom Res. 2000;48(6):555–560. doi:10.1016/S0022-3999(00)00095-7
30. Pablo AMR, Izaga MA, Alday LA. Assessment of nutritional status on hospital admission: nutritional scores. Eur J Clin Nutr. 2003;57(7):824–831. doi:10.1038/sj.ejcn.1601616
31. Hong X, Yan J, Xu L, Shen S, Zeng X, Chen L. Relationship between nutritional status and frailty in hospitalized older patients. Clin Interv Aging. 2019;14:105–111. doi:10.2147/CIA.S189040
32. Chong E, Ho E, Baldevarona-Llego J, Chan M, Wu L, Tay L. Frailty and risk of adverse outcomes in hospitalized older adults: a comparison of different frailty measures. J Am Med Dir Assoc. 2017;18(7):
33. Chong E, Ho E, Baldevarona-Llego J, et al. Frailty in hospitalized older adults: comparing different frailty measures in predicting short- and long-term patient outcomes. J Am Med Dir Assoc. 2018;19(5):450–457.e453. doi:10.1016/j.jamda.2017.10.006
34. Sze S, Pellicori P, Zhang J, Weston J, Clark AL. Identification of frailty in chronic heart failure. JACC Heart Fail. 2019;7(4):291–302. doi:10.1016/j.jchf.2018.11.017
35. Afilalo J, Lauck S, Kim D, et al. Frailty in older adults undergoing aortic valve replacement: the FRAILTY-AVR study. J Am Coll Cardiol. 2017;70(6):689–700. doi:10.1016/j.jacc.2017.06.024
36. Ritt M, Bollheimer LC, Sieber CC, Gassmann KG. Prediction of one-year mortality by five different frailty instruments: a comparative study in hospitalized geriatric patients. Arch Gerontol Geriatr. 2016;66:66–72. doi:10.1016/j.archger.2016.05.004
37. Dokuzlar O, Soysal P, Isik AT. Association between serum vitamin B12 level and frailty in older adults. North Clin Istanb. 2017;4(1):22–28. doi:10.14744/nci.2017.82787
38. Eyigor S, Kutsal YG, Duran E, et al. Frailty prevalence and related factors in the older adult-frailTURK project. Age (Dordr). 2015;37(3):9791. doi:10.1007/s11357-015-9791-z
39. Bonaga B, Sanchez-Jurado PM, Martinez-Reig M, et al. Frailty, polypharmacy, and health outcomes in older adults: the frailty and dependence in albacete study. J Am Med Dir Assoc. 2018;19(1):46–52. doi:10.1016/j.jamda.2017.07.008
40. Harper PL, Theakston E, Ahmed J, Ockelford P. D-dimer concentration increases with age reducing the clinical value of the D-dimer assay in the elderly. Intern Med J. 2007;37(9):607–613. doi:10.1111/imj.2007.37.issue-9
41. Tita-Nwa F, Bos A, Adjei A, Ershler WB, Longo DL, Ferrucci L. Correlates of D-dimer in older persons. Aging Clin Exp Res. 2010;22(1):20–23. doi:10.1007/BF03324810
42. Reiner AP, Aragaki AK, Gray SL, et al. Inflammation and thrombosis biomarkers and incident frailty in postmenopausal women. Am J Med. 2009;122(10):947–954. doi:10.1016/j.amjmed.2009.04.016
43. Romero-Ortuno R, Cogan L, O’Shea D, Lawlor BA, Kenny RA. Orthostatic haemodynamics may be impaired in frailty. Age Ageing. 2011;40(5):576–583. doi:10.1093/ageing/afr076
44. Shaw BH, Borrel D, Sabbaghan K, et al. Relationships between orthostatic hypotension, frailty, falling and mortality in elderly care home residents. BMC Geriatr. 2019;19(1):80. doi:10.1186/s12877-019-1082-6
45. Palatini P, Dorigatti F, Zaetta V, et al. Heart rate as a predictor of development of sustained hypertension in subjects screened for stage 1 hypertension: the HARVEST study. J Hypertens. 2006;24(9):1873–1880. doi:10.1097/01.hjh.0000242413.96277.5b
46. Jensen MT, Suadicani P, Hein HO, Gyntelberg F. Elevated resting heart rate, physical fitness and all-cause mortality: a 16-year follow-up in the copenhagen male study. Heart. 2013;99(12):882–887. doi:10.1136/heartjnl-2012-303375
47. Legeai C, Jouven X, Tafflet M, et al. Resting heart rate, mortality and future coronary heart disease in the elderly: the 3C study. Eur J Cardiovasc Prev Rehabil. 2011;18(3):488–497. doi:10.1177/1741826710389365
48. Jensen MT, Wod M, Galatius S, Hjelmborg JB, Jensen GB, Christensen K. Heritability of resting heart rate and association with mortality in middle-aged and elderly twins. Heart. 2018;104(1):30–36. doi:10.1136/heartjnl-2016-310986
49. Levine HJ. Rest heart rate and life expectancy. J Am Coll Cardiol. 1997;30(4):1104–1106. doi:10.1016/s0735-1097(97)00246-5
50. Wod M, Jensen MT, Galatius S, Hjelmborg JB, Jensen GB, Christensen K. Resting heart rate and mortality in the very old. Scand J Clin Lab Invest. 2019;1–6.
 © 2019 The Author(s). This work is published and licensed by Dove Medical Press Limited. The full terms of this license are available at https://www.dovepress.com/terms.php and incorporate the Creative Commons Attribution - Non Commercial (unported, v3.0) License.
By accessing the work you hereby accept the Terms. Non-commercial uses of the work are permitted without any further permission from Dove Medical Press Limited, provided the work is properly attributed. For permission for commercial use of this work, please see paragraphs 4.2 and 5 of our Terms.
© 2019 The Author(s). This work is published and licensed by Dove Medical Press Limited. The full terms of this license are available at https://www.dovepress.com/terms.php and incorporate the Creative Commons Attribution - Non Commercial (unported, v3.0) License.
By accessing the work you hereby accept the Terms. Non-commercial uses of the work are permitted without any further permission from Dove Medical Press Limited, provided the work is properly attributed. For permission for commercial use of this work, please see paragraphs 4.2 and 5 of our Terms.