")
Back to Journals » OncoTargets and Therapy » Volume 9
Identification of feature genes for smoking-related lung adenocarcinoma based on gene expression profile data
Authors Liu Y, Ni R, Zhang H, Miao L, Wang J, Jia W, Wang Y
Received 3 June 2016
Accepted for publication 3 September 2016
Published 7 December 2016 Volume 2016:9 Pages 7397—7407
DOI https://doi.org/10.2147/OTT.S114230
Checked for plagiarism Yes
Review by Single anonymous peer review
Peer reviewer comments 2
Editor who approved publication: Dr Samir Farghaly
Ying Liu, Ran Ni, Hui Zhang, Lijun Miao, Jing Wang, Wenqing Jia, Yuanyuan Wang
Respiration Department, The First Affiliated Hospital of Zhengzhou University, Zhengzhou, Henan Province, People’s Republic of China
Abstract: This study aimed to identify the genes and pathways associated with smoking-related lung adenocarcinoma. Three lung adenocarcinoma associated datasets (GSE43458, GSE10072, and GSE50081), the subjects of which included smokers and nonsmokers, were downloaded to screen the differentially expressed feature genes between smokers and nonsmokers. Based on the identified feature genes, we constructed the protein–protein interaction (PPI) network and optimized feature genes using closeness centrality (CC) algorithm. Then, the support vector machine (SVM) classification model was constructed based on the feature genes with higher CC values. Finally, pathway enrichment analysis of the feature genes was performed. A total of 213 down-regulated and 83 up-regulated differentially expressed genes were identified. In the constructed PPI network, the top ten nodes with higher degrees and CC values included ANK3, EPHA4, FGFR2, etc. The SVM classifier was constructed with 27 feature genes, which could accurately identify smokers and nonsmokers. Pathways enrichment analysis for the 27 feature genes revealed that they were significantly enriched in five pathways, including proteoglycans in cancer (EGFR, SDC4, SDC2, etc.), and Ras signaling pathway (FGFR2, PLA2G1B, EGFR, etc.). The 27 feature genes, such as EPHA4, FGFR2, and EGFR for SVM classifier construction and cancer-related pathways of Ras signaling pathway and proteoglycans in cancer may play key roles in the progression and development of smoking-related lung adenocarcinoma.
Keywords: lung adenocarcinoma, feature genes, support vector machine (SVM) classification, pathway
Introduction
Lung cancer is the leading cause of cancer deaths worldwide.1 Non-small cell lung cancer (NSCLC) represents about 85% of all diagnosed lung cancer cases2 and is usually diagnosed in advanced or metastatic stages with a poor overall 5-year survival rate.3 Lung adenocarcinoma is a common histological form of NSCLC and nearly half of the lung cancers diagnosed in the USA are adenocarcinoma. Most cases of lung adenocarcinoma are associated with smoking.4 Bryant and Cerfolio5 have reported that cigarette smoking is responsible for ~90% of lung cancers.
Up to now, many studies have been done to explore the gene expression altered by cigarette smoking. For instance, Spira et al6 reported a smoking-related alteration of CYP1B1. NEK2 and CENPF have also been found to be differentially expressed in smoking-related lung cancer.7 Additionally, polymorphisms of CYPIA1 and OST1 have been suggested to be associated with susceptibility to lung cancer in relation to cigarette smoking.8 A recent study by Vucic et al9 found that microRNAs disrupted in a smoking status-dependent manner affected distinct cellular pathways and differentially influenced lung cancer patient prognosis in current, former, and never smokers. Moreover, Karlsson et al10 identified some genomic and transcriptional alterations in lung adenocarcinoma in relation to smoking history. In spite of these findings, we think it is not enough in the clinical practice.
Therefore, in this study, we used three lung adenocarcinoma associated datasets, the subjects of which included smokers and nonsmokers, to screen the differentially expressed feature genes between smokers and nonsmokers. Based on the identified feature genes, we constructed the protein–protein interaction (PPI) network and optimized feature genes using closeness centrality (CC) algorithm. Then, the support vector machine (SVM) classification model was constructed based on the feature genes with higher CC values. Finally, we performed pathway enrichment analysis for the feature genes. To the best of our knowledge, the current approaches, such as PPI network analysis, feature genes optimization, and SVM classification model construction, have not been comprehensively applied in the relevant studies. We aimed to identify the genes associated with smoking in lung adenocarcinoma.
Data and methods
Microarray data
We searched the expression profile datasets from the Gene Expression Omnibus (http://www.ncbi.nlm.nih.gov/geo/) database based on the keywords of lung cancer, homo sapiens, and smoke. The datasets that met the following criteria were included in this study: 1) the data were gene expression profile data; 2) the data were identified from the lung cancer tissues samples in patients with lung adenocarcinoma; 3) the lung adenocarcinoma patients included smokers and nonsmokers; and 4) the number of samples in each dataset was ≥50.
After screening, three gene expression profile datasets, GSE43458, GSE10072, and GSE50081, were selected in this study. GSE43458 contained 110 samples, including 40 smokers, 40 nonsmokers and others (only 80 samples were used in this study); GSE10072 contained 107 samples, including 16 smokers, 42 nonsmokers and others (only 58 samples were used in this study); and GSE50081 contained 116 samples, including 23 smokers and 93 nonsmokers.
Data preprocessing and feature gene identification
In the original microarray data in CEL format, background correction,11 and quartile data normalization12 using the Affy package (http://www.bioconductor.org/packages/release/bioc/html/affy.html)13 in R were carried out. For the original data in TXT format, the probes were converted into gene symbols through the expression annotation platform and the empty probes were removed. If multiple probes corresponded to the same gene symbol, the mean value was calculated as the gene expression value of this gene. Then the data in GSE10072 and GSE43458 were integrated and the differentially expressed genes (DEGs) were selected using the limma package (http://www.bioconductor.org/packages/release/bioc/html/limma.html).14 The P-value was adjusted according to the Benjamini-Hochberg15 method. The adjusted P-value <0.05 and |log2 (fold change)| >0.585 were regarded as the cut-off values. The identified DEGs were considered as feature genes and clustering analysis was then performed. The GSE50081 dataset was used for verification.
PPI network construction
Human protein reference database (HPRD, http://www.hprd.org/)16 is a database of experimentally derived human proteomic information, which includes PPIs, post-translational modifications, and tissue expression. In the present study, we downloaded this database and mapped the identified feature genes to the PPI network. The PPI network was visualized using the Cytoscape (http://www.cytoscape.org/)17 software.
Feature gene optimization
The centrality study is a popular subject in the analysis of networks. CC highlights the players who will be able to contact all other members of the network easily.18 In this study, the close connectivity degree of nodes in the PPI network was calculated based on the CC algorithm as follows:
|
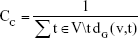
where V represents the node set; t represents a certain node in the node set; and dG (v,t) represents the sum of the distance from node t to the other nodes. The CC value is between 0 and 1. The greater the value, the stronger the CC of the node.
SVM classification model construction and classification efficiency evaluation
SVM has become a popular classification tool. In this study, based on the CC values of the feature genes, we sorted these genes in the descending order. The integrated data of GSE10072 and GSE43458, including 56 nonsmokers and 82 smokers, were used as the training dataset, on which was then performed optimal SVM classifier training using the R package e1071 (version: 1.6–7).19 The significant feature genes in classifier were used for further analysis.
The remaining dataset of GSE50081 was used as the verification dataset to evaluate the classification efficiency of the constructed optimal SVM classifier. The evaluation indexes included sensitivity, specificity, positive predictive value, negative predictive value, as well as areas under the receiver operating characteristic (ROC) curve.20 In addition, based on the survival time and terminal state of the clinical samples in GSE50081, we conducted the Kaplan–Meier (KM) survival analysis and drew the KM curve.21
Pathways enrichment analysis
Kyoto Encyclopedia of Genes and Genomes (KEGG) pathway enrichment analysis of the feature genes were carried out using the fisher algorithm.22 The formula was as follows:
|
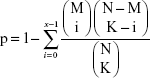
where N represents the number of genes in whole genome; M represents the number of genes in pathway gene set; K represents the number of DEGs. The Fisher’s score represents the probability of at least x genes being pathway genes in K DEGs.
Results
DEGs analysis
A total of 296 DEGs were selected, including 213 downregulated and 83 upregulated DEGs. The distribution of DEGs is shown in the volcano plot (Figure 1A). In addition, hierarchical clustering analysis of the DEGs and samples showed that DEGs could cluster most of the similar sample together (Figure 1B).
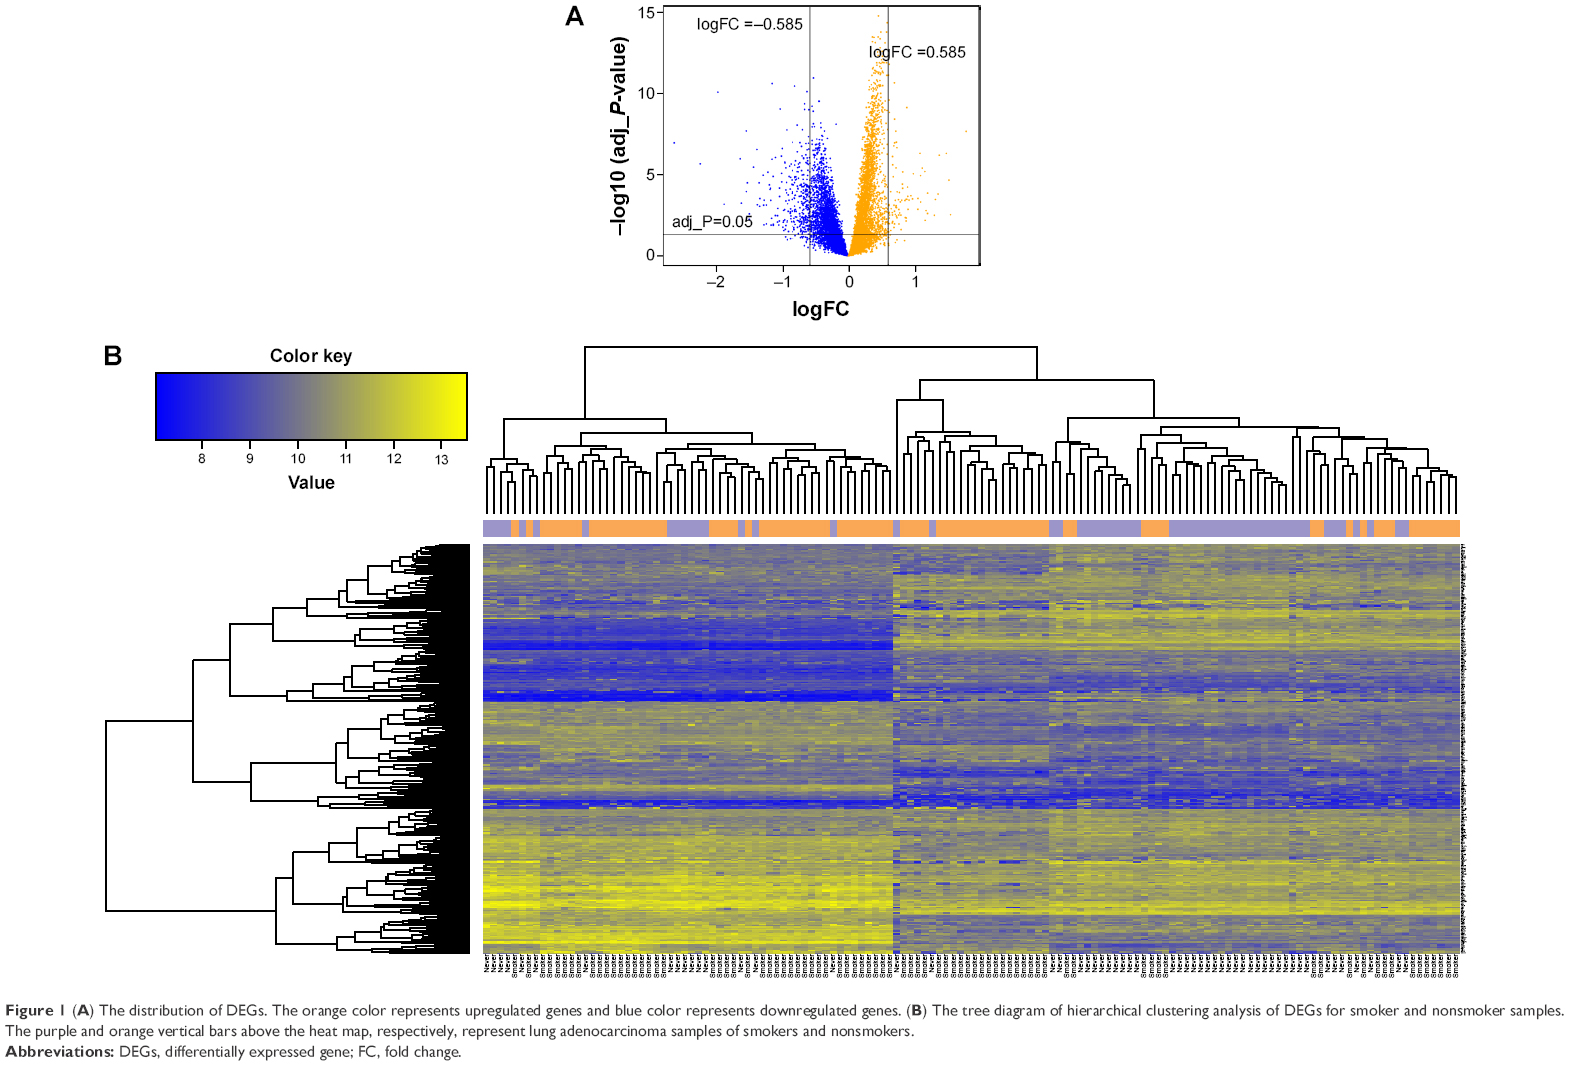 | Figure 1 (A) The distribution of DEGs. The orange color represents upregulated genes and blue color represents downregulated genes. (B) The tree diagram of hierarchical clustering analysis of DEGs for smoker and nonsmoker samples. The purple and orange vertical bars above the heat map, respectively, represent lung adenocarcinoma samples of smokers and nonsmokers. |
PPI network construction
Based on the HPRD database and Cytoscape software, the PPI network was constructed, which included 249 nodes and 263 edges (Figure 2A). There were two kinds of gene nodes: feature gene nodes (58) and extension gene nodes (191). Extension gene was the gene that had direct interactions with at least five feature genes. Additionally, the result of node degree analysis showed that the number of nodes decreased with the increase of node degree, indicating that the PPI network had scale-free feature (Figure 2B).
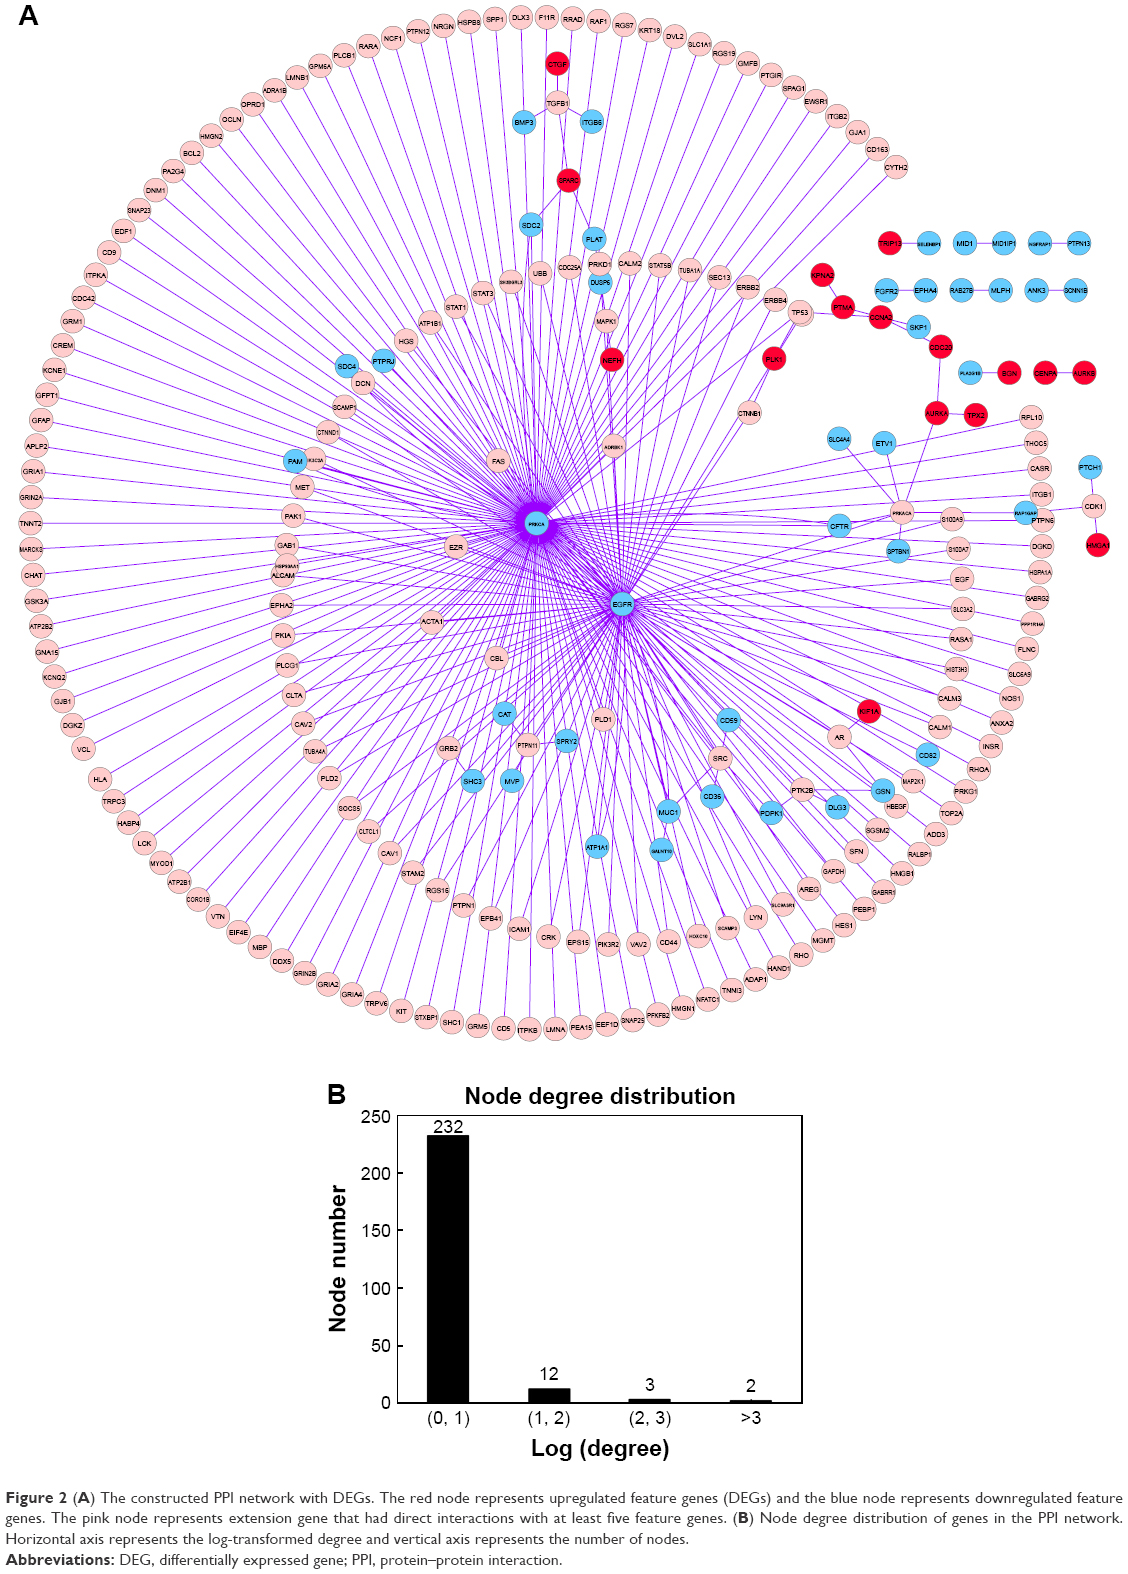 | Figure 2 (A) The constructed PPI network with DEGs. The red node represents upregulated feature genes (DEGs) and the blue node represents downregulated feature genes. The pink node represents extension gene that had direct interactions with at least five feature genes. (B) Node degree distribution of genes in the PPI network. Horizontal axis represents the log-transformed degree and vertical axis represents the number of nodes. |
Feature gene optimization
The CC value of each node was calculated based on the CC algorithm. The top 10 nodes with higher CC values, such as ankyrin 3, node of Ranvier (ankyrin G) (ANK3), EPH receptor A4 (EPHA4), fibroblast growth factor receptor 2 (FGFR2), and midline 1 (MID1), are shown in Table 1.
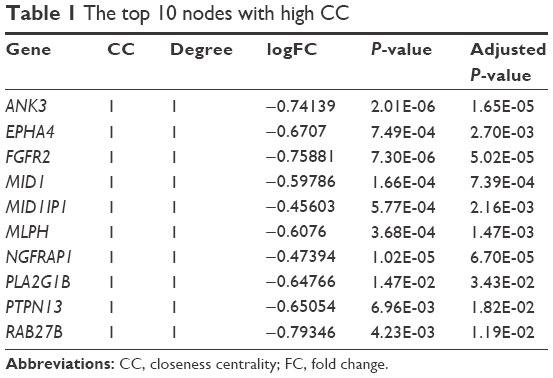 | Table 1 The top 10 nodes with high CC |
SVM classification model construction and classification efficiency evaluation
After sorting the CC values of gene nodes in the descending order, we selected the top 200 gene nodes (including 27 feature genes [Table 2]) and performed optimal SVM classifier training based on GSE10072 and GSE43458. As shown in Figure 3A, the constructed SVM classifier could accurately identify 55 nonsmokers (55/56, 98.21%) and 80 smokers (80/82, 97.56%). The overall classification accuracy was 97.83% (135/138). Then the expression values of 27 feature were extracted and performed hierarchical clustering analysis for all the training set samples to differentiate the lung adenocarcinoma patients into smokers and nonsmokers. As shown in Figure 4, the expression values of 27 feature genes could classify the samples.
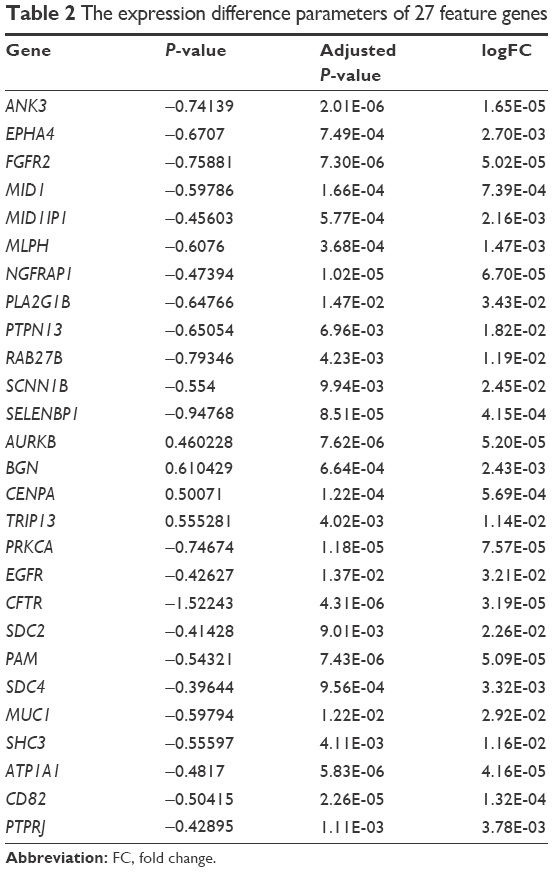 | Table 2 The expression difference parameters of 27 feature genes |
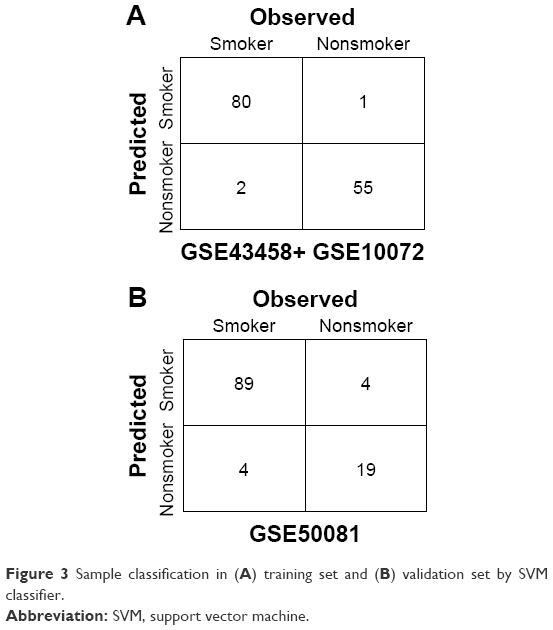 | Figure 3 Sample classification in (A) training set and (B) validation set by SVM classifier. |
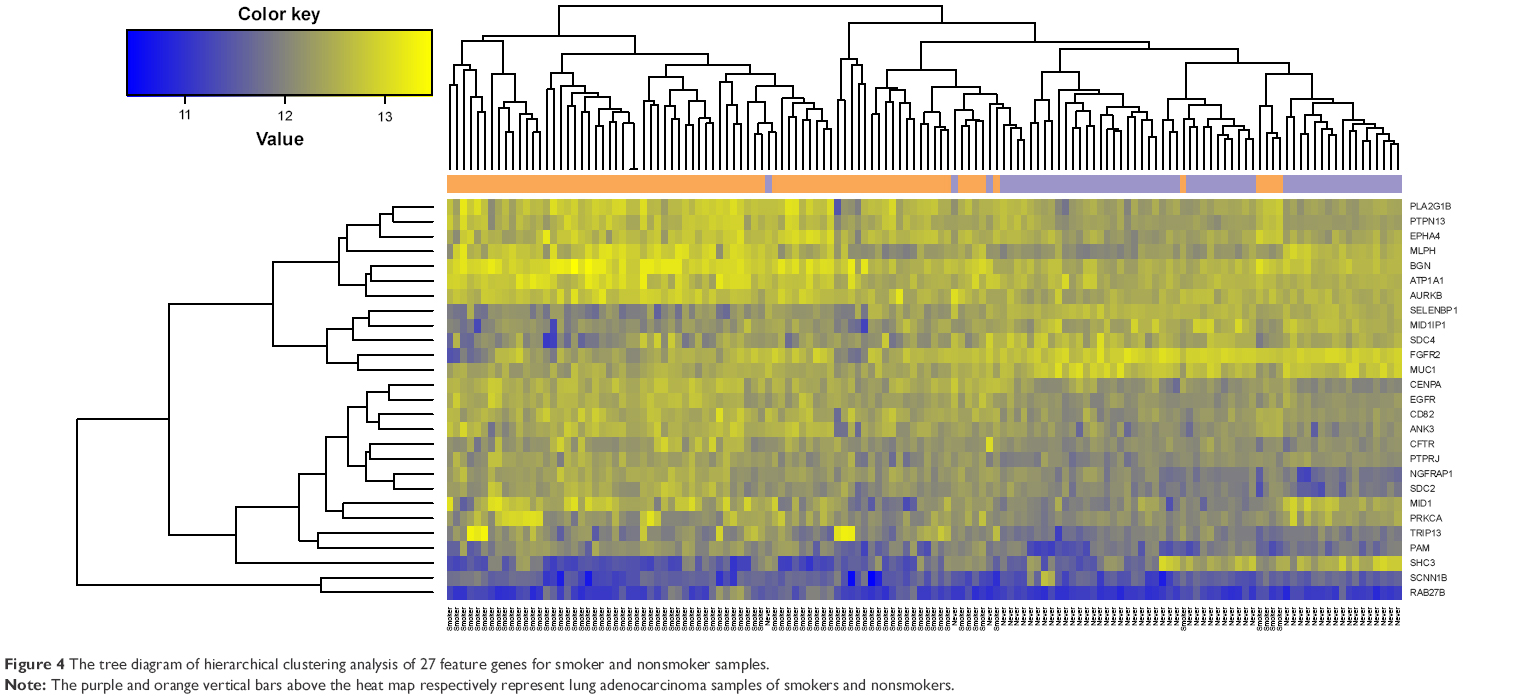 | Figure 4 The tree diagram of hierarchical clustering analysis of 27 feature genes for smoker and nonsmoker samples. |
We used the GSE50081 dataset to verify the repeatability and portability of the classifier constructed by the selected 27 feature genes. As displayed in Figure 3B, the SVM classifier could identify 89 smokers (89/93, 95.7%) and 19 nonsmokers (19/23, 82.61%), and the classification accuracy was 93.10% (108/116). The classification scatter plots of the training and validation sets are shown in Figure 5A and B.
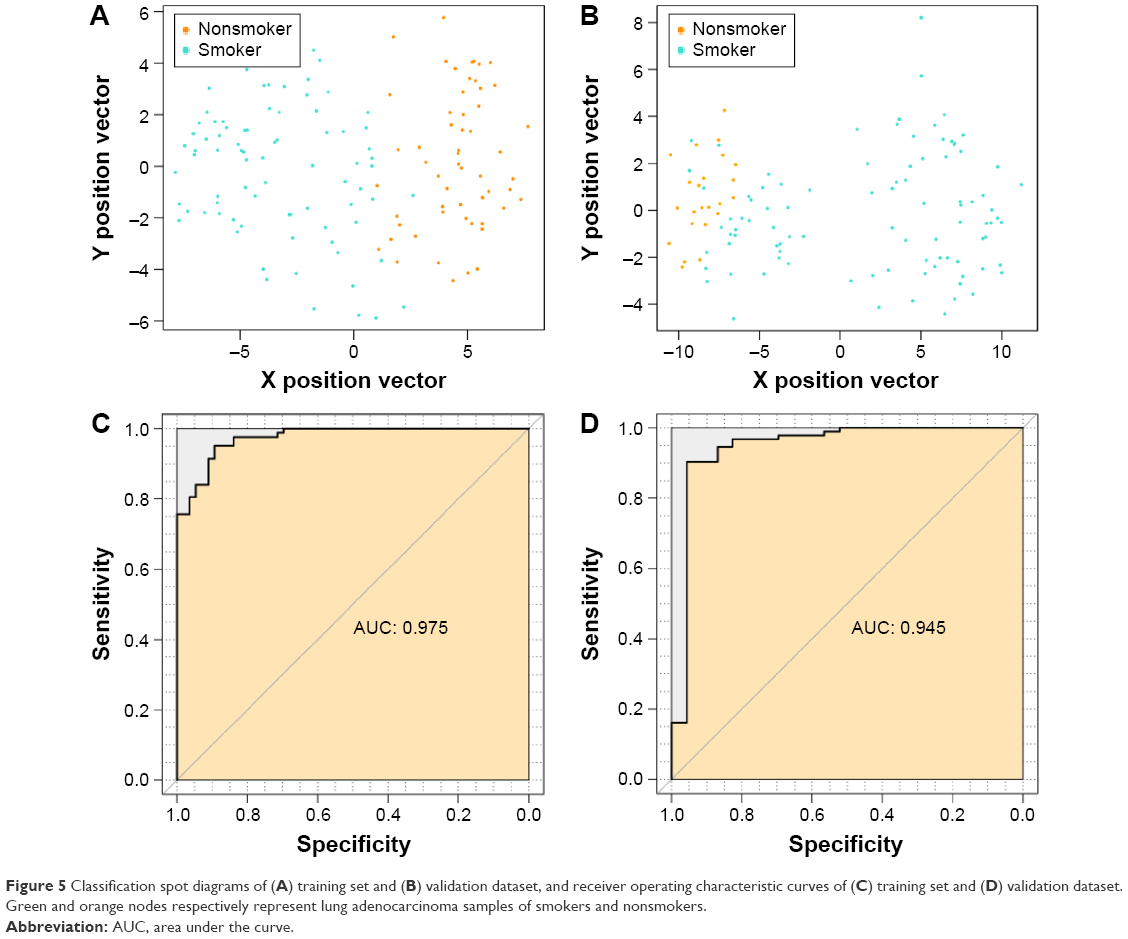 | Figure 5 Classification spot diagrams of (A) training set and (B) validation dataset, and receiver operating characteristic curves of (C) training set and (D) validation dataset. Green and orange nodes respectively represent lung adenocarcinoma samples of smokers and nonsmokers. |
In addition, we evaluated the classification efficiency of the constructed optimal SVM classifier using the indexes of correct rate, sensitivity, specificity, positive predictive and negative predictive values, and areas under the ROC curve. The evaluation result is shown in Table 3 and Figure 5C and D. Furthermore, based on the clinical information of samples in the GSE50081 dataset, which was divided into two groups (nonsmokers and smokers) by SVM classifier, we performed KM survival analysis. There were significant differences in survival time between the samples of smokers and nonsmokers identified from SVM classifier (P=0.0198). The survival rates of smokers decreased very fast in a comparatively short time, while the survival rates of nonsmokers decreased more slowly than that of smokers (Figure 6).
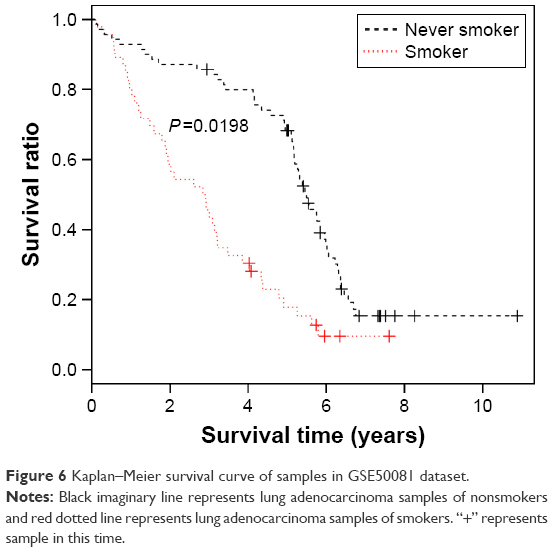 | Figure 6 Kaplan–Meier survival curve of samples in GSE50081 dataset. |
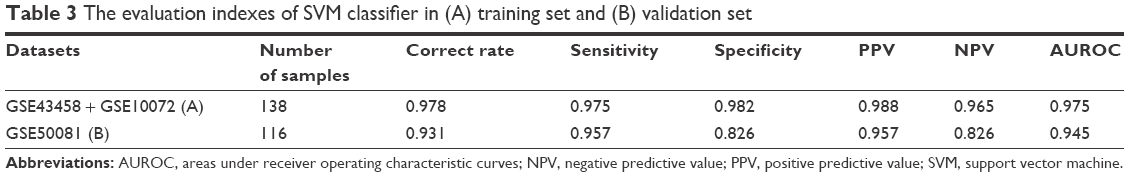 | Table 3 The evaluation indexes of SVM classifier in (A) training set and (B) validation set |
Pathways enrichment analysis
The 27 feature genes were significantly enriched in five pathways, including pancreatic secretion (PLA2G1B, CFTR, ATP1A1, etc.), aldosterone-regulated sodium reabsorption (ATP1A1, SCNN1B, and PRKCA), proteoglycans in cancer (SDC4, ANK3, EGFR, SDC2, and PRKCA) (http://www.kegg.jp/kegg-bin/show_pathway?hsa05205+8066513+7933772+8132860+8147461+8009301), Ras signaling pathway (FGFR2, PLA2G1B, EGFR, etc.) (http://www.kegg.jp/kegg-bin/show_pathway?hsa04014+7936734+7967034+8132860+8162216+8009301), and ErbB signaling pathway (EGFR, SHC3, and PRKCA) (Table 4).
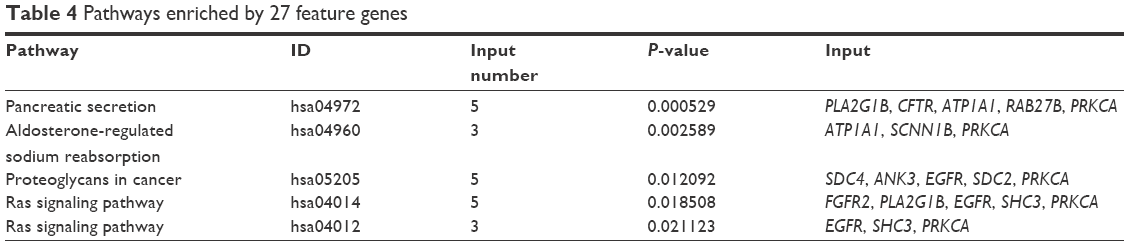 | Table 4 Pathways enriched by 27 feature genes |
Discussion
Cigarette smoke consists of a complex mixture of chemicals that can cause direct or indirect damage to the respiratory epithelium and its genome.23 Accumulation of genomic alterations has been observed in lung cancers arising in smokers compared to never smokers.24 In this study, we identified 296 DEGs between smokers and nonsmokers. Based on these DEGs and genes in the HPRD database, the PPI network was constructed. The top ten nodes with higher degrees and CC values included ANK3, EPHA4, FGFR2, etc. The SVM classifier constructed with 27 feature genes could accurately identify smokers and nonsmokers. Additionally, KM survival analysis of nonsmokers and smokers indicated that smoking had significant reduction effect on the survival rates of lung adenocarcinoma patients. Therefore, the 27 feature genes may provide reliable data basis and research direction for the diagnosis and treatment of smoking-related lung adenocarcinoma. Pathway enrichment analysis for the 27 feature genes revealed that they were significantly enriched in proteoglycans found in cancer (EGFR, SDC4, ANK3, SDC2, and PRKCA) and Ras signaling pathway (FGFR2, PLA2G1B, EGFR, etc.).
EPHA4 was one of the significant feature genes for SVM classifier construction. EPHA4 is a member of the Eph receptor kinase family, which constitutes one of the largest groups of transmembrane receptor tyrosine kinases.25 The receptor tyrosine kinases play important roles in the regulation of cellular proliferation and differentiation.26 Importantly, studies have found that several members of Eph receptor kinase family have been found to be overexpressed in various cancers.27,28 For instance, EPHA4 expression is frequently functionally altered in breast cancer, gastric cancer, pancreatic adenocarcinoma, and lung adenocarcinoma.29–32 Given the role of EPHA4 in SVM classifier, we speculated that EPHA4 may serve as a smoking-related biomarker in lung adenocarcinoma. In this study, EPHA4 was downregulated in smokers and upregulated in nonsmokers. Therefore, the changes of EPHA4 expression (from upregulation to downregulation) may reflect the development of lung adenocarcinoma from nonsmokers to smokers.
The fibroblast growth factor 2 and its transmembrane tyrosine kinase receptors (FGFRs) make up a complex family of signaling molecules, the dysregulation of which has been implicated in the progression and development of cancer.33 Overexpression of FGFR2 has been detected in NSCLC cell lines.34 In this study, FGFR2 was a key feature gene in the PPI network with higher degree and CC value. Behrens et al35 found that in lung adenocarcinoma specimens, the expression of FGFR2 is significantly higher in never smokers than in smokers. In accordance with the previously mentioned findings, our study also found that FGFR2 was upregulated in nonsmokers compared with smokers. Therefore, the downregulation of this gene may be a biomarker of smoking-related lung cancer.
Interestingly, FGFR2 was enriched in Ras signaling pathway. Ras signaling pathway is one of the best characterized pathways in cancer biology that can be activated by somatic mutation and gene amplification.36 Ras signaling pathway is involved in growth factor receptor activation in tumors.37 Alteration of this pathway has been reported in cancers frequently because of gain-of-function mutations mainly in Ras gene.38 Activating mutations in Ras protein result in constitutive signaling, thereby inhibiting apoptosis and stimulating cell proliferation. Oncogenic mutations in Ras gene have been shown in about 30% of human cancers.39 Presently, Ras signaling pathway has been used as a target in cancer therapy, including lung cancer therapy.40
In addition to FGFR2, EGFR was also enriched in Ras signaling pathway. EGFR is an attractive candidate for a receptor tyrosine kinase mediating autocrine growth in NSCLC.41 Molecular analysis of the responsive lung tumors reveals a significant enrichment for gain-of-function mutations in EGFR.42 About 10%–40% of lung adenocarcinoma displays activating mutations in EGFR.43 Especially, a study by Yanagawa et al44 found that smoking was correlated with the frequencies of EGFR mutations in lung adenocarcinoma. In the PPI network of the present study, EGFR interacted with a large number of genes and occupied the hub position, suggesting its important role in smoking-related lung adenocarcinoma. Taken together, FGFR2 and EGFR may play important roles in the development of smoking-related lung adenocarcinoma through Ras signaling pathway.
Furthermore, in this study, EGFR was also found to be involved in the pathway of Proteoglycans in cancer (hsa05205). Proteoglycans control many normal and pathological processes, such as cell proliferation, adhesion, tissue repair, vascularization, inflammation, and cancer metastasis. Due to the diverse functions, proteoglycans are implicated in tumorigenesis in human cancers.45,46 Altered proteoglycans expression in tumors can affect cancer cell signaling, growth, migration, and angiogenesis.47 The role of proteoglycans in cancer pathways in lung cancer has not been widely investigated, but we speculated that this pathway and its enriched feature genes (EGFR, SDC4, ANK3, SDC2, and PRKCA) may play an important role in smoking-related lung adenocarcinoma.
In conclusion, changes in the expression levels for the 27 feature genes, such as EPHA4, FGFR2, and EGFR for SVM classifier construction may play key roles in the progression and development of smoking-related lung adenocarcinoma, and may be useful biomarkers and therapeutic targets for the treatment of this cancer. Additionally, cancer-related pathways of Ras signaling and proteoglycans found in cancer may also play important roles in smoking-related lung adenocarcinoma. However, validation experiments are needed in the future to confirm our results.
Disclosure
The authors report no conflicts of interest in this work.
References
Siegel R, Naishadham D, Jemal A. Cancer statistics, 2012. CA Cancer J Clin. 2012;62(1):10–29. | ||
Jemal A, Siegel R, Xu J, Ward E. Cancer statistics, 2010. CA Cancer J Clin. 2010;60(5):277–300. | ||
Goldstraw P, Crowley J, Chansky K, et al. The iaslc lung cancer staging project: proposals for the revision of the tnm stage groupings in the forthcoming (seventh) edition of the tnm classification of malignant tumours. J Thorac Oncol. 2007;2(8):706–714. | ||
Subramanian J, Govindan R. Lung cancer in never smokers: a review. J Clin Oncol. 2007;25(5):561–570. | ||
Bryant A, Cerfolio RJ. Differences in epidemiology, histology, and survival between cigarette smokers and never-smokers who develop non-small cell lung cancer. Chest. 2007;132(1):185–192. | ||
Spira A, Beane J, Shah V, et al. Effects of cigarette smoke on the human airway epithelial cell transcriptome. Proc Natl Acad Sci U S A. 2004;101(27):10143–10148. | ||
Petersen S, Aninat-Meyer M, Schlüns K, Gellert K, Dietel M, Petersen I. Chromosomal alterations in the clonal evolution to the metastatic stage of squamous cell carcinomas of the lung. Br J Cancer. 2000;82(1):65–73. | ||
Nakachi K, Imai K, Hayashi S, Kawajiri K. Polymorphisms of the cyp1a1 and glutathione s-transferase genes associated with susceptibility to lung cancer in relation to cigarette dose in a Japanese population. Cancer Res. 1993;53(13):2994–2999. | ||
Vucic EA, Thu KL, Pikor LA, et al. Smoking status impacts microrna mediated prognosis and lung adenocarcinoma biology. BMC Cancer. 2014;14(1):778. | ||
Karlsson A, Ringnér M, Lauss M, et al. Genomic and transcriptional alterations in lung adenocarcinoma in relation to smoking history. Clin Cancer Res. 2014;20(18):4912–4924. | ||
Troyanskaya O, Cantor M, Sherlock G, et al. Missing value estimation methods for DNA microarrays. Bioinformatics. 2001;17(6):520–525. | ||
Rao Y, Lee Y, Jarjoura D, et al. A comparison of normalization techniques for microrna microarray data. Stat Appl Genet Mol Biol. 2008;7(1):22. | ||
Gautier L, Cope L, Bolstad BM, Irizarry RA. Affy – analysis of affymetrix genechip data at the probe level. Bioinformatics. 2004;20(3):307–315. | ||
Smyth GK. Limma: linear models for microarray data. In: Gentleman R, Carey V, Dudoit S, Irizarry R, Huber W, editors. Bioinformatics and computational biology solutions using r and bioconductor. New York: Springer; 2005:397–420. | ||
Reiner-Benaim A. Fdr control by the bh procedure for two-sided correlated tests with implications to gene expression data analysis. Biom J. 2007;49(1):107–126. | ||
Prasad TK, Goel R, Kandasamy K, et al. Human protein reference database – 2009 update. Nucleic Acids Res. 2009;37(suppl 1):D767–D772. | ||
Shannon P, Markiel A, Ozier O, et al. Cytoscape: a software environment for integrated models of biomolecular interaction networks. Genome Res. 2003;13(11):2498–2504. | ||
Rochat Y. Closeness centrality extended to unconnected graphs: the harmonic centrality index. ASNA. 2009:1–14. | ||
Mukherjee S, Rifkin R. Support Vector Machine Classification Of Microarray Data. Ai Memo Massachusetts Institute of Technology. 2010;1(5):1– 4. | ||
Fries RC. Computational intelligence in biomedical engineering (Begg R, et al; 2008) [book reviews]. IEEE Eng Med Biol Mag. 2009;5(28):66. | ||
Jager KJ, van Dijk PC, Zoccali C, Dekker FW. The analysis of survival data: the Kaplan–Meier method. Kidney Int. 2008;74(5):560–565. | ||
Subramanian A, Tamayo P, Mootha VK, et al. Gene set enrichment analysis: a knowledge-based approach for interpreting genome-wide expression profiles. Proc Nat Acad Sci U S A. 2005;102(43):15545–15550. | ||
Alavanja MC. Biologic damage resulting from exposure to tobacco smoke and from radon: implication for preventive interventions. Oncogene. 2002;21(48):7365–7375. | ||
Govindan R, Li D, Griffith M, et al. Genomic landscape of non-small cell lung cancer in smokers and never-smokers. Cell. 2012;150(6):1121–1134. | ||
Oshima T, Akaike M, Yoshihara K, et al. Overexpression of epha4 gene and reduced expression of ephb2 gene correlates with liver metastasis in colorectal cancer. In J Oncol. 2008;33(3):573–577. | ||
Schlessinger J, Ullrich A. Growth factor signaling by receptor tyrosine kinases. Neuron. 1992;9(3):383–391. | ||
Jubb AM, Zhong F, Bheddah S, et al. Ephb2 is a prognostic factor in colorectal cancer. Clin Cancer Res. 2005;11(14):5181–5187. | ||
Nakamura R, Kataoka H, Sato N, et al. Epha2/efna1 expression in human gastric cancer. Cancer Sci. 2005;96(1):42–47. | ||
Jing X, Sonoki T, Miyajima M, et al. Epha4-deleted microenvironment regulates cancer development of isografted 4t1 murine breast cancer cells via reduction of an igf1 signal. Cancer Med. 2016;5(6):1214–1227. | ||
Duxbury MS, Ito H, Zinner MJ, Ashley SW, Whang EE. Epha2: a determinant of malignant cellular behavior and a potential therapeutic target in pancreatic adenocarcinoma. Oncogene. 2004;23(7):1448–1456. | ||
Miyazaki K, Inokuchi M, Takagi Y, Kato K, Kojima K, Sugihara K. Epha4 is a prognostic factor in gastric cancer. BMC Clin Pathol. 2013;13(1):19. | ||
Saintigny P, Peng S, Zhang L, et al. Global evaluation of eph receptors and ephrins in lung adenocarcinomas identifies epha4 as an inhibitor of cell migration and invasion. Mol Cancer Ther. 2012;11(9):2021–2032. | ||
Dailey L, Ambrosetti D, Mansukhani A, Basilico C. Mechanisms underlying differential responses to fgf signaling. Cytokine Growth Factor Rev. 2005;16(2):233–247. | ||
Kuhn H, Köpff C, Konrad J, Riedel A, Gessner C, Wirtz H. Influence of basic fibroblast growth factor on the proliferation of non-small cell lung cancer cell lines. Lung Cancer. 2004;44(2):167–174. | ||
Behrens C, Lin HY, Lee JJ, et al. Immunohistochemical expression of basic fibroblast growth factor and fibroblast growth factor receptors 1 and 2 in the pathogenesis of lung cancer. Clin Cancer Res. 2008;14(19):6014–6022. | ||
Loboda A, Nebozhyn M, Klinghoffer R, et al. A gene expression signature of ras pathway dependence predicts response to pi3k and ras pathway inhibitors and expands the population of ras pathway activated tumors. BMC Med Genomics. 2010;3(1):1–11. | ||
Young A, Lyons J, Miller AL, Phan VT, Alarcón IR, McCormick F. Ras signaling and therapies. Adv Cancer Res. 2009;102:1–17. | ||
Santarpia L. Targeting the mitogen-activated protein kinase ras-raf signaling pathway in cancer therapy. Pathol Int. 1996;46(29):667–672. | ||
Adjei AA. Blocking oncogenic ras signaling for cancer therapy. J Nat Cancer Inst. 2001;93(14):1062–1074. | ||
Santarpia L, Lippman SM, El-Naggar AK. Targeting the mapk–ras–raf signaling pathway in cancer therapy. Exp Opin Ther Targets. 2012;16(1):103–119. | ||
Marek L, Ware KE, Fritzsche A, et al. Fibroblast growth factor (fgf) and fgf receptor-mediated autocrine signaling in non-small-cell lung cancer cells. Mol Pharmacol. 2009;75(1):196–207. | ||
SW H, TY K, PG H, et al. Predictive and prognostic impact of epidermal growth factor receptor mutation in non-small-cell lung cancer patients treated with gefitinib. J Clin Oncol. 2005;23(11):2493–2501. | ||
Pao W, Chmielecki J. Rational, biologically based treatment of egfr-mutant non-small-cell lung cancer. Nat Rev Cancer. 2010;10(11):760–774. | ||
Yanagawa N, Tamura G, Oizumi H, Endoh M, Sadahiro M, Motoyama T. Inverse correlation between egfr mutation and fhit, rassf1a and runx3 methylation in lung adenocarcinoma: relation with smoking status. Anticancer Res. 2011;31(31):1211–1214. | ||
Phillips JJ. Novel therapeutic targets in the brain tumor microenvironment. Oncotarget. 2012;3(5):568–575. | ||
Iozzo RV, Schaefer L. Proteoglycans in health and disease: novel regulatory signaling mechanisms evoked by the small leucine-rich proteoglycans. FEBS J. 2010;277(19):3864–3875. | ||
Theocharis AD, Skandalis SS, Neill T, et al. Insights into the key roles of proteoglycans in breast cancer biology and translational medicine. Biochim Biophys Acta. 2015;1855(2):276–300. |
 © 2016 The Author(s). This work is published and licensed by Dove Medical Press Limited. The full terms of this license are available at https://www.dovepress.com/terms.php and incorporate the Creative Commons Attribution - Non Commercial (unported, v3.0) License.
By accessing the work you hereby accept the Terms. Non-commercial uses of the work are permitted without any further permission from Dove Medical Press Limited, provided the work is properly attributed. For permission for commercial use of this work, please see paragraphs 4.2 and 5 of our Terms.
© 2016 The Author(s). This work is published and licensed by Dove Medical Press Limited. The full terms of this license are available at https://www.dovepress.com/terms.php and incorporate the Creative Commons Attribution - Non Commercial (unported, v3.0) License.
By accessing the work you hereby accept the Terms. Non-commercial uses of the work are permitted without any further permission from Dove Medical Press Limited, provided the work is properly attributed. For permission for commercial use of this work, please see paragraphs 4.2 and 5 of our Terms.