")
Back to Journals » Cancer Management and Research » Volume 12
Identification of FADS1 Through Common Gene Expression Profiles for Predicting Survival in Patients with Bladder Cancer
Authors Jiao F, Sun H, Yang Q, Sun H, Wang Z, Liu M, Chen J
Received 17 March 2020
Accepted for publication 5 August 2020
Published 10 September 2020 Volume 2020:12 Pages 8325—8339
DOI https://doi.org/10.2147/CMAR.S254316
Checked for plagiarism Yes
Review by Single anonymous peer review
Peer reviewer comments 3
Editor who approved publication: Dr Beicheng Sun
Fangdong Jiao, Hao Sun, Qingya Yang, Hui Sun, Zehua Wang, Ming Liu, Jun Chen
Department of Urology, Shandong University Qilu Hospital (Qingdao), Qingdao, People’s Republic of China
Correspondence: Jun Chen
Department of Urology, Qilu Hospital (Qingdao), Cheeloo College of Medicine, Shandong University, 758 Hefei Road, Qingdao, Shandong 266035, China Tel +86 18561810509
Fax +86 532-66850532
Email [email protected]
Purpose: Aim of this study was to identify biomarkers between different grades of bladder cancer (BLCA) and its prognostic value.
Methods: mRNA expression data from GSE32549 and GSE71576 were extracted for further analysis. Differentially expressed genes (DEGs) were identified using GEO2R web tool. Gene ontology (GO) analysis, Kyoto Encyclopedia of Genes and Genomes (KEGG) pathway enrichment analysis and protein–protein interaction (PPI) network were conducted to explore the function and relationship of DEGs. The Cancer Genome Atlas (TCGA) database was used for external validation and Gene set enrichment analysis (GSEA) analysis was used to further identify FADS1 pathways. Bladder cancer cells and patient specimens were used to further demonstrate the function of FADS1.
Results: Datasets from GEO identified a panel of DEGs. Functional enrichment analysis highlighted that DEGs were associated with nuclear division, spindle, cell cycle and p53 signaling pathway. External validation from TCGA demonstrated that FADS1 was an independent prognostic marker in BLCA patients. In cell lines and tumor specimen analysis, FADS1 was overexpressed in the tumor specimen, compared with adjacent tissues, and positively correlated with tumor grade of BLCA. Moreover, FADS1 could enhance the proliferation ability and influence cell cycle of bladder cancer cells.
Conclusion: FADS1 was an independent prognostic biomarker for BLCA and could confer the bladder cancer cells increased proliferation ability.
Keywords: FADS1, bioinformatics, bladder cancer, TCGA, proliferation
Introduction
Bladder cancer (BLCA) is the 10th most common form malignancy, with an estimated about 549,393 new cases and 199,922 deaths per year worldwide.1 BLCA is more common in men than in women, the respective incidence and mortality among men is reported to be approximately fourfold that among women. Among the urogenital system cancers, BLCA ranked second both in incidence and mortality.1 Approximately 75% patients with BLCA present with non-muscle-invasive bladder cancer (NMIBC) which include Ta, T1 and Cis tumor stage and 25% as muscle-invasive bladder cancer (MIBC) which include T2-T4 tumor stage.2 NIMBC is rarely lethal compare to MIBC, but up to 70% patients with NIMBC will recur, 10–15% will progress to MIBC and 5-year survival rate is about 90%.2,3 As for MIBC, the 5-year survival rate is less than 50%.3
Current European Association of Urology (EAU) recommendations that evaluation of grading in BLCA could use both the 1973 World Health Organization (WHO) and the 2004/2006 WHO classifications.4 With the improvement in 2004 system, the grading of tumor could be classified into three kinds: papillary urothelial neoplasms with low malignant potential (PUNLMP), low grade (LG) and high grade (HG). This change could standardize the uniform terminology for both pathologists and urologists.5,6 It has been demonstrated that tumor grade is an important predictor of BLCA prognosis.7 Precise prediction of prognosis is important for patients to determine appropriate therapy and individual follow-up plan. Despite comprehensive gene expression screening and landscape of molecular alternations have been explored for decades, there are still no reliable biomarkers for early detection or prognosis of BLCA.8
Fatty acid desaturase 1 (FADS1) is a member of the fatty acid desaturase gene family.9 Recent studies have demonstrated that FADS1 plays an essential role in fatty acid metabolism by regulating hepatic fatty acid deposition by altering gene transcription and lipid composition.10 More evidence had revealed that fatty acid metabolism has been associated with tumorigenesis and progression.11,12 Wang et al reported decreased FADS1 is correlated to the larger tumor size, poorer tumor differentiation and shorter overall survival (OS) in non-small-cell lung cancer.13 And reduced FADS1 expression could predict a poor prognosis in esophageal squamous cell carcinoma.14 However, the correlation between the expression level of FADS1 and BLCA prognosis has not been investigated.
With the development of high-throughput sequencing technology and established. The Cancer Genome Atlas (TCGA) program to map the genome expression profiles. In this study, we identified differentially expressed genes (DEGs) between different grade BLCA groups, and evaluated the prognosis value. Thus, we identified FADS1 is an independent prognostic factor for predicting OS in patients with BLCA.
Materials and Methods
Microarray Data
The gene expression profiles of GSE32549 and GSE71576 were obtained from the National Center of Biotechnology Information (NCBI) GEO database (GEO, http://www.ncbi.nlm.nih.gov/geo/). The GSE32549, which was based on GPL6947 Illumina HumanHT-12 V3.0 expression beadchip was uploaded by Lindgren D et al. The GSE71576, which was based on GPL6244 Affymetrix Human Gene 1.0 ST Array was uploaded by Pineda S et al. Totally 56 G1 and G2 bladder cancer samples and 75 G3 bladder cancer samples were enrolled in GSE32549, while 25 G1 and G2 bladder tumor samples and 17 G3 bladder tumor samples were enrolled in GSE71576.
Data Processing and Identification of DEGs
GEO2R was performed to analyze the raw data of microarrays and identify DEGs by comparing two groups (G3 vs G1/G2) of samples (https://www.ncbi.nlm.nih.gov/geo/geo2r/). The fold change (FC) >2 (|log2FC| ≥1) and adj.P.Values <0.05 were used as the threshold to identify DEGs. Volcano plots and heat maps were generated using the R software package ggplot2 and pheatmap, respectively. The Funrich software was used to analyze the overlapping components.
Functional and Pathway Enrichment Analysis
As previously described,15 The clusterProfiler package was used to perform Gene ontology (GO) analysis and Kyoto Encyclopedia of Genes and Genomes (KEGG) pathway enrichment analysis. An FDR of < 0.05 was used as the cut-off value.
Protein–Protein Interaction (PPI) Network Construction
PPI network analysis is essential to identify the interaction among DEGs. The online Search Tool the Retrieval of Interacting Genes (STRING) database (http://www.string-db.org)16 and Cytoscape software17 (Version 3.4.0, http://www.cytoscape.org/) were used to reconstruct a PPI network. The network view summarizes the network of predicted associations for DEGs. The cut-off criterion of interaction confidence score was set as >0.4. The important nodes and hub genes in the network were predicted and explored by CytoHubba, a plugin of Cytoscape, and the top 10 genes were selected from the results of each method.
Validation of the Hub Genes in TCGA Database
The gene expression profiles and clinical data of patients with BLCA using the Illumina RNA Sequencing method were extracted from the TCGA data portal (https://tcgadata.nci.nih.gov/tcga/). The Kaplan–Meier method was used to evaluate the survival rates in different groups, and Kaplan‐Meier curves for different genes in high and low tumor grade groups were plotted using the “survfit” function from the R package “survival”. Calculated using the “survdiff” function, the equivalences of the survival curves were tested by Log rank tests, and a p-value of <0.05 was considered statistically significant.
Gene Set Enrichment Analysis (GSEA) Analysis
GSEA was used to further understand FADS1-related pathways. The expression level of FADS1 was used as the phenotype annotation and BLCA patients in the TCGA cohort were dichotomized into low and high categories based on the median expression value of FADS1. GSEA version 3.0 software (www.broadinstitute.org/gsea) was used to analyze data. The Molecular Signatures Database (MSigDB) of c2 (c2.cp.kegg. v6.2.symbols.gmt) was used to assess the functional differences between the low and high FADS1 expression groups.18,19 FDR < 0.01 was used as the cut-off criteria.
Cell Culture
All cells were obtained from ATCC. T24, 5637 and 253J cells were cultured in RPMI-1640 medium (Gibco) containing 10% FBS (Gibco). RT4 cells were cultured in McCoy 5A (Gibco) with 10% FBS, and SV-HUC-1 cells were cultured in F12K medium (Gibco) with 10% FBS.
Plasmid DNA Transfection and RNA Interference
Cells at 70% confluency were transfected with over-expressed FADS1 vector. Cell at 30% confluency were transfected with siRNA. siFADS1-1: 5ʹ-CCGACATCATCCACTCACTAA-3ʹ,siFADS1-2:5ʹ-GTCCGCTTCTTCCTCACTTAT-3ʹ. The transfection assay was conducted with Lipofectamine 2000 (Invitrogen) reagent according to the manufacturer’s protocol.
Cell Proliferation and Colony Formation Assays
Cell proliferation assay was carried out by using the MTT (3-(4,5-dimethyl-2-thiazolyl)-2,5-diphenyl-2-H-tetrazolium bromide) assay. In brief, cells were seeded in 96-well cell culture plate overnight for attachment. And MTT regent solution was added into each well and incubated for 4 hours at 37°C. The cells were re-suspended in 100μL DMSO and the absorbance was determined at wavelength 570nm using microplate reader.
For colony formation assay, 1×10³ cells were planted into each well of six-well plate at 37°C for 10–14 days. Colonies were fixed with methanol and stained by Giemsa. Colonies which were containing more than 50 cells were counted as one.
RNA Isolation and Quantitative RT-PCR
RNA isolation and quantitative RT-PCR (qRT-PCR) were performed according to the manufacturer’s instruction. The cDNA was reverted by using RevertAid Reverse Transcriptase (Thermo) according to the manufacturer’s instructions. qRT-PCR was performed by FastStart Essential DNA Green Master (Roche). GAPDH was used as an internal reference.
Western Blot and Antibodies
Cells were lysed in RIPA buffer (Beyotime). The samples were boiled at 95°C for 5 minutes. The proteins were separated by 10% SDS-PAGE gel, and transferred onto PVDF membranes by electroblotting for 60 minutes. The blots were blocked with containing 5% non-fat dry milk for 1 h at room temperature and then incubated at 4°C overnight with primary antibodies. After incubation secondary antibody at room temperature for at least 1 hour, the blots were detected by ECL and visualized by hyperfilm ECL film. The primary antibodies were against FADS1 (1:1000, Proteintech, 10627-1-AP), and Actin (1:2000, Proteintech, 20536-1-AP).
Patients and Tumor Samples
Five bladder cancer and paired adjacent tissue samples were obtained from surgically removed tissues. And the pathology was confirmed as urothelial bladder cancer. All clinical experiments in our study were conducted in accordance with the Declaration of Helsinki. This study was approved by the Institutional Ethics Committee of Shandong University Qilu Hospital (Qingdao) (KYLL-2019010), and informed consent was obtained from each patient.
Immunohistochemistry (IHC) Analysis
Slides were incubated in xylene and different concentrations of ethanol, and antigen retrieval was performed. The slides were then blocked with hydrogen peroxide for 30 min and 5% goat serum for 1 hour. The tissues were incubated with primary antibody against FADS1 at 4°C overnight, and then a biotinylated secondary antibody and ABC Peroxidase Staining Kit (ZSGB-Bio) were used to examine FADS1, then the tissues were stained with haematoxylin.
EdU Incorporation Assay
EdU (5-ethynyl-2ʹ-deoxyuridine) incorporation assay was performed using the Cell-Light EdU DNA Cell Proliferation Kit (RIB-Bio) according to the manufacturer’s instructions.
Flow Cytometry Analysis
For cell cycle assay, the cells were collected by trypsin and fixed with 75% cold ethanol overnight at −20°C, then the samples were washed with PBS once and stained with propidium iodide and RNase for 15 min at room temperature. The cell cycle distribution was analyzed by flow cytometry.
Statistical Analysis
The Statistical Package for Social Science (SPSS version 23.0) program was performed in this study. And the Cox proportional hazards regression model was applied in univariate and multivariate analyses. Correlation analysis was assessed by using chi-square test and Pearson’s correlation coefficient test. The two-tailed p-value was used in this study, and a p-value of <0.05 considered statistically significant (* p< 0.05, ** p< 0.01, *** p<0.001 and **** p<0.0001).
Results
Identification of DEGs and Heat Map Clustering Analysis
Gene expression profiles from GSE32549 and GSE71576 were conducted to analyze DEGs by using GEO2R tool. Genes were considered as DEGs according to their log2FC and adj.P.Values. The results showed that 251 genes (152 up-regulated and 99 down-regulated genes) were identified to be differentially expressed in GSE32549, and 255 genes (181 up-regulated and 74 down-regulated genes) differentially expressed in GSE71576 (Figure 1A–D). We conducted an overlapping analysis to clarify the exactly down-regulated or up-regulated DEGs. As shown in Figure 1E, a total of 99 DEGs were identified to be associated with BLCA tumor grade in two datasets, with 29 down-regulated and 70 up-regulated overlapped DEGs.
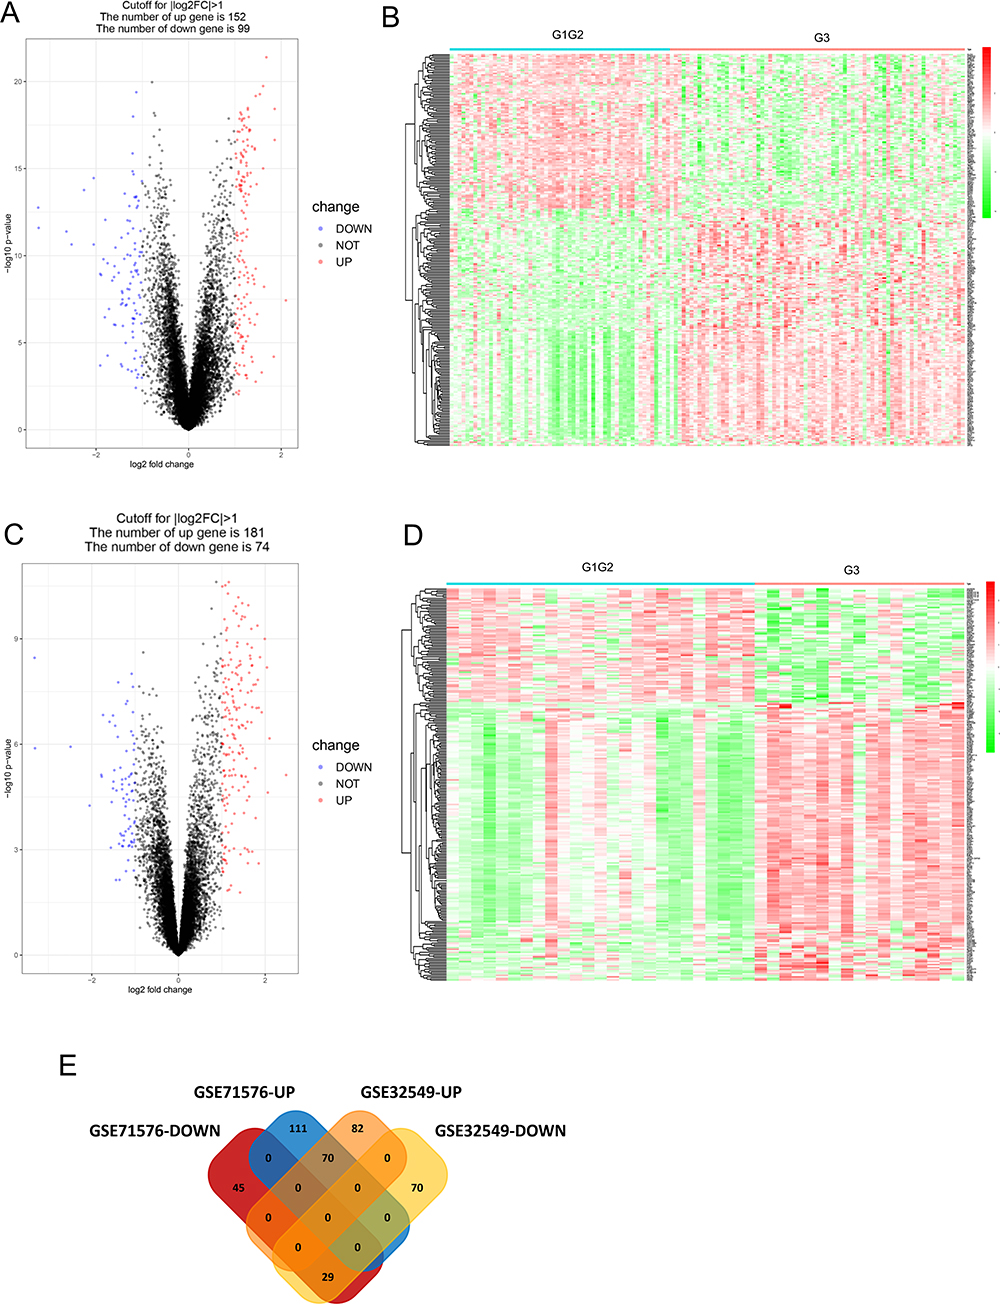 |
Figure 1 Identification of expression differences between high grade and low grade tumors. (A) Volcano plot of the differential mRNA expression analysis in GSE32549. (B) Heat-map overview of the differentially expressed genes in GSE32549. Red: up-regulation; Green: down-regulation. (C) Volcano plot of the differential mRNA expression analysis in GSE71576. (D) Heat-map overview of the differentially expressed genes in GSE71576. Red: up-regulation; Green: down-regulation. (E) The result of Venn diagram. The cross areas represented the commonly changed DEGs. |
GO and Signaling Pathway Enrichment Analysis of DEGs
Then, 99 co-DEGs were used for further GO and KEGG pathway enrichment analysis. GO analysis included three different domains, named biological process (BP), cellular component (CC) and molecular function (MF). First, we analyzed all co-DEGs, genes associated with BP were mainly involved in nuclear division. The most aspects of CC were related to spindle and chromosome region. Moreover, DEGs in MF were significantly enriched in histone kinase activity (Figure 2A). Then we analyzed 70 up-regulated DEGs, and genes associated with BP, CC and MF were mainly involved in chromosome segregation, spindle and chromatin binding, respectively (Figure S1A).
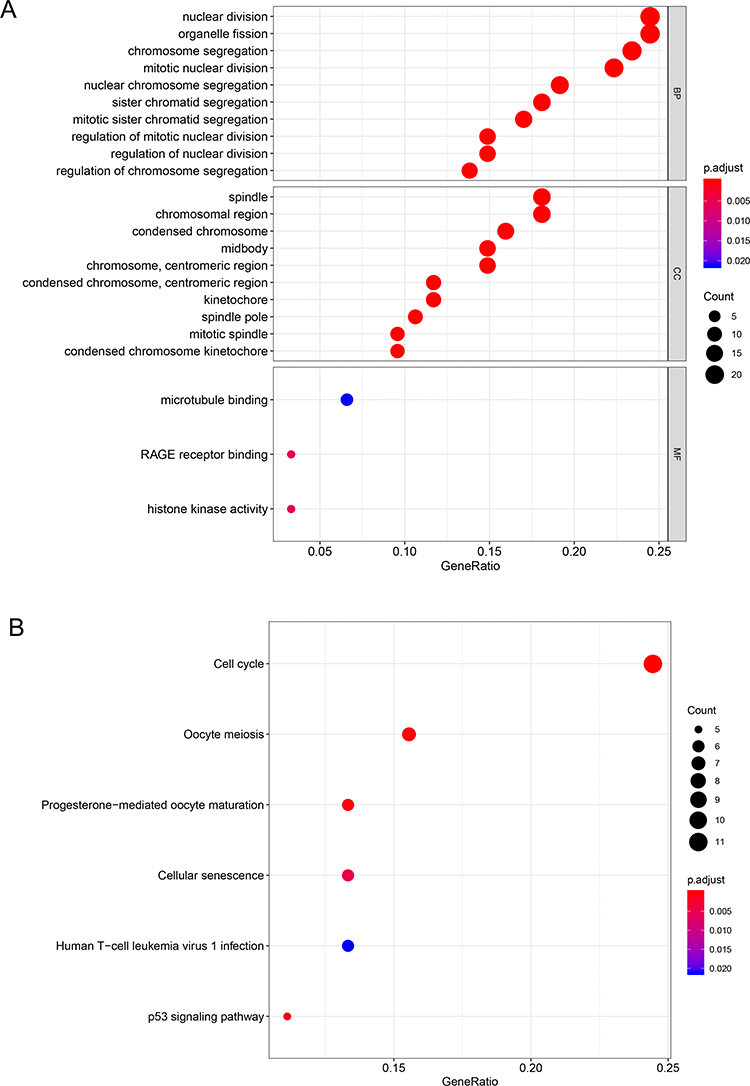 |
Figure 2 The functional analysis of integrated DEGs. (A) Gene Ontology analysis and significant enriched GO terms related to DEGs. (B) KEGG pathway enrichment terms related to DEGs. |
The KEGG pathway enrichment analysis was conducted to further investigate the functional implication of DEGs. As shown in Figure 2B, DEGs were enriched in several tumor-related pathways. The most significantly enriched key pathway was cell cycle. Cellular senescence and p53 signaling pathway are also important pathways between different grades of bladder cancer. Meanwhile, KEGG enrichment analysis including 70 DEGs showed that cell cycle, cellular senescence and p53 signaling pathway were highly associated with up-regulated DEGs (Figure S1B).
PPI Networks Construction and Cluster Identification
To clarify the interaction of DEGs data, PPI network construction was conducted by using STRING database and visualized using Cytoscape software. The PPI network included 98 nodes and 1422 interactions (Figure 3). The top 10 hub nodes were identified, including CDKN3, ANLN, MELK, BUB1, CCNB2, NEK2, MAD2L1, CEP55, CDK1, UBE2C.
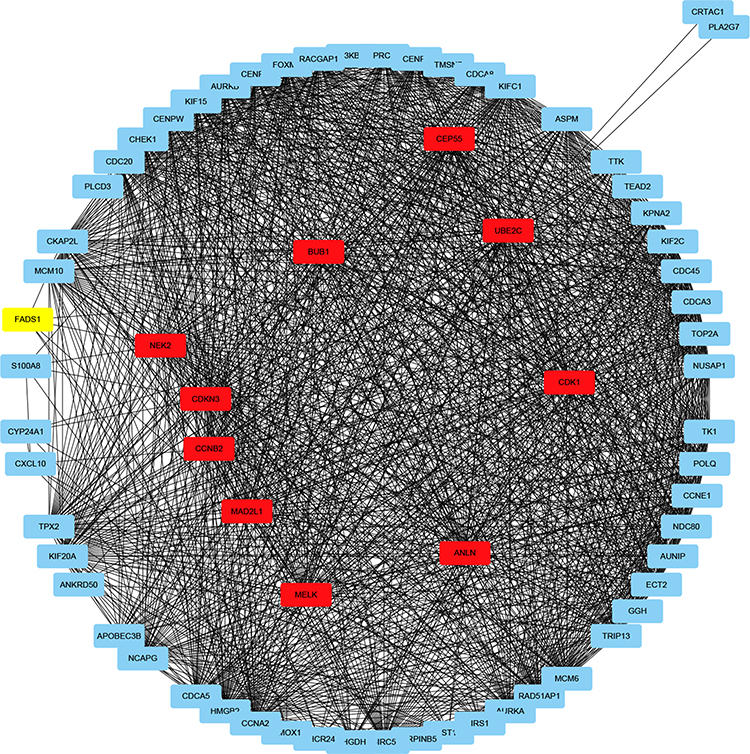 |
Figure 3 DEGs were analyzed and constructed a PPI network. Red nodes represent the top 10 hub genes. |
External Validation of the Genes in TCGA
We further analyze 99 overlapped DEGs by using the TCGA database. The clinicopathologic characteristics of 405 patients were shown in Supplementary Table 1. The median age (range) of BLCA patients in TCGA was 68.08 (50–90). One hundred and six patients were female and 299 were male. Tumor grade was low in 21 patients and high in 384. Patients of clinical stage from I to IV were 2, 129, 139, 135, respectively. Kaplan-Meier plotter was applied to evaluate the prognostic value of DEGs, the results showed that 14 DEGs were associated with overall survival for BLCA patients (Supplementary Table 2). The Kaplan-Meier plotter of top 5 DEGs were shown in Figure 4. Low expression level of FADS1 and TM4SF1 was associated with longer OS, while high expression level of CRTAC1, HSD17B2 and MST1R was associated with longer OS. As shown in Figure 5 and Supplementary Table 3, FADS1 and TM4SF1 expression level was up-regulated in high grade, while CRTAC1, HSD17B2 and MST1R expression levels were down-regulated in high grade.
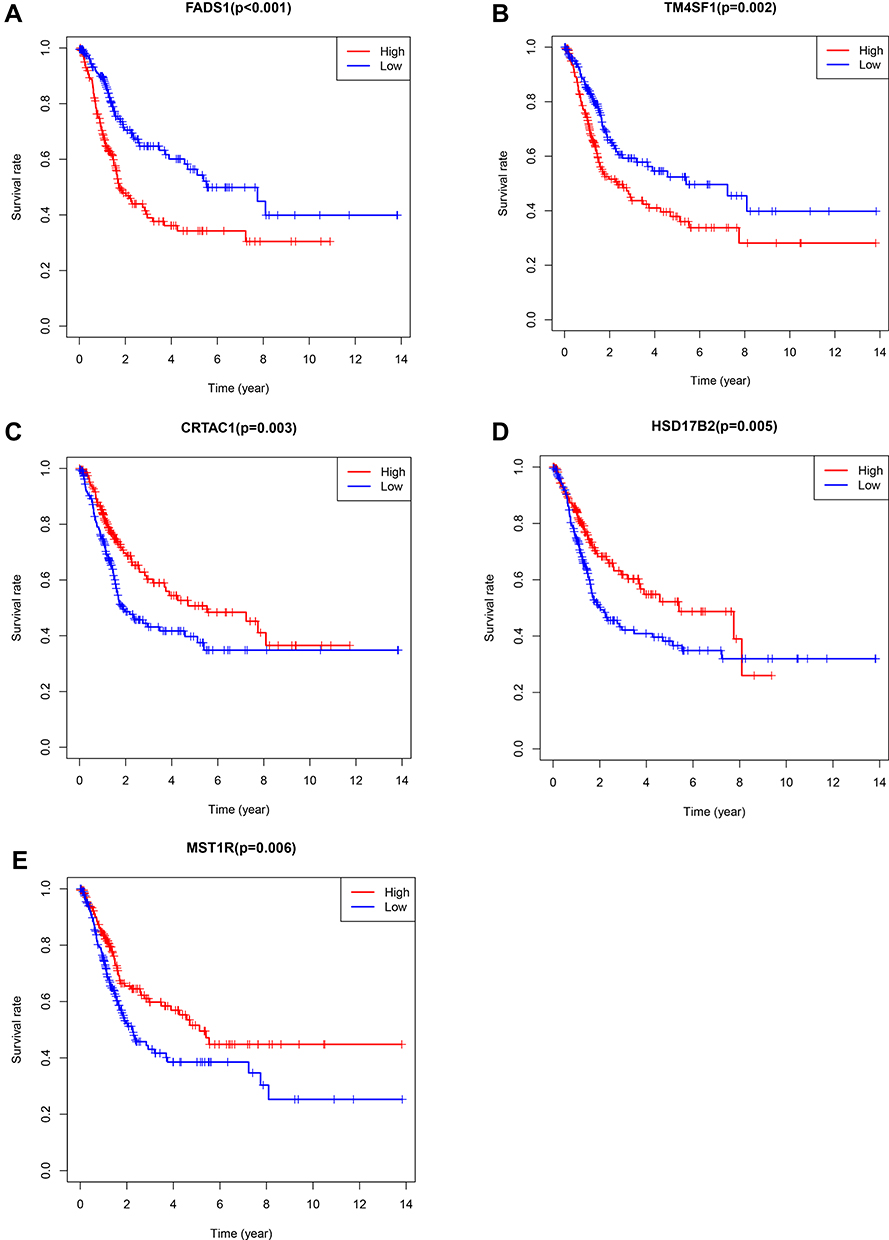 |
Figure 4 Kaplan–Meier plotters and Log rank tests for validation the prognostic value of top 5 DEGs by TCGA database. (A) FADS1; (B) TM4SF1; (C) CRTAC1; (D) HSD17B2; (E) MST1R. |
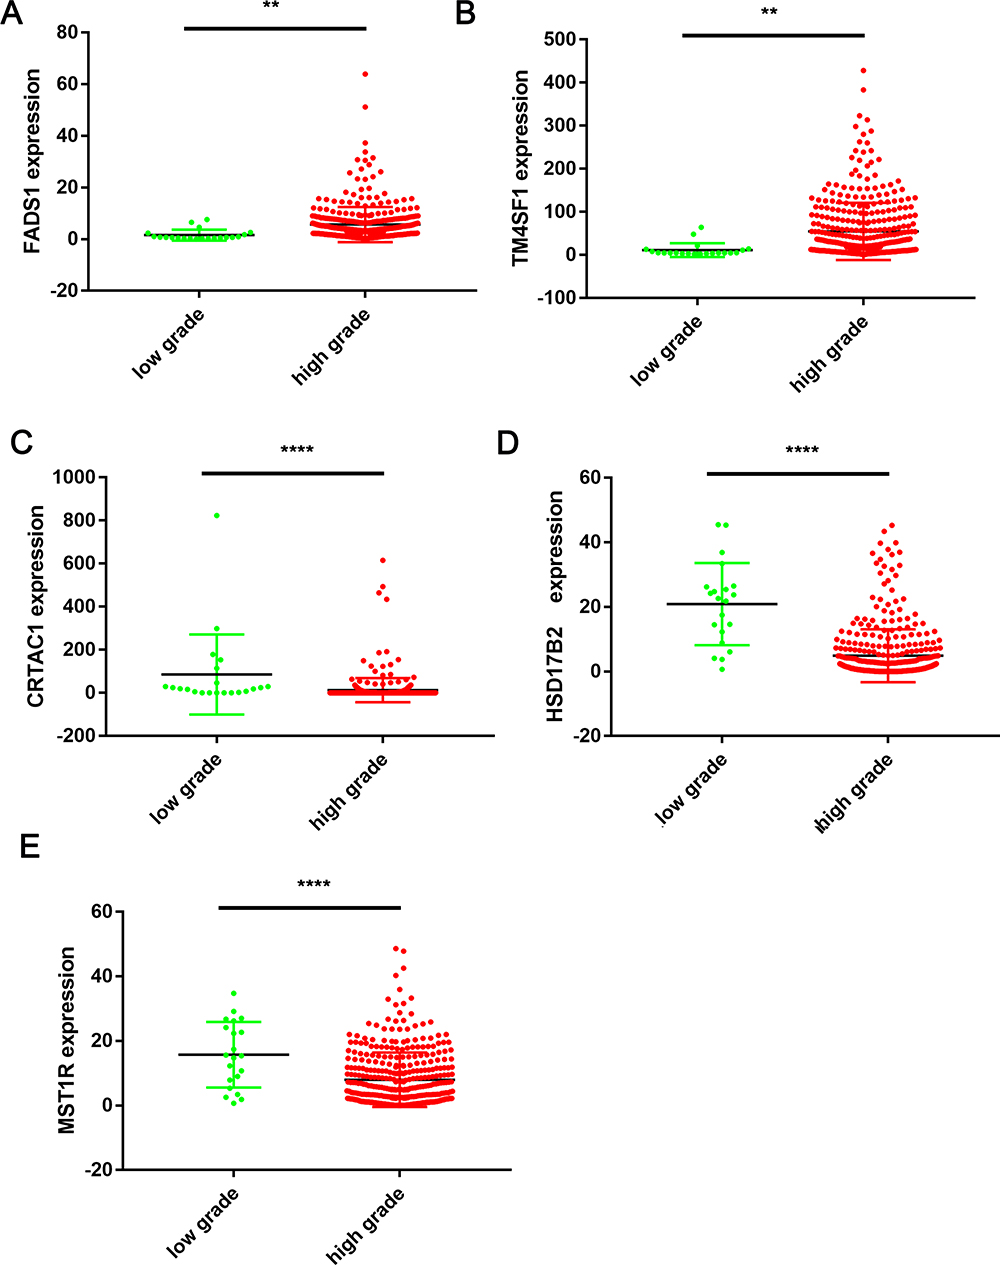 |
Figure 5 Top 5 DEGs expression levels in TCGA database between low grade and high grade BLCA tissues. (A) FADS1 (LG (Mean ± SEM): 1.601 ± 0.4624; HG (Mean ± SEM): 5.679 ± 0.3447; (B) TM4SF1 (LG (Mean ± SEM): 11.3 ± 3.483; HG (Mean ± SEM): 55.45 ± 3.411); (C) CRTAC1 (LG (Mean ± SEM): 85.54 ± 40.5; HG (Mean ± SEM): 12.54 ± 2.837); (D) HSD17B2 (LG (Mean ± SEM): 20.91 ± 2.782; HG (Mean ± SEM): 4.88 ± 0.4152); (E) MST1R (LG (Mean ± SEM): 15.74 ± 2.216; HG (Mean ± SEM): 7.921 ± 0.4288); **p < 0.01, ****p<0.0001, based on student’s t-test. |
In univariate analysis, no survival difference was found in gender and CRTAC1 expression level. Age, tumor stage, FADS1, TM4SF1, HSD17B2 and MST1R expression level were significantly associated with OS in BLCA patients (Supplementary Table 4). To clarify the independent prognostic value of FADS1, multivariate Cox hazards regression analysis revealed that FADS1 was an independent predictor for OS (hazard ratio [HR]=1.03, 95% confidence interval [CI], 1.01–1.05, p=0.014) (Figure 6A, Supplementary Table 4).
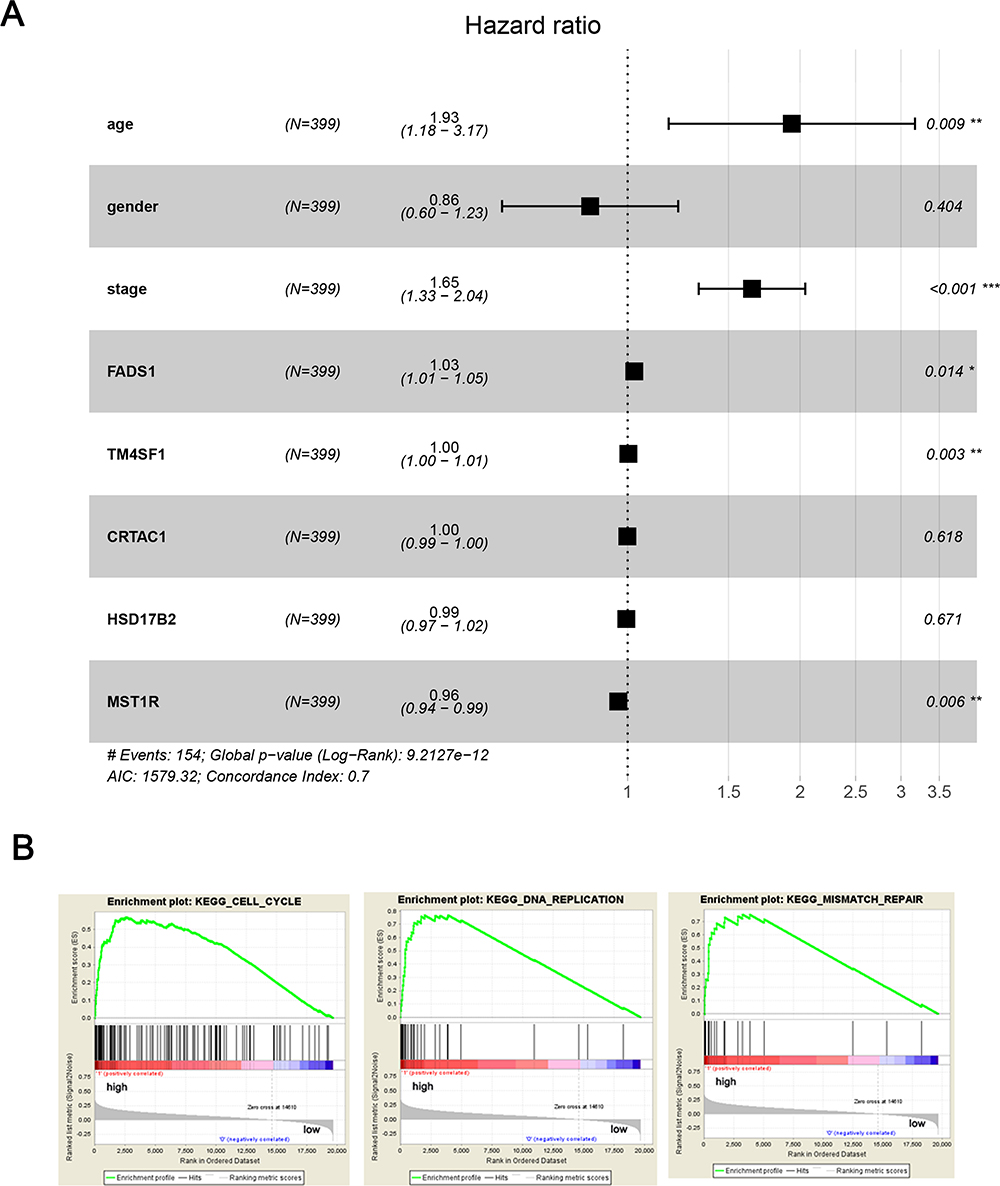 |
Figure 6 The prognostic value and three most significant enrichment of FADS1. (A) The multivariate Cox hazards regression analyses. (B) GSEA plot showed FADS1 expression associated with cell cycle-related, DNA replication and mismatch repair processes; *p < 0.05; **p < 0.01, ***p<0.001. |
Identification of FADS1 Associated Biological Pathways
To determine biologic characteristics according to the different FADS1 expression levels by GSEA analysis, a robust computational method that determines whether the defined set of genes shows statistically significant differences. Cell cycle-related, DNA replication and mismatch repair biological processes and pathways were significantly enriched (Figure 6B), indicating that FADS1 have a potential marked influence on these biological processes and pathways in BLCA.
FADS1 is Overexpressed and Positively Correlated with the Tumor Grade in BLCA
To assess the roles of FADS1 in BLCA, the expression level of FADS1 was detected in five human bladder cancer cell lines, T24 (grade 3), 253J (grade 3), 5637 (grade 2), RT4 (grade 1), and an immortalized human urothelial cell, SV-HUC-1. As shown in Figure 7A and B, FADS1 protein level and mRNA level had a similar tendency, highest expression in T24 and 253J, and lowest expression in SV-HUC-1. Moreover, immunohistochemistry staining was used to examine the FADS1 expression level in tumor specimens. Only 2 low grade and 3 high-grade tumor and adjacent tissues were collected. FADS1 staining intensity seemed positively associated with tumor stage (Figure 7C and D). Together, these results showed FADS1 is overexpressed in BLCA, and its mRNA and protein expression level are positively associated with tumor grade.
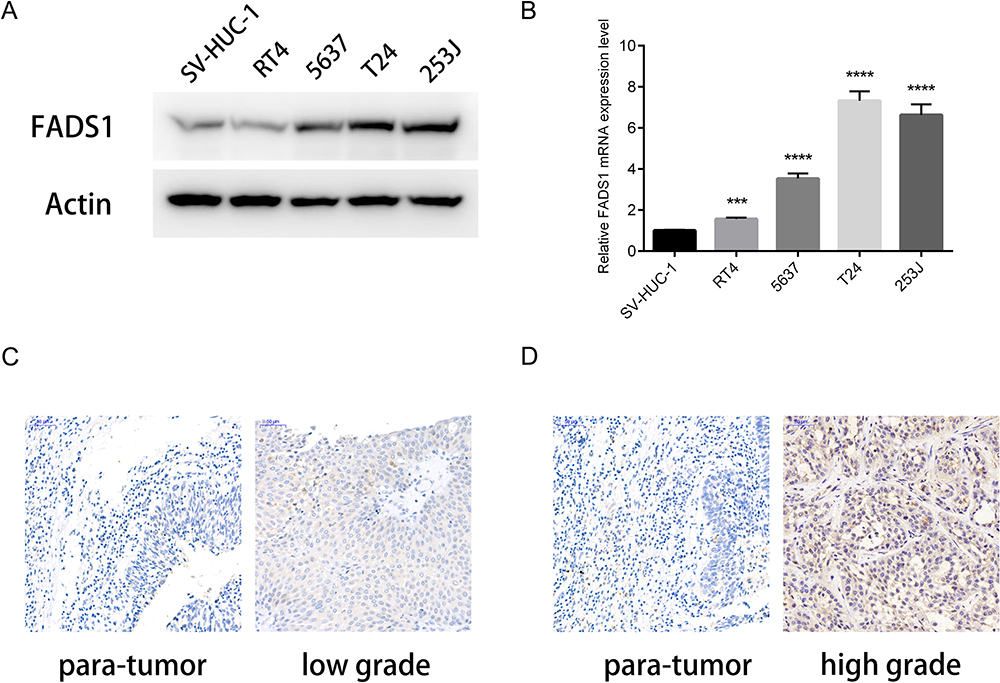 |
Figure 7 FADS1 expression positively correlated with tumor grade in BLCA. (A) The protein expression levels were determined by Western blot. (B) The mRNA expression levels were determined by RT-PCR. (C, D) Representative staining of FADS1 in BLCA tissue by IHC. C. low grade of BLCA and its para-tumor tissue; D. high grade of BLCA and its para-tumor tissue. ***p<0.001, ****p<0.0001, based on student’s t-test. |
FADS1 Promotes Proliferation in BLCA Cells
MTT and colony formation assays showed that over-expressed FADS1 increased, while FADS1 knockdown decreased cell proliferation ability (Figure 8A–E and Figure S2A–B). Consistently, EdU incorporation assay showed the role of FADS1 in proliferation (Figure 8F and G; Figure S2C–D). Cell cycle measured by flow cytometry showed that over-expressed FADS1 did not significantly influence the cell cycle. However, the FADS1 knockdown cells were markedly arrested at the G1 phase (Figure 8H and I; Figure S2E–F). Taken together, these results indicated that FADS1 could influence tumor growth by arresting cell cycle.
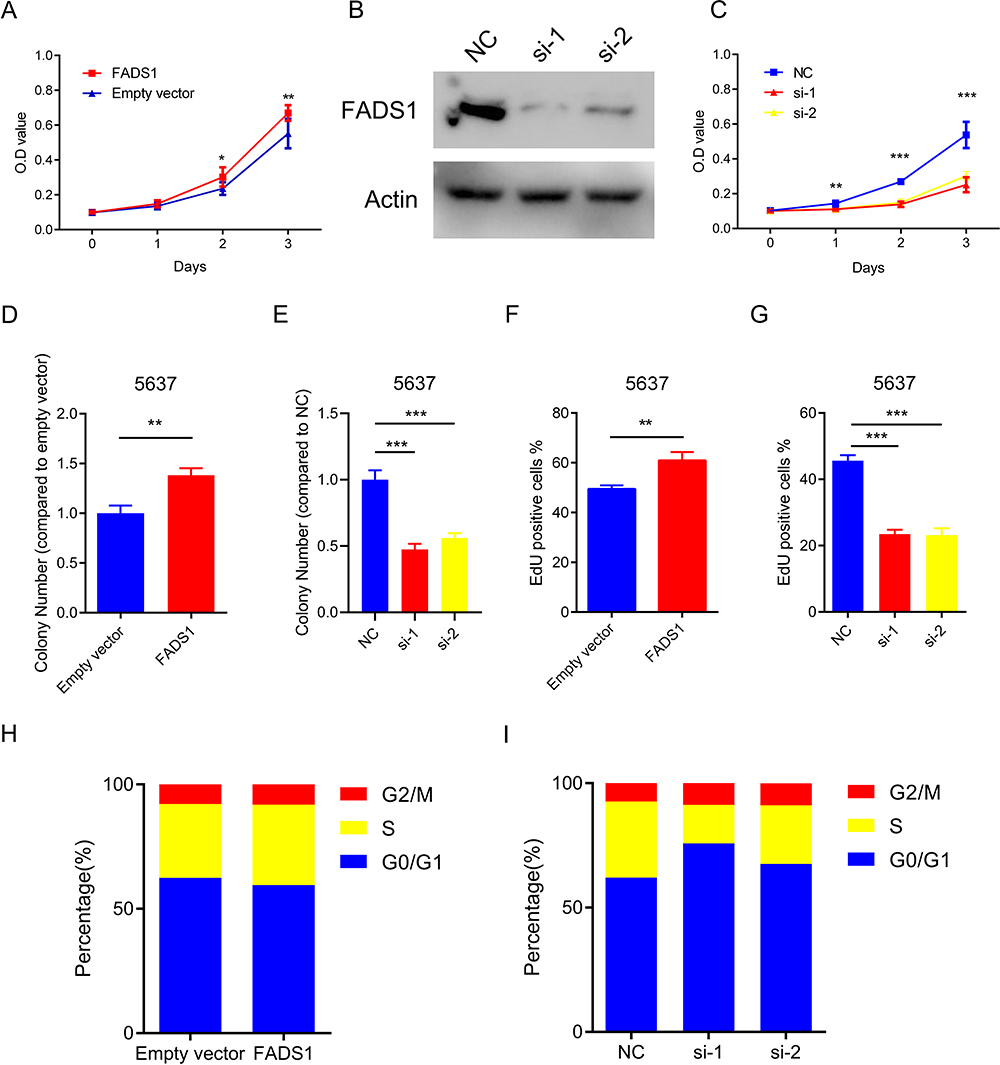 |
Figure 8 FADS1 promotes proliferation in BLCA cells. (A) Cell survival of 5637 cells was assessed with MTT assay for 0, 1, 2 and 3 days. (B) The protein expression levels of FADS1 by siRNA interference in 5637 cells were determined by Western blot. (C) Cell survival of 5637 cells was assessed with MTT assay for 0, 1, 2 and 3 days. (D, E) Colony-formation assays were conducted to determine the proliferation ability of FADS1. Data are mean ± SD values from three experiments, each performed in triplicate. (F, G) EdU assays were performed to examine the proliferation ability of FADS1. Data are mean ± SD values from three experiments. (H, I) Cell cycle analysis was determined by flow cytometry. *p < 0.05; **p < 0.01, ***p<0.001. |
Discussion
In the present study, we first performed a bioinformatics analysis to explore the potential crucial genes associated with tumor grade and prognosis of BLCA. Two GEO datasheets were used to analyze DEGs by GEO2R, 70 up-regulated and 29 down-regulated DEGs were found in both databases. GO and KEGG analysis showed cell proliferation could play an important role in different tumor grades. Meanwhile, TCGA database was used for external validation, and survival analysis revealed that high-level expression of FADS1 was associated with poor prognosis of BLCA patients. And multivariate Cox analysis revealed that FADS1 was an independent predictor for OS in BLCA. To further explore the function of FADS1 in BLCA, over-expressed and knockdown FADS1 cells were used to determine the changes in proliferation ability, and knockdown FADS1 significantly arrested cell cycle at the G1 phase.
BLCA is a highly immunogenic malignant tumor,20 and high tumor grade is strongly associated with poor prognosis (especially progression-free survival and cancer-specific survival).4,21 Cell cycle is a highly conserved process which is essential for mammalian cell growth and development. Loss of normal cell-cycle control is a hallmark of human cancer.22 Chromosomal aberrant segregation or instability correlates with poor prognosis in various tumors, suggesting that genetic abnormalities contribute to tumorigenesis and progression.23 Recently, more evidence had demonstrated that fatty acid metabolism was associated with cancer cell proliferation, and caused various abnormalities, and the consumption of dietary lipids had been regarded as a kind of cancer risk factor.24,25 Multiple genes within the pathway of fatty acid metabolism could influence cancer initiation and progression.26–28
FADS1 was first cloned in 1999 for the first time and identified on chromosome 11q12-11q13.1 cluster in the human genome in 2000.29 And FADS1 was mainly focused on its polymorphisms, and could alter fatty acid profiles or desaturase activity. FADS1 cluster showed a strong association with the n-6 and n-3 fatty acids in an analysis of single nucleotide polymorphisms (SNPs) of the FADS1 gene cluster,30 and Genome wide association studies (GWAS)31–33 have associated lower blood concentrations of LC-PUFAs with minor alleles of SNPs in the FADS1-FADS2 genes. Also, FADS minor alleles might present a lower desaturase activity. Meanwhile, the well-known biological function of FADS1 is a rate-limiting enzyme in the biosynthesis of long-chain polyunsaturated fatty acids (LC-PUFA) precursors of eicosanoids.34,35 And it has been reported that FADS1 is associated with risk of metabolic syndrome (MetS). FADS1 and its homolog FADS1 variants located on chromosome 11q12-11q13.1 are likely to be linked to variations in serum phospholipids and erythrocyte membranes.36 And aberrant FADS1 expression caused a variety of diseases, such as asthma, osteoarthritis, type 1 diabetes et al.37–39
Despite the functions of FADS1 in metabolism were explored deeply, the functions in tumorigenesis and progression were poorly understood. It’s well known that the gene could act as a totally opposite function in different sites of the body. FADS1 was reported as an oncogene in osteosarcoma, and involved in linc00460, miR-1224-5p and FADS1 axis.40 Moreover, Tang et al clarified that FADS1 was downregulated in both human vitiligo samples and vitiligo PIG3V melanocytes, and downregulation of FADS1 could reduce proliferation, induce reactive oxygen species (ROS) generation, apoptosis and cell cycle arrest in G1 stage.41 A recent study has reported that FADS1 could activate AKT/mTOR signaling pathway to promote the progression of laryngeal squamous cell carcinoma.42 However, FADS1 was identified as a tumor suppressor gene in non-small-cell lung cancer (NSCLC) and esophageal squamous cell carcinoma.13,14 Decreased FADS1 expression correlated with a poor prognosis in esophageal squamous cell carcinoma and NSCLC patients. We identified FADS1 as an oncogene in BLCA patients, high expression level in tumor tissue, compared to the normal tissue. Meanwhile, FADS1 expression level was related to the tumor grade of BLCA. The FADS1 expression level could influence the cell proliferation ability and cell cycle. Thus, we speculate that FADS1 could be a causative effect in bladder carcinogenesis.
We hypothesize some possible mechanisms of FADS1 exerting its function. First, FADS1 could influence PUFA metabolites, including arachidonic acid (AA), and eicosapentaenoic acid (EPA), dihomo-gamma-linolenic acid (DGLA) and docosahexaenoic acid (DHA), which play an important role of inflammatory and tumor progression. AA could promote tumor progression through its metabolite, prostaglandin E2 (PGE2), which is highly expressed in various kinds of human malignancies and predicts poor prognosis.43–45 It has been reported that AA/DGLA could be enhanced by upregulated FADS1,42 thus, FADS1 may promote tumor initiation and progression by disrupting the balance of fatty acid metabolism. In addition, several molecular pathways have been identified, such as the linc00460/miR-1224-5p/FADS1 axis and AKT/mTOR signaling pathway.40,42 Thus, the potential mechanisms of FADS1 in BLCA will be explored in further studies.
However, there were several limitations in this study. First, the results above, including exploring the expression level of FASD1 in TCGA and GEO database, detecting FADS1 expression and promoting proliferation ability in vitro, were needed to be validated in vivo experiments, such as subcutaneous tumor model of nude mice, which would be conducted in our further studies. Second, limited cases of patients specimen were collected, and no clinicopathologic characteristics or K-M curves based on follow up were shown in this study, these will be analyzed in further studies.
Conclusion
In conclusion, we identified that FADS1 could be regarded as an independent prognostic factor in BLCA patients, and it could play a significant role in BLCA proliferation. FADS1 might be a potential therapeutic target for BLCA. However, more studies still are needed to further clarify the function of FADS1 in BLCA.
Disclosure
The authors report no conflicts of interest in this work.
References
1. Bray F, Ferlay J, Soerjomataram I, Siegel RL, Torre LA, Jemal A. Global cancer statistics 2018: GLOBOCAN estimates of incidence and mortality worldwide for 36 cancers in 185 countries. CA Cancer J Clin. 2018;68(6):394–424. doi:10.3322/caac.21492
2. Soukup V, Capoun O, Cohen D, et al. Prognostic performance and reproducibility of the 1973 and 2004/2016 World Health Organization grading classification systems in non-muscle-invasive bladder cancer: a european association of urology non-muscle invasive bladder cancer guidelines panel systematic review. Eur Urol. 2017;72(5):801–813. doi:10.1016/j.eururo.2017.04.015
3. Knowles MA, Hurst CD. Molecular biology of bladder cancer: new insights into pathogenesis and clinical diversity. Nat Rev Cancer. 2015;15(1):25–41. doi:10.1038/nrc3817
4. Babjuk M, Bohle A, Burger M, et al. EAU guidelines on non-muscle-invasive urothelial carcinoma of the bladder: update 2016. Eur Urol. 2017;71(3):447–461. doi:10.1016/j.eururo.2016.05.041
5. Epstein JI, Amin MB, Reuter VR, Mostofi FK. The World Health Organization/international society of urological pathology consensus classification of urothelial (transitional cell) neoplasms of the urinary bladder. Bladder consensus conference committee. Am J Surg Pathol. 1998;22(12):1435–1448. doi:10.1097/00000478-199812000-00001
6. Humphrey PA, Moch H, Cubilla AL, Ulbright TM, Reuter VE. The 2016 WHO classification of tumours of the urinary system and male genital organs-part b: prostate and bladder tumours. Eur Urol. 2016;70(1):106–119. doi:10.1016/j.eururo.2016.02.028
7. Sylvester RJ, van der Meijden AP, Oosterlinck W, et al. Predicting recurrence and progression in individual patients with stage Ta T1 bladder cancer using EORTC risk tables: a combined analysis of 2596 patients from seven EORTC trials. Eur Urol. 2006;49(3):466.
8. Choi W, Ochoa A, McConkey DJ, et al. Genetic alterations in the molecular subtypes of bladder cancer: illustration in the cancer genome atlas dataset. Eur Urol. 2017;72(3):354–365. doi:10.1016/j.eururo.2017.03.010
9. Ralston JC, Matravadia S, Gaudio N, Holloway GP, Mutch DM. Polyunsaturated fatty acid regulation of adipocyte FADS1 and FADS2 expression and function. Obesity (Silver Spring). 2015;23(4):725–728. doi:10.1002/oby.21035
10. Wang L, Athinarayanan S, Jiang G, Chalasani N, Zhang M, Liu W. Fatty acid desaturase 1 gene polymorphisms control human hepatic lipid composition. Hepatology. 2015;61(1):119–128. doi:10.1002/hep.27373
11. Carracedo A, Cantley LC, Pandolfi PP. Cancer metabolism: fatty acid oxidation in the limelight. Nat Rev Cancer. 2013;13(4):227–232. doi:10.1038/nrc3483
12. Currie E, Schulze A, Zechner R, Walther TC, Farese RV
13. Wang D, Lin Y, Gao B, et al. Reduced expression of FADS1 predicts worse prognosis in non-small-cell lung cancer. J Cancer. 2016;7(10):1226–1232. doi:10.7150/jca.15403
14. Du Y, Yan SM, Gu WY, et al. Decreased expression of FADS1 predicts a poor prognosis in patients with esophageal squamous cell carcinoma. Asian Pac J Cancer Prev. 2015;16(12):5089–5094. doi:10.7314/APJCP.2015.16.12.5089
15. Yu G, Wang LG, Han Y, He QY. clusterProfiler: an R package for comparing biological themes among gene clusters. OMICS. 2012;16(5):284–287. doi:10.1089/omi.2011.0118
16. Szklarczyk D, Franceschini A, Wyder S, et al. STRING v10: protein-protein interaction networks, integrated over the tree of life. Nucleic Acids Res. 2015;43(Database issue):D447–452. doi:10.1093/nar/gku1003
17. Shannon P, Markiel A, Ozier O, et al. Cytoscape: a software environment for integrated models of biomolecular interaction networks. Genome Res. 2003;13(11):2498–2504. doi:10.1101/gr.1239303
18. Kim M, Kim JH, Jang HR, et al. LRRC3B, encoding a leucine-rich repeat-containing protein, is a putative tumor suppressor gene in gastric cancer. Cancer Res. 2008;68(17):7147–7155. doi:10.1158/0008-5472.CAN-08-0667
19. Vecchi M, Nuciforo P, Romagnoli S, et al. Gene expression analysis of early and advanced gastric cancers. Oncogene. 2007;26(29):4284–4294. doi:10.1038/sj.onc.1210208
20. Gakis G. The role of inflammation in bladder cancer. Adv Exp Med Biol. 2014;816:183–196.
21. Otto W, van Rhijn BW, Breyer J, et al. Infiltrative lamina propria invasion pattern as an independent predictor for cancer-specific and overall survival of instillation treatment-naive stage T1 high-grade urothelial bladder cancer. Int J Urol. 2018;25(5):442–449. doi:10.1111/iju.13532
22. Dominguez-Brauer C, Thu KL, Mason JM, Blaser H, Bray MR, Mak TW. Targeting mitosis in cancer: emerging strategies. Mol Cell. 2015;60(4):524–536. doi:10.1016/j.molcel.2015.11.006
23. Visconti R, Della Monica R, Grieco D. Cell cycle checkpoint in cancer: a therapeutically targetable double-edged sword. J Exp Clin Cancer Res. 2016;35(1):153. doi:10.1186/s13046-016-0433-9
24. How Can I, Life TY. A. A healthy diet and physical activity help reduce your cancer risk. CA Cancer J Clin. 2012;62(1):68–69. doi:10.3322/caac.20139
25. Chen YQ, Edwards IJ, Kridel SJ, Thornburg T, Berquin IM. Dietary fatgene interactions in cancer. Cancer Metastasis Rev. 2007;26(3–4):535–551. doi:10.1007/s10555-007-9075-x
26. Santos CR, Schulze A. Lipid metabolism in cancer. FEBS J. 2012;279(15):2610–2623. doi:10.1111/j.1742-4658.2012.08644.x
27. Khankari NK, Murff HJ, Zeng C, et al. Polyunsaturated fatty acids and prostate cancer risk: aMendelian randomisation analysis from the PRACTICAL consortium. Br J Cancer. 2016;115(5):624–631. doi:10.1038/bjc.2016.228
28. Fuentes NR, Kim E, Fan YY, Chapkin RS. Omega-3 fatty acids, membrane remodeling and cancer prevention. Mol Aspects Med. 2018;64:79–91. doi:10.1016/j.mam.2018.04.001
29. Marquardt A, Stohr H, White K, Weber BH. cDNA cloning, genomic structure, and chromosomal localization of three members of the human fatty acid desaturase family. Genomics. 2000;66(2):175–183. doi:10.1006/geno.2000.6196
30. Schaeffer L, Gohlke H, Muller M, et al. Common genetic variants of the FADS1 FADS2 gene cluster and their reconstructed haplotypes are associated with the fatty acid composition in phospholipids. Hum Mol Genet. 2006;15(11):1745–1756. doi:10.1093/hmg/ddl117
31. Guan W, Steffen BT, Lemaitre RN, et al. Genome-wide association study of plasma N6 polyunsaturated fatty acids within the cohorts for heart and aging research in genomic epidemiology consortium. Circ Cardiovasc Genet. 2014;7(3):321–331. doi:10.1161/CIRCGENETICS.113.000208
32. Lemaitre RN, Tanaka T, Tang W, et al. Genetic loci associated with plasma phospholipid n-3 fatty acids: a meta-analysis of genome-wide association studies from the CHARGE consortium. PLoS Genet. 2011;7(7):e1002193. doi:10.1371/journal.pgen.1002193
33. Dorajoo R, Sun Y, Han Y, et al. A genome-wide association study of n-3 and n-6 plasma fatty acids in a Singaporean Chinese population. Genes Nutr. 2015;10(6):53. doi:10.1007/s12263-015-0502-2
34. Nakamura MT, Nara TY. Structure, function, and dietary regulation of delta6, delta5, and delta9 desaturases. Annu Rev Nutr. 2004;24(1):345–376. doi:10.1146/annurev.nutr.24.121803.063211
35. Glaser C, Heinrich J, Koletzko B. Role of FADS1 and FADS2 polymorphisms in polyunsaturated fatty acid metabolism. Metabolism. 2010;59(7):993–999. doi:10.1016/j.metabol.2009.10.022
36. Sergeant S, Hugenschmidt CE, Rudock ME, et al. Differences in arachidonic acid levels and fatty acid desaturase (FADS) gene variants in African Americans and European Americans with diabetes or the metabolic syndrome. Br J Nutr. 2012;107(4):547–555. doi:10.1017/S0007114511003230
37. Standl M, Sausenthaler S, Lattka E, et al. FADS gene cluster modulates the effect of breastfeeding on asthma. Results from the GINIplus and LISAplus studies. Allergy. 2012;67(1):83–90. doi:10.1111/j.1398-9995.2011.02708.x
38. Wang D, Li M, Wei D, Cai Y, Zhang Y, Xing L. Identification and functional characterization of the delta 6-fatty acid desaturase gene from thamnidium elegans. J Eukaryot Microbiol. 2007;54(1):110–117. doi:10.1111/j.1550-7408.2006.00136.x
39. Nakagawa Y, Kawaguchi Y, Twells RC, et al. Fine mapping of the diabetes-susceptibility locus, IDDM4, on chromosome 11q13. Am J Hum Genet. 1998;63(2):547–556. doi:10.1086/301974
40. Lian H, Xie P, Yin N, et al. Linc00460 promotes osteosarcoma progression via miR-1224-5p/FADS1 axis. Life Sci. 2019;233:116757. doi:10.1016/j.lfs.2019.116757
41. Tang L, Li J, Fu W, Wu W, Xu J. Suppression of FADS1 induces ROS generation, cell cycle arrest, and apoptosis in melanocytes: implications for vitiligo. Aging. 2019;11(24):11829–11843. doi:10.18632/aging.102452
42. Zhao R, Tian L, Zhao B, et al. FADS1 promotes the progression of laryngeal squamous cell carcinoma through activating AKT/mTOR signaling. Cell Death Dis. 2020;11(4):272. doi:10.1038/s41419-020-2457-5
43. Kaminska K, Szczylik C, Lian F, Czarnecka AM. The role of prostaglandin E2 in renal cell cancer development: future implications for prognosis and therapy. Future Oncol. 2014;10(14):2177–2187. doi:10.2217/fon.14.152
44. Abrahao AC, Castilho RM, Squarize CH, Molinolo AA, Dos Santos-Pinto D, Gutkind JS. A role for COX2-derived PGE2 and PGE2-receptor subtypes in head and neck squamous carcinoma cell proliferation. Oral Oncol. 2010;46(12):880–887. doi:10.1016/j.oraloncology.2010.09.005
45. Park A, Lee Y, Kim MS, et al. Prostaglandin E2 secreted by thyroid cancer cells contributes to immune escape through the suppression of natural killer (NK) cell cytotoxicity and NK cell differentiation. Front Immunol. 2018;9:1859. doi:10.3389/fimmu.2018.01859
 © 2020 The Author(s). This work is published and licensed by Dove Medical Press Limited. The full terms of this license are available at https://www.dovepress.com/terms.php and incorporate the Creative Commons Attribution - Non Commercial (unported, v3.0) License.
By accessing the work you hereby accept the Terms. Non-commercial uses of the work are permitted without any further permission from Dove Medical Press Limited, provided the work is properly attributed. For permission for commercial use of this work, please see paragraphs 4.2 and 5 of our Terms.
© 2020 The Author(s). This work is published and licensed by Dove Medical Press Limited. The full terms of this license are available at https://www.dovepress.com/terms.php and incorporate the Creative Commons Attribution - Non Commercial (unported, v3.0) License.
By accessing the work you hereby accept the Terms. Non-commercial uses of the work are permitted without any further permission from Dove Medical Press Limited, provided the work is properly attributed. For permission for commercial use of this work, please see paragraphs 4.2 and 5 of our Terms.