")
Back to Journals » OncoTargets and Therapy » Volume 11
Identification of epigenetically altered genes and potential gene targets in melanoma using bioinformatic methods
Authors Duan HH, Jiang K, Wei DK, Zhang LJ, Cheng DL, Lv M, Xu YB, He AM
Received 18 July 2017
Accepted for publication 4 October 2017
Published 20 December 2017 Volume 2018:11 Pages 9—15
DOI https://doi.org/10.2147/OTT.S146663
Checked for plagiarism Yes
Review by Single anonymous peer review
Peer reviewer comments 3
Editor who approved publication: Dr Jianmin Xu
Honghao Duan, Ke Jiang, Dengke Wei, Lijun Zhang, Deliang Cheng, Min Lv, Yuben Xu, Aimin He
Department of Hand Surgery, Honghui Hospital, Xi’an Jiaotong University Health Science Center, Xi’an, Shaanxi, People’s Republic of China
Abstract: This study aimed to analyze epigenetically and genetically altered genes in melanoma to get a better understanding of the molecular circuitry of melanoma and identify potential gene targets for the treatment of melanoma. The microarray data of GSE31879, including mRNA expression profiles (seven melanoma and four melanocyte samples) and DNA methylation profiles (seven melanoma and five melanocyte samples), were downloaded from the Gene Expression Omnibus database. Differentially expressed genes (DEGs) and differentially methylated positions (DMPs) were screened using the linear models for microarray data (limma) package in melanoma compared with melanocyte samples. Gene ontology (GO) and pathway enrichment analysis of the DEGs were carried out using the Database for Annotation, Visualization, and Integrated Discovery. Moreover, differentially methylated genes (DMGs) were identified, and a transcriptional regulatory network was constructed using the University of California Santa Cruz genome browser database. A total of 1,215 DEGs (199 upregulated and 1,016 downregulated) and 14,094 DMPs (10,450 upregulated and 3,644 downregulated) were identified in melanoma compared with melanocyte samples. Additionally, the upregulated and downregulated DEGs were significantly associated with different GO terms and pathways, such as pigment cell differentiation, biosynthesis, and metabolism. Furthermore, the transcriptional regulatory network showed that DMGs such as Aristaless-related homeobox (ARX), damage-specific DNA binding protein 2 (DDB2), and myelin basic protein (MBP) had higher node degrees. Our results showed that several methylated genes (ARX, DDB2, and MBP) may be involved in melanoma progression.
Keywords: melanoma, DNA methylation, differentially expressed genes, gene ontology, pathway enrichment analysis, transcriptional regulatory network
Introduction
Melanoma, which is one of the most notoriously aggressive forms of skin cancer, arises from melanocytes (pigment-producing cells in the skin).1 Melanoma in young and middle-aged adults is characterized by increasing incidence and mortality rates worldwide.2 Early detection and excision are the most important factors in successful treatment of malignant melanoma.2 Therefore, it is essential to develop new and effective management strategies.
Malignant melanoma results from the interplay of host, environmental, and genetic factors.3 Since the development of high-throughput genomic analysis, there has been significant progress in understanding of the genetic and molecular characteristics of melanomas, with the identification of signaling genes and pathways critical to their initiation and progression.1 For instance, mutations of v-raf murine sarcoma viral oncogene homolog B (BRAF) and neuroblastoma RAS viral (v-ras) oncogene homolog (NRAS) genes have been discovered with high frequency in nevi and cutaneous melanomas.4 Additionally, DNA methylation often occurs at the C5 position of cytosine in CpG dinucleotide. Methylation of the promoter regions can inhibit gene expression either by directly blocking the binding of transcriptional activators or silencing gene expression.5 Aberrant DNA hypermethylation is a frequent event found in melanoma and represents an essential mechanism utilized by shutting off different tumor suppressor genes (TSGs).6 Recent data have reviewed that aberrant promoter hypermethylation at cyclin-dependent kinase inhibitor 2A (CDKN2A) has been found in metastatic cutaneous melanoma samples.7 However, genetic understanding of melanoma remains incomplete.
In the current study, we downloaded and reanalyzed the microarray data of GSE31879 from a public database. The differentially expressed genes (DEGs), differentially methylated positions (DMPs), and differentially methylated genes (DMGs) between melanoma samples and human melanocyte samples were identified. Gene ontology (GO) and pathway enrichment analyses of the DEGs were carried out. Furthermore, the transcriptional regulatory network was constructed based on the interactions between the transcription factors (TFs) and the overlapping genes of DEGs and DMGs. We sought to get an increased understanding of epigenetic mechanisms in melanoma development and to identify potentially critical gene targets for melanoma. Further understanding of the underlying molecular mechanisms in melanoma may represent a novel and valuable therapeutic approach for melanoma.
Materials and methods
Microarray data
Microarray data of GSE31879, containing gene expression profiles along with methylation profiles, were downloaded from the Gene Expression Omnibus (GEO) database in the National Center of Biotechnology Information (NCBI), which was deposited by Tommasi et al on 6 September 2011.8 The two platforms used for gene expression profiling and methylation profiling are GPL570 (HG-U133_Plus_2) Affymetrix Human Genome U133 Plus 2.0 Array and GPL13118 NimbleGen Human DNA Methylation 3×720 K CpG Island Plus RefSeq Promoter Array (100718_HG18_CpG_Refseq_Prom_MeDIP). A total of 23 samples as shown in Table 1 were selected for the follow-up analysis, including seven primary human melanoma samples as well as five normal human melanocyte samples of DNA methylation profiles and seven primary human melanoma samples as well as four normal human melanocyte samples of mRNA expression profiles.
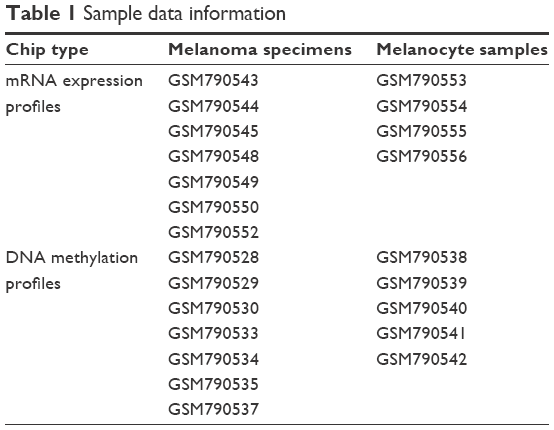 | Table 1 Sample data information |
Data preprocessing and screening of DEGs and DMPs
The original data that had already been log2 transformed and loess normalized9 were downloaded. For the gene expression profiles, the probe sets were annotated according to the annotation information. The expression values of the probe sets were averaged if multiple probes were mapped to one gene. The gene expression matrix was obtained. For the DNA methylation profiles, the corresponding genes were identified according to the promoter information on the methylated probes.
Linear models for microarray data (limma) software package provides an integrated solution for assessing differential expression for microarray studies.10 An unpaired t-test11 in the limma package10 was used to identify DEGs and DMPs between melanoma samples and normal melanocyte samples. DEGs and DMPs were determined using a threshold of |log2 fold change (FC)| >1 and P-value <0.05.
Functional and pathway enrichment analysis of DEGs
The GO project is a community-based bioinformatics resource that uses a set of structured, controlled vocabularies and classifications to represent biological knowledge of genes, gene products, and sequences.12 Kyoto Encyclopedia of Genes and Genomes (KEGG) is an integrated database resource for integration and biological interpretation of large-scale molecular data sets.13 In the present study, in order to analyze the DEGs at the functional level, GO12 and KEGG pathway13 enrichment analyses were carried out on all the DEGs using the Database for Annotation, Visualization, and Integrated Discovery (DAVID).14 Overrepresented GO terms12 in biological process (BP), molecular function (MF), and cellular component (CC) categories as well as pathways were identified based on a hypergeometric distribution algorithm.15 The P-value <0.05 was chosen as the threshold.
Identification of TF–mRNA interactive pairs
The genes where the DMPs were located were named DMGs. According to the identified DEGs, DMPs, and DMGs, the overlapping genes among DMGs and DEGs were identified.
University of California Santa Cruz (UCSC) genome browser (http://genome.ucsc.edu) database provides convenient and timely access to high-quality genome sequence and annotations.16 In this study, combined with the TF binding site information at the UCSC genome browser database, the TF binding sites for the overlapping genes were detected and a TF–mRNA transcriptional regulatory network was constructed.
Results
Screening of DEGs and DMPs
After analysis of the mRNA expression profiles and DNA methylation profiles, a total of 1,215 DEGs (including 199 upregulated and 1,016 downregulated genes; Table S1) were identified in melanoma samples compared with melanocyte samples. Additionally, 14,094 DMPs (10,450 upregulated and 3,644 downregulated; Table S2) were identified, and these DMPs corresponded to 3,004 DMGs. In addition, 167 overlapping genes among DEGs and DMGs were found of which 142 genes (85.03%) were downregulated (Figure 1). The 167 genes had 493 DMPs of which 345 (69.98%) were upregulated.
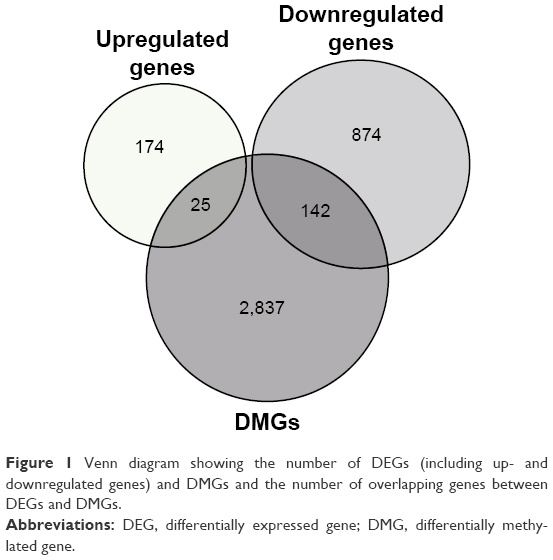 | Figure 1 Venn diagram showing the number of DEGs (including up- and downregulated genes) and DMGs and the number of overlapping genes between DEGs and DMGs. |
GO and pathway enrichment analysis of the DEGs
The results of pathway enrichment analysis showed that the DEGs were enriched in different pathways. Top 10 (ranked by P-value) enriched pathways are presented in Table 2. The upregulated genes were mainly enriched in sulfur metabolism, complement and coagulation cascades, and homologous recombination. Additionally, the downregulated genes were mainly enriched in the pathways associated with biosynthesis and metabolism, such as steroid biosynthesis, metabolic pathways, and sphingolipid metabolism.
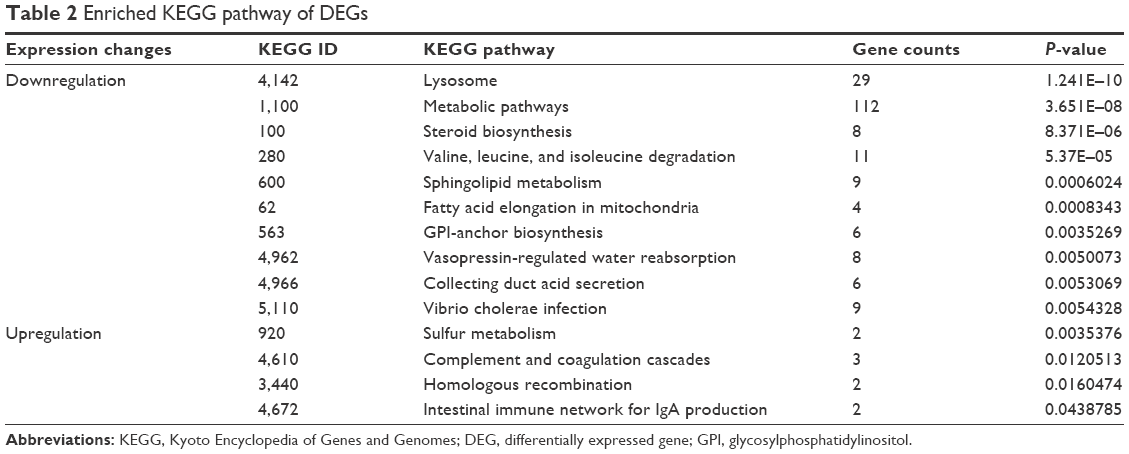 | Table 2 Enriched KEGG pathway of DEGs |
On the other hand, the DEGs were assigned to different GO terms. Top 10 GO terms are shown in Table 3. GO analysis showed that the upregulated DEGs were mainly associated with the regulation of compound metabolic processes, such as regulation of nitrogen compound metabolic process and nucleobase-containing compound metabolic process. Besides, the downregulated DEGs were mainly linked to the metabolic process such as small molecule metabolic process, organonitrogen compound metabolic process and the oxidation-reduction process. Moreover, the downregulated DEGs were also found to be associated with GO terms such as pigment cell differentiation and developmental pigmentation.
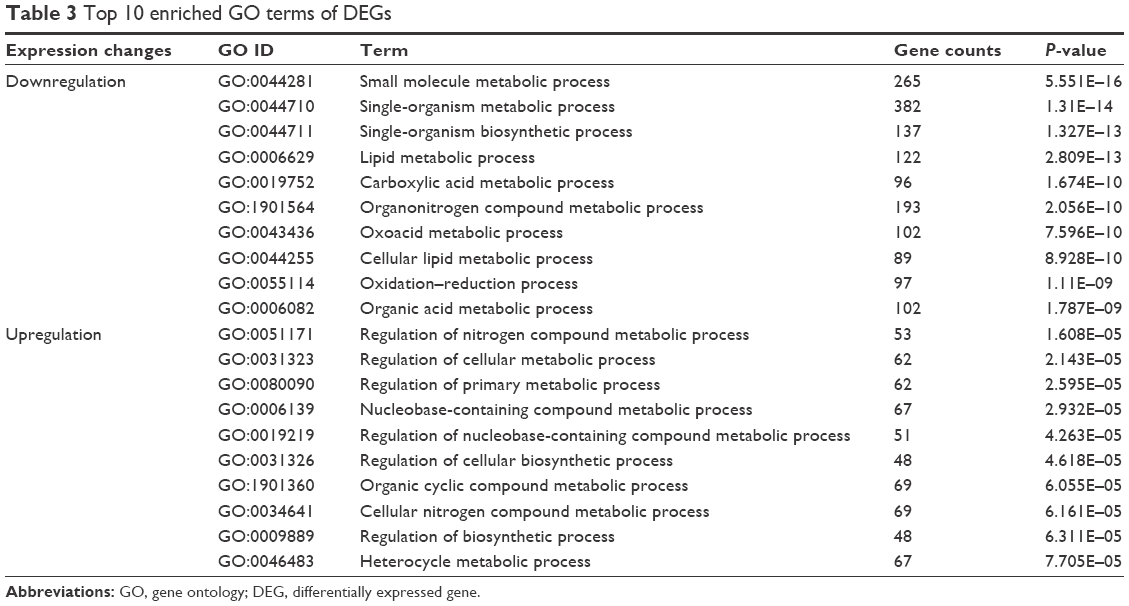 | Table 3 Top 10 enriched GO terms of DEGs |
Transcriptional regulatory network analysis
According to the information of TF binding sites in the UCSC database, a total of 29 DMPs were identified to be covered by TF binding sites. The interactions between the TFs and the DMGs that corresponded to the 29 DMPs were represented in the transcriptional regulatory network (Figure 2). The network was composed of 54 interactive pairs, 19 gene nodes, and 43 TF nodes. The nodes with higher degrees are shown in Table 4. The results showed that genes such as Aristaless-related homeobox (ARX; degree =7), damage-specific DNA binding protein 2 (DDB2; degree =6), potassium voltage-gated channel, Isk-related family, member 4 (KCNE4; degree =5), and myelin basic protein (MBP; degree =5) could be regulated by more TFs. Moreover, of all the TFs in the regulatory network, CCAAT/enhancer binding protein (C/EBP), CCAAT/enhancer binding protein alpha (C/EBPalpha; degree =3), and glucocorticoid receptor-alpha (GR-alpha; degree =3) could regulate more genes. In particular, DDB2 was mainly regulated by the members of the E2F family of TFs.
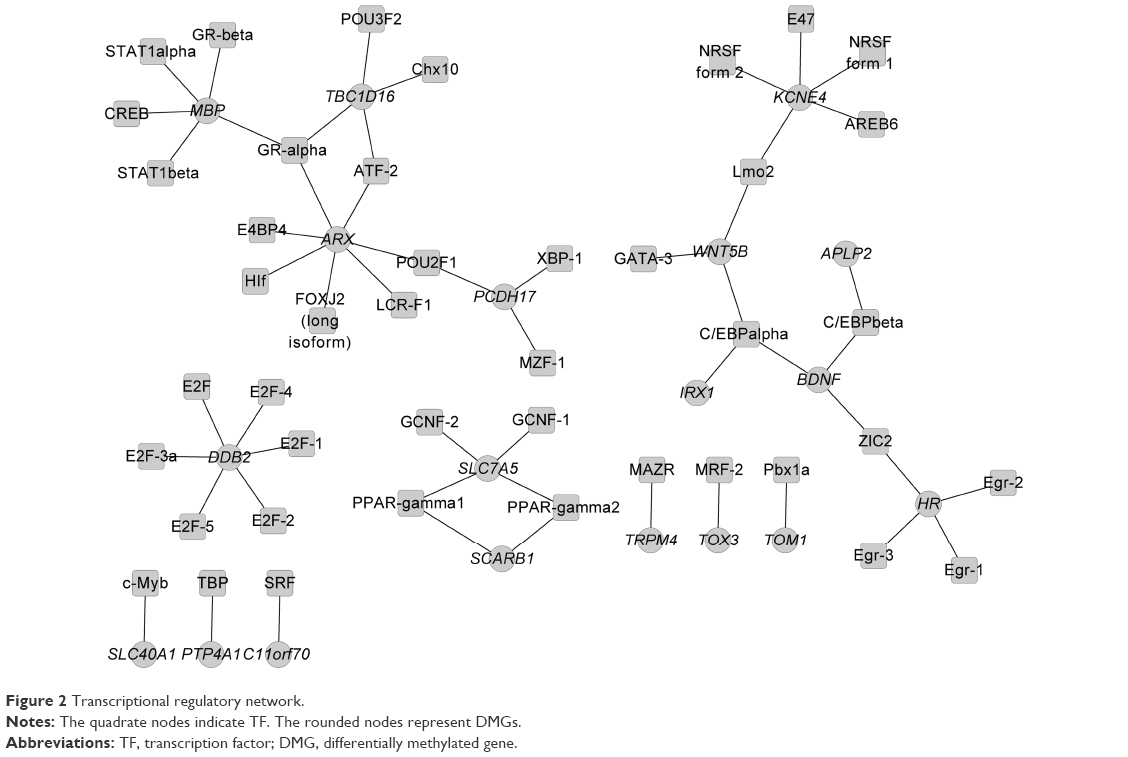 | Figure 2 Transcriptional regulatory network. |
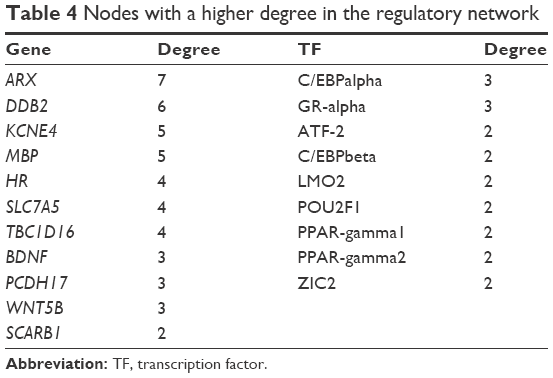 | Table 4 Nodes with a higher degree in the regulatory network |
Discussion
Melanoma arises from the accumulation of different gene alterations, and it is crucial to characterize the genetic changes during the progression of melanoma.17 In this study, integrated analysis was performed on the mRNA expression profiles and methylation profiles in human melanoma samples. Using the microarray platforms, we identified 1,215 DEGs (199 up- and 1,016 downregulated) and 14,094 DMPs (10,450 up- and 3,644 downregulated) in melanoma samples compared with melanocyte samples. The upregulated and downregulated DEGs were significantly associated with different GO terms and pathways, such as pigment cell differentiation, biosynthesis, and metabolism. Moreover, the transcriptional regulatory network showed that DMGs such as ARX, DDB2, and MBP could be regulated by more TFs, such as GR-alpha and E2F family.
According to the literature, DNA methylation is an epigenetic process that can heritably result in gene expression changes without altering the DNA sequence.18 Moreover, DNA hypermethylation has been demonstrated to lead to abnormal silencing of several TSGs in most types of carcinoma.19 Consistent with this notion, our study showed that 14,094 DMPs (10,450 upregulated and 3,644 downregulated) were identified, and these DMPs corresponded to 3,004 DMGs. Thus, we concluded that most methylated positions in melanoma had increased methylation levels compared with melanocyte samples, suggesting that aberrant DNA methylation may be an essential mechanism of melanoma development and progression.
ARX is a homeobox-containing gene expressed during brain development.20 The findings of Friocourt et al21 demonstrated that overexpression of ARX increased the length of cell cycle and ARX played an important role in controlling cortical interneuron migration and differentiation. A study had shown that melanoma cells that colonized the brain, which was a common target of metastases for melanoma patients, harbored numerous epigenetically and genetically altered genes.22 In addition, Marzese et al23 revealed that a genome-wide demethylation in low CpG density and also an increased methylation level in CpG islands were observed in melanoma brain metastasis (MBM) patients. Moreover, the results of our study demonstrated that ARX was downregulated and ARX was a DMG found in the regulatory network analysis. The network showed that ARX were regulated by the TF GR-alpha. Evidence demonstrates that GR-alpha is ubiquitously expressed and can alter expression patterns of target genes.24 Studies have indicated large quantities of glucocorticoid receptors in malignant melanoma cells.25,26 Therefore, we suggested that methylation of ARX may play an essential role in melanoma progression and in melanoma metastasis to the brain.
In addition, DDB2 encodes a protein that is necessary for the repair of ultraviolet (UV)-damaged DNA or nucleotide excision repair.27 Luijsterburg et al28 had demonstrated that DDB2 promoted chromatin decondensation at UV-induced DNA damage. Additionally, Itoh et al29 revealed that DDB2 was a haploinsufficient tumor suppressor and could control spontaneous germ cell apoptosis and tumor incidence. Besides, studies have demonstrated that UV can cause DNA damage via photosensitized reactions that lead to the production of oxygen radical species and UV exposure has been implicated as a potential role in the pathogenesis of melanoma.30,31 In keeping with the previous studies, our study showed that DDB2 was downregulated in human melanoma samples and DDB2 was a DMG found in the regulatory network analysis. Furthermore, DDB2 could be regulated by members of the E2F family of TFs. An active E2F element is revealed in the DDB2 promoter.32 Moreover, E2Fs regulate expression of genes involved in DNA repair.33 Taken together, we suggested that DDB2 methylation may play an important role in melanoma progression via affecting repair of DNA damage and cell fate.
Furthermore, our study showed that MBP was another DMG in melanoma samples. MBP, the second most abundant protein in myelin of the central nervous system, is in charge of adhesion of cytosolic surfaces of the multilayered compact myelin. The study of Pearson et al34 had showed that MBP could be a substrate of mitogen-activated protein kinase (MAPK). Besides, Fecher et al35 had revealed that MAPK pathway was one of the several potentially targetable pathways in melanoma. As shown in the transcriptional regulatory network in this study, MBP could be regulated by TF GR-alpha. The MAPK pathway mediates behavioral effects of glucocorticoids.36 In line with the previous studies, we suggested that MBP may be essential in melanoma progression via involvement in the MAPK pathway.
In recent years, DNA methylation alterations as an epigenetic abnormality have come into focus and it is indicated that methylation of a subset of genes may be useful biomarkers as tools for screening and early detection of cancer.37 Moreover, such DNA methylation-based biomarkers of disease can be also used for risk stratification and may have utility in personalized medicine.38 In addition, both genetic and epigenetic abnormalities can be used in monitoring the effect of chemopreventive drugs.38 Therefore, the findings of this study may represent a novel and valuable therapeutic approach for melanoma.
Conclusion
Our study identified several methylated genes (ARX, DDB2, and MBP) that may be involved in the mechanism of melanoma progression. Aberrant DNA methylation was an essential mechanism of melanoma development and progression. Methylation of ARX may play an essential role in melanoma progression and in melanoma metastasis to the brain. Additionally, DDB2 methylation may play an important role in melanoma progression via affecting repair of DNA damage and cell fate. Moreover, MBP may be essential in melanoma progression via involvement in the MAPK pathway. However, further experiments and investigations are needed to verify our results, exploring useful novel DNA methylation predictors and effective treatment strategies.
Disclosure
The authors report no conflicts of interest in this work.
References
Ko JM, Fisher DE. A new era: melanoma genetics and therapeutics. J Pathol. 2011;223(2):242–251. | ||
Glud M, Gniadecki R. MicroRNAs in the pathogenesis of malignant melanoma. J Eur Acad Dermatol Venereol. 2013;27(2):142–150. | ||
Hill VK, Gartner JJ, Samuels Y, Goldstein AM. The genetics of melanoma: recent advances. Annu Rev Genomics Hum Genet. 2013;14:257–279. | ||
Poynter JN, Elder JT, Fullen DR, et al. BRAF and NRAS mutations in melanoma and melanocytic nevi. Melanoma Res. 2006;16(4):267–273. | ||
Bird A. DNA methylation patterns and epigenetic memory. Genes Dev. 2002;16(1):6–21. | ||
Sigalotti L, Covre A, Fratta E, et al. Epigenetics of human cutaneous melanoma: setting the stage for new therapeutic strategies. J Transl Med. 2010;8:56. | ||
Freedberg DE, Rigas SH, Russak J, et al. Frequent p16-independent inactivation of p14ARF in human melanoma. J Natl Cancer Inst. 2008;100(11):784–795. | ||
Tommasi S, Zheng A, Li AX, Wu X, Besratinia A. Gene Expression Omnibus; Series GSE31879. Available at: https://www.ncbi.nlm.nih.gov/geo/query/acc.cgi?acc=GSE31879. Accessed November 15, 2017. | ||
Zahurak M, Parmigiani G, Yu W, et al. Pre-processing Agilent microarray data. BMC Bioinformatics. 2007;8(1):142. | ||
Ritchie ME, Phipson B, Wu D, et al. limma powers differential expression analyses for RNA-sequencing and microarray studies. Nucleic Acids Res. 2015;43(7):e47. | ||
Smyth GK. Limma: linear models for microarray data. In: Gentleman R, Carey V, Dudoit S, R Irizarry WH, editors. Bioinformatics and computational biology solutions Using R and Bioconductor. New York: Springer; 2005:397–420. | ||
Consortium GO. Gene ontology consortium: going forward. Nucleic Acids Res. 2015;43(D1):D1049–D1056. | ||
Kanehisa M, Sato Y, Kawashima M, Furumichi M, Tanabe M. KEGG as a reference resource for gene and protein annotation. Nucleic Acids Res. 2016;44(D1):D457–D462. | ||
Huang da W, Sherman BT, Lempicki RA. Systematic and integrative analysis of large gene lists using DAVID bioinformatics resources. Nat Protoc. 2009;4(1):44–57. | ||
Wu T. An accurate computation of the hypergeometric distribution function. ACM Trans Math Software. 1993;19(1):33–43. | ||
Karolchik D, Barber GP, Casper J, et al. The UCSC genome browser database: 2014 update. Nucleic Acids Res. 2014;42(D1):D764–D770. | ||
Rakosy Z, Ecsedi S, Toth R, et al. Integrative genomics identifies gene signature associated with melanoma ulceration. PLoS One. 2013;8(1):e54958. | ||
Esteller M. Epigenetics in cancer. N Engl J Med. 2008;358(11):1148–1159. | ||
De Carvalho DD, Sharma S, You JS, et al. DNA methylation screening identifies driver epigenetic events of cancer cell survival. Cancer Cell. 2012;21(5):655–667. | ||
Bienvenu T, Poirier K, Friocourt G, et al. ARX, a novel Prd-class-homeobox gene highly expressed in the telencephalon, is mutated in X-linked mental retardation. Hum Mol Genet. 2002;11(8):981–991. | ||
Friocourt G, Kanatani S, Tabata H, et al. Cell-autonomous roles of ARX in cell proliferation and neuronal migration during corticogenesis. J Neurosci. 2008;28(22):5794–5805. | ||
Marzese DM, Scolyer RA, Roqué M, et al. DNA methylation and gene deletion analysis of brain metastases in melanoma patients identifies mutually exclusive molecular alterations. Neuro Oncol. 2014;16(11):1499–1509. | ||
Marzese DM, Scolyer RA, Huynh JL, et al. Epigenome-wide DNA methylation landscape of melanoma progression to brain metastasis reveals aberrations on homeobox D cluster associated with prognosis. Hum Mol Genet. 2014;23(1):226–238. | ||
Pujols L, Mullol J, Picado C. Importance of glucocorticoid receptors in upper and lower airways. Front Biosci (Landmark Ed). 2009;15:789–800. | ||
Bhakoo HS, Milholland RJ, Lopez R, Karakousis C, Rosen F. High incidence and characterization of glucocorticoid receptors in human malignant melanoma 2, 3. J Natl Cancer Inst. 1981;66(1):21–25. | ||
Dobos J, Kenessey I, Tímár J, Ladányi A. Glucocorticoid receptor expression and antiproliferative effect of dexamethasone on human melanoma cells. Pathol Oncol Res. 2011;17(3):729–734. | ||
Stoyanova T, Roy N, Kopanja D, Bagchi S, Raychaudhuri P. DDB2 decides cell fate following DNA damage. Proc Natl Acad Sci USA. 2009;106(26):10690–10695. | ||
Luijsterburg MS, Lindh M, Acs K, et al. DDB2 promotes chromatin decondensation at UV-induced DNA damage. J Cell Biol. 2012;197(2):267–281. | ||
Itoh T, Iwashita S, Cohen MB, Meyerholz DK, Linn S. Ddb2 is a haploinsufficient tumor suppressor and controls spontaneous germ cell apoptosis. Hum Mol Genet. 2007;16(13):1578–1586. | ||
Wang SQ, Setlow R, Berwick M, et al. Ultraviolet A and melanoma: a review. J Am Acad Dermatol. 2001;44(5):837–846. | ||
Hurlstone A, Wellbrock C. TP53 in the UV spotlight: a bona fide driver of melanoma. Pigment Cell Melanoma Res. 2014;27(6):1010–1011. | ||
Nichols AF, Itoh T, Zolezzi F, Hutsell S, Linn S. Basal transcriptional regulation of human damage-specific DNA-binding protein genes DDB1 and DDB2 by Sp1, E2F, N-myc and NF1 elements. Nucleic Acids Res. 2003;31(2):562–569. | ||
Ren B, Cam H, Takahashi Y, et al. E2F integrates cell cycle progression with DNA repair, replication, and G2/M checkpoints. Genes Dev. 2002;16(2):245–256. | ||
Pearson G, Robinson F, Beers Gibson T, et al. Mitogen-activated protein (MAP) kinase pathways: regulation and physiological functions 1. Endocr Rev. 2001;22(2):153–183. | ||
Fecher LA, Amaravadi RK, Flaherty KT. The MAPK pathway in melanoma. Curr Opin Oncol. 2008;20(2):183–189. | ||
Revest J-M, Di Blasi F, Kitchener P, et al. The MAPK pathway and Egr-1 mediate stress-related behavioral effects of glucocorticoids. Nat Neurosci. 2005;8(5):664. | ||
Zöchbauer-Müller S, Minna JD, Gazdar AF. Aberrant DNA methylation in lung cancer: biological and clinical implications. Oncologist. 2002;7(5):451–457. | ||
Wang W, Srivastava S. Strategic approach to validating methylated genes as biomarkers for breast cancer. Cancer Prev Res. 2010;3(1):16–24. |
 © 2017 The Author(s). This work is published and licensed by Dove Medical Press Limited. The full terms of this license are available at https://www.dovepress.com/terms.php and incorporate the Creative Commons Attribution - Non Commercial (unported, v3.0) License.
By accessing the work you hereby accept the Terms. Non-commercial uses of the work are permitted without any further permission from Dove Medical Press Limited, provided the work is properly attributed. For permission for commercial use of this work, please see paragraphs 4.2 and 5 of our Terms.
© 2017 The Author(s). This work is published and licensed by Dove Medical Press Limited. The full terms of this license are available at https://www.dovepress.com/terms.php and incorporate the Creative Commons Attribution - Non Commercial (unported, v3.0) License.
By accessing the work you hereby accept the Terms. Non-commercial uses of the work are permitted without any further permission from Dove Medical Press Limited, provided the work is properly attributed. For permission for commercial use of this work, please see paragraphs 4.2 and 5 of our Terms.