")
Back to Journals » International Journal of General Medicine » Volume 15
Identification of Diagnostic Biomarkers Associated with Stromal and Immune Cell Infiltration in Fatty Infiltration After Rotator Cuff Tear by Integrating Bioinformatic Analysis and Machine-Learning
Authors Wang S, Ying JH , Xu H
Received 24 December 2021
Accepted for publication 11 February 2022
Published 19 February 2022 Volume 2022:15 Pages 1805—1819
DOI https://doi.org/10.2147/IJGM.S354741
Checked for plagiarism Yes
Review by Single anonymous peer review
Peer reviewer comments 2
Editor who approved publication: Dr Scott Fraser
Si Wang,1,* Jin-He Ying,2,* Huan Xu2
1Department of Information Centre, Lishui Hospital, Zhejiang University School of Medicine, Lishui, 323000, Zhejiang, People’s Republic of China; 2Department of Joint Surgery, Lishui Hospital, Zhejiang University School of Medicine, Lishui, 323000, Zhejiang, People’s Republic of China
*These authors contributed equally to this work
Correspondence: Huan Xu, Tel +86 578 2285310, Fax +865782133457, Email [email protected]
Purpose: The present study aimed to explore potential diagnostic biomarkers for fatty infiltration (FI) of the rotator cuff muscles after rotator cuff tear (RCT) and investigate the influence of stromal and immune cell infiltration on this pathology.
Methods: The GSE130447 and GSE103266 datasets were downloaded from the Gene Expression Omnibus database. Differentially expressed genes (DEGs) were identified, and gene set enrichment analyses were performed by R software. Two machine learning algorithms, random forest and multiple support vector machine recursive feature elimination (mSVM-RFE), were used to screen candidate biomarkers. The diagnostic value of the screened biomarkers was further validated by the area under the ROC curve (AUC) in the GSE103266 dataset. Murine microenvironment cell population counter (mMCP-counter) method was employed to estimate stromal and immune cell infiltration of FI. The correlation between biomarkers and infiltrated immune and stromal cell subsets was further analyzed.
Results: A total of 2123 DEGs were identified. The identified DEGs were predominantly linked to immune system process, extracellular matrix organization and PPAR signalling pathway. FABP5 (AUC = 0.958) and MGP (AUC = 1) were screened as diagnostic biomarkers of FI. Stromal and immune cell infiltration analysis showed that monocytes, mast cells, vessels, endothelial cells and fibroblasts may be related to the process of FI. FABP5 and MGP were positively correlated with vessels whereas negatively correlated with monocytes and mast cells.
Conclusion: FABP5 and MGP can serve as diagnostic biomarkers of FI after RCT, and stromal and immune cell infiltration may play a crucial role in this pathology.
Keywords: rotator cuff tears, fatty infiltration, biomarker, immune infiltration, bioinformatics, machine learning
Introduction
Rotator cuff tear (RCT) is a common shoulder disorder causing shoulder pain and disability. The prevalence of full-thickness RCT is 20.7% in the general population, and increased with age.1 Rotator cuff play essential roles in shoulder function and the treatment of proximal humeral fractures.2,3 It is important to repair RCT. In the past decades, there was a fast-growing number of rotator cuff repair procedures.4–6 However, massive RCT still has a high failure rate after rotator cuff repair.7–9 The retear rate after repair of massive RCT could reach up to 36%.8 Fatty infiltration (FI) of the rotator cuff muscles was first proposed by Goutallier et al.10 It is associated with RCT and rotator cuff muscle atrophy, characterized as fat tissue fills in the interspaces of remodeled muscle fibers.11 FI is an independent risk factor for poor outcomes and tendon retear after rotator cuff repair.12–15 Animal studies showed that FI originated as early as two weeks after RCT and deteriorated six weeks later,16 and could persist after delayed rotator cuff repair.17 Magnetic resonance imaging studies illustrated that FI progressed even after successful rotator cuff repair.15,18 In view of delayed diagnosis of FI may result in poor prognosis, the identification of diagnostic biomarkers may boost the development of early diagnostic method for FI.
To investigate the molecular mechanisms underlying FI will help identify diagnostic biomarkers and boost the development of therapeutic modalities. In recent years, several studies have showed that stromal and immune cells play important roles in the development of FI. Lakemeier demonstrated that vessel density was significantly correlated with FI after RCT.19 Liu et al showed that muscle fibrosis and FI coexisted after RCT, and muscle resident progenitors would differentiate into fibroblasts in fatty degenerative rotator cuff muscles.20 Gumucio et al corroborated that macrophages recruitment and accretion of inflammatory cytokines such as IL-10 and IL-1β were observed in fatty infiltrated rotator cuff muscles.21 Mendias et al also observed macrophage infiltration in fatty degenerative muscles after RCT.22 Davies et al revealed that upregulated RhoA signaling with increased macrophage infiltration aggravated FI after RCT.23 Thus, it is meaningful to assess stromal and immune cell infiltration in FI after RCT to clarify the molecular mechanisms and help identify molecular biomarkers and explore therapeutic modalities of FI. Murine microenvironment cell population counter (mMCP-counter) is a technique built on transcriptomic data and applied to quantify immune and stromal murine cell populations.24 To date, few studies have conducted mMCP-counter to analysis stromal and immune cell infiltration in FI and explore candidate diagnostic biomarkers for FI.
High-throughput RNA sequencing (RNA-seq) analysis, together with bioinformatics analysis, has been widely used to screen feature genes related to multiple diseases that might serve as potential therapeutic targets or diagnostic biomarkers.25–29 In recent years, machine learning algorithms have been proven to be effective ways for feature gene selection.30–32 Random forest and multiple support vector machine recursive feature elimination (mSVM-RFE) are two popular machine learning algorithms, which can be used to make accurate predictions on high-dimension gene expression data.33–35
In the present study, the murine RNA-seq datasets of FI after RCT in Gene Expression Omnibus (GEO, http://www.ncbi.nlm.nih.gov/geo) database were downloaded. Comprehensive bioinformatics analysis was carried out to identify differentially expressed genes (DEGs), and analyze gene set enrichment analysis (GSEA) of gene ontology (GO) and GSEA of Kyoto encyclopedia of genes and genomes (KEGG). Subsequently, random forest and mSVM-RFE algorithms were first combined to screen diagnostic biomarkers of FI. In addition, mMCP-counter method was first employed to further quantify stromal and immune cell infiltration in FI and normal samples. Moreover, the correlation between biomarkers and infiltrated immune and stromal cell subsets in FI samples were calculated to further analyze the molecular and immunologic mechanisms underlying FI.
Materials and Methods
Data Download
The RNA-seq count datasets of GSE13044736 and GSE10326637 were downloaded from GEO database, which were based on GPL17021 Illumina HiSeq 2500 (Mus musculus) platform and GPL18694 Illumina HiSeq 2500 (Rattus norvegicus) platform, respectively. GSE130447 dataset contains sixteen infraspinatus muscle samples collected from C57BL/6J (B6) and MRL/MpJ (MRL) mice, including eight fatty infiltrated samples established by a full-thickness infraspinatus tendon tear and eight control samples. GSE103266 dataset served as the validation cohort, contains sixteen supraspinatus muscle samples collected from Sprague-Dawley rats, including twelve fatty infiltrated samples made by a full-thickness supraspinatus tendon tear and four control samples.
RNA-Seq Data Processing and DEGs Identification
The regularized log (rlog) transformation depend on the DESeq2 package of R software (version 4.0.3, http://r-project.org/),38 was applied to centralize the RNA-seq count datasets of GSE130447 and GSE103266. DESeq2, ggplot2,39 gplots (https://CRAN.R-project.org/package=gplots) and RColorBrewer (https://CRAN.R-project.org/package=RColorBrewer) packages in R were implemented to analyze and visualize the quality of GSE130447 dataset. DEGs between rotator cuff tear (RCT) and control samples were winkled out using the DESeq2 package, and illustrated with a volcano plot graphed using ggplot2 and ggrepel (https://CRAN.R-project.org/package=ggrepel) packages. Adjusted p-value <0.05 and |log2FoldChange| >1 were set as the cut-off criteria.
GSEA of DEGs
GSEAs of GO and KEGG were conducted to identify the biological functions and pathways of DEGs using ClusterProfiler40 and org.Mm.eg.db (https://bioconductor.org/packages/org.Mm.eg.db/) packages, and visualized using ggpubr (https://CRAN.R-project.org/package=ggpubr) and enrichplot (https://github.com/YuLab-SMU/enrichplot) packages. Adjusted p-value <0.05 was set as the cut-off criteria.
Diagnostic Biomarkers Selection and Validation
In order to screen the best underlying biomarkers for fatty infiltration of rotator cuff muscles, we used two varying machine learning algorithms. Random forest and mSVM-RFE algorithms were employed to fulfill feature selection. Feature selection built on random forest algorithm was carried out using the varSelRF package.41 Feature selection based on mSVM-RFE algorithm was performed by the e1071 package (https://CRAN.R-project.org/package=e1071). The intersecting variables between these two algorithms were obtained as the biomarkers. The diagnostic efficiencies of the screened biomarkers were further validated by the area under the ROC curve (AUC) in the GSE103266 dataset using pROC,42 ggplot2 and glmnet43 packages.
Evaluation of Stromal and Immune Cell Infiltration
On account of the heterogeneity of stromal and immune cell infiltration in human and mouse, we adopted the mMCP-counter package,24 a package specific for estimating the composition of immune and stromal cells in murine samples, to assess stromal and immune cell infiltration of the RNA-seq dataset of GSE130447. The ggstatsplot package (https://CRAN.R-project.org/package=ggstatsplot) was implemented to assess and visualize the correlation of immune and stromal cells, and to plot box/violin graphs of the differences of these cells between RCT and control groups.
Correlation Analysis Between Screened Biomarkers and Immune and Stromal Cells
The Spearman’s rank correlation tests between the screened biomarkers and the immune and stromal cells in RCT samples of GSE130447 were explored and visualized with scatterplots using the ggstatsplot package.
Results
RNA-Seq Data Processing and DEGs Identification
After the rlog transformation produce, the RNA-Seq values in GSE130447 ranged from 2.608 to 21.004. A density plot and a box plot displayed that the distributions of samples were homogeneous (Figure 1A and B). A hierarchical clustering heatmap built on the Euclidean distance between samples and a principal-components analysis (PCA) plot evinced that rotator cuff tear and control samples can easily be separated (Figure 1C and D). These results substantiated that the RNA-seq data was credible for further analyses. A total of 2123 DEGs, comprising 1417 upregulated genes and 706 downregulated genes, were identified in GSE130447 (Figure 2).
 |
Figure 1 Distribution analyses of the samples. (A) The density plot of the GSE130447 data distribution. (B) The box plot of the GSE130447 data distribution. (C) The hierarchical clustering heatmap of the GSE130447 data. (D) The PCA plot of the GSE130447 data. |
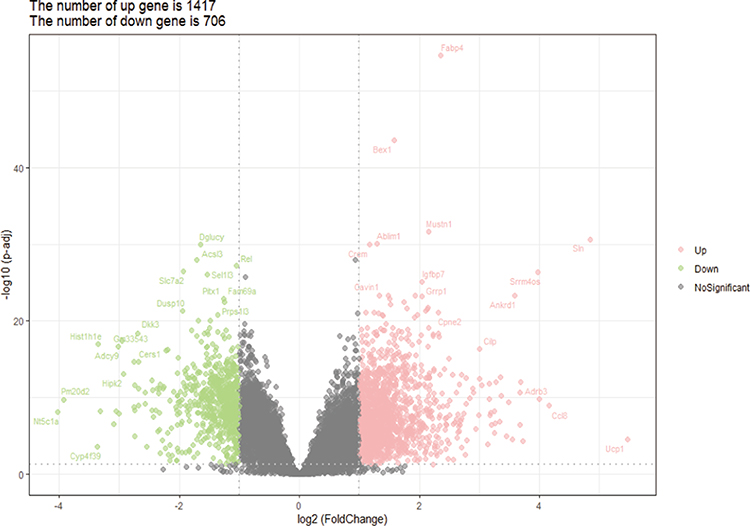 |
Figure 2 The volcano plot of DEGs in GSE130447. |
GSEA of DEGs
GSEA of GO revealed that DEGs had enrichments for biological processes (BP), cellular component (CC) and molecular function (MF) (Figure 3). For BP, DEGs were predominantly enriched in immune system process, extracellular matrix organization, extracellular structure organization, immune response, regulation of immune system process, defense response, positive regulation of response to stimulus, positive regulation of immune system process, response to external stimulus and blood vessel morphogenesis (Figure 4). For CC, DEGs were principally enriched in extracellular region, extracellular space, extracellular matrix, collagen-containing extracellular matrix, basement membrane, cell surface, transferase complex, collagen trimer, cation channel complex and ion channel complex (Figure 5). For MF, DEGs were primarily enriched in extracellular matrix structural constituent, glycosaminoglycan binding, structural molecule activity, endopeptidase activity, heparin binding, antigen binding, ubiquitin-protein transferase activity, ubiquitin-like protein transferase activity, nucleic acid binding and fatty acid binding (Figure 6). In terms of GSEA of KEGG, DEGs were mainly enriched in ECM-receptor interaction, staphylococcus aureus infection, protein digestion and absorption, viral protein interaction with cytokine and cytokine receptor, phagosome, PPAR signaling pathway and osteoclast differentiation (Figure 7).
 |
Figure 3 The histogram of GO analysis of DEGs in GSE130447. |
 |
Figure 4 The GSEA plot of BP. |
 |
Figure 5 The GSEA plot of CC. |
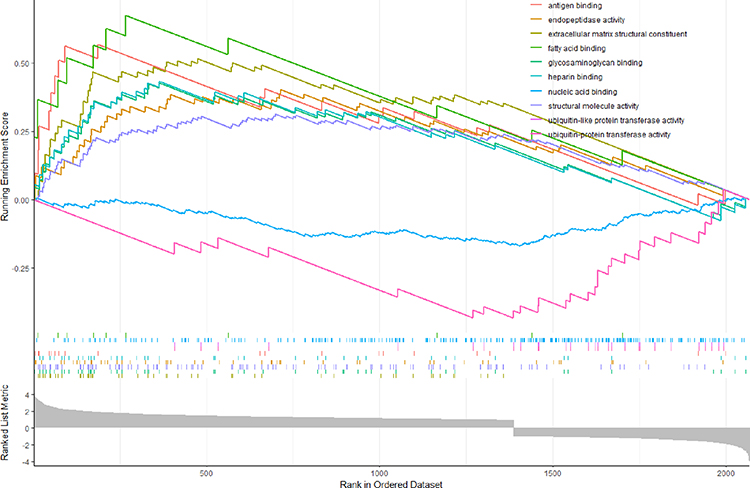 |
Figure 6 The GSEA plot of MF. |
 |
Figure 7 The GSEA plot of KEGG. |
Diagnostic Biomarkers Selection and Validation
The top 100 upregulated and top 100 downregulated DEGs were selected to perform feature selection. A subset of 64 features were screened using mSVM-RFE algorithm and 4 variables were identified using random forest algorithm (Figure 8A and B). Fatty acid binding protein 5 (FABP5) and matrix Gla protein (MGP) were ultimately selected from the intersection of features achieved by these two algorithms, and were considered as the diagnostic biomarkers. The diagnostic efficiencies of FABP5 and MGP were further validated using the validation set of GSE103266 RNA-seq dataset. The AUCs were 0.958 (95% CI 0.860–1) in FABP5 and 1 (95% CI 1–1) in MGP (Figure 9). These results illustrated that FABP5 and MGP had excellent diagnostic abilities.
 |
Figure 8 Screening of diagnostic biomarkers using mSVM-RFE and Random forest. (A) mSVM-RFE algorithm for identifying biomarkers. When the number of features was sixty-four, the generalization error reached its minimum value. (B) Random forest algorithm to screen biomarkers. When the number of variables was four, the variables out-of-bag (OOB) error rate reached the minimum value. |
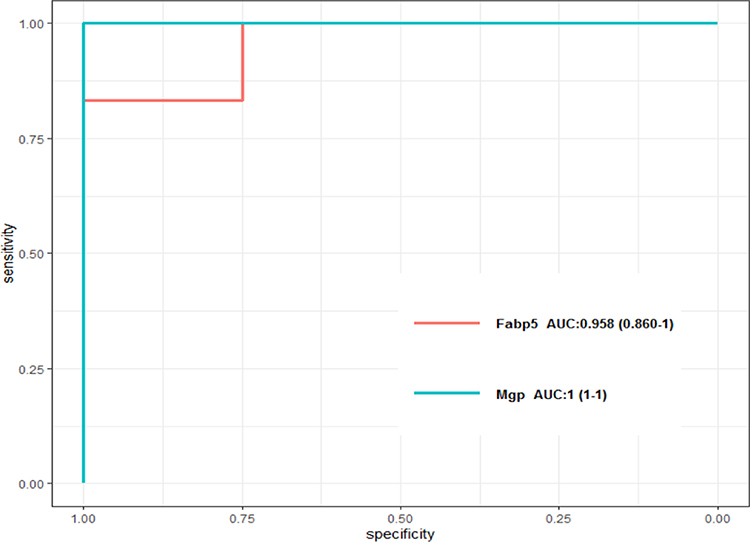 |
Figure 9 The ROC curve of FABP5 and MGP. |
Stromal and Immune Cell Infiltration
When conducted stromal and immune cell infiltration analysis in GSE130447 dataset, seven types of immune and stromal cells were detected. The correlation of seven types of immune and stromal cells was estimated (Figure 10). Monocytes were positively correlated with mast cells and eosinophils, whereas negatively correlated with vessels and endothelial cells. Mast cells were positively correlated with monocytes, but negatively correlated with vessels, endothelial cells and fibroblasts. Eosinophils were positively correlated with monocytes. Vessels were positively correlated with endothelial cells and fibroblasts, yet negatively correlated with monocytes and mast cells. Lymphatics were positively correlated with fibroblasts. Endothelial cells were positively correlated with vessels and fibroblasts, whereas negatively correlated with monocytes and mast cells. Fibroblasts were positively correlated with vessels, lymphatics and endothelial cells, but negatively correlated with mast cells. The exploration to the composition of immune and stromal cells in RCT samples versus control samples in GSE130447 dataset demonstrated that the proportions of monocytes (P = 0.005) and mast cells (P = 0.001) in RCT samples were lower than in control samples, and the proportions of vessels (P = 0.003), endothelial cells (P = 0.001) and fibroblasts (P = 0.003) in RCT samples were higher than in control samples (Figure 11).
 |
Figure 10 The Correlation matrix plot of seven types of immune and stromal cells in GSE130447. |
 |
Figure 11 The box/violin plot of the differences of immune and stromal cells between RCT and control groups in GSE130447. |
Correlation Analysis Between FABP5, MGP and Immune and Stromal Cells
FABP5 was positively correlated with vessels (ρ = 0.81, P = 0.015), whereas negatively correlated with monocytes (ρ = −0.71, P = 0.047) and mast cells (ρ = −0.86, P = 0.007) in RCT samples of GSE130447 (Figure 12). MGP was positively correlated with vessels (ρ = 0.86, P = 0.007), while negatively correlated with monocytes (ρ = −0.76, P = 0.028) and mast cells (ρ = −0.90, P = 0.002) in RCT samples of GSE130447 (Figure 13).
 |
Figure 12 The scatterplots of correlation analysis between FABP5 and immune and stromal cells in GSE130447. |
 |
Figure 13 The scatterplots of correlation analysis between MGP and immune and stromal cells in GSE130447. |
Discussion
FI of the rotator cuff muscles is a common complication after RCT. To explore molecular biomarkers and stromal and immune cell infiltration in FI may help the development of diagnostic and therapeutic strategies. To the best of our knowledge, the present study was the first to probe into diagnostic biomarkers in combination with stromal and immune cell infiltration in FI after RCT by mining RNA-seq datasets. We download two RNA-seq datasets of FI from GEO database and carried out an integrated bioinformatics analysis of the datasets.
A total of 2123 DEGs were identified, comprising 1417 upregulated genes and 706 downregulated genes. GSEA of GO revealed that DEGs were predominantly enriched in immune system process, extracellular region and extracellular matrix structural constituent, indicating that extracellular matrix (ECM) and immune response participated in the process of FI. In terms of GSEA of KEGG, DEGs were mainly involved in ECM-receptor interaction, staphylococcus aureus infection, protein digestion and absorption, viral protein interaction with cytokine and cytokine receptor, phagosome, PPAR signaling pathway and osteoclast differentiation. ECM is an elementary constituent of skeletal muscle; excessive cumulation of ECM components can result in muscle fibrosis.44 FI and fibrosis of rotator cuff muscles could coexist after RCT.20 Peroxisome proliferator-activated receptors (PPARs) with isotypes of PPARα, PPARβ/δ and PPARγ, are members of the ligand-inducible nuclear hormone receptor superfamily, and can be activated by fatty acids.45 PPAR signaling pathway regulates a broad spectrum of cellular processes, such as fatty acid transport, oxidation and storage, apogenesis, inflammation, and can regulate immune function by triggering macrophages.46,47 PPARs also play key roles in skeletal muscle lipid metabolism.48 Itoigawa et al demonstrated that PPARγ was high expressed in fatty degenerative rotator cuff muscle after RCT.49 Liu et al showed that PPAR signaling pathway was crucial for the regulation of muscle lipid accumulation in broiler chickens.50
Based on random forest and mSVM-RFE algorithms, two diagnostic biomarkers were screened. These two biomarkers, FABP5 and MGP, exhibited excellent diagnostic abilities in validation dataset. FABP5 is an important member of fatty acid binding proteins (FABPs) family. FABPs are conservative family of cytoplasmic 14- to 15-kDa proteins that bind medium- and long-chain fatty acids; FABPs have 12 isoforms with highly conservative three-dimensional structures, and play essential roles in fatty acid uptake, transport, utilization, and are closely related with inflammatory responses and metabolic regulation.51–53 Lee et al showed that RCT would trigger expression of fatty acid binding protein 4 (FABP4), another member of FABPs, causing intramuscular fat deposition in rotator cuff muscles after RCT.54 FABP5 was expressed in many tissues, such as skin, lymph node, adipose tissue and skeletal muscle.52,55,56 It was closely related to immune system. Field et al demonstrated that FABP5 could regulate regulatory T cells function, and its inhibition in regulate regulatory T cells jeopardized lipid metabolism, leading to mitochondrial DNA releasing and activation of the cyclic GMP-AMP synthase-stimulator of interferon genes signaling pathway, inducing high expression of the regulatory cytokine interleukin-10 and suppressing regulatory T cells activity.57 Pan et al revealed that FABP5, together with FABP4, was essential for the survival and function of CD8+ tissue-resident memory T cells, while the shortage of FABP5 and FABP4 undermined the uptake of exogenous lipid in CD8+ tissue-resident memory T cells and lowered their longevity.58 Abplanalp et al reported that in cardiac failure patients, FABP5 would be largely concentrated in classical monocyte and contribute to boost monocyte activation.59 Moore et al found that FABP5 could regulate macrophage phenotypes, its deficiency would raise the production of anti-inflammatory cytokines.60 Bogdan et al corroborated that suppression of FAPB5 would debilitate the induction of microsomal prostaglandin E synthase-1 and the synthesis of prostaglandin E2 in macrophage during inflammatory response.61 Moreover, FABP5 was closely linked to skeletal muscle fat metabolism.62 Iso et al illustrated that FABP5 was highly expressed in capillary endothelial cells of skeletal muscle, and was crucial for skeletal muscle lipid uptake.55 In addition, FABP5 expression was found to be positively correlated with PPARγ expression during adipogenesis.63 MGP is a small 14.7 kDa vitamin K-dependent and γ-carboxyglutamic acid-rich protein, secreted and localized in the ECM of endothelial cells or chondrocytes.64 It was widely expressed in many tissues, and played important roles in inhibiting tissue calcification and regulating the process of cell differentiation.64,65 Velleman et al demonstrated that MGP controlled skeletal muscle cell differentiation and proliferation.66 Mutch et al reported that MGP protein was abundantly secreted from adipocytes during adipogenesis, and might be a new adipokine in human.67 Lanham et al showed that MGP knockout mice had a higher proportion of intrascapular brown adipose tissue volume than wild-type mice.68 Recently, Li et al first reported the link between MGP and lipid metabolism in mouse model, and showed that MGP could regulate adipogenesis and lipolysis in vitro and lipid metabolism in vivo, and found that the level of serum desphosphorylated-uncarboxylated MGP was positively related to visceral adiposity and closely linked to lipoprotein level.69 The aforementioned studies suggested that both FABP5 and MGP were closely involved in skeletal lipid metabolism, and might be potential biomarkers for FI.
The features of stromal and immune cell infiltration in FI were assessed using the mMCP-counter method. As a result, various immune and stromal cell subtypes were closely linked to FI. An increased infiltration of vessels, endothelial cells and fibroblasts, and a decreased infiltration of monocytes and mast cells were detected to be potentially linked to the occurrence and development of FI. Gibbons et al observed increased vessels in fatty degenerative rotator cuff muscles.70 Endothelial cells were key components of the vessel wall. Muscle fibrosis and FI were common complications after RCT. Liu et al showed that Tie2+ progenitor cells and platelet-derived growth factor receptor alpha+ fibro/adipogenic progenitors would differentiate into fibroblasts in fatty infiltrated rotator cuff muscles.20 Monocytes and mast cells both participated in the process of RCT. Krieger et al showed that multiple immune cells such as macrophages, monocytes and T cells were accumulated in rotator cuff muscles, while exhaustion of circulating monocytes expedited rotator cuff muscle atrophy after RCT.71 Sun et al found that preoperative lymphocyte to monocyte ratio less than 4.760 was a poor prognostic factor for arthroscopic rotator cuff repair.72 Moreover, circulating monocytes could recruit and switch into macrophages after skeletal muscle injury,73 while macrophages would infiltrate in fatty degenerative rotator cuff muscles.21–23 Mast cells could boost myoblast proliferation in injured skeletal muscle.74 Matthews et al and Millar et al both reported that mast cells recruited in RCT, but the number of mast cells were lower in large and massive RCT than small and medium RCT.75,76 However, in the present study, decreased infiltrations of monocytes and mast cells were observed in fatty infiltrated rotator cuff muscle. These may attribute to the own characteristics of stromal and immune cell infiltration in FI.
Correlation analysis between FABP5, MGP and immune and stromal cells showed that FABP5 and MGP were positively correlated with vessels, and negatively correlated with monocytes and mast cells. FABP5 could boost angiogenic responses in endothelial cells of blood vessels, and might regulate inflammation, lipid raft constitution of monocytes and metabolism in activated monocytes.77,78 Moreover, FABP5 took part in the lipopolysaccharide-induced cytokine production of mast cells.79 MGP was expressed in blood vessels, and would be up-regulated in lipopolysaccharide-stimulated THP-1 monocytes.80,81 Thus, FABP5 and MGP may regulate vessels, monocytes and mast cells in the progress of FI.
The highlight of the present study was to employ two machine learning algorithms (random forest and mSVM-RFE) for date mining and adopt mMCP-counter method for the first time to analyze stromal and immune cell infiltration in FI. The present study has several limitations. This study was a bioinformatics research. The data was downloaded from GEO database for second mining, and further experiment should be conducted to validate the results. In addition, the sample size in the GSE103266 validation cohort was small.
Conclusions
In summary, FABP5 and MGP were identified as diagnostic biomarkers of FI after RCT. Vessels, endothelial cells, fibroblasts, monocytes and mast cells may be related to the process of FI. In addition, FABP5 and MGP were significantly associated with vessels, monocytes and mast cells. These immune and stromal cells may be potential targets of FI immunotherapy.
Data Sharing Statement
All data generated or analyzed during the present study was downloaded from GEO database. The datasets in the current study are downloaded from the GEO database and all data are available from the corresponding authors.
Ethics Approval and Consent to Participate
This study was approved by the Ethics Committee of Lishui Hospital, Zhejiang University School of Medicine.
Acknowledgments
Thanks to GEO database for data sharing.
Author Contributions
All authors made a significant contribution to the work reported, whether that is in the conception, study design, execution, acquisition of data, analysis and interpretation, or in all these areas; took part in drafting, revising or critically reviewing the article; gave final approval of the version to be published; have agreed on the journal to which the article has been submitted; and agree to be accountable for all aspects of the work.
Disclosure
The authors report no conflicts of interest in this work.
References
1. Yamamoto A, Takagishi K, Osawa T, et al. Prevalence and risk factors of a rotator cuff tear in the general population. J Shoulder Elbow Surg. 2010;19(1):116–120. doi:10.1016/j.jse.2009.04.006
2. Rollo G, Porcellini G, Rotini R, et al. A new plate design to treat displaced 3-4 parts proximal humeral fractures in comparison to the most tested and used plate: clinical and radiographic study. Med Glas. 2019;16(2):284–291. doi:10.17392/1033-19
3. Rollo G, Rotini R, Pichierri P, et al. Grafting and fixation of proximal humeral aseptic non union: a prospective case series. Clin Cases Miner Bone Metab. 2017;14(3):298–304. doi:10.11138/ccmbm/2017.14.3.298
4. Zhang ALMD, Montgomery SRMD, Ngo SSBS, Hame SLMD, Wang JCMD, Gamradt SCMD. Analysis of rotator cuff repair trends in a large private insurance population. Arthroscopy. 2013;29(4):623–629. doi:10.1016/j.arthro.2012.11.004
5. Colvin AC, Egorova N, Harrison AK, Moskowitz A, Flatow EL. National trends in rotator cuff repair. J Bone Joint Surg Am. 2012;94(3):227–233. doi:10.2106/JBJS.J.00739
6. Day MA, Westermann RW, Bedard NA, Glass NA, Wolf BR. Trends associated with open versus arthroscopic rotator cuff repair. HSS J. 2019;15(2):133–136. doi:10.1007/s11420-018-9628-2
7. Kim JR, Cho YS, Ryu KJ, Kim JH. Clinical and radiographic outcomes after arthroscopic repair of massive rotator cuff tears using a suture bridge technique: assessment of repair integrity on magnetic resonance imaging. Am J Sports Med. 2012;40(4):786–793. doi:10.1177/0363546511434546
8. Haleem A, Gohal C, Leroux T, Henry P, Alolabi B, Khan M. Primary arthroscopic repair of massive rotator cuff tears results in significant improvements with low rate of re-tear. Knee Surg Sports Traumatol Arthrosc. 2021;29(7):2134–2142. doi:10.1007/s00167-020-06190-3
9. Chiang CH, Shaw L, Chih WH, et al. Modified superior capsule reconstruction using the long head of the biceps tendon as reinforcement to rotator cuff repair lowers retear rate in large to massive reparable rotator cuff tears. Arthroscopy. 2021;37(8):2420–2431. doi:10.1016/j.arthro.2021.04.003
10. Goutallier D, Postel JM, Bernageau J, Lavau L, Voisin MC. Fatty muscle degeneration in cuff ruptures. Pre- and postoperative evaluation by ct scan. Clin Orthop Relat Res. 1994;304:78–83. doi:10.1097/00003086-199407000-00014
11. Kuzel BR, Grindel S, Papandrea R, Ziegler D. Fatty infiltration and rotator cuff atrophy. J Am Acad Orthop Surg. 2013;21(10):613–623. doi:10.5435/JAAOS-21-10-613
12. Lobo-Escolar L, Ramazzini-Castro R, Codina-Grano D, Lobo E, Minguell-Monyart J, Ardevol J. Risk factors for symptomatic retears after arthroscopic repair of full-thickness rotator cuff tears. J Shoulder Elbow Surg. 2021;30(1):27–33. doi:10.1016/j.jse.2020.05.010
13. Ohzono H, Gotoh M, Nakamura H, et al. Effect of preoperative fatty degeneration of the rotator cuff muscles on the clinical outcome of patients with intact tendons after arthroscopic rotator cuff repair of large/massive cuff tears. Am J Sports Med. 2017;45(13):2975–2981. doi:10.1177/0363546517724432
14. Chung SW, Kim JY, Kim MH, Kim SH, Oh JH. Arthroscopic repair of massive rotator cuff tears: outcome and analysis of factors associated with healing failure or poor postoperative function. Am J Sports Med. 2013;41(7):1674–1683. doi:10.1177/0363546513485719
15. Gladstone JN, Bishop JY, Lo IK, Flatow EL. Fatty infiltration and atrophy of the rotator cuff do not improve after rotator cuff repair and correlate with poor functional outcome. Am J Sports Med. 2007;35(5):719–728. doi:10.1177/0363546506297539
16. Liu X, Manzano G, Kim HT, Feeley BT. A rat model of massive rotator cuff tears. J Orthop Res. 2011;29(4):588–595. doi:10.1002/jor.21266
17. Wang Z, Liu X, Davies MR, Horne D, Kim H, Feeley BT. A mouse model of delayed rotator cuff repair results in persistent muscle atrophy and fatty infiltration. Am J Sports Med. 2018;46(12):2981–2989. doi:10.1177/0363546518793403
18. Di Schino M, Augereau B, Nich C. Does open repair of anterosuperior rotator cuff tear prevent muscular atrophy and fatty infiltration? Clin Orthop Relat Res. 2012;470(10):2776–2784. doi:10.1007/s11999-012-2443-z
19. Lakemeier S, Reichelt JJ, Patzer T, Fuchs-Winkelmann S, Paletta JR, Schofer MD. The association between retraction of the torn rotator cuff and increasing expression of hypoxia inducible factor 1alpha and vascular endothelial growth factor expression: an immunohistological study. BMC Musculoskelet Disord. 2010;11(1):230. doi:10.1186/1471-2474-11-230
20. Liu X, Ning AY, Chang NC, et al. Investigating the cellular origin of rotator cuff muscle fatty infiltration and fibrosis after injury. Muscles Ligaments Tendons J. 2016;6(1):6–15. doi:10.11138/mltj/2016.6.1.006
21. Gumucio JP, Korn MA, Saripalli AL, et al. Aging-associated exacerbation in fatty degeneration and infiltration after rotator cuff tear. J Shoulder Elbow Surg. 2014;23(1):99–108. doi:10.1016/j.jse.2013.04.011
22. Mendias CL, Roche SM, Harning JA, et al. Reduced muscle fiber force production and disrupted myofibril architecture in patients with chronic rotator cuff tears. J Shoulder Elbow Surg. 2015;24(1):111–119. doi:10.1016/j.jse.2014.06.037
23. Davies MR, Lee L, Feeley BT, Kim HT, Liu X. Lysophosphatidic acid-induced rhoa signaling and prolonged macrophage infiltration worsens fibrosis and fatty infiltration following rotator cuff tears. J Orthop Res. 2017;35(7):1539–1547. doi:10.1002/jor.23384
24. Petitprez F, Levy S, Sun CM, et al. The murine microenvironment cell population counter method to estimate abundance of tissue-infiltrating immune and stromal cell populations in murine samples using gene expression. Genome Med. 2020;12(1):86. doi:10.1186/s13073-020-00783-w
25. Bayo J, Fiore EJ, Dominguez LM, et al. Bioinformatic analysis of rho family of GTPases identifies rac1 pharmacological inhibition as a new therapeutic strategy for hepatocellular carcinoma. Gut. 2021;70(7):1362–1374. doi:10.1136/gutjnl-2020-321454
26. Shi R, Bao X, Unger K, et al. Identification and validation of hypoxia-derived gene signatures to predict clinical outcomes and therapeutic responses in stage I lung adenocarcinoma patients. Theranostics. 2021;11(10):5061–5076. doi:10.7150/thno.56202
27. Caputo V, Strafella C, Termine A, et al. Rnaseq-based prioritization revealed col6a5, col8a1, col10a1 and mir146a as common and differential susceptibility biomarkers for psoriasis and psoriatic arthritis: confirmation from genotyping analysis of 1417 Italian subjects. Int J Mol Sci. 2020;21(8):8. doi:10.3390/ijms21082740
28. Xiao C, Gong J, Jie Y, et al. Ncapg is a promising therapeutic target across different tumor types. Front Pharmacol. 2020;11:387. doi:10.3389/fphar.2020.00387
29. Lee SH, Hadipour-Lakmehsari S, Kim DH, et al. Bioinformatic analysis of membrane and associated proteins in murine cardiomyocytes and human myocardium. Sci Data. 2020;7(1):425. doi:10.1038/s41597-020-00762-1
30. Zhang J, Yu R, Guo X, et al. Identification of tyr, tyrp1, dct and larp7 as related biomarkers and immune infiltration characteristics of vitiligo via comprehensive strategies. Bioengineered. 2021;12(1):2214–2227. doi:10.1080/21655979.2021.1933743
31. Xiong Y, Ling QH, Han F, Liu QH. An efficient gene selection method for microarray data based on lasso and bpso. BMC Bioinform. 2019;20(Suppl 22):715. doi:10.1186/s12859-019-3228-0
32. Jansi RM, Devaraj D. Two-stage hybrid gene selection using mutual information and genetic algorithm for cancer data classification. J Med Syst. 2019;43(8):235. doi:10.1007/s10916-019-1372-8
33. Speiser JL, Miller ME, Tooze J, Ip E. A comparison of random forest variable selection methods for classification prediction modeling. Expert Syst Appl. 2019;134:93–101. doi:10.1016/j.eswa.2019.05.028
34. Zhou X, Tuck DP. Msvm-rfe: extensions of svm-rfe for multiclass gene selection on DNA microarray data. Bioinformatics. 2007;23(9):1106–1114. doi:10.1093/bioinformatics/btm036
35. Diaz-Uriarte R, Alvarez DAS. Gene selection and classification of microarray data using random forest. BMC Bioinform. 2006;7(1):3. doi:10.1186/1471-2105-7-3
36. Talarek JR, Piacentini AN, Konja AC, et al. The mrl/mpj mouse strain is not protected from muscle atrophy and weakness after rotator cuff tear. J Orthop Res. 2020;38(4):811–822. doi:10.1002/jor.24516
37. Gumucio JP, Qasawa AH, Ferrara PJ, et al. Reduced mitochondrial lipid oxidation leads to fat accumulation in myosteatosis. FASEB J. 2019;33(7):7863–7881. doi:10.1096/fj.201802457RR
38. Love MI, Huber W, Anders S. Moderated estimation of fold change and dispersion for RNA-seq data with deseq2. Genome Biol. 2014;15(12):550. doi:10.1186/s13059-014-0550-8
39. Gómez-Rubio V. Ggplot2 - elegant graphics for data analysis (2nd edition). J Stat Softw. 2017;77(2):1–3. doi:10.18637/jss.v077.b02
40. Yu G, Wang L, Han Y, He Q. Clusterprofiler: an r package for comparing biological themes among gene clusters. Omics. 2012;16(5):284–287. doi:10.1089/omi.2011.0118
41. Diaz-Uriarte R. Genesrf and varselrf: a web-based tool and r package for gene selection and classification using random forest. BMC Bioinform. 2007;8(1):328. doi:10.1186/1471-2105-8-328
42. Robin X, Turck N, Hainard A, et al. Proc: an open-source package for r and s+ to analyze and compare roc curves. BMC Bioinform. 2011;12(1):77. doi:10.1186/1471-2105-12-77
43. Friedman J, Hastie T, Tibshirani R. Regularization paths for generalized linear models via coordinate descent. J Stat Softw. 2010;33(1):1–22. doi:10.18637/jss.v033.i01
44. Mahdy M. Skeletal muscle fibrosis: an overview. Cell Tissue Res. 2019;375(3):575–588. doi:10.1007/s00441-018-2955-2
45. Dubois V, Eeckhoute J, Lefebvre P, Staels B. Distinct but complementary contributions of ppar isotypes to energy homeostasis. J Clin Invest. 2017;127(4):1202–1214. doi:10.1172/JCI88894
46. Kim MJ, Lee YJ, Yoon YS, et al. Apoptotic cells trigger the abca1/stat6 pathway leading to ppar-gamma expression and activation in macrophages. J Leukoc Biol. 2018;103(5):885–895. doi:10.1002/JLB.2A0817-341RR
47. Feige JN, Gelman L, Michalik L, Desvergne B, Wahli W. From molecular action to physiological outputs: peroxisome proliferator-activated receptors are nuclear receptors at the crossroads of key cellular functions. Prog Lipid Res. 2006;45(2):120–159. doi:10.1016/j.plipres.2005.12.002
48. Manickam R, Duszka K, Wahli W. Ppars and microbiota in skeletal muscle health and wasting. Int J Mol Sci. 2020;21(21):21. doi:10.3390/ijms21218056
49. Itoigawa Y, Kishimoto KN, Sano H, Kaneko K, Itoi E. Molecular mechanism of fatty degeneration in rotator cuff muscle with tendon rupture. J Orthop Res. 2011;29(6):861–866. doi:10.1002/jor.21317
50. Liu L, Liu X, Cui H, Liu R, Zhao G, Wen J. Transcriptional insights into key genes and pathways controlling muscle lipid metabolism in broiler chickens. BMC Genomics. 2019;20(1):863. doi:10.1186/s12864-019-6221-0
51. Furuhashi M, Hotamisligil GS. Fatty acid-binding proteins: role in metabolic diseases and potential as drug targets. Nat Rev Drug Discov. 2008;7(6):489–503. doi:10.1038/nrd2589
52. Haunerland NH, Spener F. Fatty acid-binding proteins–insights from genetic manipulations. Prog Lipid Res. 2004;43(4):328–349. doi:10.1016/j.plipres.2004.05.001
53. Zimmerman AW, Veerkamp JH. New insights into the structure and function of fatty acid-binding proteins. Cell Mol Life Sci. 2002;59(7):1096–1116. doi:10.1007/s00018-002-8490-y
54. Lee YS, Kim JY, Oh KS, Chung SW. Fatty acid-binding protein 4 regulates fatty infiltration after rotator cuff tear by hypoxia-inducible factor 1 in mice. J Cachexia Sarcopenia Muscle. 2017;8(5):839–850. doi:10.1002/jcsm.12203
55. Iso T, Maeda K, Hanaoka H, et al. Capillary endothelial fatty acid binding proteins 4 and 5 play a critical role in fatty acid uptake in heart and skeletal muscle. Arterioscler Thromb Vasc Biol. 2013;33(11):2549–2557. doi:10.1161/ATVBAHA.113.301588
56. Tokuda N, Adachi T, Adachi Y, et al. Identification of fabp7 in fibroblastic reticular cells of mouse lymph nodes. Histochem Cell Biol. 2010;134(5):445–452. doi:10.1007/s00418-010-0754-2
57. Field CS, Baixauli F, Kyle RL, et al. Mitochondrial integrity regulated by lipid metabolism is a cell-intrinsic checkpoint for treg suppressive function. Cell Metab. 2020;31(2):422–437.e5. doi:10.1016/j.cmet.2019.11.021
58. Pan Y, Tian T, Park CO, et al. Survival of tissue-resident memory t cells requires exogenous lipid uptake and metabolism. Nature. 2017;543(7644):252–256. doi:10.1038/nature21379
59. Abplanalp WT, John D, Cremer S, et al. Single-cell RNA-sequencing reveals profound changes in circulating immune cells in patients with heart failure. Cardiovasc Res. 2021;117(2):484–494. doi:10.1093/cvr/cvaa101
60. Moore SM, Holt VV, Malpass LR, Hines IN, Wheeler MD. Fatty acid-binding protein 5 limits the anti-inflammatory response in murine macrophages. Mol Immunol. 2015;67(2Pt B):265–275. doi:10.1016/j.molimm.2015.06.001
61. Bogdan D, Falcone J, Kanjiya MP, et al. Fatty acid-binding protein 5 controls microsomal prostaglandin e synthase 1 (mpges-1) induction during inflammation. J Biol Chem. 2018;293(14):5295–5306. doi:10.1074/jbc.RA118.001593
62. Dowling P, Gargan S, Zweyer M, Swandulla D, Ohlendieck K. Proteomic profiling of fatty acid binding proteins in muscular dystrophy. Expert Rev Proteomics. 2020;17(2):137–148. doi:10.1080/14789450.2020.1732214
63. Samulin J, Berget I, Lien S, Sundvold H. Differential gene expression of fatty acid binding proteins during porcine adipogenesis. Comp Biochem Physiol B Biochem Mol Biol. 2008;151(2):147–152. doi:10.1016/j.cbpb.2008.06.010
64. Gheorghe SR, Craciun AM. Matrix gla protein in tumoral pathology. Clujul Med. 2016;89(3):319–321. doi:10.15386/cjmed-579
65. Farzaneh-Far A, Weissberg PL, Proudfoot D, Shanahan CM. Transcriptional regulation of matrix gla protein. Z Kardiol. 2001;90(Suppl 3):38–42. doi:10.1007/s003920170040
66. Velleman SG, Sporer KR, Ernst CW, Reed KM, Strasburg GM. Versican, matrix gla protein, and death-associated protein expression affect muscle satellite cell proliferation and differentiation. Poult Sci. 2012;91(8):1964–1973. doi:10.3382/ps.2012-02147
67. Mutch DM, Rouault C, Keophiphath M, Lacasa D, Clement K. Using gene expression to predict the secretome of differentiating human preadipocytes. Int J Obes. 2009;33(3):354–363. doi:10.1038/ijo.2009.3
68. Lanham SA, Cagampang FR, Oreffo R. The influence of a high fat diet on bone and soft tissue formation in matrix gla protein knockout mice. Sci Rep. 2018;8(1):3635. doi:10.1038/s41598-018-21650-0
69. Li C, Li J, He F, Li K, Li X, Zhang Y. Matrix gla protein regulates adipogenesis and is serum marker of visceral adiposity. Adipocyte. 2020;9(1):68–76. doi:10.1080/21623945.2020.1721692
70. Gibbons MC, Singh A, Anakwenze O, et al. Histological evidence of muscle degeneration in advanced human rotator cuff disease. J Bone Joint Surg Am. 2017;99(3):190–199. doi:10.2106/JBJS.16.00335
71. Krieger JR, Tellier LE, Ollukaren MT, Temenoff JS, Botchwey EA. Quantitative analysis of immune cell subset infiltration of supraspinatus muscle after severe rotator cuff injury. Regen Eng Transl Med. 2017;3(2):82–93. doi:10.1007/s40883-017-0030-2
72. Sun Y, Lin J, Luo Z, Chen J. Preoperative lymphocyte to monocyte ratio can be a prognostic factor in arthroscopic repair of small to large rotator cuff tears. Am J Sports Med. 2020;48(12):3042–3050. doi:10.1177/0363546520953427
73. Arnold L, Henry A, Poron F, et al. Inflammatory monocytes recruited after skeletal muscle injury switch into antiinflammatory macrophages to support myogenesis. J Exp Med. 2007;204(5):1057–1069. doi:10.1084/jem.20070075
74. Duchesne E, Bouchard P, Roussel MP, Cote CH. Mast cells can regulate skeletal muscle cell proliferation by multiple mechanisms. Muscle Nerve. 2013;48(3):403–414. doi:10.1002/mus.23758
75. Millar NL, Hueber AJ, Reilly JH, et al. Inflammation is present in early human tendinopathy. Am J Sports Med. 2010;38(10):2085–2091. doi:10.1177/0363546510372613
76. Matthews TJ, Hand GC, Rees JL, Athanasou NA, Carr AJ. Pathology of the torn rotator cuff tendon. Reduction in potential for repair as tear size increases. J Bone Joint Surg Br. 2006;88(4):489–495. doi:10.1302/0301-620X.88B4.16845
77. Yu CW, Liang X, Lipsky S, et al. Dual role of fatty acid-binding protein 5 on endothelial cell fate: a potential link between lipid metabolism and angiogenic responses. Angiogenesis. 2016;19(1):95–106. doi:10.1007/s10456-015-9491-4
78. Shipman M, Lubick K, Fouchard D, et al. Proteomic and systems biology analysis of monocytes exposed to securinine, a gaba(a) receptor antagonist and immune adjuvant. PLoS One. 2012;7(9):e41278. doi:10.1371/journal.pone.0041278
79. Yamamoto N, Kaneko I, Motohashi K, et al. Fatty acid-binding protein regulates lps-induced tnf-alpha production in mast cells. Prostaglandins Leukot Essent Fatty Acids. 2008;79(1–2):21–26. doi:10.1016/j.plefa.2008.06.003
80. Viegas C, Costa RM, Santos L, et al. Gla-rich protein function as an anti-inflammatory agent in monocytes/macrophages: implications for calcification-related chronic inflammatory diseases. PLoS One. 2017;12(5):e0177829. doi:10.1371/journal.pone.0177829
81. Jono S, Nishizawa Y. [Measurement of serum mgp]. Clin Calcium. 2002;12(8):1102–1104. Japanese.
 © 2022 The Author(s). This work is published and licensed by Dove Medical Press Limited. The full terms of this license are available at https://www.dovepress.com/terms.php and incorporate the Creative Commons Attribution - Non Commercial (unported, v3.0) License.
By accessing the work you hereby accept the Terms. Non-commercial uses of the work are permitted without any further permission from Dove Medical Press Limited, provided the work is properly attributed. For permission for commercial use of this work, please see paragraphs 4.2 and 5 of our Terms.
© 2022 The Author(s). This work is published and licensed by Dove Medical Press Limited. The full terms of this license are available at https://www.dovepress.com/terms.php and incorporate the Creative Commons Attribution - Non Commercial (unported, v3.0) License.
By accessing the work you hereby accept the Terms. Non-commercial uses of the work are permitted without any further permission from Dove Medical Press Limited, provided the work is properly attributed. For permission for commercial use of this work, please see paragraphs 4.2 and 5 of our Terms.