")
Back to Journals » International Journal of General Medicine » Volume 16
Identification of Cuproptosis-Related Subtypes, Establishment of a Prognostic Signature and Characterization of the Tumor Microenvironment in Gastric Cancer
Authors Li J, Kong C, Song W, Fu T
Received 26 January 2023
Accepted for publication 19 April 2023
Published 2 May 2023 Volume 2023:16 Pages 1631—1652
DOI https://doi.org/10.2147/IJGM.S404847
Checked for plagiarism Yes
Review by Single anonymous peer review
Peer reviewer comments 2
Editor who approved publication: Dr Scott Fraser
Jiazheng Li,1,* Can Kong,1,* Wei Song,1,* Tao Fu1,2
1Department of Gastrointestinal Surgery, Renmin Hospital of Wuhan University, Wuhan, People’s Republic of China; 2Department of General Surgery, Qingdao Municipal Hospital, Qingdao, People’s Republic of China
*These authors contributed equally to this work
Correspondence: Tao Fu, Email [email protected]
Purpose: Cuproptosis is a newly identified form of programmed cell death. We aimed to comprehensively discuss the correlation of cuproptosis with gastric cancer (GC) using bioinformatic methods.
Patients and Methods: This study selected GC bulk and single-cell RNA sequencing profiles from public databases. Based on the enrichment pattern of cuproptosis-related gene sets (CRGSs), GC patients were classified into different cuproptosis subtypes. A series of systematic analyses was performed to investigate the correlation of cuproptosis subtype with biological function and immune cell infiltration. In addition, we established a CRGS risk score signature to quantify GC patients’ risk level, and analyzed the signature’s relationship with clinical features, tumor microenvironment (TME) and treatment responses. Genes used for the construction of the risk score model were also detected in GC tumor and normal tissues by real-time quantitative polymerase chain reaction (RT-qPCR).
Results: First, analysis of scRNA-seq data revealed the alterations in CRGS enrichment scores for patients with GC and precancerous diseases. Then, based on large GC patient cohorts, two cuproptosis subtypes with significant differences in survival, biological function and TME were identified. Furthermore, we established a CRGS risk score signature. High-risk patients on the CRGS risk score signature with worse overall survival were characterized by higher immune and stromal contents in the TME, more advanced clinicopathological features, and better sensitivity to a wider range of anti-tumor drugs. Low-risk patients were correlated with higher tumor purity, and demonstrated more favorable clinical outcomes and higher sensitivity to immunotherapy.
Conclusion: The current work elucidated that cuproptosis plays an important role in the regulation of TME landscapes in GC. Two cuproptosis subtypes with distinct TME characteristics were identified. In addition, the establishment of a CRGS risk score signature could provide novel insights into accurate prediction and personalized treatment for GC patients.
Keywords: gastric cancer, cuproptosis, single-cell RNA sequencing, molecular subtype, prognostic model, tumor microenvironment
Introduction
Gastric cancer (GC) is one of the most common malignancies in the digestive system, with high incidence and mortality rates. According to recent statistics, GC was ranked as the fourth leading cause of cancer-related death worldwide, with over 1,000,000 new cases and 700,000 deaths occurring in 2020.1 Although steady progress has been made in comprehensive management for cancer patients, the prognosis for GC patients remains dismal. Therefore, there is an urgent need to investigate novel treatment strategies for GC patients.
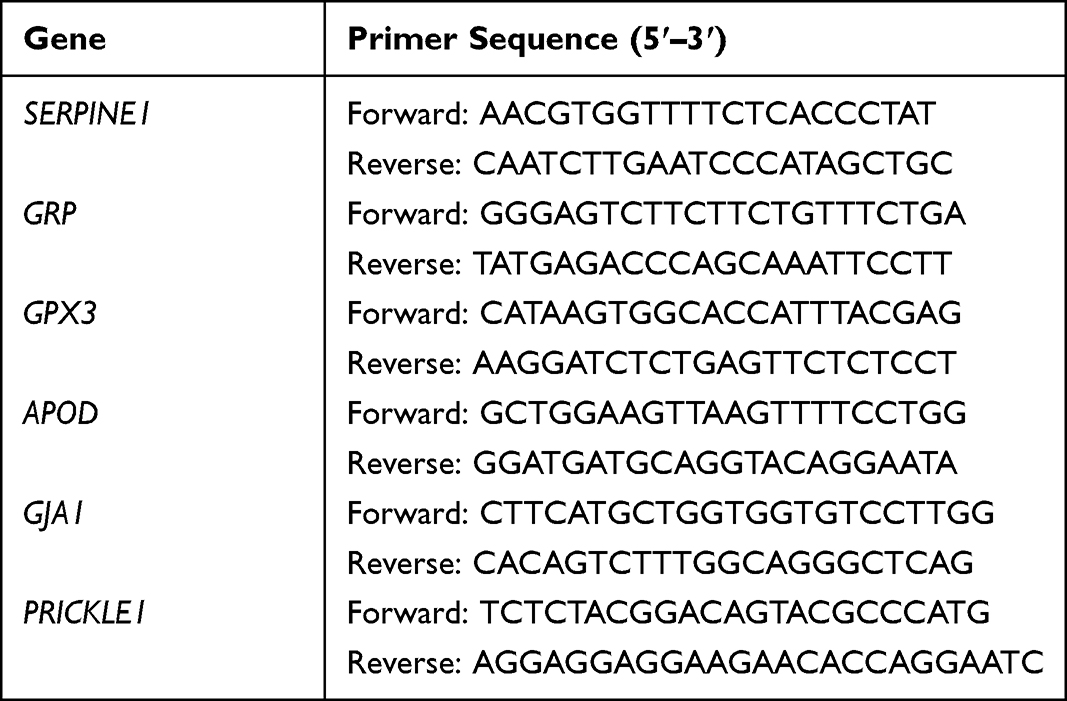 |
Table 1 List of Primers |
Resistance to cell death is a capability that normal cells acquire during malignant transformation, and is regarded as one of the hallmarks of cancer.2 Apoptosis was the first mode of programmed cell death (PCD) or cell suicide to be identified in animals.3 Since its discovery in 1972, efforts have been made to develop anti-cancer treatment strategies targeting apoptosis. The most well-known achievements are navitoclax4,5 and venetoclax,6,7 for the treatment of hematological malignancies. In addition to apoptosis, other PCD modes, including autophagy, ferroptosis, pyroptosis and necroptosis, were identified successively, highlighting the potential for non-apoptotic PCD forms to become novel anti-cancer targets.8
An article published in Science in 2022 presented the discovery of a novel non-apoptotic PCD mode induced by abberant intracellular copper accumulation, named “cuproptosis”.9 Mechanistically, FDX1 is identified as the key initiator of cuproptosis, which promotes the reduction of copper ion from Cu2+ to the more toxic Cu+. The aberrant Cu+ overload triggers two mitochondrial proteotoxic stress pathways: the oligomerization of lipoylated proteins and the destabilization of Fe-S cluster proteins. In addition to the copper overload, it is worth noting that mitochondrial respiration also plays a non-negligible role in cuproptosis, and the cell death could be attenuated by electron transport chain inhibitors.
A current hotspot of cancer research is to analyze patients at the genetic and epigenetic levels and to shed light on the potential molecular mechanisms behind the pathogenesis of malignancies. Well-established molecular subtyping systems for GC include The Cancer Genome Atlas (TCGA) classification, the Asian Cancer Research Group (ACRG) classification and Lei’s classification.10–12 Our previous studies also corroborated that GC patients could be classified into different clusters based on the expression pattern of pyroptosis-related genes and enrichment level of stem-cell related gene sets.13,14 Both of these subtyping approaches showed high accuracy in predicting the prognosis of GC patients and a strong correlation with the tumor microenvironment (TME).
In the present study, we used six cuproptosis-related gene sets (CRGSs) to reflect cuproptosis activity. The analysis of scRNA-seq data revealed that patients with intestinal metaplasia (IM) and early gastric cancer (EGC) demonstrated generally higher CRGS enrichment scores than patients with non-atrophic gastritis (NAG) and chronic atrophic gastritis (CAG). Then, analysis of bulk RNA-seq data identified two distinct cuproptosis subtypes: cuproptosis activity – high (CA-H) and cuproptosis activity – low (CA-L). Systemic analyses on survival, biological function, immune cell infiltration and TME were conducted to illustrate the significance of the subtyping system. Moreover, a CRGS risk score signature was established for the quantification of risk level in GC patients. The CRGS risk score signature was proved to be intimately associated with clinicopathological factors, as well as sensitivity to chemotherapy and immunotherapy responses. Finally, a nomogram was constructed to enhance the clinical utility of the CRGS risk score model.
Materials and Methods
Data Acquisition
The workflow of the total study is depicted in Figure S1. The single-cell expression dataset GSE13452015 was downloaded from the Gene Expression Omnibus (GEO) database. Bulk RNA-seq profiles and clinical information of five large GC cohorts (TCGA-STAD, GSE62254 for ACRG typing, GSE15459 and GSE34942 for Lei typing, and GSE84437) were retrieved from TCGA and GEO databases. The baseline information for GC patients from these five cohorts is listed in Table S1. After excluding patients with a follow-up time less than 30 days, a total of 1274 patients were selected for further analysis. The fragments per kilobase million (FPKM) values of TCGA RNA-seq data were converted into transcripts per kilobase million (TPM) values, which were believed to resemble the microarray data values in GEO datasets. Five cohorts were merged into a meta-cohort after eliminating batch effects using R package “sva”.
Establishment of CRGS Gene Set and Analysis of Single-Cell Sequencing Data
We selected 13 key regulatory genes for cuproptosis from a previous article and formed a gene set termed protein lipoylation and copper transportation.9 In addition, five cuproptosis-related Gene Ontology (GO) gene sets were extracted from the article, namely, 4 iron, 4 sulfur cluster binding; Iron–sulfur cluster binding; Aerobic respiration; Cellular respiration; and Electron transport chain. Detailed information on the six CRGSs is displayed in Table S2.
For analysis of GSE134520 scRNA-seq data, we performed dimension reduction and t-distributed stochastic neighbor embedding (t-SNE) methods using R package “Seurat”. The mean enrichment score (ES) of the six CRGS gene sets was calculated by single-sample gene set enrichment analysis (ssGSEA) using the “GSVA” package in R, and was used to reflect the cuproptosis activity.
Identification of GC Cuproptosis Subtypes Based on CRGS Gene Set Scoring
In the meta-cohort, each GC patient’s ES of the six gene sets was evaluated by the ssGSEA method, as described above. Next, we classified GC patients into different molecular subtypes based on the enrichment pattern of the six CRGSs using R package “ConsensusClusterPlus”. The optimal clustering number was determined by the k-means algorithm and cumulative distribution function (CDF) curve. The stability of our clustering was evaluated by principal component analysis (PCA).
Correlation of GC Cuproptosis Subtype with Clinical Features and Prognosis
To evaluate the clinical application value of the GC cuproptosis subtyping system, we analyzed the relationship between cuproptosis subtypes and clinicopathological factors, including age, gender, tumor, node, metastasis (T, N, M) status and tumor stage, using the chi-squared test. Differences in overall survival (OS) were assessed by the log-rank test and the results were displayed using Kaplan–Meier curves generated by the “survival” and “survminer” R packages.
Biological Pathway and Immune Cell Infiltration Analysis of GC Cuproptosis Subtypes
To shed light on the differences in biological function between GC cuproptosis subtypes, the Kyoto Encyclopedia of Genes and Genomes (KEGG) gene sets “c2.cp.kegg.v7.0.symbol.gmt” were downloaded from the MsigDB database (http://www.gsea-msigdb.org) for gene set enrichment analysis (GSEA). In addition, two well-defined biological signature gene sets, the Hallmark gene set16 and the gene set developed by Mariathasan,17 were used for ssGSEA. The ESs were quantitative indices for the enrichment level of different biological functions. Furthermore, to determine the correlation of the cuproptosis subtypes with the immune landscape, we extracted marker genes of 28 types of immune cells from the article by Charoentong et al and estimated the content of each type of immune cell using the ssGSEA method as well.18
Tumor Microenvironment Analysis of GC Cuproptosis Subtypes
To shed further light on the features of cuproptosis subtypes in the TME, we quantified the portion of tumor and non-tumor cells of each patient via the Estimation of STromal and Immune cells in MAlignant Tumor tissues using Expression data (ESTIMATE) algorithm,19 and compared the scoring differences between cuproptosis subtypes. The calculation process was achieved using R package “estimate”. The results of the ESTIMATE analysis contained four parameters: immune score and stromal score, representing the relative content of immune cells and stromal cells in the TME, respectively; ESTIMATE score, representing the aggregation of immune and stromal contents; and tumor purity, representing the relative content of tumor cells.
Identification of Gene Subtypes Based on Differentially Expressed Genes
To explore the gene expression pattern of the GC cuproptosis subtyping system, we employed R package “limma” to screen out differentially expressed genes (DEGs) between different cuproptosis subtypes under the log2|fold change|>0.585 and adjusted P<0.01 criteria. DEGs were further subjected to KEGG and GO functional enrichment analysis using the “clusterprofiler” package in R. Then, we sought to classify GC patients into different gene subtypes based on the expression pattern of these DEGs in an attempt to further verify the existence of the cuproptosis subtyping system.
Construction of CRGS Risk Score Signature
We developed a stepwise Cox regression procedure to quantify the CRGS-related risk level and thus to quantify the risk level for GC patients. First, univariate Cox regression analysis was performed to primarily evaluate the prognostic value of DEGs in the meta-cohort. Then, TCGA-STAD was used as the training cohort to conduct least absolute shrinkage and selection operator (LASSO) regression analysis using R package “glmnet”. DEGs with statistical significance were further screened out for the construction of the CRGS risk score signature. The formula for the risk score is as follows:
Risk score = Σ (Exp i * Coef i)
where Exp i and Coef i represent the expression and LASSO Cox coefficient, respectively, of each gene. Patients in the training cohort were classified into high- and low-risk groups according to the median value of the risk score. Subsequently, the risk score signature was applied to the ACRG cohort (GSE62254), Lei cohort (GSE15459 and GSE34942), GSE84437 and the meta-cohort for external validation. The stratification of patients’ risk level was based on the same cut-off value in training cohort. All of the datasets were subjected to Kaplan–Meier and time-dependent receiver operating characteristics (ROC) curve analysis to estimate the predictive efficacy of the CRGS risk score signature.
Tissue Sample Acquisition and Detection of Genes in CRGS Risk Score Signature
Six pairs of GC tumor and adjacent normal tissues were obtained during surgical removal in Renmin Hospital of Wuhan University. We obtained written informed consent from all participants (No. SAMPGICU2019-2), and the study was approved by the Ethics Committee of Renmin Hospital of Wuhan University (No. NCT03972956V1.1). Total RNA was extracted using TRIzol reagent (Invitrogen) and then reverse transcribed into complementary DNA (cDNA) using 1st Strand cDNA Synthesis SuperMix for qPCR (Yeasen). Real-time quantitative polymerase chain reaction (RT-qPCR) was performed on the LightCycler instrument (Roche) using Universal Blue qPCR SYBR Green Master Mix (Yeasen). We used the 2-ΔΔCT method to estimate the expression levels and the results were normalized to GAPDH. The primer sequences used for RT-qPCR in this study are listed in Table 1.
Clinical Correlation and Subtype Intersection Analysis of CRGS Risk Score Signature
To investigate the clinical significance of the CRGS risk score signature, we first compared the frequency of different clinicopathological factors between the two risk groups. Next, we stratified patients into different clinical subgroups according to tumor stage (I–II and III–IV), grade (G1–G2 and G3), tumor location (proximal, body/fundus and distal), T status (T1–T2 and T3–T4), N status (N0 and N1–N3), M status (M0 and M1) and recurrence (yes and no), and compared the risk score differences quantitatively. Furthermore, we sought to investigate the cross-talk between the current CRGS risk score signature and other existing GC subtyping systems, namely TCGA, ACRG, Lauren and Lei classifications.
Biological Function, TME Scoring and Immune Cell Infiltration Analysis of CRGS Risk Score Signature
To gain more insight into the TME landscape of the CRGS risk score signature, differences in biological function, TME scoring and immune cell infiltration between high- and low-risk groups were analyzed. Comparisons were conducted in the meta-cohort and each individual cohort to verify the stability of the analysis.
Somatic Variation Analysis of CRGS Risk Score Signature
Tumor mutation burden (TMB) is a quantitative parameter estimating the total number of somatic non-synonymous mutations per coding area of a tumor genome.20 High TMB represents better OS in cancer patients after receiving immune checkpoint blockade (ICB) treatment.21–23 Using annotation files downloaded from TCGA database, the TMB value of each sample was estimated in Perl software.14 We compared the TMB score differences between high- and low-risk patients. Spearman correlation analysis was also performed to test the correlation between TMB and risk scores. Detailed information on the top 20 most frequently mutated genes in GC were visualized by a waterfall plot using the “maftools” package in R.
Immunotherapeutic Sensitivity Analysis of CRGS Risk Score Signature
Two parameters were used to estimate the sensitivity of GC patients to ICB treatment: immunophenoscore (IPS) and Tumor Immune Dysfunction and Exclusion (TIDE) scoring. Calculated by unbiased machine learning methods, IPS is a parameter reflecting immunogenicity. Higher IPS represents better accuracy for the corresponding result. The IPS results of anti-CTLA4 and anti-PD1 treatment responses for TCGA patients were downloaded from The Cancer Immunome Atlas (TCIA, https://tcia.at/home). TIDE scoring is a computational method combining two primary mechanisms in tumor evasion: T-cell dysfunction and T-cell exclusion. A higher tumor TIDE score correlates with not only worse response, but also unfavorable survival after receiving anti-PD1 and anti-CTLA4 therapies.24 We obtained the TIDE scoring values, including dysfunction score, exclusion score and TIDE score, for patients in all five cohorts following the workflow on the TIDE website (http://tide.dfci.harvard.edu/) and compared the scoring differences between high- and low-risk groups. Finally, we applied the CRGS risk score to two external ICB cohorts and compared survival differences between high- and low-risk patients after ICB treatment. The two ICB cohorts were IMvigor210 (urothelial carcinoma patients receiving anti-PD-L1 treatment) and Braun’s cohort25 (clear cell renal cell carcinoma patients receiving anti-PD1 treatment).
Chemotherapeutic Sensitivity Analysis of CRGS Risk Score Signature
R package “pRRophetic” was developed on the basis of the Genomics of Drug Sensitivity in Cancer (GDSC) database, which used empirical Bayesian approach and ridge regression methodology with 10-fold cross-validation to fit transcriptome data of tissue samples with the experiment-based drug sensitivity profiles of multiple cancer cell lines. Here, we calculated the IC50 values for six anti-tumor drugs, namely 5-fluorouracil, cisplatin, methotrexate, doxorubicin, vinblastine and paclitaxel, in gastrointestinal cell lines, and analyzed the differences in IC50 values between high- and low-risk groups.
Development of a Nomogram Based on CRGS Risk Score Signature
To enhance the clinical utility of the CRGS risk score signature, we established a nomogram incorporating CRGS risk score and other clinicopathological factors for predicting patients’ survival at different time points using R package “rms”. The predictive efficacy of the nomogram was verified by calibration curves, time-dependent ROC curves and decision curve analysis (DCA).26
Statistical Analysis
All statistical analyses were performed in R version 4.1.2. The Wilcoxon rank-sum test was conducted to compare numerical variables. The log-rank test was performed to evaluate the differences in survival and Kaplan–Meier plots were drawn to visualize the results. The predictive efficacy of the variables was verified by the area under the ROC curve (AUC), which was calculated by R package “survivalROC”. Univariate and multivariate Cox proportional hazard regression analyses were used to determine the independent prognostic factors, and the results were displayed in the form of forest plots using the “forestplot” package in R.
Results
Alteration of Cuproptosis Activity During GC Initiation from the Single-Cell Level
To assess the alteration of cuproptosis activity during GC oncogenesis, we analyzed the GSE134520 dataset, which contained scRNA-seq profiles from samples of non-atrophic gastritis (NAG), chronic atrophic gastritis (CAG), intestinal metaplasia (IM) and EGC (Figure 1a). We calculated the ES of six CRGSs in each single cell and made a comparison of scoring differences within four sample groups. As shown in Figure 1b, CRGS ESs were at relatively low levels in the NAG and CAG stages, markedly up-regulated during IM and remained high when EGC happened. Therefore, cuproptosis activities were correlated with the severity of precancerous lesions and were still highly activated in the cancer stage, which to some extent reflected the potential implication of cuproptosis in the pathogenesis of GC. Our present analysis provided references for future mechanistic studies investigating the machineries underlying the NAG–CAG–IM–EGC progression cascade.
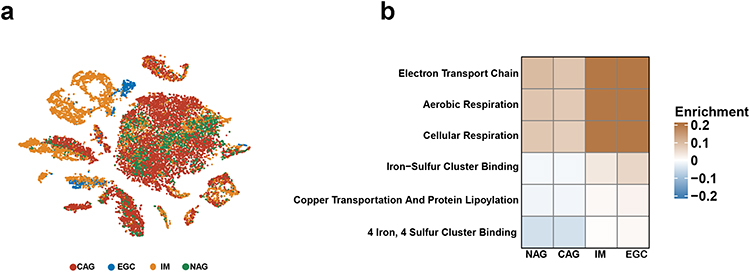 |
Figure 1 Alterations in CRGS enrichment scores for patients with different diseases. (a) t-Distributed stochastic neighbor embedding (t-SNE) plots colored by different sample groups. (b) Heatmaps showing the enrichment differences of six CRGSs per cell within different sample groups. Abbreviations: CAG, chronic atrophic gastritis; CRGS, cuproptosis-related gene set; EGC, early gastric cancer; IM, intestinal metaplasia; NAG, non-atrophic gastritis. |
Identification of GC Cuproptosis Subtypes Based on CRGS Gene Set Scoring
In the meta-cohort, we quantified degree of enrichment for each GC patient on six CRGSs and performed unsupervised consensus clustering analysis. CDF curve and k-means algorithm analyses both confirmed the robustness of categorizing GC patients into two clusters, cluster A and cluster B (Figure 2a–c). PCA further verified the clustering stability (Figure 2d). As shown in Figure 2e, cluster A was characterized by up-regulated cuproptosis activity owing to an overall higher enrichment level of six CRGSs, while the cuproptosis activity was suppressed in cluster B. Thus, we renamed clusters A and B as subtypes CA-H and CA-L, respectively. With respect to clinical features, it was demonstrated that the CA-L subtype was tightly associated with advanced T status and tumor stage (Figure 2e). Moreover, Kaplan–Meier analysis indicated that patients of the CA-H subtype had a better OS than CA-L patients (log-rank P<0.001) (Figure 2f).
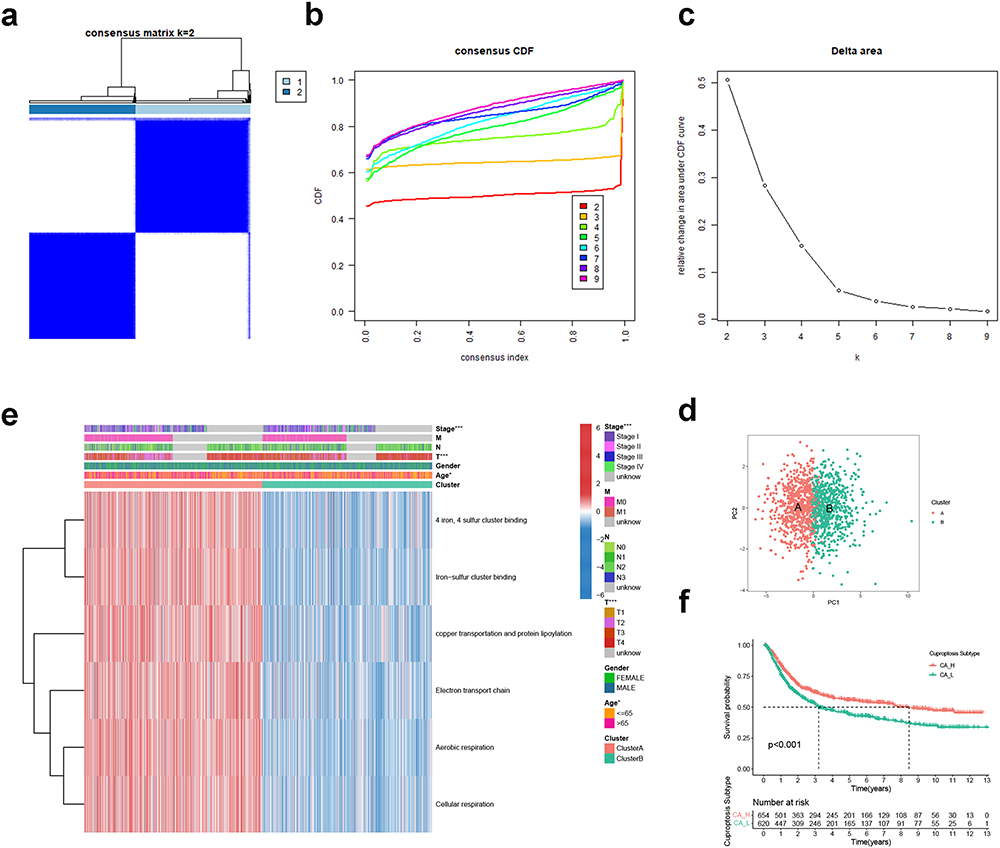 |
Figure 2 Identification of GC cuproptosis subtypes based on CRGS gene set scoring. (a) Unsupervised consensus clustering identified two GC cuproptosis clusters. (b–d) CDF curve, k-means algorithm and PCA showing the robustness and stability of the clustering. (e) Heatmap showing the CRGS enrichment pattern and clinical features of two cuproptosis subtypes. (f) Kaplan–Meier analysis of cuproptosis subtypes. Statistical significance: *P<0.05; ***P<0.001. Abbreviations: CA-H, cuproptosis activity – high; CA-L, cuproptosis activity – low; CDF, cumulative distribution function; CRGS, cuproptosis-related gene set; GC, gastric cancer; PCA, principal component analysis. |
Biological Signatures Enriched in Two Cuproptosis Subtypes
To investigate the underlying mechanism of GC cuproptosis subtyping, we first performed GSEA . As shown in Figure 3a and b, biological signatures correlating with cell proliferation (cell cycle and DNA replication) and metabolism (oxidative phosphorylation, TCA cycle and pyrimidine metabolism) were enriched in the CA-H subtype. By contrast, the CA-L subtype was correlated with carcinogenic activities such as calcium signaling pathway, extracellular matrix receptor interaction and focal adhesion. Next, ssGSEA further confirmed these findings: most carcinogenic pathways had a heightened enrichment level in the CA-L subtype (Wnt-β-catenin signaling, transforming growth factor-β signaling, Notch signaling, etc), while signatures relating to cell cycle, postmutational repair (E2F target, G2M checkpoint and DNA repair; DNA damage repair, mismatch repair, cell cycle regulator, etc) and metabolism (glycolysis, fatty acid metabolism, cholesterol homeostasis, etc) were highly enriched in the CA-H group. In addition, it was suggested that the CA-L subtype also maintained a stroma-activating phenotype, since the ESs of stromal activity-related signatures such as epithelial–mesenchymal transformation, hypoxia, angiogenesis, EMT2 and EMT3 were significantly higher in the CA-L subtype (Figure 3c and d).
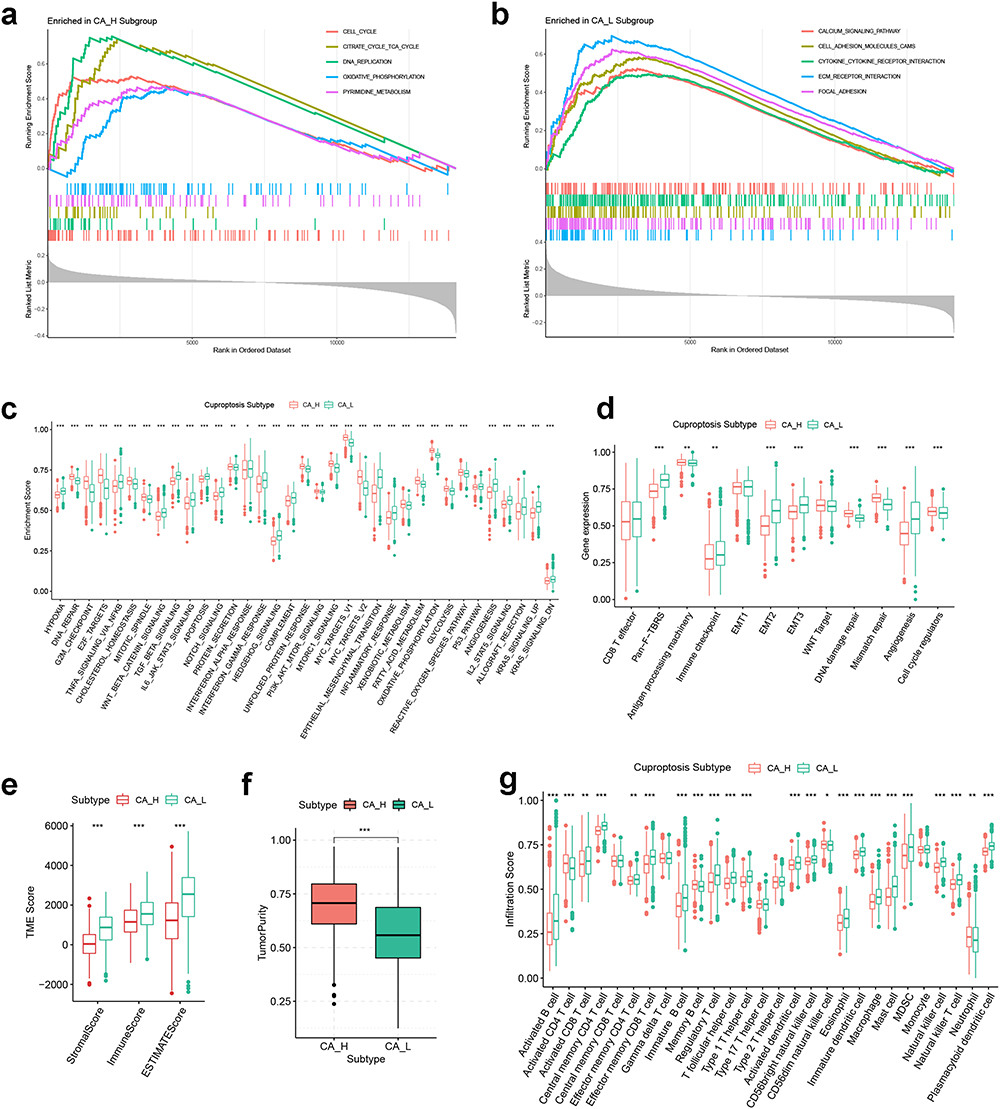 |
Figure 3 Biological function, TME score and immune cell infiltration analyses of GC cuproptosis subtyping system. GSEA functional analysis based on KEGG gene set for (a) CA-H patients and (b) CA-L patients. ssGSEA based on (c) Hallmark gene set and (d) Mariathasan gene set. Differences in (e) immune/stromal/ESTIMATE scores and (f) tumor purity between CA-H and CA-L subtypes. (g) Differences in immune cell infiltration between CA-H and CA-L subtypes. Statistical significance: *P<0.05; **P<0.01; ***P<0.001. Abbreviations: CA-H, cuproptosis activity – high; CA-L, cuproptosis activity – low; GC, gastric cancer; GSEA, gene set enrichment analysis; KEGG, Kyoto Encyclopedia of Genes and Genomes; TME, tumor microenvironment. |
To gain an insight into the differences in TME landscape between the two GC cuproptosis subtypes, we calculated the TME score as well as the immune cell infiltration score in each GC patient, and compared their differences between the two cuproptosis subtypes. It was found that the CA-L group exhibited higher immune/stromal/ESTIMATE scores and lower tumor purity compared with CA-H (Figure 3e and f). Thus, the TME of the CA-L subtype was characterized by larger proportions of stromal and immune cells, while a high abundance of cancer cells was correlated with the CA-H subtype. Consistent with this, the majority of immune cells were more densely infiltrated in the CA-L subtype, while the CA-H subtype exhibited higher abundance for activated CD4 T cells and memory B cells (Figure 3g). In addition, the impact of the abundance of 28 types of immune cells on the survival of GC patients was analyzed by Kaplan–Meier methods and is demonstrated in Figure S2.
Identification of Gene Subtypes Based on DEGs
To explore the gene expression pattern of GC cuproptosis subtyping, we identified 560 genes that were differentially expressed between the two cuproptosis subtypes (Table S3). Functional analysis revealed that the DEGs were correlated with KEGG items in relation to cell cycle and carcinogenic activity (Figure 4a), as well as GO items in relation to stromal activity (Figure 4b), which was identical to the biological signature of the two cuproptosis subtypes. Next, we performed unsupervised consensus clustering based on the DEGs, and two distinct DEG subtypes were identified (Figure S3). Better OS and higher cuproptosis activity could be observed in DEG subtype A, whereas subtype B was associated with lower cuproptosis activity (Figure 4c) and worse OS (Figure 4d). More importantly, the two DEG subtypes were very similar to the two cuproptosis subtypes in terms of differences in biological function (Figure 4e and f), TME scoring (Figure 4g and h) and immune cell infiltration (Figure 4i), which supports the potential utility of using DEG subtypes to represent the cuproptosis subtypes.
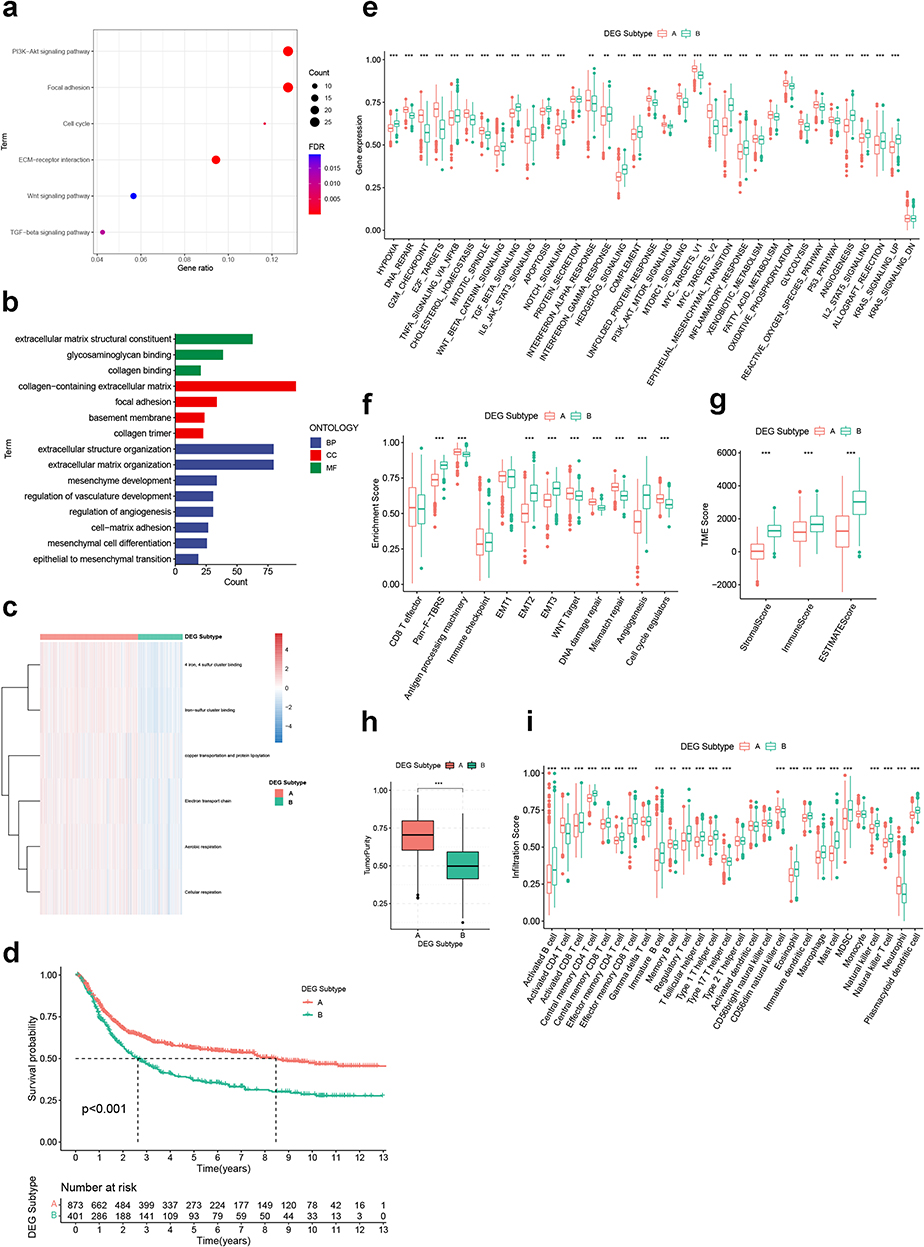 |
Figure 4 Identification of DEG subtypes. (a and b) KEGG and GO analysis for DEGs. (c) Heatmap showing the enrichment pattern of six CRGSs in two DEG subtypes. (d) Kaplan–Meier analysis of two DEG subtypes. (e and f) ssGSEA based on the Hallmark gene set and Mariathasan’s gene set. (g and h) Differences in immune/stromal/ESTIMATE scores and tumor purity between two DEG subtypes. (i) Differences in immune cell infiltration between two DEG subtypes. Statistical significance: **P<0.01; ***P<0.001. Abbreviations: BP, biological process; CC, cellular compartment; CRGS, cuproptosis-related gene set; DEG, differentially expressed gene; GO, Gene Ontology; KEGG, Kyoto Encyclopedia of Genes and Genomes; MF, molecular function; ssGSEA, single-sample gene set enrichment analysis. |
For quantification of GC patients’ degree of risk, we first performed univariate Cox analysis in the meta-cohort and screened out 513 prognosis-related DEGs (Table S4). Then, TCGA-STAD was used as a training cohort for construction of the risk score signature. LASSO Cox regression analysis was conducted on 513 prognosis-related DEGs, and six genes were finally filtered out based on the minimum partial likelihood deviance (Figure 5a and b). Risk scores were calculated as follows:
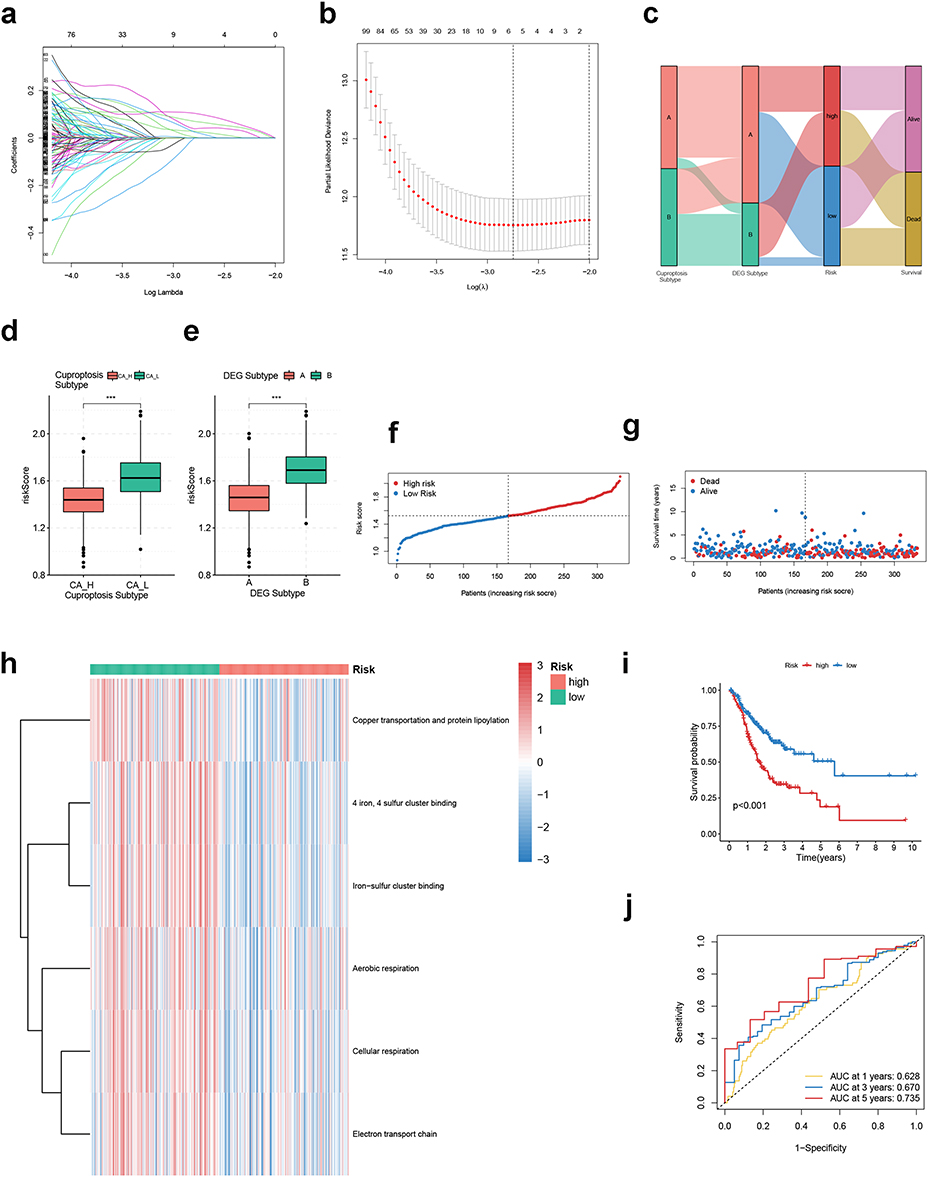 |
Figure 5 Construction of CRGS risk score signature in training cohort. (a) LASSO coefficients of prognosis-related DEGs. (b) Ten-fold cross-validation for tuning parameter selection in the LASSO model. (c) Waterfall plot showing distributions of cuproptosis subtype and DEG subtype in high and low CRGS risk score groups. Risk score differences between (d) two cuproptosis subtypes and (e) two DEG subtypes. (f) Risk score distribution curve. The blue line represents risk scores for low-risk patients; the red line represents risk scores for high-risk patients. (g) Scatter plot showing the relationship between survival status and risk score. The horizontal ordinate represents the number of patients; the vertical ordinate represents the risk score. (h) Heatmap comparing the enrichment differences of six CRGSs between high- and low-risk patients. (i) Kaplan–Meier analysis for high- and low-risk patients. (j) ROC curve for predicting 1-, 3- and 5-year OS of the CRGS risk score model. Statistical significance: ***P<0.001. Abbreviations: CRGS, cuproptosis-related gene set; DEG, differentially expressed gene; LASSO, least absolute shrinkage and selection operator; OS, overall survival; ROC, receiver operating characteristics. |
Risk score = (0.0405 × expression of PRICKLE1) + (0.0001 × expression of GJA1) + (0.0262 × expression of APOD) + (0.0678 × expression of GPX3) + (0.0203 × expression of GRP) + (0.1009 × expression of SERPINE1). Patients in the training cohort were then divided into high- and low-risk groups according to the median risk score. The intersections of CRGS risk level with cuproptosis subtype, DEG subtype and survival status were demonstrated in a waterfall plot (Figure 5c). We observed significant differences in the risk score between the two cuproptosis subtypes and DEG subtypes, with the risk score being higher in cuproptosis subtype CA-L and gene subtype B (Figure 5d and e). The distribution of the risk score and its correlation with patients’ survival outcomes are shown in Figure 5f and g, respectively. It was suggested that the cuproptosis activity was generally lower in the high-risk group compared with the low-risk group (Figure 5h). Furthermore, Kaplan–Meier analysis correlated low-risk patients with prolonged OS (log-rank P<0.001) (Figure 5i). The predictive efficacy of the CRGS risk score model was subsequently estimated by time-dependent ROC analysis. As shown in Figure 5j, the AUC values for predicting 1-, 3- and 5-year OS were 0.628, 0.670 and 0.735, respectively. In addition, we performed DCA to estimate the net benefit of prognosis prediction based on the CRGS risk score signature and three previously established cuproptosis-related gene (CRG) risk models,27–29 which were called risk models 1–3, respectively. In general, the predictive performance of our CRGS risk score signature was more favorable than that of CRG risk models 1 and 2. Compared with CRG risk model 3, the CRGS risk score signature was also more effective in forecasting GC patients’ survival probabilities at 1 and 3 years, but was inferior to it for the prediction of 5-year OS (Figure S4).
To further evaluate its predictive performance, we validated the CRGS risk score signature in the ACRG cohort (GSE62254), Lei cohort (GSE15459 and GSE34942), GSE84437 and the meta-cohort (Figure S5–S8). The risk score calculation and risk level stratification used the same standards as in the training cohort. We found that high cuproptosis activities (Figures S5c, S6c, S7c and S8c) and advantages in survival (Figures S5d, S6d, S7d and S8d) still existed for low-risk patients. Besides, the risk score signature retained its perfect predictive ability across different cohorts, as the AUC values for predicting 1-, 3- and 5-year OS were all over 0.600 (Figures S5e, S6e, S7e and S8e).
Detection of Prognosis-Related DEGs in Tissue Samples
The expression levels of six prognosis-related DEGs used for CRGS risk score signature construction were detected in six pairs of GC tumor and adjacent normal tissues by RT-qPCR. In general, five genes (APOD, GJA1, GPX3, GRP and PRICKLE1) had a significantly lower expression level in tumor tissues compared with adjacent normal tissues, while the difference in expression of SERPINE1 between tumor and normal tissues did not reach statistical significance (Figure S9).
Biological Function and TME Landscape Analysis of CRGS Risk Score Signature
To explore the mechanism contributing to the differences in prognosis between high- and low-risk patients, analyses were conducted from the perspectives of biological function and TME landscape. First, we analyzed biological signatures enriched in high- and low-risk groups through Hallmark ssGSEA (Figure 6a for TCGA cohort; Figure S10 for ACRG cohort, Lei cohort, GSE84437 and meta-cohort). It was found that high-risk patients scored higher on stromal and immune activities, such as epithelial–mesenchymal transition (EMT), hypoxia, angiogenesis, interferon-gamma response and allograft rejection, whereas low-risk patients were correlated with cell-cycle related items including DNA repair, mismatch repair, E2F targets, G2M checkpoint and mitotic spindle. Next, differences in TME scores and immune cell infiltration were also compared to determine the TME characteristics in high- and low-risk patients. For TME scores, we observed increased stromal/immune/ESTIMATE scores and decreased tumor purity for high-risk patients (Figure 6b and c for TCGA cohort; Figure S11 for ACRG cohort, Lei cohort, GSE84437 and meta-cohort). Therefore, it was speculated that the TME of high-risk patients was characterized by abundant immune and stromal contents. In support of this, the majority of immune cells were more densely populated in the TME of high-risk patients, while low-risk patients had heightened infiltration levels of activated CD4 T cells (Figure 6d for TCGA cohort; Figure S12 for ACRG cohort, Lei cohort, GSE84437 and meta-cohort).
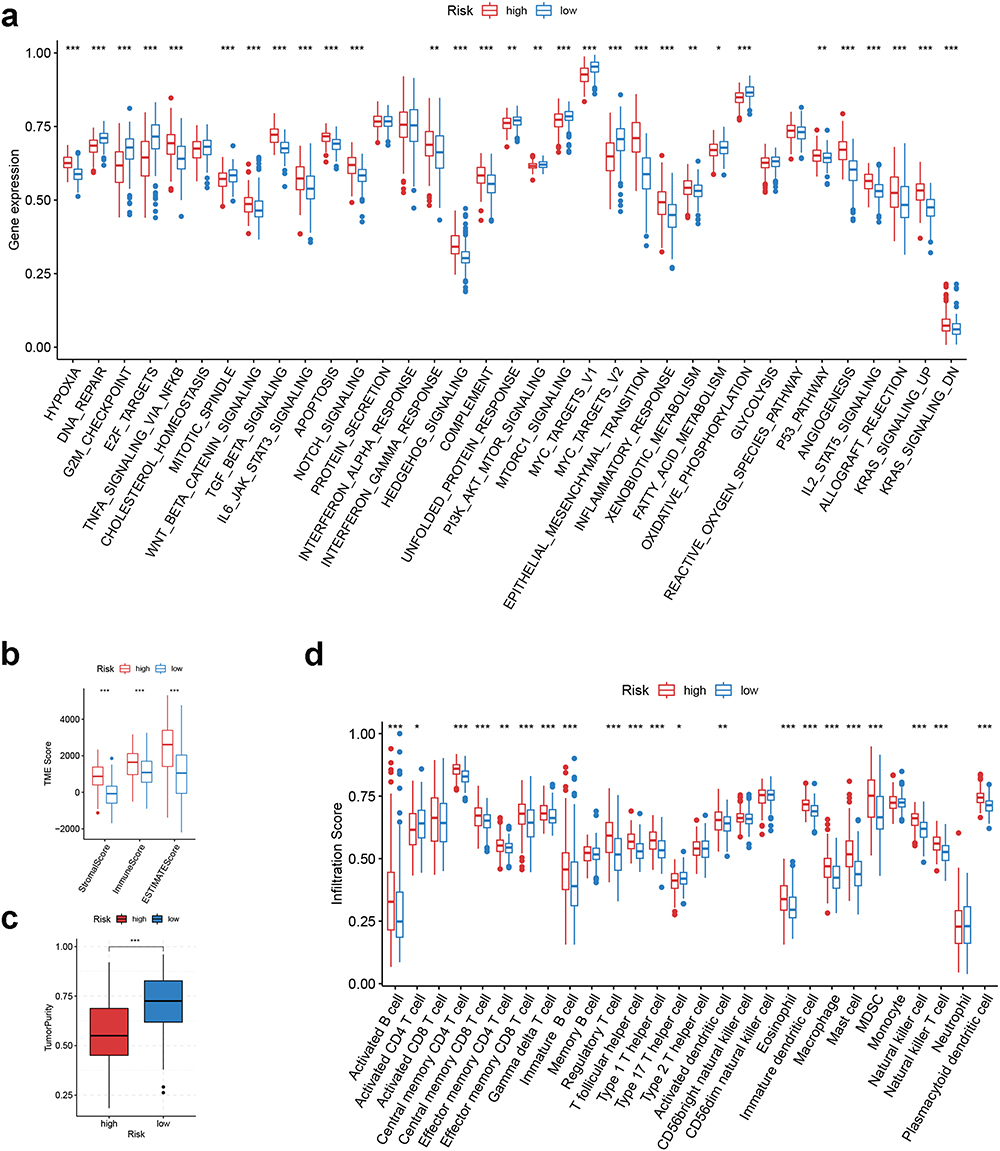 |
Figure 6 Biological function and TME landscape analysis of CRGS risk score signature in the training cohort. (a) Hallmark ssGSEA for high- and low-risk patients. (b and c) Differences in immune/stromal/ESTIMATE scores and tumor purity between high- and low-risk patients. (d) Differences in immune cell infiltration between high- and low-risk patients. Statistical significance: *P<0.05; **P<0.01; ***P<0.001. Abbreviations: CRGS, cuproptosis-related gene set; ssGSEA, single-sample gene set enrichment analysis; TME, tumor microenvironment. |
Clinical Correlation and Subtype Intersection Analysis of CRGS Risk Score Signature
To investigate the clinical indicative value of the CRGS risk score signature, we focused on each individual cohort and explored the association between risk score and clinicopathological factors separately. In GSE62254, patients with advanced T status and tumor stage, as well as recurrent disease, were more commonly seen in the high-risk group (Figure 7a). Risk scores in patients with T3–T4 status, M1 status and III–IV tumor stage, as well as patients undergoing tumor recurrence, were all significantly higher (Figure 7b). In TCGA cohort, a larger proportion of patients with more advanced T status, tumor grade and tumor stage was classified into the high-risk group (Figure S13a). Patients with G3 tumor grade tended to exhibit higher risk scores than G1–G2 patients (Figure S13b). Elevated risk scores could also be observed in patients with advanced TNM status and tumor stage, although the differences did not reach statistical significance (Figure S13b). Higher risk scores were also confirmed to be intimately correlated with more advanced tumor stages in the Lei cohort (Figure S13c), as well as with more progressive T and N status in GSE84437 (Figure S13d). Furthermore, to evaluate the predictive efficacy of the CRGS risk score in predicting prognosis in GC patients, we performed univariate and multivariate Cox analysis incorporating the risk score and other clinical features in each individual cohort. Except for the Lei cohort, in which the hazard ratio for the risk score did not reach statistical significance by multivariate Cox analysis, a high-level risk score was proved to be a prognosticator for worse survival outcomes in the other three datasets (Figure S14).
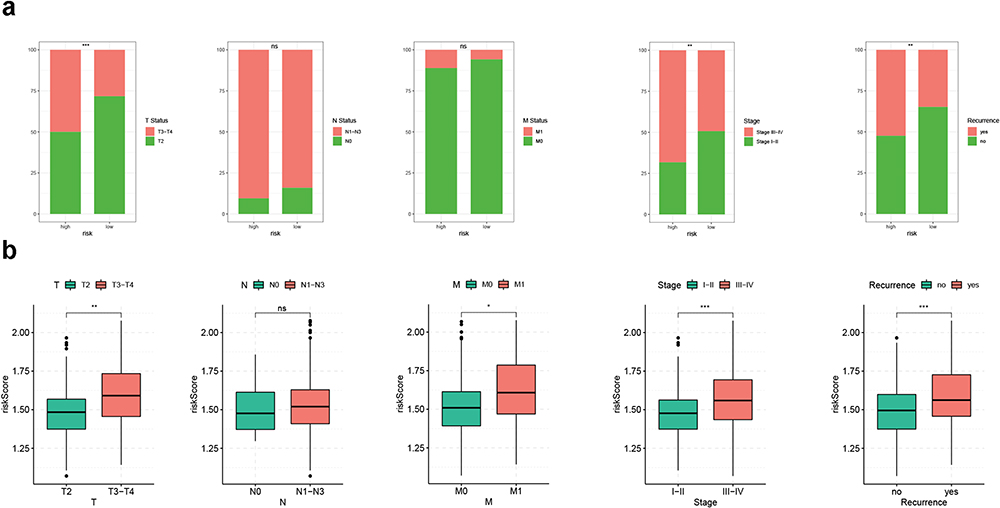 |
Figure 7 Clinical correlation analysis of CRGS risk score signature in the ACRG cohort (GSE62254). (a) Bar plots showing the frequencies of different clinical features in high- and low-risk patients. (b) Boxplots showing risk score differences in different T status, N status, M status, tumor stage and recurrence status subgroups. Statistical significance: *P<0.05; **P<0.01; ***P<0.001. Abbreviations: ACRG, Asian Cancer Research Group; CRGS, cuproptosis-related gene set; ns, not significant. |
In addition, we explored the cross-talk between the CRGS risk score signature and other GC typing systems. It was suggested that subtypes with dismal prognosis, including the CIN/GS subtypes (TCGA typing), EMT subtype (ACRG typing), diffuse subtype (Lauren typing) and invasive subtype (Lei typing), were more frequently observed in high-risk patients (Figure S15a–f). Furthermore, there were significant differences in the risk score distribution among existing GC typing systems (Figure S15g–l). Therefore, the present analysis confirmed the intimate associations between CRGS risk score signature and other GC subtypes.
Somatic Variation Analysis of CRGS Risk Score Signature
To shed light on the gene mutation landscape of the CRGS risk score model, we downloaded somatic mutation data from TCGA database and calculated the TMB, as previously described. As shown in Figure 8a, high-risk patients in TCGA cohort had decreasedTMB scores compared with low-risk patients. A negative correlation between TMB level and risk score was observed according to Spearman correlation analysis (R=−0.37, P<0.01) (Figure 8b). In the waterfall plots depicting the detailed information on the top 20 most frequently mutated genes, a generally higher mutation frequency could be observed in low-risk patients (Figure 8c and d). Furthermore, we analyzed the risk score differences between the wild-type (WT) and mutant type (MT) of these 20 genes. It was suggested that patients with MT of many of these genes had lower risk scores than patients with WT (Figure S16). In addition, Kaplan–Meier analysis identified high TMB level as a prognosticator for prolonged OS (Figure 8e). Finally, we divided TCGA patients into four strata according to TMB and CRGS risk level, and it was suggested that patients with low TMB and a high risk level showed the most adverse survival outcome (Figure 8f).
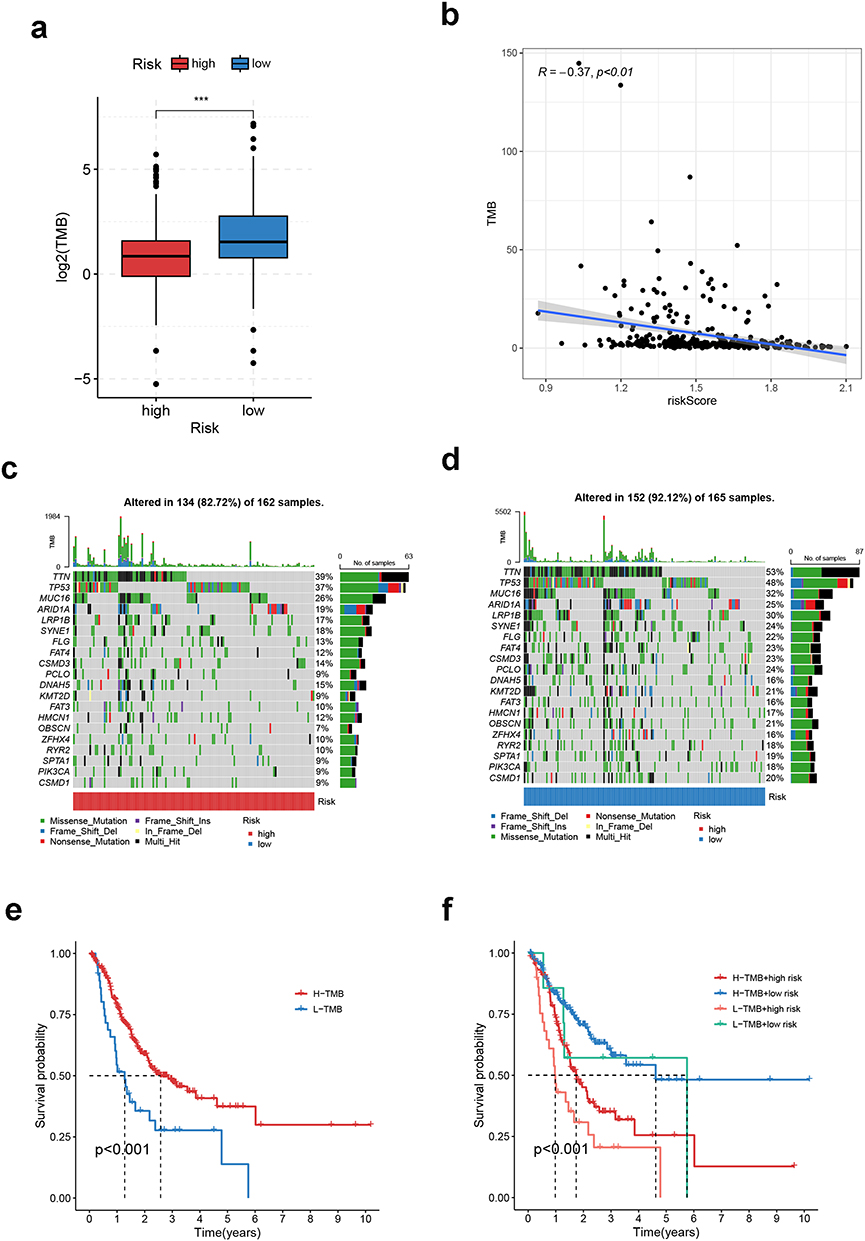 |
Figure 8 Somatic variation analysis of CRGS risk score signature. (a) Boxplot showing the difference in TMB between high- and low-risk patients. (b) Spearman correlation analysis of TMB and the risk score. (c and d) Waterfall plots depicting the gene mutation landscape of the top 20 most frequently mutated genes in GC in high- and low-risk patients. Each column represents an individual patient. The upper bar plot shows TMB. The percentage on the right represents the mutation frequency of each gene. The right bar plot shows the frequency of each mutation type. (e) Kaplan–Meier curves for high- and low-TMB GC patients. (f) Kaplan–Meier curves of patients stratified by both TMB and risk level. Statistical significance: ***P<0.001. Abbreviations: CRGS, cuproptosis-related gene set; GC, gastric cancer; TMB, tumor mutation burden. |
Immunotherapeutic Sensitivity Analysis of CRGS Risk Score Signature
Since the present CRGS risk score signature showed a strong correlation with TMB, which could be used as an indicator for ICB treatment, we decided to further explore whether patients at different risk levels exhibited distinct responses towards immunotherapy. First, the IPSs of anti-CTLA4+ anti-PD1+, anti-CTLA4− anti-PD1+ and anti-CTLA4+ anti-PD1− were all higher in TCGA low-risk patients, indicating the better sensitivity of low-risk patients to anti-CTLA4 and/or PD1 ICB treatment (Figure 9a–c). The following TIDE analysis in the meta-cohort and each individual cohort further corroborated that tumor cells of high-risk patients were more capable of escaping immune surveillance, as the dysfunction, exclusion and TIDE scores were all higher in the high-risk group (Figure 9d–h). Moreover, two external ICB cohorts (IMvigor210 and Braun’s cohort) were enrolled for the application of the CRGS risk score. It was suggested that the low-risk patients in both cohorts had significantly prolonged OS after ICB treatment compared with their high-risk counterparts (Figure 9i and j). Based on the above analyses, it was concluded that low-risk patients were more likely to benefit from ICB treatment.
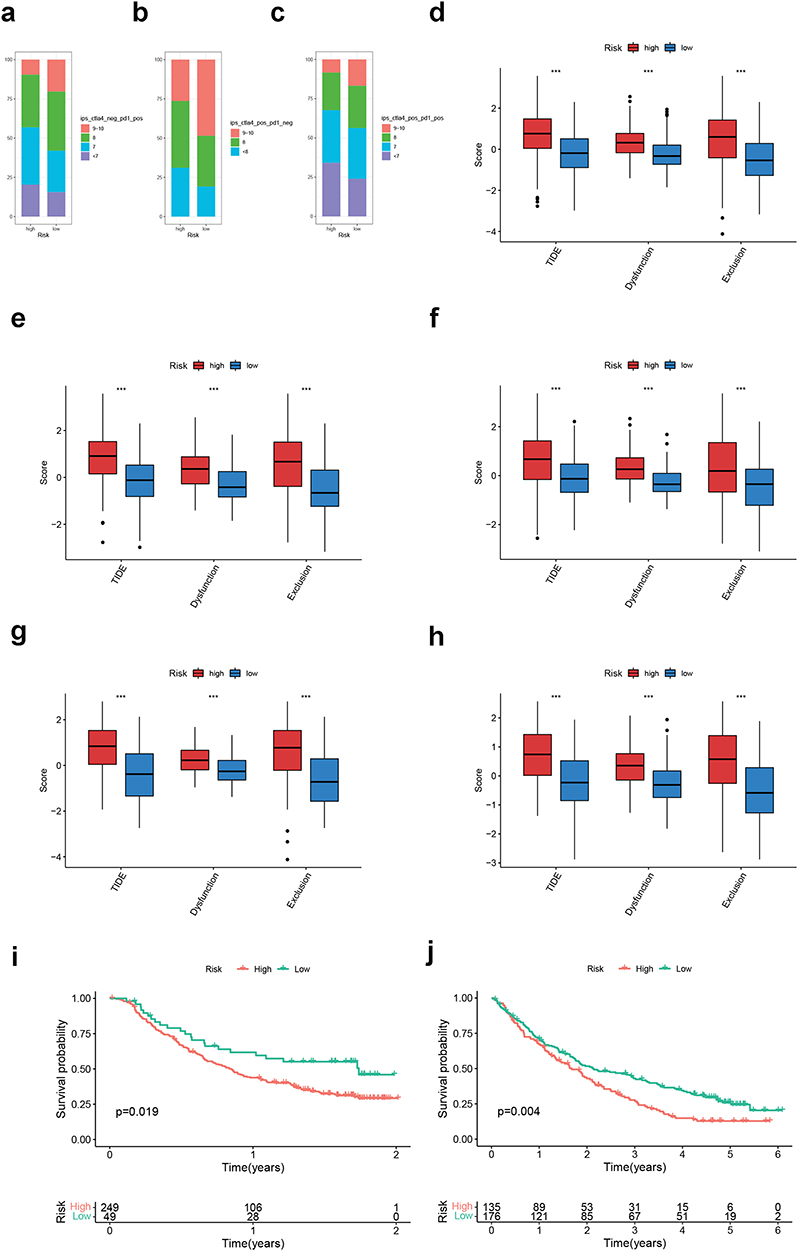 |
Figure 9 Immunotherapeutic sensitivity analysis of CRGS risk score signature. (a–c) Bar plots showing IPS differences for ICB treatment between high- and low-risk groups in TCGA cohort. Boxplots showing differences in TIDE scoring between high- and low-risk patients in (d) meta-cohort, (e) TCGA cohort, (f) GSE62254, (g) Lei cohort and (h) GSE84437. (i and j) Kaplan–Meier plots for high- and low-risk patients in IMvigor210 and Braun’s cohort. Statistical significance: ***P<0.001. Abbreviations: CRGS, cuproptosis-related gene set; ICB, immune checkpoint blockade; IPS, immunophenoscore; TCGA, The Cancer Genome Atlas; TIDE, Tumor Immune Dysfunction and Exclusion. |
Chemotherapeutic Sensitivity Analysis of CRGS Risk Score Signature
To investigate the potential value of the CRGS risk score signature in predicting the response to chemotherapy, we first stratified patients in GSE62254 into four categories on the basis of CRGS risk level and chemotherapy completion status (C for completed, N/NC for not done/not completed) of adjuvant chemotherapy (ADJC). As shown in Figure 10a and b, completed ADJC contributed to prolonged OS and disease-free survival for both high- and low-risk patients. Furthermore, we selected six kinds of commonly used anti-tumor drugs and compared their IC50 differences between high- and low-risk patients (Figure 10c for meta-cohort, Figure 10d for TCGA cohort, Figure 10e for GSE62254, Figure 10f for Lei cohort, Figure 10g for GSE84437). The IC50 values for methotrexate and 5-fluorouracil were significantly lower in low-risk patients, while high-risk patients were more sensitive to cisplatin, doxorubicin, vinblastine and paclitaxel.
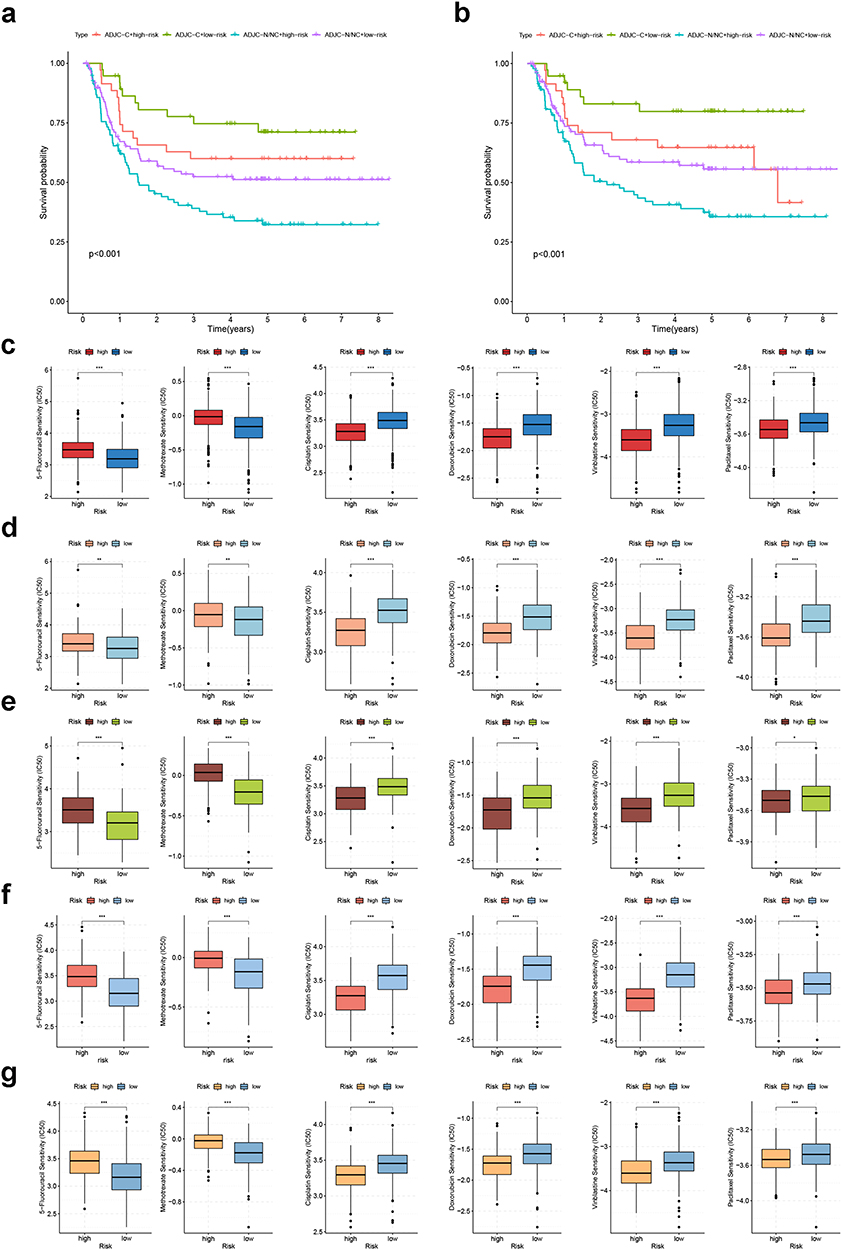 |
Figure 10 Chemotherapeutic sensitivity analysis of CRGS risk score signature. Kaplan–Meier plots showing the impact of chemotherapy on patients’ (a) overall survival and (b) disease-free survival in GSE62254. Boxplots showing IC50 differences for 5-fluorouracil, methotrexate, cisplatin, doxorubicin, vinblastine and paclitaxel between high- and low-risk patients in (c) meta-cohort, (d) TCGA cohort, (e) GSE62254, (f) Lei cohort and (g) GSE84437. Statistical significance: *P<0.05; **P<0.01; ***P<0.001. Abbreviations: CRGS, cuproptosis-related gene set; TCGA, The Cancer Genome Atlas. |
Development of a Nomogram Based on CRGS Risk Score Signature
Considering the inconvenience of using the CRGS risk score in clinical practice, we sought to develop a nomogram integrating CRGS risk score and other clinical factors. TCGA cohort and GSE62254 were selected for construction in light of their relatively complete clinical profiles. As depicted in Figure 11a, the variables of the nomogram included age, gender, T, N, M status, TNM stage and CRGS risk score. Each variable was given a specific score, and the total score could be obtained by adding the individual scores together. AUC values of the nomogram for predicting 1-, 3- and 5-year OS were 0.731, 0.764 and 0.772, respectively (Figure 11b). Compared with each composing element of the nomogram, the total point showed superior efficacy in predicting the time-dependent OS of GC patients (Figure 11c–e). Moreover, DCA revealed that the total score displayed better net benefit than the age-, gender-, T status-, N status-, M status- and stage-only model for predicting 1-, 3- and 5-year survival (Figure 11f–h). In addition, calibration curves showed high consistency between actual 1-, 3- and 5-year OS and the values predicted by the nomogram (Figure 11i–k).
 |
Figure 11 Development and validation of a nomogram based on the CRGS risk score signature. (a) Nomogram integrating risk score, age, gender, T, N, M status and tumor stage for predicting 1-, 3- and 5-year OS. (b) Time-dependent ROC curve of the nomogram for predicting 1-, 3- and 5-year OS. (c–e) Time‐dependent ROC curves evaluating the efficacy of the nomogram to predict 1-, 3- and 5-year OS, compared with other factors, including age, gender, T, N, M status and tumor stage. (f–h) DCA curves estimating the predictive efficacy of the nomogram from the perspective of clinical benefit. The y-axis refers to the net benefit. The x-axis refers to the predicted OS. The black line represents the hypothesis that all patients survive for 5 years. The gray line represents the hypothesis that no patients stay alive for more than one year. (i–k) Calibration curves of the nomogram for predicting 1-, 3- and 5-year OS. The gray lines represent the ideal predictive model and the red lines represent the observed model. Abbreviations: AUC, area under the curve; CRGS, cuproptosis-related gene set; DCA, decision curve analysis; OS, overall survival; ROC, receiver operating characteristics; T, N, M, tumor, node, metastasis. |
Discussion
Non-apoptotic PCD, including autophagy, ferroptosis, pyroptosis and necroptosis, has been proved to have a close relationship with the initiation and progression of malignant tumors. Several previous studies successfully established risk score signatures for GC based on four types of PCD.30–34 In 2022, Tsvetkov et al put forward a novel non-apoptotic PCD mode induced by copper, named cuproptosis.9 Compared with other non-apoptotic PCD modes, cuproptosis is less dependent on the production of reactive oxygen species but relies more heavily on mitochondrial respiration. As a newly identified cell death mode, the current understanding on cuproptosis is very limited, and whether or not this type of PCD participates in tumorigenesis remains to be fully elucidated. Thus, the current work intends to make some primary exploration in this field.
Through scRNA-seq analysis, it was demonstrated that the CRGS enrichment scores were correlated with the severity of precancerous lesions and were still highly activated in GC, suggesting that cuproptosis was possibly implicated in the pathogenesis of GC. Then, analysis of bulk RNA-seq data identified two distinct cuproptosis subtypes based on the enrichment pattern of six CRGSs. Subtype CA-H was characterized by high cuproptosis activity and optimistic prognosis, while subtype CA-L, with worse prognosis, was correlated with reduced cuproptosis activity, up-regulation of carcinogenic pathways, and a TME with abundant immune/stromal contents and low tumor purity. In addition, two gene subtypes were identified based on the DEGs between the two cuproptosis subtypes. The cuproptosis activity, survival outcome, biological function and TME landscape of the two DEG subtypes were highly consistent with those of the two cuproptosis subtypes, which provided a rationale for the existence of cuproptosis patterns in GC patients. In order to quantify patients’ risk level, we established a CRGS risk score signature based on prognosis-related DEGs. A series of systemic analysis was performed to identify the differences in biological function, TME landscape, clinical features, somatic variation and treatment responses between high- and low-risk patients on the risk score signature. High-risk patients, with adverse prognosis, were characterized by higher immune and stromal contents in the TME, more advanced clinicopathological features and better sensitivity to a wider range of anti-tumor drugs. Low-risk patients, although correlated with higher tumor purity, instead exhibited more favorable clinical outcomes and a higher sensitivity to immunotherapy. Notably, the CRGS risk score-based patient classification were tightly associated with other currently existing GC typing systems, and the GC subtypes with unfavorable clinical outcomes also took up a larger proportion in the high risk group. Finally, a nomogram incorporating the risk score and other clinicopathological features was constructed to enhance the clinical utility of the CRGS risk score model.
In the current study, patients with different cuproptosis subtypes or CRGS risk levels had totally distinct survival outcomes, which could be attributed to discrepancies in clinical features, biological function and TME landscape.35 First, in terms of clinical features, CA-L and high-risk patients, both correlated with shortened OS, were characterized by unfavorable clinicopathological factors. Second, with respect to biological function, carcinogenic pathways were proved to have higher enrichment levels in CA-L and high-risk patients. Third, from the perspective of the TME landscape, it was suggested that most of the prognosis-related immune cells were differentially infiltrated between patients of different cuproptosis subtypes or CRGS risk level.
The anti-tumor immune response is a multi-step procedure, during which the activation of CD4 T cell plays an important role.36 Mechanistically, CD4 T cells exert their anti-tumor function by either directly eliminating tumor cells or indirectly modulating the TME.37 The induction of CD4 T-cell response has been shown to yield favorable clinical outcomes.38 The tumor-suppressive role of memory B cells is also evidence based. For instance, higher memory B-cell density can be observed in melanoma patients who respond to ICB treatment compared with non-responders.39 Besides, combined ICB and radiation therapy has been proved to promote the infiltration of memory B cells in the TME of human papillomavirus (HPV)-associated squamous cell cancer.40 In the present study, we confirmed that the high abundance of activated CD4 T cells and memory B cells indicated good prognosis for GC patients (Figure S2). In accordance with this, a higher enrichment score of activated CD4 T cells could be observed in both the CA-H subtype and low-risk group. Besides, a high abundance of memory B cells was associated with CA-H subtype. Kaplan–Meier analysis revealed the adverse effect of plasmacytoid dendritic cells on survival in GC patients. Consistently, plasmacytoid dendritic cells were highly infiltrated in both CA-L and low-risk patients with dismal prognosis. Moreover, the present analysis identified natural killer T cells, T follicular helper cells and central memory CD4 T cells as risky immune cells indicating adverse survival outcomes. Consistent with this, the CA-L subtype as well as the high-risk group with impaired OS displayed a higher abundance of these three types of immune cells.
In addition to the immune cells mentioned above, myeloid-derived suppressive cells (MDSCs) and regulatory T cells (Tregs) are regarded as two “bad guys” with an immunosuppressive phenotype in the TME;41 high densities of these cells indicate adverse clinical outcomes in many types of malignancies, including colorectal cancer,42,43 non-small cell lung cancer42,44 and breast cancer45. Herein, increased infiltration levels of these two cell types were still observed in patients with the CA-L subtype and low-risk patients, both of which are subgroups with shortened OS.
Furthermore, the current CRGS risk score signature was also capable of predicting the response of GC patients to immunotherapy and chemotherapy. Immunotherapy is rapidly gaining in popularity and has already become a standard treatment strategy for cancer patients. The most widely used modality to date is the blockade of immune checkpoint inhibitors, namely ICB therapy. However, the benefit of ICB treatment is limited to a minority of patients with certain cancer types,46 and GC had been shown not to respond very well to ICB treatment.47 In the present work, we concluded that low-risk patients on the CRGS risk score model may respond better to ICB treatment owing to their higher TMB and lower TIDE scores compared with their high-risk counterparts. In line with this, IPSs for anti-CTLA4 and/or anti-PD1 immunotherapy were all at high levels for low-risk patients. Moreover, two external immunotherapeutic cohorts were enrolled and it was found that low-risk patients demonstrated improved OS after ICB treatment, which supported the conclusion identifying low-risk patients as potential beneficiaries of immunotherapies.
The present study had certain limitations. First, since research on cuproptosis is still in its infancy, the cuproptosis-related gene signatures emergingin the future will need to be incorporated to enhance the specificity of the current model. Second, since the present TME analysis only focused on the stationary immune cell infiltrations, some dynamic features of infiltrating cells remain to be fully elucidated. Analytical tools that may be useful to tackle with this issue include pseudotime analysis, delineating the temporal sequence of cell differentiation, and cell chat analysis, revealing the intercellular communication pathways. Third, because all of our conclusions were drawn by retrospectively analyzing data from public databases, a case selection bias was inevitable. Therefore, future prospective and large-scale studies in the real world are warranted to verify the current findings.
Conclusion
The current work elucidated that cuproptosis plays an important role in the regulation of the TME landscapes of GC. Two cuproptosis subtypes with distinct TME characteristics were identified. In addition, we established a CRGS risk score signature to quantify the risk level of GC patients. This novel CRGS risk score signature could provide novel insights into accurate prediction and personalized treatment for GC patients.
Abbreviations
ACRG, Asian Cancer Research Group; AUC, area under the curve; CAG, chronic atrophic gastritis; CRGS, cuproptosis-related gene set; DCA, decision curve analysis; DEG, differentially expressed gene; EGC, early gastric cancer; ES, enrichment score; GC, gastric cancer; GEO, Gene Expression Omnibus; ICB, immune checkpoint blockade; IM, intestinal metaplasia; NAG, non-atrophic gastritis; OS, overall survival; PCD, programmed cell death; ROC, receiver operating characteristics; ssGSEA, single-sample gene set enrichment analysis; TCGA, The Cancer Genome Atlas; TMB, tumor mutation burden; TME, tumor microenvironment.
Data Sharing Statement
The datasets supporting the conclusions of this article are available in The Cancer Genome Atlas (https://portal.gdc.cancer.gov) and Gene Expression Omnibus (https://www.ncbi.nlm.nih.gov/geo).
Ethics Approval and Consent to Participate
The study design was in accordance with the Declaration of Helsinki and approved by the Ethics Committee of Renmin Hospital of Wuhan University (No. NCT03972956V1.1), and we have obtained informed consent from the patients for using GC samples (No. SAMPGICU2019-2).
Author Contributions
All authors made a significant contribution to the work reported, whether that is in the conception, study design, execution, acquisition of data, analysis and interpretation, or in all these areas; took part in drafting, revising or critically reviewing the article; gave final approval of the version to be published; have agreed on the journal to which the article has been submitted; and agree to be accountable for all aspects of the work.
Disclosure
The authors report no conflicts of interest in this work.
References
1. Sung H, Ferlay J, Siegel RL, et al. Global Cancer Statistics 2020: GLOBOCAN Estimates of Incidence and Mortality Worldwide for 36 Cancers in 185 Countries. CA Cancer J Clin. 2021;71(3):209–249. doi:10.3322/caac.21660
2. Hanahan D, Weinberg RA. Hallmarks of cancer: the next generation. Cell. 2011;144(5):646–674. doi:10.1016/j.cell.2011.02.013
3. Kerr JF, Wyllie AH, Currie AR. Apoptosis: a basic biological phenomenon with wide-ranging implications in tissue kinetics. Br J Cancer. 1972;26(4):239–257. doi:10.1038/bjc.1972.33
4. Roberts AW, Seymour JF, Brown JR, et al. Substantial susceptibility of chronic lymphocytic leukemia to BCL2 inhibition: results of a Phase I study of navitoclax in patients with relapsed or refractory disease. J Clin Oncol. 2012;30(5):488–496. doi:10.1200/JCO.2011.34.7898
5. Wilson WH, O’Connor OA, Czuczman MS, et al. Navitoclax, a targeted high-affinity inhibitor of BCL-2, in lymphoid malignancies: a Phase 1 dose-escalation study of safety, pharmacokinetics, pharmacodynamics, and antitumour activity. Lancet Oncol. 2010;11(12):1149–1159. doi:10.1016/S1470-2045(10)70261-8
6. Roberts AW, Davids MS, Pagel JM, et al. Targeting BCL2 with Venetoclax in Relapsed Chronic Lymphocytic Leukemia. N Engl J Med. 2016;374(4):311–322. doi:10.1056/NEJMoa1513257
7. Stilgenbauer S, Eichhorst B, Schetelig J, et al. Venetoclax in relapsed or refractory chronic lymphocytic leukaemia with 17p deletion: a multicentre, open-label, Phase 2 study. Lancet Oncol. 2016;17(6):768–778. doi:10.1016/S1470-2045(16)30019-5
8. Strasser A, Vaux DL. Cell death in the origin and treatment of cancer. Mol Cell. 2020;78(6):1045–1054. doi:10.1016/j.molcel.2020.05.014
9. Tsvetkov P, Coy S, Petrova B, et al. Copper induces cell death by targeting lipoylated TCA cycle proteins. Science. 2022;375(6586):1254–1261. doi:10.1126/science.abf0529
10. The Cancer Genome Atlas Research Network. Comprehensive molecular characterization of gastric adenocarcinoma. Nature. 2014;513(7517):202–209. doi:10.1038/nature13480
11. Cristescu R, Lee J, Nebozhyn M, et al. Molecular analysis of gastric cancer identifies subtypes associated with distinct clinical outcomes. Nat Med. 2015;21(5):449–456. doi:10.1038/nm.3850
12. Lei Z, Tan IB, Das K, et al. Identification of molecular subtypes of gastric cancer with different responses to PI3-kinase inhibitors and 5-fluorouracil. Gastroenterology. 2013;145(3):554–565. doi:10.1053/j.gastro.2013.05.010
13. Xiang R, Ge Y, Song W, Ren J, Kong C, Fu T. Pyroptosis Patterns Characterized by Distinct Tumor Microenvironment Infiltration Landscapes in Gastric Cancer. Genes. 2021;12:10. doi:10.3390/genes12101535
14. Xiang R, Song W, Ren J, Wu J, Fu J, Fu T. Identification of stem cell-related subtypes and risk scoring for gastric cancer based on stem genomic profiling. Stem Cell Res Ther. 2021;12(1):563. doi:10.1186/s13287-021-02633-x
15. Zhang P, Yang M, Zhang Y, et al. Dissecting the single-cell transcriptome network underlying gastric premalignant lesions and early gastric cancer. Cell Rep. 2019;27(6):1934–1947 e1935. doi:10.1016/j.celrep.2019.04.052
16. Subramanian A, Tamayo P, Mootha VK, et al. Gene set enrichment analysis: a knowledge-based approach for interpreting genome-wide expression profiles. Proc Natl Acad Sci U S A. 2005;102(43):15545–15550. doi:10.1073/pnas.0506580102
17. Mariathasan S, Turley SJ, Nickles D, et al. TGFbeta attenuates tumour response to PD-L1 blockade by contributing to exclusion of T cells. Nature. 2018;554(7693):544–548. doi:10.1038/nature25501
18. Charoentong P, Finotello F, Angelova M, et al. Pan-cancer immunogenomic analyses reveal genotype-immunophenotype relationships and predictors of response to checkpoint blockade. Cell Rep. 2017;18(1):248–262. doi:10.1016/j.celrep.2016.12.019
19. Yoshihara K, Shahmoradgoli M, Martinez E, et al. Inferring tumour purity and stromal and immune cell admixture from expression data. Nat Commun. 2013;4:2612. doi:10.1038/ncomms3612
20. Melendez B, Van Campenhout C, Rorive S, Remmelink M, Salmon I, D’Haene N. Methods of measurement for tumor mutational burden in tumor tissue. Transl Lung Cancer Res. 2018;7(6):661–667. doi:10.21037/tlcr.2018.08.02
21. Valero C, Lee M, Hoen D, et al. The association between tumor mutational burden and prognosis is dependent on treatment context. Nat Genet. 2021;53(1):11–15. doi:10.1038/s41588-020-00752-4
22. Samstein RM, Lee CH, Shoushtari AN, et al. Tumor mutational load predicts survival after immunotherapy across multiple cancer types. Nat Genet. 2019;51(2):202–206. doi:10.1038/s41588-018-0312-8
23. Cao D, Xu H, Xu X, Guo T, Ge W. High tumor mutation burden predicts better efficacy of immunotherapy: a pooled analysis of 103078 cancer patients. Oncoimmunology. 2019;8(9):e1629258. doi:10.1080/2162402X.2019.1629258
24. Jiang P, Gu S, Pan D, et al. Signatures of T cell dysfunction and exclusion predict cancer immunotherapy response. Nat Med. 2018;24(10):1550–1558. doi:10.1038/s41591-018-0136-1
25. Braun DA, Hou Y, Bakouny Z, et al. Interplay of somatic alterations and immune infiltration modulates response to PD-1 blockade in advanced clear cell renal cell carcinoma. Nat Med. 2020;26(6):909–918. doi:10.1038/s41591-020-0839-y
26. Vickers AJ, Elkin EB. Decision curve analysis: a novel method for evaluating prediction models. Med Decis Making. 2006;26(6):565–574. doi:10.1177/0272989X06295361
27. Wang J, Qin D, Tao Z, et al. Identification of cuproptosis-related subtypes, construction of a prognosis model, and tumor microenvironment landscape in gastric cancer. Front Immunol. 2022;13:1056932. doi:10.3389/fimmu.2022.1056932
28. Nie H, Wang H, Zhang M, et al. Comprehensive analysis of cuproptosis-related genes in prognosis, tumor microenvironment infiltration, and immunotherapy response in gastric cancer. J Cancer Res Clin Oncol. 2022. doi:10.1007/s00432-022-04474-4
29. Wang XX, Deng SZ, Wu LH, et al. Cuproptosis-Mediated Patterns Characterized by Distinct Tumor Microenvironment and Predicted the Immunotherapy Response for Gastric Cancer. ACS Omega. 2023;8(12):10851–10862. doi:10.1021/acsomega.2c07052
30. Wang Z, Cao L, Zhou S, Lyu J, Gao Y, Yang R. Construction and Validation of a Novel Pyroptosis-Related Four-lncRNA Prognostic Signature Related to Gastric Cancer and Immune Infiltration. Front Immunol. 2022;13:854785. doi:10.3389/fimmu.2022.854785
31. Qiu J, Sun M, Wang Y, Chen B. Identification and validation of an individualized autophagy-clinical prognostic index in gastric cancer patients. Cancer Cell Int. 2020;20:178. doi:10.1186/s12935-020-01267-y
32. Pan J, Zhang X, Fang X, Xin Z. Construction on of a Ferroptosis-Related lncRNA-Based Model to Improve the Prognostic Evaluation of Gastric Cancer Patients Based on Bioinformatics. Front Genet. 2021;12:739470. doi:10.3389/fgene.2021.739470
33. Wei J, Zeng Y, Gao X, Liu T. A novel ferroptosis-related lncRNA signature for prognosis prediction in gastric cancer. BMC Cancer. 2021;21(1):1221. doi:10.1186/s12885-021-08975-2
34. Luo L, Li L, Liu L, et al. A Necroptosis-Related lncRNA-Based Signature to Predict Prognosis and Probe Molecular Characteristics of Stomach Adenocarcinoma. Front Genet. 2022;13:833928. doi:10.3389/fgene.2022.833928
35. Huo J, Fan X, Qi B, Sun P. A Five-Gene Signature Associated With DNA Damage Repair Molecular Subtype Predict Overall Survival for Hepatocellular Carcinoma. Front Genet. 2022;13:771819. doi:10.3389/fgene.2022.771819
36. Xu L, Deng C, Pang B, et al. TIP: a Web Server for Resolving Tumor Immunophenotype Profiling. Cancer Res. 2018;78(23):6575–6580. doi:10.1158/0008-5472.CAN-18-0689
37. Ostroumov D, Fekete-Drimusz N, Saborowski M, Kuhnel F, Woller N. CD4 and CD8 T lymphocyte interplay in controlling tumor growth. Cell Mol Life Sci. 2018;75(4):689–713. doi:10.1007/s00018-017-2686-7
38. Melssen M, Slingluff CL. Vaccines targeting helper T cells for cancer immunotherapy. Curr Opin Immunol. 2017;47:85–92. doi:10.1016/j.coi.2017.07.004
39. Helmink BA, Reddy SM, Gao J, et al. B cells and tertiary lymphoid structures promote immunotherapy response. Nature. 2020;577(7791):549–555. doi:10.1038/s41586-019-1922-8
40. Kim SS, Shen S, Miyauchi S, et al. B Cells Improve Overall Survival in HPV-Associated Squamous Cell Carcinomas and Are Activated by Radiation and PD-1 Blockade. Clin Cancer Res. 2020;26(13):3345–3359. doi:10.1158/1078-0432.CCR-19-3211
41. Pitt JM, Marabelle A, Eggermont A, Soria JC, Kroemer G, Zitvogel L. Targeting the tumor microenvironment: removing obstruction to anticancer immune responses and immunotherapy. Ann Oncol. 2016;27(8):1482–1492. doi:10.1093/annonc/mdw168
42. De Simone M, Arrigoni A, Rossetti G, et al. Transcriptional Landscape of Human Tissue Lymphocytes Unveils Uniqueness of Tumor-Infiltrating T Regulatory Cells. Immunity. 2016;45(5):1135–1147. doi:10.1016/j.immuni.2016.10.021
43. Liao W, Overman MJ, Boutin AT, et al. KRAS-IRF2 Axis Drives Immune Suppression and Immune Therapy Resistance in Colorectal Cancer. Cancer Cell. 2019;35(4):559–572 e557. doi:10.1016/j.ccell.2019.02.008
44. Yamauchi Y, Safi S, Blattner C, et al. Circulating and Tumor Myeloid-derived Suppressor Cells in Resectable Non-Small Cell Lung Cancer. Am J Respir Crit Care Med. 2018;198(6):777–787. doi:10.1164/rccm.201708-1707OC
45. Bates GJ, Fox SB, Han C, et al. Quantification of regulatory T cells enables the identification of high-risk breast cancer patients and those at risk of late relapse. J Clin Oncol. 2006;24(34):5373–5380. doi:10.1200/JCO.2006.05.9584
46. Sharma P, Hu-Lieskovan S, Wargo JA, Ribas A. Primary, Adaptive, and Acquired Resistance to Cancer Immunotherapy. Cell. 2017;168(4):707–723. doi:10.1016/j.cell.2017.01.017
47. Coutzac C, Pernot S, Chaput N, Zaanan A. Immunotherapy in advanced gastric cancer, is it the future? Crit Rev Oncol Hematol. 2019;133:25–32. doi:10.1016/j.critrevonc.2018.10.007
 © 2023 The Author(s). This work is published and licensed by Dove Medical Press Limited. The full terms of this license are available at https://www.dovepress.com/terms.php and incorporate the Creative Commons Attribution - Non Commercial (unported, v3.0) License.
By accessing the work you hereby accept the Terms. Non-commercial uses of the work are permitted without any further permission from Dove Medical Press Limited, provided the work is properly attributed. For permission for commercial use of this work, please see paragraphs 4.2 and 5 of our Terms.
© 2023 The Author(s). This work is published and licensed by Dove Medical Press Limited. The full terms of this license are available at https://www.dovepress.com/terms.php and incorporate the Creative Commons Attribution - Non Commercial (unported, v3.0) License.
By accessing the work you hereby accept the Terms. Non-commercial uses of the work are permitted without any further permission from Dove Medical Press Limited, provided the work is properly attributed. For permission for commercial use of this work, please see paragraphs 4.2 and 5 of our Terms.