")
Back to Journals » OncoTargets and Therapy » Volume 10
Identification of COX5B as a novel biomarker in high-grade glioma patients
Received 9 April 2017
Accepted for publication 22 September 2017
Published 15 November 2017 Volume 2017:10 Pages 5463—5470
DOI https://doi.org/10.2147/OTT.S139243
Checked for plagiarism Yes
Review by Single anonymous peer review
Peer reviewer comments 2
Editor who approved publication: Dr Samir Farghaly
Tieyi Hu,1 Jiazhuang Xi2
1Department of Neurology, 2Department of Public Health, The People’s Hospital of Dazu District Chongqing, Chongqing, People’s Republic of China
Background: Malignant glioma is the second leading cause of cancer-related death worldwide, and is known to exhibit a high degree of heterogeneity in its deregulation of different oncogenic pathways. The molecular subclasses of human glioma are not well known. Thus, it is crucial to identify vital oncogenic pathways in glioma with significant relationships to patient survival.
Methods: In this study, we devised a bioinformatics strategy to map patterns of oncogenic pathway activation in glioma, from the Gene Expression Omnibus (GEO). Bioinformatics analysis revealed that 749 genes were differentially expressed and classified into different glioma grades.
Results: Using gene expression signatures, we identified three oncogenic pathways (MAPK signaling pathway, Wnt signaling pathway, and ErbB signaling pathway) deregulated in the majority of human glioma. Following gene microarray analysis, the gene expression profile in the differential grade glioma was further validated by bioinformatic analyses, with coexpression network construction. Furthermore, we found that cytochrome c oxidase subunit Vb (COX5B), the terminal enzyme of the electron transport chain, was the central gene in a coexpression network that transfers electrons from reduced cytochrome c to oxygen and, in the process, generates an electrochemical gradient across the mitochondrial inner membrane. The expression level of COX5B was then detected in 87 glioma tissues as well as adjacent normal tissues using immunohistochemistry. We found that COX5B was significantly upregulated in 67 of 87 (77.0%) glioma and glioblastoma tissues, compared with adjacent tissue (p<0.01). Furthermore, statistical analysis showed the COX5B expression level was significantly associated with clinical stage and lymph node status, while there were no correlations between COX5B expression and age or tumor size.
Conclusion: These data indicate that COX5B may be implicated in glioma pathogenesis and as a biomarker for identification of the pathological grade of glioma.
Keywords: bioinformatics, COX5B, biomarker, glioblastoma
Background
Previous studies have demonstrated many solid cancers that are known to exhibit a high degree of heterogeneity in their deregulation of different oncogenic pathways.1–3 Glioma is a type of primary central nervous system (CNS), aggressive, lethal, solid tumor that arises from glial cells. The most common site of involvement of a glioma is the brain, but they can also affect the spinal cord, or any other part of the CNS, such as the optic nerves.4–7 Among these, glioblastoma (GBM) is the most common and most aggressive cancer, and represents 15% of brain tumors.8,9 There is no clear way to prevent the disease. Typically, treatment involves surgery after which chemotherapy and radiation therapies are used. The medication temozolomide is frequently used as part of chemotherapy.10 Genetic factors involved in the development of this disease remain poorly understood. Previous studies reported biologically relevant alterations in three core pathways, namely p53, Rb, and receptor tyrosine kinase (RTK)/Ras/phosphoinositide 3-kinase (PI3K) signaling, indicating that GBM is a molecularly heterogeneous disease.11–13 Many gene alterations found in these pathways to the distinct molecular and epigenetic subtypes of glioblastoma revealed that coordinated combinations were enriched in different molecular subtypes, which may affect clinical outcomes and the sensitivity of individual tumors to therapy. Initial publications describing glioma diversity in primary tumors have typically focused on single pathways, measuring a few biomarkers per experiment.14–17
Previous studies16,17 have been used to define the gene changes in cancer to predict the activity of oncogenic pathways in cancers by the use of Illumina gene chip. In our study, we hypothesized that patterns of oncogenic pathway activation could be used to develop a genomic taxonomy of glioma. We used Affymetrix Human Genome U133 Plus 2.0 Array, which allows for more than 77,000 genes to be examined, and provides higher sensitivity, to detail the global program of gene expression in different-grade glioma tissues and try to identify some genes associated with the tumorigenesis of gliomas and to develop a bioinformatic method to map activation levels of different pathways in cohorts of complex primary tumor profiles. The use of this powerful technology has resulted in the identification of a novel biomarker for human glioma, to further our understanding of glioma pathobiology by oncogenic pathway activity into biologically and clinically relevant subgroups.
Materials and methods
Microarray data preparation and analysis of human glioma
The raw data files and corresponding clinical data used in this study were downloaded from the public GEO databases (http://www.ncbi.nlm.nih.gov/geo/): GSE45921 and GSE43378. In te GSE45921 design, grades I to IV glioma tissues were selected in surgical procedures for RNA extraction and hybridization on Affymetrix Human Genome U133 Plus 2.0 Array. In the GSE43378 design, 50 glioma patients were selected for RNA extraction and hybridization on Affymetrix Human Genome U133 Plus 2.0 Array. Raw data of CEL files were normalized at transcript and gene level by means of the robust multi-array average (RMA) method (workflow). Median levels of transcript expressions were calculated. Gene-level data was then filtered to include only those probe sets with annotations.
Gene set enrichment analysis
After loading the R package “hgu133plus2.db” corresponding to the GPL570 platform on the bioconductor, the selected data were normalized and subjected to principal component analysis (PCA) by “appy” R package. Eventually, the expression set for data analysis was built. We conducted gene set enrichment analysis (GSEA) for the whole of the acquired data from GSE74195. GSEA is a computational method that determines whether a prior defined set of genes shows statistically significant consonant differences between two biological states. In this study, version 5.2 of the molecular signatures database (MSigDB) was obtained from the GSEA website. Then, the enrichment analysis was performed by the default weighted enrichment method, and the number of random combinations was set to 1,000 times. The normalized enrichment score (NES) was the primary statistic for examining gene set enrichment results. By normalizing the enrichment score, GSEA accounted for differences in gene set size and correlations between gene sets and the expression dataset. False discovery rates (FDRs) seen in <25% gene sets were considered to indicate significant enrichment gene sets. We present gene coexpression networks to identify interactions among genes. Based on the correlation between genes, the gene–gene interaction network was constructed, as described.18,19
Gene ontology (GO) and Kyoto Encyclopedia of Genes and Genomes (KEGG) analysis
One of the main uses of GO is to conduct enrichment analysis on gene sets. For example, given a set of genes that were upregulated under certain conditions, the enrichment analysis would find which GO terms were overexpressed or underexpressed using annotation for that gene set. The KEGG pathway is a collection of manually drawn pathway maps representing our knowledge of the molecular interaction and reaction network for cellular processes, human diseases, and so on. Because we have obtained the differently expressed genes (DEGs) annotation by R package from the latest version of Bioconductor (library “affy”, “limma” and “hgu133plus2.db”). Therefore, we could undertake GO and KEGG analysis in the search tool for the retrieval of interacting genes (STRING) database version 10.0 online.
Mapping pathway prediction signatures
Gene coexpression networks use the following analysis strategies: for the inputted expression profile of difference genes, we calculate the pair-wise correlation to construct a matrix for each gene pair. Next, we would get the adjacency matrix and the connected degree for each gene and every version (here, version denotes a test for optimal network). For each version (β value from 1 to 30), to make a linear regression for logP(k) and log(k) such that the two satisfy the linear condition best, the slope is approximately -1, and the average degree is not too small. Last, for any two genes, calculate the dissimilarity between them. Using the dissimilarity as distance, several modules and their hub nodes are obtained using a hybrid hierarchical clustering algorithm. Besides, if the expression data set does not satisfy the scale-free condition, then a threshold α is selected and, together with the correlation coefficient matrix, the adjacent matrix is generated.
RNA extraction and real-time RT-PCR analysis
Total RNA was extracted using TRIzol (Thermo Fisher Scientific, Waltham, MA, USA), according to the manufacturer’s instructions. Real-time PCR analysis was performed using Q Tag SYBR Green Master Mix (BD Biosciences, San Jose, CA, USA) and an Applied Biosystems 7500 Real-Time PCR System. Relative mRNA levels were determined by normalizing the obtained expression levels to the endogenous β-actin mRNA levels, using Microsoft Excel. For each of the indicated genes, the relative transcript levels of the control sample were set at 1, and the transcript levels of other samples were compared with the control. Quantitative RT-PCR reactions were conducted in triplicate.
Statistical analysis
For microarray analysis, differentially expressed genes were confirmed using a p-value threshold and FDR analysis. The threshold of truly significant genes was taken to be p-value less than 0.05 and FDR value less than 0.05. The statistical analysis was conducted with SPSS version 18.0 for Windows (SPSS Inc., Chicago, IL, USA). All data were expressed as mean ± SD. Statistical significance was evaluated by ANOVA or two-tailed t-test, and the results were considered significant at a p-value <0.05.
Results
Identification of differently expressed gene in human glioma
The workflow of this study was firstly carried out in Affymetrix Human Genome U133 plus2 Array from the publicly available GEO databases. For this, 72 grade I to IV glioma tissues were analyzed for potential transcriptome changes in glioma using a bioinformatics strategy. We found that 3,726 genes were deregulated in high grade glioma under the condition of “Q <0.05 and fold change >1.2.” Then, adjusting the condition to “Q <0.001 and fold change >2,” 749 deregulated genes were determined in the grade IV glioma group. In total, these differentially expressed genes are shown clustered in Figure 1. Hierarchical clustering showed top 20 gene expression signatures in high-grade glioma tissues.
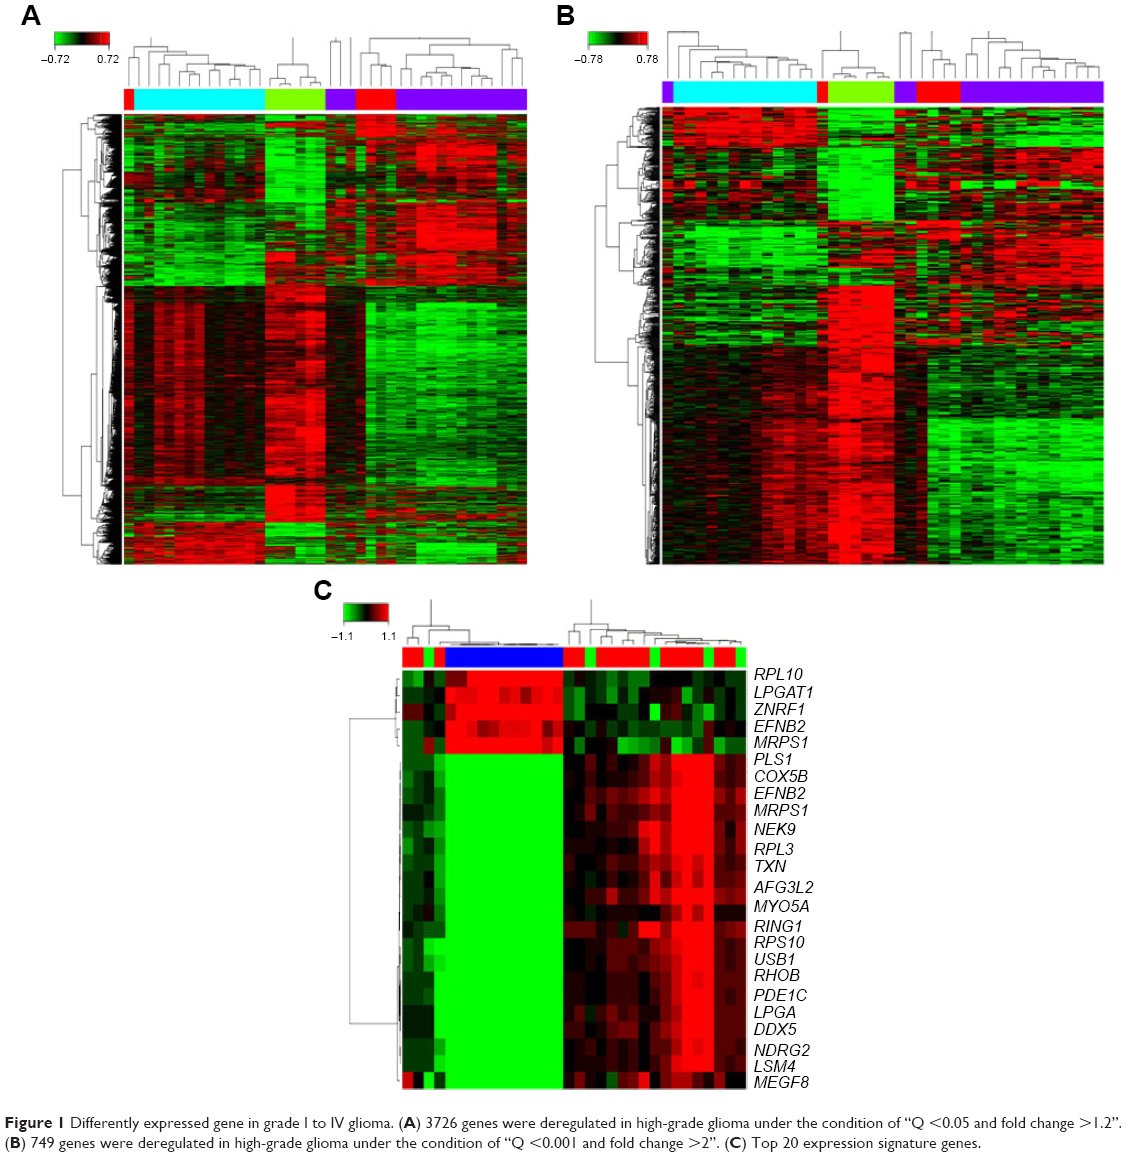 | Figure 1 Differently expressed gene in grade I to IV glioma. (A) 3726 genes were deregulated in high-grade glioma under the condition of “Q <0.05 and fold change >1.2”. (B) 749 genes were deregulated in high-grade glioma under the condition of “Q <0.001 and fold change >2”. (C) Top 20 expression signature genes. |
Cluster analysis of differently expressed genes
Based on 749 significantly differentially deregulated genes, we constructed several clusters to examine the expression pattern using Cluster 3.0 software (Stanford University, Stamford, CA, USA) (Figure 2), and each cluster profile included multiple genes which have similar temporal expression patterns. After short time-series analysis, clusters numbered 4, 17, and 80 comprised genes that were progressively repressed over time. We found that, in the gene profile, 80 shared a comparable upregulated expression in different grades of human glioma (Figure 2B).
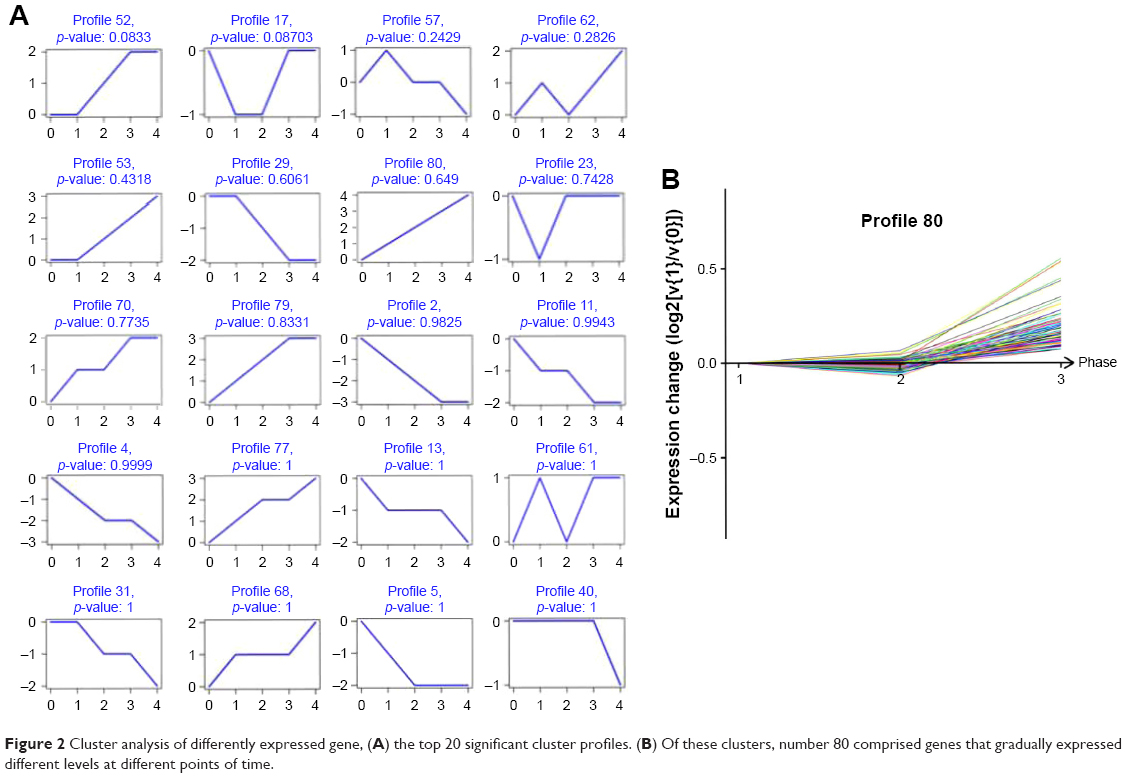 | Figure 2 Cluster analysis of differently expressed gene, (A) the top 20 significant cluster profiles. (B) Of these clusters, number 80 comprised genes that gradually expressed different levels at different points of time. |
GO and pathway analysis
To determine the biological functions of these differently expressed genes, GO and pathway enrichment analysis were conducted, respectively. As shown in Figure 3A, the top 15 highly enriched GO terms: cell division, notch signaling, cell proliferation, cell-cycle arrest, and DNA repair and several other functional groups, which combine with the KEGG database, were identified. Pathway analysis showed the MAPK signaling pathway (degree =38), Wnt signaling pathway (degree =25), ErbB signaling pathway (degree =24), and PI3K-Akt signaling pathway (degree =23) showed the highest degree (Figure 3B). Interestingly, most of these GO functional groups were connected to the metabolic pathways.
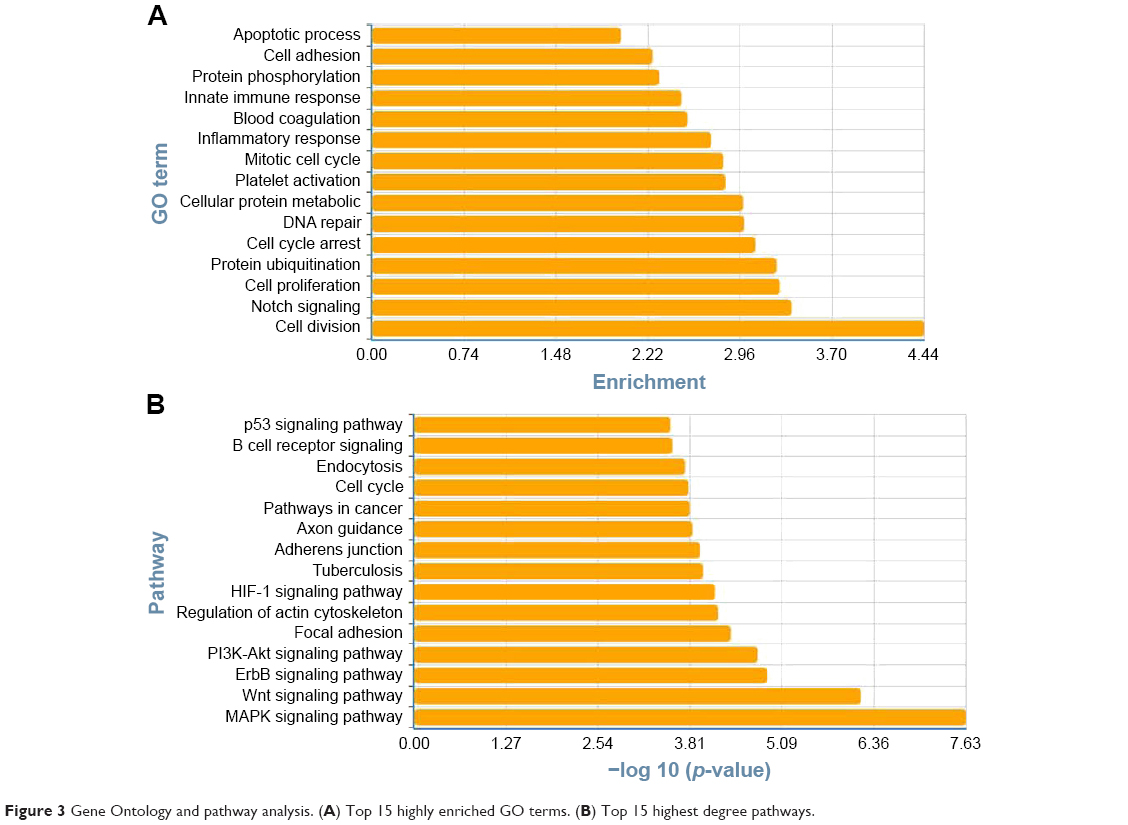 | Figure 3 Gene Ontology and pathway analysis. (A) Top 15 highly enriched GO terms. (B) Top 15 highest degree pathways. |
Coexpression network and candidate key gene
Next, we conducted a pathway relation network analysis to draw an interaction network covering 52 significantly changed pathways (Figure 4A). Among them, the MAPK signaling pathway, Wnt signaling pathway, ErbB signaling pathway, and PI3K-Akt signaling pathway showed the highest degree, suggesting that these four pathways might play a core role in the development of glioma. Furthermore, all different genes were constructed into a gene coexpression network to identify which gene may implicate a pivotal role in the development of glioma, as shown in Figure 4B. The degree of a node describes the number of links one gene has to others within the gene network, with the most central genes in the network having the largest degree values. Importantly, we found that the cytochrome c oxidase subunit Vb (COX5B), the terminal enzyme of the electron transport chain, was the central gene in the coexpression network, which directly controlled 63 neighboring genes (Figure 4C).
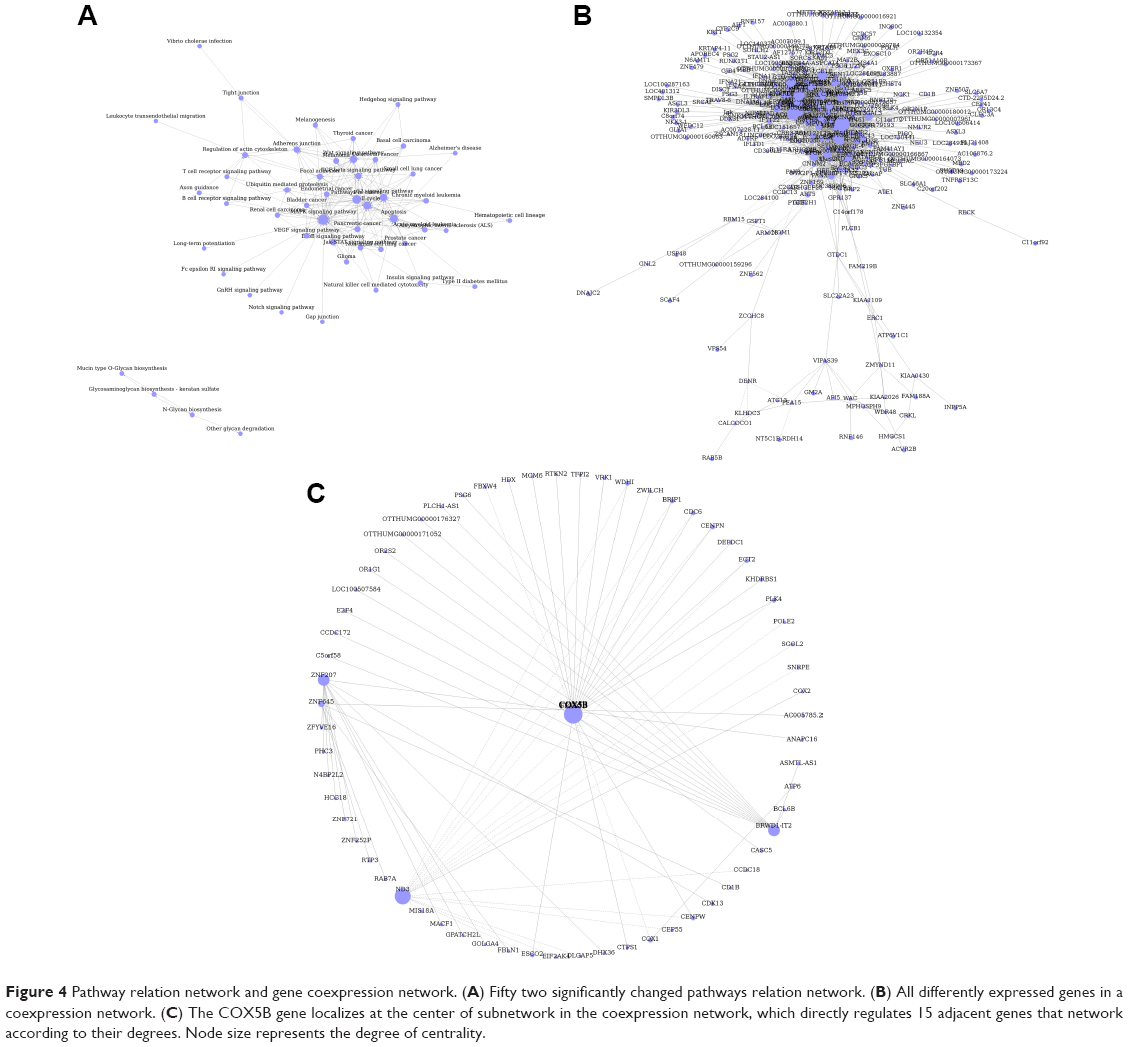 | Figure 4 Pathway relation network and gene coexpression network. (A) Fifty two significantly changed pathways relation network. (B) All differently expressed genes in a coexpression network. (C) The COX5B gene localizes at the center of subnetwork in the coexpression network, which directly regulates 15 adjacent genes that network according to their degrees. Node size represents the degree of centrality. |
COX5B is overexpressed in gliomablastoma and correlation with clinical features
To determine the impact of COX5B in human glioma progression, COX5B expression was examined in grades II to IV glioma, by immunohistochemistry. We found that COX5B expression is increased in 67 of 87 (77.0%) glioma tissues (Figure 5). Statistical analysis showed COX5B expression level was significantly associated with clinical stage, whereas there were no correlations between COX5B expression and patient age or tumor size.
 | Figure 5 COX5B expression is overexpressed in different-grade II to IV glioma tissue. Magnification 200×. |
Discussion
Malignant gliomas are aggressive, lethal, solid tumors arising from support cells in the central nervous system. Despite intense efforts to optimize the treatment of gliomas, outcomes for patients with high-grade glioma are still frustrating.20–22 Causes and progression of gliomas have been investigated extensively; however, the genetic factors involved in the development of this disease remain poorly understood. Many previous studies have demonstrated that many solid cancers are known to exhibit a high degree of heterogeneity in their deregulation of different oncogenic pathways.23–25 Previous studies reported biologically relevant alterations in three core pathways, namely, p53, Rb, and receptor tyrosine kinase (RTK)/Ras/phosphoinositide 3-kinase (PI3K) signaling, indicating that GBM is a molecularly heterogeneous disease.23,26,27
In this study, we used bioinformatics to detail the global program of gene expression in different-grade glioma tissues and to try to identify some genes associated with the tumorigenesis of gliomas. We found that 3,726 genes were deregulated in high-grade glioma under the condition of “Q <0.05 and fold change >1.2.” Then, adjusting the condition to “Q <0.001 and fold change >2,” 749 deregulated genes were determined in the grade IV glioma group including LPGAT1, PLS1, COX5B, and NEK9, etc. Based on 749 significantly differentially deregulated genes, we constructed several clusters to examine the expression pattern using Cluster 3.0 software; we found that of the genes profiled, 80 shared a comparable upregulated expression in different grades of human glioma. Using gene expression signatures, we identified three oncogenic pathways (MAPK signaling pathway, Wnt signaling pathway, and ErbB signaling pathway) deregulated in the majority of human glioma. Following gene microarray analysis, the gene expression profile in the differential grade glioma was further validated by bioinformatic analyses and coexpression network construction.
Furthermore, we found that cytochrome c oxidase subunit Vb (COX5B), the terminal enzyme of the electron transport chain, was the central gene in a coexpression network that transfers electrons from reduced cytochrome c to oxygen and, in the process, generates an electrochemical gradient across the mitochondrial inner membrane. Lomax et al28 determined that the COX5B gene contains five exons and four introns. The enzyme is composed of 13 polypeptide subunits, three of which are encoded in mitochondrial DNA and ten in nuclear DNA. The nuclear-coded COX subunits can be divided into two groups: those with muscle-specific isoforms and those that are identical in all tissues, such as COX5B. The four coding exons span a region of approximately 2.4 kb. The 5-prime end of the COX5B gene is GC-rich and contains many HpaII sites.
Conclusion
Malignant glioma is the second leading cause of cancer-related death worldwide. We devised a bioinformatics strategy to map patterns of oncogenic pathway activation in glioma from the Gene Expression Ominus (GEO). We identified three oncogenic pathways, MAPK signaling pathway, Wnt signaling pathway, and ErbB signaling pathway, that are deregulated in the majority of human gliomas.
Data sharing statement
Data sets supporting the conclusions of this article are included within the article.
The relationship between genes and clinical survival was analyzed using GSE45921 and GSE43378 test series.
Acknowledgment
We thank the Department of General Medicine of The People’s Hospital of Dazu District Chongqing for providing study data.
Disclosure
The authors report no conflicts of interest in this work.
References
Sancho-Martinez I, Nivet E, Xia Y, et al. Establishment of human iPSC-based models for the study and targeting of glioma initiating cells. Nat Commun. 2016;7:10743. | ||
Tate MC, Herbet G, Moritz-Gasser S, Tate JE, Duffau H. Probabilistic map of critical functional regions of the human cerebral cortex: Broca’s area revisited. Brain. 2014;137(Pt 10):2773–2782. | ||
Caretti V, Sewing AC, Lagerweij T, et al. Human pontine glioma cells can induce murine tumors. Acta Neuropathol. 2014;127(6):897–909. | ||
Tabu K, Sasai K, Kimura T, et al. Promoter hypomethylation regulates CD133 expression in human gliomas. Cell Res. 2008;18(10):1037–1046. | ||
Urgesi C, Aglioti SM, Skrap M, Fabbro F. The spiritual brain: selective cortical lesions modulate human self-transcendence. Neuron. 2010;65(3):309–319. | ||
Guerrero-Cázares H, Tzeng SY, Young NP, Abutaleb AO, Quiñones-Hinojosa A, Green JJ. Biodegradable polymeric nanoparticles show high efficacy and specificity at DNA delivery to human glioblastoma in vitro and in vivo. ACS Nano. 2014;8(5):5141–5153. | ||
Zerrouqi A, Pyrzynska B, Febbraio M, Brat DJ, Van Meir EG. P14ARF inhibits human glioblastoma-induced angiogenesis by upregulating the expression of TIMP3. J Clin Invest. 2012;122(4):1283–1295. | ||
Chaturvedi A, Araujo Cruz MM, Jyotsana N, et al. Mutant IDH1 promotes leukemogenesis in vivo and can be specifically targeted in human AML. Blood. 2013;122(16):2877–2887. | ||
Ji M, Lewis S, Camelo-Piragua S, et al. Detection of human brain tumor infiltration with quantitative stimulated Raman scattering microscopy. Sci Transl Med. 2015;7(309):309ra163. | ||
Zheng Y, Li X, Qian X, et al. Secreted and O-GlcNAcylated MIF binds to the human EGF receptor and inhibits its activation. Nat Cell Biol. 2015;17(10):1348–1355. | ||
Jermyn M, Mok K, Mercier J, et al. Intraoperative brain cancer detection with Raman spectroscopy in humans. Sci Transl Med. 2015;7(274):274ra19. | ||
Tan Y, Huang N, Zhang X, et al. KIAA0247 suppresses the proliferation, angiogenesis and promote apoptosis of human glioma through inactivation of the AKT and Stat3 signaling pathway. Oncotarget. 2016;7(52):87100–87113. | ||
Liang P, Shi H, Zhu W, et al. Silver nanoparticles enhance the sensitivity of temozolomide on human glioma cells. Oncotarget. 2017;8(5):7533–7539. | ||
Lasorella A, Sanson M, Iavarone A. FGFR-TACC gene fusions in human glioma. Neuro Oncol. 2017;19(4):475–483. | ||
Faião-Flores F, Alves-Fernandes DK, Pennacchi PC, et al. Targeting the hedgehog transcription factors GLI1 and GLI2 restores sensitivity to vemurafenib-resistant human melanoma cells. Oncogene. 2017;36(13):1849–1861. | ||
Ouédraogo ZG, Biau J, Kemeny JL, Morel L, Verrelle P, Chautard E. Role of STAT3 in genesis and progression of human malignant gliomas. Mol Neurobiol. Epub 2016 Sep 22. | ||
Zhao J, Liu T, Jin S, et al. Human MIEF1 recruits Drp1 to mitochondrial outer membranes and promotes mitochondrial fusion rather than fission. EMBO J. 2011;30(14):2762–2778. | ||
Gupta RA, Shah N, Wang KC, et al. Long non-coding RNA HOTAIR reprograms chromatin state to promote cancer metastasis. Nature. 2010;464(7291):1071–1076. | ||
Sun NX, Ye C, Zhao Q, et al. Long noncoding RNA-EBIC promotes tumor cell invasion by binding to EZH2 and repressing E-cadherin in cervical cancer. PLoS One. 2014;9(7):e100340. | ||
Eberlin LS, Norton I, Orringer D, et al. Ambient mass spectrometry for the intraoperative molecular diagnosis of human brain tumors. Proc Natl Acad Sci U S A. 2013;110(5):1611–1616. | ||
Berdasco M, Ropero S, Setien F, et al. Epigenetic inactivation of the Sotos overgrowth syndrome gene histone methyltransferase NSD1 in human neuroblastoma and glioma. Proc Natl Acad Sci U S A. 2009;106(51):21830–21835. | ||
Lu F, Chen Y, Zhao C, et al. Olig2-dependent reciprocal shift in PDGF and EGF receptor signaling regulates tumor phenotype and mitotic growth in malignant glioma. Cancer Cell. 2016;29(5):669–683. | ||
Robert SM, Buckingham SC, Campbell SL, et al. SLC7A11 expression is associated with seizures and predicts poor survival in patients with malignant glioma. Sci Transl Med. 2015;7(289):289ra86. | ||
Broniscer A. Malignant transformation of low-grade gliomas in children: lessons learned from rare medical events. J Clin Oncol. 2015;33(9):978–979. | ||
Wen PY, Kesari S. Malignant gliomas in adults. N Engl J Med. 2008;359(5):492–507. | ||
Bai H, Harmanci AS, Erson-Omay EZ, et al. Integrated genomic characterization of IDH1-mutant glioma malignant progression. Nat Genet. 2016;48(1):59–66. | ||
Zhou W, Ke SQ, Huang Z, et al. Periostin secreted by glioblastoma stem cells recruits M2 tumour-associated macrophages and promotes malignant growth. Nat Cell Biol. 2015;17(2):170–182. | ||
Lomax MI, Hsieh CL, Darras BT, Francke U. Structure of the human cytochrome c oxidase subunit Vb gene and chromosomal mapping of the coding gene and of seven pseudogenes. Genomics. 1991;10(1):1–9. |
 © 2017 The Author(s). This work is published and licensed by Dove Medical Press Limited. The full terms of this license are available at https://www.dovepress.com/terms.php and incorporate the Creative Commons Attribution - Non Commercial (unported, v3.0) License.
By accessing the work you hereby accept the Terms. Non-commercial uses of the work are permitted without any further permission from Dove Medical Press Limited, provided the work is properly attributed. For permission for commercial use of this work, please see paragraphs 4.2 and 5 of our Terms.
© 2017 The Author(s). This work is published and licensed by Dove Medical Press Limited. The full terms of this license are available at https://www.dovepress.com/terms.php and incorporate the Creative Commons Attribution - Non Commercial (unported, v3.0) License.
By accessing the work you hereby accept the Terms. Non-commercial uses of the work are permitted without any further permission from Dove Medical Press Limited, provided the work is properly attributed. For permission for commercial use of this work, please see paragraphs 4.2 and 5 of our Terms.