")
Back to Journals » International Journal of General Medicine » Volume 14
Identification of CIRBP and TRPV4 as Immune-Related Diagnostic Biomarkers in Osteoarthritis
Authors Tang C, Liu Q, Zhang Y, Liu G, Shen G
Received 9 October 2021
Accepted for publication 16 December 2021
Published 22 December 2021 Volume 2021:14 Pages 10235—10245
DOI https://doi.org/10.2147/IJGM.S342286
Checked for plagiarism Yes
Review by Single anonymous peer review
Peer reviewer comments 3
Editor who approved publication: Dr Scott Fraser
Chengyang Tang,1,* Qiang Liu,2,* Yaxuan Zhang,1 Guihu Liu,1 Guangsi Shen1
1Department of Orthopaedics, The Second Affiliated Hospital of Soochow University, Suzhou, People’s Republic of China; 2Institution of Sports Medicine, Peking University Third Hospital, Beijing Key Laboratory of Sports Injuries, Beijing, People’s Republic of China
*These authors contributed equally to this work
Correspondence: Guangsi Shen
Department of Orthopaedics, The Second Affiliated Hospital of Soochow University, 1055 Sanxiang Road, Suzhou, 215004, People’s Republic of China
Tel +86-18962113353
Email [email protected]
Purpose: Osteoarthritis (OA) is the most common chronic joint disorder in elderly individuals. This study aimed to identify immune-related diagnostic gene signatures for OA.
Methods: First, we performed single-sample gene set enrichment analysis (ssGSEA) to evaluate the infiltration of immune cells in OA expression data from the Gene Expression Omnibus (GEO) database. Then, weighted gene coexpression network analysis (WGCNA) was performed to identify hub modules and genes related to immune cell types with significant infiltration. Finally, we screened diagnostic markers from the differentially expressed genes (DEGs) in both the OA group and the hub module using least absolute shrinkage and selection operator (LASSO) logistic regression.
Results: Immune filtration analysis showed that immature B cells, mast cells, natural killer T cells, myeloid-derived suppressor cells (MDSCs), and type 2 T helper cells were dysregulated in OA samples. In WGCNA, a total of 120 genes were selected as hub genes associated with mast cell infiltration.The enrichment analysis showed that spliceosome, positive regulation of cell migration, and response to mechanical stimulus were mainly involved. The LASSO regression model for the GSE117999 dataset revealed 15 DEGs for predicting OA. Finally, two genes were obtained by intersection for further investigation.
Conclusion: Cold-inducible RNA-binding protein (CIRBP) and transient receptor potential vanilloid 4 (TRPV4) were identified as diagnostic biomarkers for OA, and both were positively correlated with mast cell infiltration.
Keywords: osteoarthritis, bioinformatics analysis, immune infiltration, WGCNA
Introduction
Osteoarthritis (OA) is a common degenerative arthritic disease that is increasingly prevalent in elderly individuals and leads to pain, joint destruction, and disability.1 OA imposes a tremendous economic burden on individuals and society, mainly due to the clinical inability of early disease diagnosis.2 Traditionally, the diagnosis of OA is based on clinical symptoms and radiography findings. However, both methods lack insensitivity and have limited value in diagnosis in the early stages of OA. Although joint replacement surgery can be effectively applied at the advanced stage of OA, there are relatively few interventions for addressing earlier stages of OA.3 Therefore, the investigation of diagnostic biomarkers is an important focus to identify patients with early-stage OA.
The critical role of immune cell infiltration in the pathophysiology of OA has been intensively investigated.4 Macrophages are the most common cells in OA synovial tissues, and the quantity of activated macrophages is directly corrected with OA severity.5 Macrophages promote the release of proinflammatory cytokines, growth factors, and matrix metalloproteinases and subsequently induce cartilage breakdown and joint deterioration.6 Additionally, many studies have described the pathological role of T cells in OA. In OA synovial tissues, CD4+ T cell infiltration is frequent, and increased CD4+/CD8+ ratios are observed.7 To gain more insight, Li et al investigated the role of each T cell subtype, including Th1 cells, Th2 cells, Th9 cells, Th17 cells, Th22 cells, regulatory T cells, follicular helper T cells, cytotoxic T cells, and T memory cells, in the pathogenesis of OA.8 These results strongly suggest that immune cells have great potential for the diagnosis and treatment of OA patients.
Extending upon findings from our previous studies,9–11 where we demonstrated the promoting roles of OA-related noncoding RNAs in cartilage degradation, the current study aimed to identify potential diagnostic biomarker candidates for OA and provide insights into the critical importance of immune infiltration in OA. To begin with, we conducted single-sample gene set enrichment analysis (ssGSEA) to calculate the immune cell proportions in samples. Then, we performed weighted gene coexpression network analysis (WGCNA) to identify modules and genes correlated with the infiltration levels of 28 immune cell types. Moreover, we used least absolute shrinkage and selection operator (LASSO) regression analysis to identify diagnostic biomarkers in differentially expressed genes (DEGs). Finally, we screened the genes in both LASSO and immune cell infiltration modules for further analysis. To date, we are the first to combine ssGSEA, WGCNA, and LASSO regression analysis to identify immune-related biomarkers in OA. Our research not only provides promising targets for OA but also extends the knowledge of the underlying mechanisms.
Materials and Methods
Data Preprocessing and DEGs Screening
We downloaded the OA expression profile datasets GSE117999 and GSE12021 from the Gene Expression Omnibus (GEO) (https://www.ncbi.nlm.nih.gov/geo/) database. The dataset GSE117999 contains gene transcripts expressed in cartilage tissues obtained from 12 patients with OA and from 12 patients without OA (arthroscopic partial meniscectomy). The data were normalized using the limma package.12 Probes were annotated to the genes. Due to the multiple matches between genes and probes, the mean value was calculated as the expression level of genes. Then, we performed differential expression analysis to screen DEGs between OA patients and normal controls. The cutoff criteria were set at P<0.05 and |logFC|>0.5.
Evaluation of Immune Cell Infiltration
ssGSEA,13 a modification of standard gene set enrichment analysis, was performed to identify immune cell types that excessively infiltrated OA tissues using the GSVA package.14 We obtained published cell type-specific markers compiled from 28 immune cell types.15 Principal component analysis (PCA) was performed to analyze the immune cell infiltration matrix data and find differences between groups. Then, we used the ggplot2 package16 to draw violin plots to visualize the relative proportions of immune cell subpopulations from the expression profiles.
Weighted Coexpression Network Construction and Module Detection
The R package WGCNA17 was used to construct a weighted coexpression network based on the expression values of 4561 genes. First, the proper soft-thresholding power β was chosen based on the criterion of approximate scale-free topology. The function pickSoftThreshold was used to analyze network topology and calculate the soft-thresholding power β. The network was constructed with the automatic network construction function. Second, according to the dissimilarity coefficient between genes, a hierarchical clustering tree was built for module detection. Gene significance (GS) and module membership (MM) were defined to quantify the correlation between modules and clinical characteristics. Ranked by the absolute value of module significance (MS), modules that showed a strong association with the specific cell subtypes were selected as hub modules.
Functional Enrichment Analysis
Genes in the identified hub modules were extracted for pathway and process enrichment analyses using the web tool Metascape (http://metascape.org).18 The top 20 enriched terms with a P<0.01, a minimum count of 3, and an enrichment factor > 1.5 are presented in a bar graph.
Identification of Diagnostic Markers
We performed LASSO logistic regression19 to select diagnostic markers for OA using the glmnet package.20 The overlapping genes in the LASSO logistic regression and hub modules were investigated as hub genes for further analysis.
Correlation Analysis Between Diagnostic Markers and Immune Cells
Spearman correlation analysis between the infiltration levels of immune cells and the expression of diagnostic markers was performed, and the results were visualized using the R package ggplot2.
Results
GEO Dataset and DEGs
We obtained the gene expression profile data for 24 samples from the GEO database, and four of them (GSM3317970, GSM3317972, GSM3317976, and GSM3317980) were eliminated due to having too many missing values. In total, the current study included 10 patients with meniscectomy (5 females, 5 males; mean age, 49.7 years; age range, 37–65 years) and 10 OA patients (7 females, 3 males; mean age, 66 years; age range, 57–80 years). No patients were excluded for additional diseases. After data preprocessing, we extracted a total of 100 DEGs from the gene expression matrix. The distribution of DEGs between OA patients and normal controls was visualized by the volcano plot (Figure 1A). In addition, the heat map shows the differences in gene expression between groups (Figure 1B). DEGs were used for the construction of the LASSO regression model.
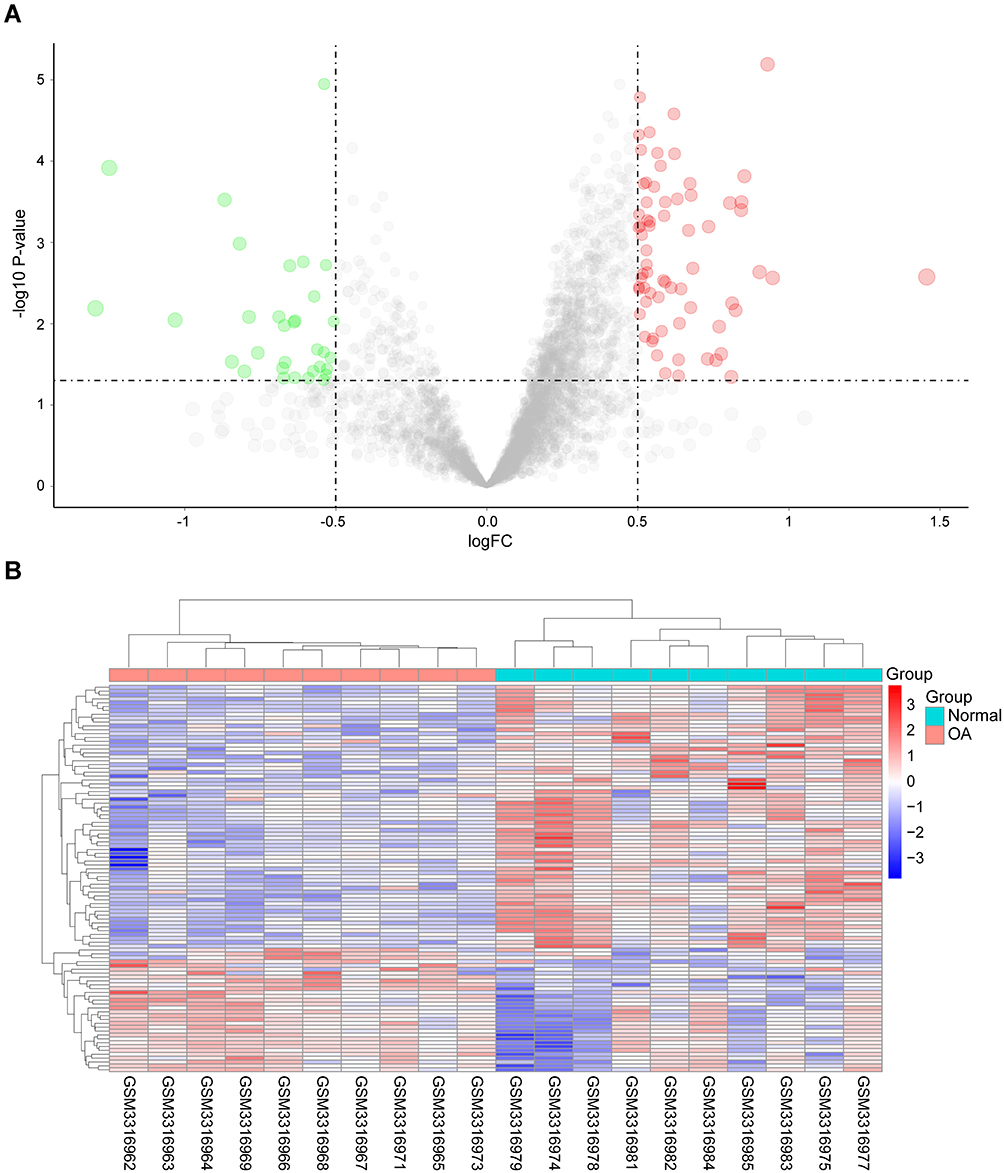 |
Figure 1 Identification of hub genes of OA. (A) Volcano plot and (B) heat map present the identified DEGs between OA patients and normal controls. Blue represents low expression values, and red represents high expression values. |
Proportion of OA-Infiltrating Immune Cells
To identify the cell types potentially involved in the pathology of OA, we performed ssGSEA, which calculates the rank value of each gene according to the expression profile. In this way, we obtained the proportions of 28 immune cell types in each sample. The results of PCA cluster analysis revealed a significant difference in immune cell infiltration between OA patients and normal controls (Figure 2A). Compared with those in non-OA tissues, the proportions of immature B cells and natural killer T cells were relatively low, while the proportions of mast cells, myeloid-derived suppressor cells (MDSCs), and type 2 T helper cells were high in OA tissues (Figure 2B). Subsequently, the fractions of five immune cell types in each sample were selected as external traits for WGCNA.
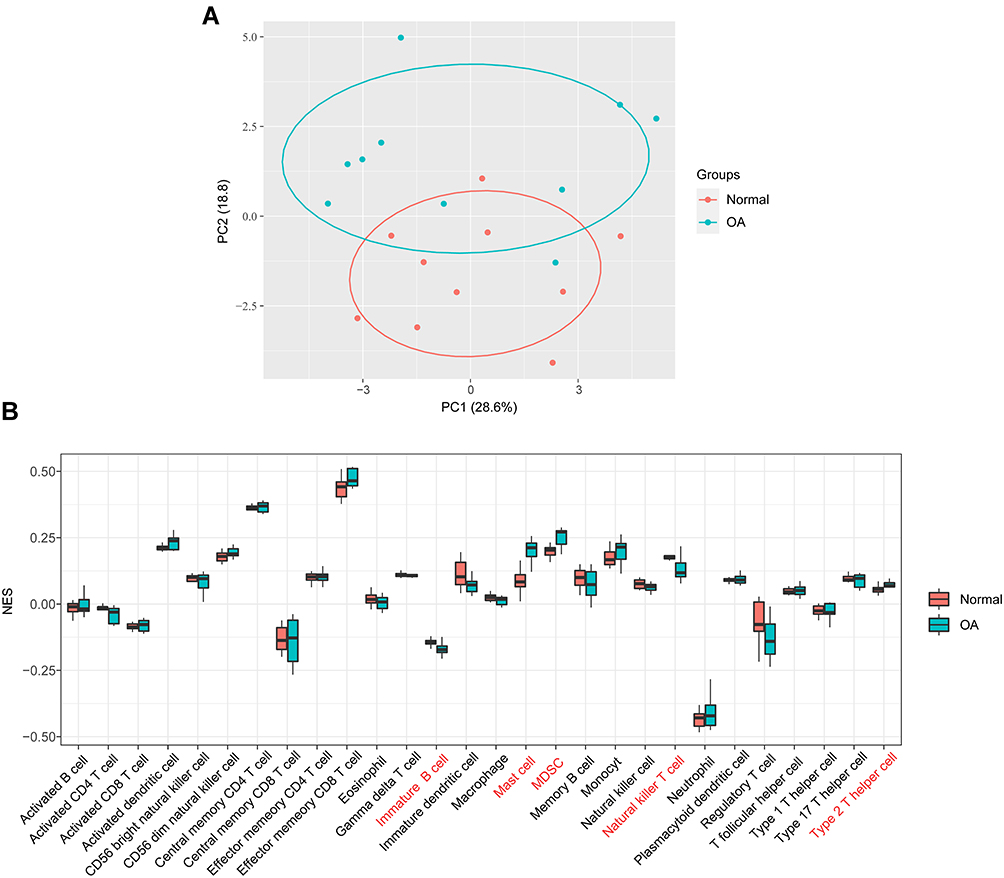 |
Figure 2 Visualization of immune cell infiltration analysis. (A) The principal component analysis shows the difference in immune cell infiltration between OA patients and normal controls. (B) The proportion of 28 types of immune cells between groups. |
Gene Coexpression Network of OA
The expression values of the 4561 genes were used to construct a weighted gene coexpression network. First, we calculated the average linkage and Pearson’s correlation values to cluster the samples from the GSE117999 dataset (Figure 3A). In addition, we chose a height cut of 40 and removed two offending samples (Supplementary Figure S1). To build a scale-free network, we selected the soft-thresholding power β as 7. Next, we performed one-step network construction and module detection. A hierarchical clustering tree was used for module identification (Figure 3B), and 21 modules were generated. Last and most importantly, the module eigengenes, the first principal component of a module, was corrected with the external traits. Moreover, to quantify the associations of individual genes with traits, GS and MM were calculated.
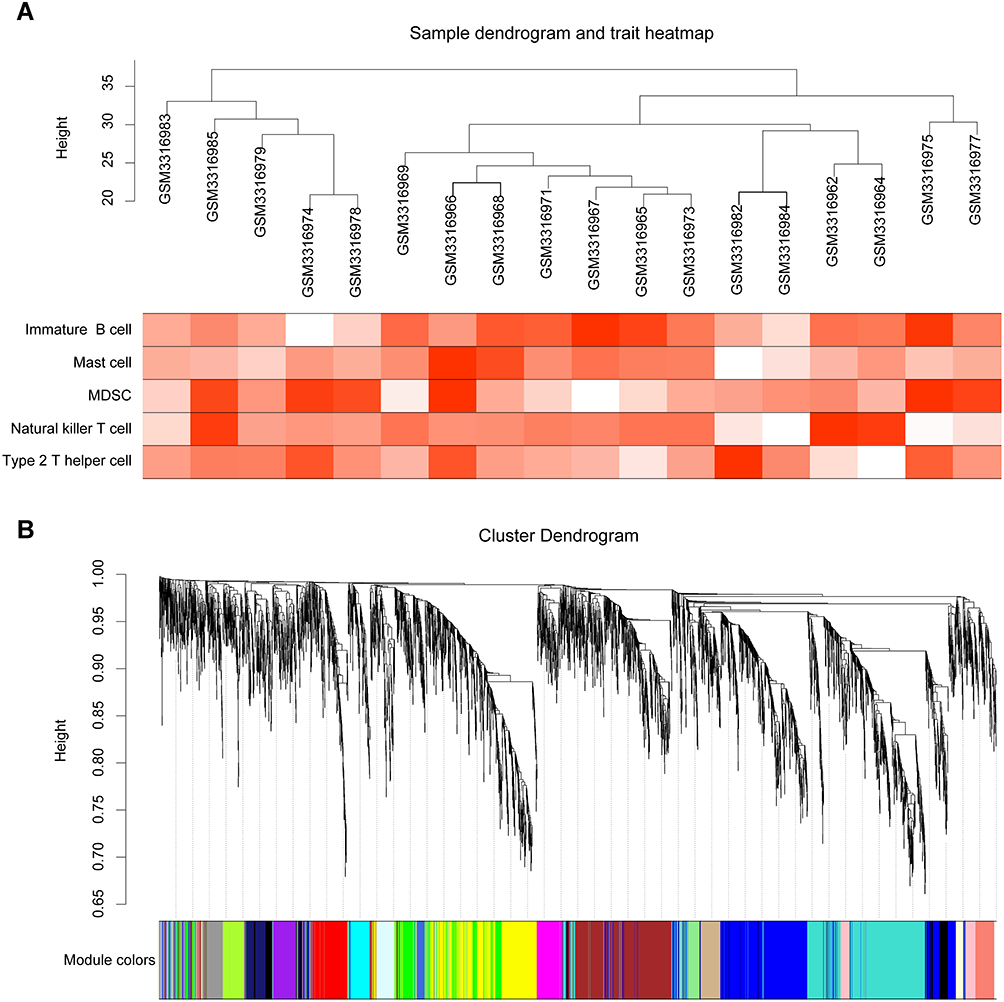 |
Figure 3 Sample clustering and module detection. (A) Clustering dendrogram. The heat map presents the degree of infiltration of immune cells in each sample. (B) Clustering dendrogram of genes, with dissimilarity based on topological overlap, together with assigned module colors. |
Identification of Hub Modules and Enrichment Analysis
As shown in Figure 4A, the green module showed a high correlation with mast cells (R2=0.66, P=1e-03); the brown module was correlated with MDSCs (R2=0.57, P=1e-02) and type 2 T helper cells (R2=0.74, P=4e-04); the tan module was correlated with MDSCs (R2=0.66, P=3e-03) and the light cyan module was related to type 2 T helper cells (R2=0.51, P=3e-02). The correlation coefficient between other modules and immune cells was less than 0.5. The green module that showed a significant correlation with mast cells captured our attention. To further explore the biological functions of genes in the green module, enrichment analyses were performed, and the top 20 enriched terms are presented in a bar graph (Figure 4B).
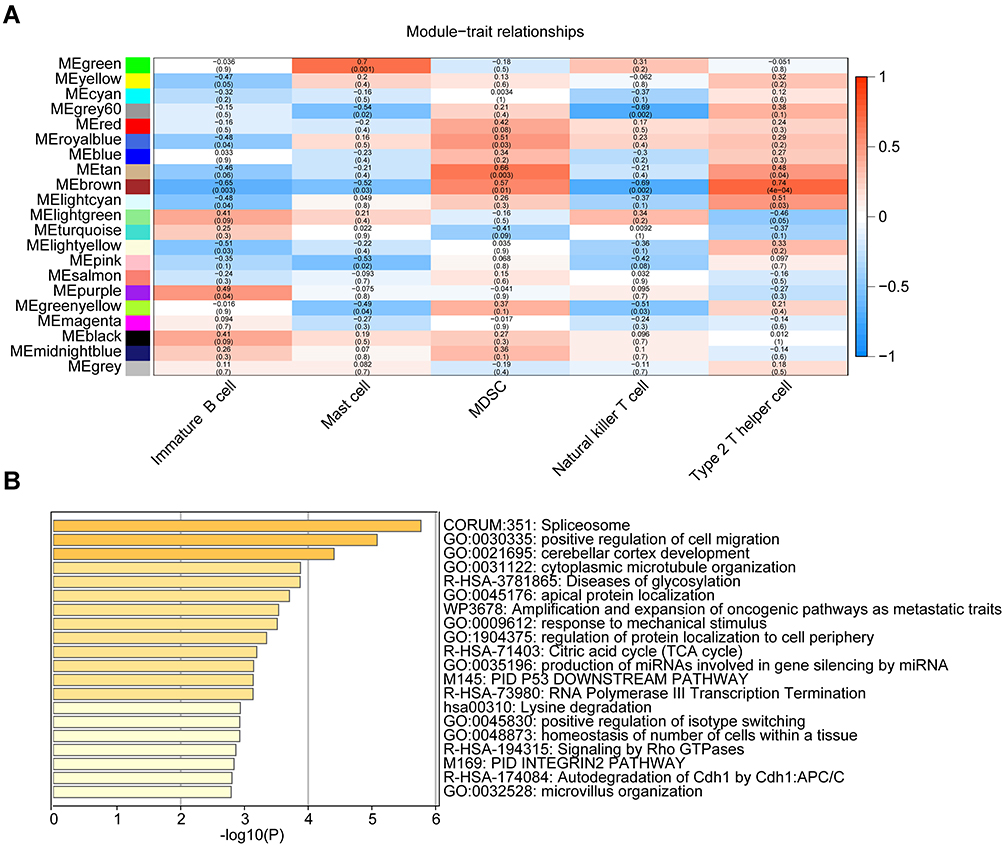 |
Figure 4 Module-trait associations and enrichment analysis. (A) Heatmap of the correlations between module eigengenes and infiltrating immune cell types. The table is color-coded by correlation according to the color legend. (B) The bar chart presents the top 20 enriched terms. |
Screening the Immune-Related Diagnostic Gene Signature
On the one hand, the central genes in interesting modules had the highest association with traits. According to the cutoff criteria (MM > 0.5 and GS> 0.5), 120 genes were selected as hub genes associated with mast cell infiltration (Figure 5A). On the other hand, the LASSO regression model for the GSE117999 dataset revealed 15 DEGs for predicting OA (Figure 5B and Supplementary Figure S2). Finally, we screened two overlapping genes from the predictive markers and hub genes: cold-inducible RNA-binding protein (CIRBP) and transient receptor potential vanilloid 4 (TRPV4) (Figure 5C). Additionally, receiver operating characteristic (ROC) curve analysis of each gene was applied. The GSE12021 dataset was set as the validation set. The results suggested that CIRBP and TRPV4 might have outstanding diagnostic value in OA (Figure 5D and E).
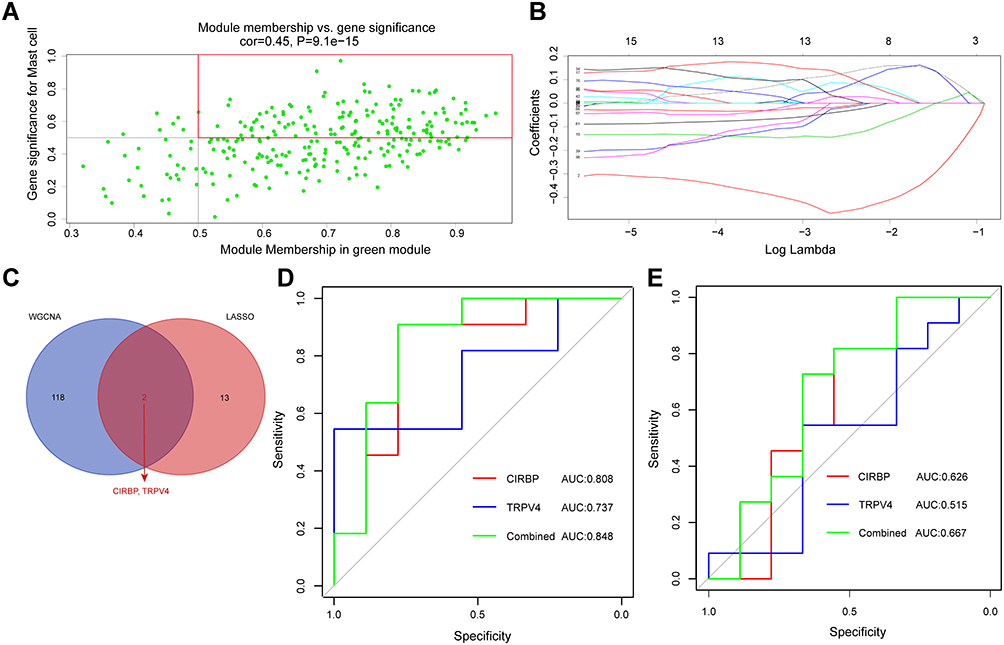 |
Figure 5 Screening the immune-related gene diagnostic signature. (A) A scatterplot of module eigengenes in the green module. (B) The least absolute shrinkage and selection operator logistic regression algorithm revealed 15 genes associated with diagnosis. (C) Venn diagram of the overlapping genes between the two algorithms. (D) ROC curve analysis of the diagnostic efficacy of identified genes in GSE11799. (E) ROC curve analysis of the diagnostic efficacy of identified genes in GSE12021. Abbreviation: AUC, area under the receiver operating characteristic curve. |
Correlation of CIRBP and TRPV4 with Immune Cell Infiltration
We performed Spearman correlation analysis of the expression of CIRBP and TRPV4 in immune cells. As shown in Figure 6, CIRBP was positively correlated with mast cells (r=0.81, P<0.01) and TRPV4 was positively correlated with mast cells (r=0.55, P=0.01).
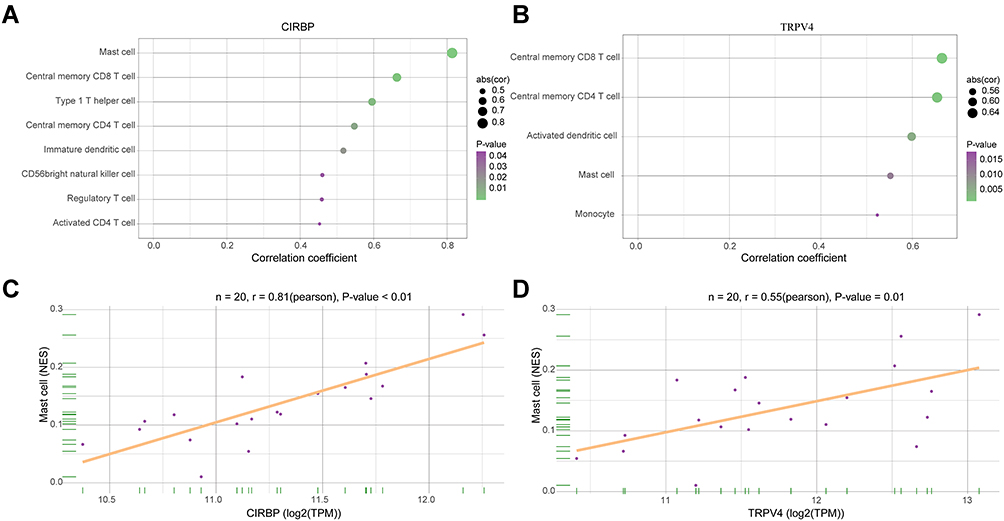 |
Figure 6 The relationship between gene expression and immune infiltration. (A and B) Correlation analysis between CIRBP, TRPV4 and infiltrating immune cells. (C and D) The expression levels of CIRBP and TRPV4 were positively correlated with mast cell infiltration in osteoarthritis patients. |
Discussion
OA is a degenerative joint disorder that leads to pain and disability.21 Conventional imaging techniques have poor detection ability for the early stages of disease, and OA patients often lose the best chance for treatment. Thus, disease prevention and early diagnosis should be the critical focus of OA research. Recent advances in molecular markers present a wide range of possibilities for the early diagnosis and treatment of OA. The LASSO regression model is a popular method for dimension reduction, parameter estimation, and variable selection.19 WGCNA is an effective method that calculates correlations between the expression levels of genes and external disease traits.17 Both algorithms can be used to detect biomarkers of disease, and their combination provides accurate and convincing results. To gain more insight into the role of immune cell infiltration in OA, we performed ssGSEA to estimate the relative proportions of OA-infiltrating immune cells, and increased infiltration of mast cells was observed. The enrichment analysis revealed that hub genes extracted from the green module majorly participated in spliceosome, positive regulation of cell migration, response to mechanical stimulus, and so on. Studies have reported that the pathology of OA is related to the migration of multiple cell types, including chondrocytes, synoviocytes, mesenchymal stem cells, and endothelial cells.22,23 Our results indicated that CIRBP and TRPV4 whose expression levels are strongly associated with mast cell infiltration, can be used as diagnostic markers of OA.
CIRBP belongs to the glycine-rich RNA-binding protein family. It acts as a vital mediator in complex biological processes, including the circadian rhythm, tumorigenesis, the immune response, and inflammation.24 A number of studies have demonstrated that CIRBP plays a critical role in the immune response. Activated by the Toll-like receptor 4 (TLR4)-myeloid differentiation factor 2 (MD2) complex, CIRBP could promote the release of tumor necrosis factor-alpha (TNF-α) and interleukin-6 (IL-6) in shock and sepsis.25 Bolognese et al reported that CIRBP acts as a proinflammatory mediator that predisposes CD4(+) T cells to a Th1 hyperinflammatory response profile and drives CD8(+) T cells to a cytotoxic profile.26 Moreover, studies have proved that CIRBP induces various inflammatory reactions.27,28 It is well established that inflammation has a direct connection with the pathogenesis of OA.29,30 Yoo et al observed an increase in the concentrations of CIRBP in rheumatoid arthritis tissues and positive correlations between CIRBP and disease activity.31 A recent study demonstrated that, in OA patients, the expression of CIRBP in the synovial fluid was markedly higher than that in the serum; additionally, inflammatory molecules such as TNF-α and IL-6 were highly correlated with CIRBP.32 Thus, CIRBP plays a critical role in the immune response and inflammatory reactions, suggesting that CIRBP might be a potential marker for the detection and diagnosis of OA.
TRPV4 encodes a member of the TRPV subfamily of TRP ion channels and is a Ca2+-permeable, nonselective cation channel involved in sensing mechanical or osmotic pressure. Much work thus far has focused on the critical role of TRPV4 in maintaining the health and function of joint tissues, particularly cartilage.33,34 By activating TRPV4, mechanical stimuli increase intracellular Ca2+ concentrations and mediate metabolic processes.35 A previous study confirmed that by mediating Ca2+ signaling, TRPV4 was a vital factor in transducing mechanical signals and supporting cartilage extracellular matrix maintenance and joint health.36 Similarly, Xu et al demonstrated that the upregulation of TRPV4 in OA articular cartilage resulted from excessive mechanical stress and induced chondrocyte apoptosis via Ca2+ influx.37 Hence, the identification of downstream targets of chondrocyte TRPV4-mediated Ca2+ signaling in the cartilage may provide potential targets for OA therapeutics.38 Furthermore, many inflammatory cytokines, such as interleukin-1 and TNF-α, are regulated by TRPV4 activity, and their downstream effectors participate in the pathogenesis of OA.39–41 In conclusion, TRPV4 plays a crucial role in many biological processes, including transducing mechanical signatures, inducing hyperalgesia,42 and mediating inflammatory cytokines in musculoskeletal tissues. We believe that TRPV4 is an attractive biomarker for novel targets or treatments of OA.
The correlation analysis between CIRBP, TRPV4 and immune cells revealed that the expression of both genes was positively correlated with mast cells. Mast cells mainly reside in the synovium and synovial fluids and have a crucial influence on various processes, including cytokine recruitment and activation, inflammation, and cartilage destruction.43 Studies have investigated the increasing importance of mast cells and their mediators in the pathogenesis of OA.7,44 A recent study reported a positive correlation between synovial mast cell numbers and structural damage in OA patients.45 Wang et al demonstrated that IgE-dependent mast cell activation might result in mast cell degranulation and the release of proinflammatory mediators, leading to cartilage destruction and the occurrence of OA.46 These observations suggest a central role for mast cells in the pathophysiology of OA. Based on our findings, it can be speculated that the overexpression of CIRBP and TRPV4 promotes mast cell infiltration and subsequently leads to the occurrence and development of OA.
It should be pointed out that this work is an early exploratory study due to the following limitations. First, the numbers of samples and genetic data were insufficient. Second, the accuracy of the immune-related diagnostic gene signature needs to be assessed in additional datasets. Last, our research was based on public datasets and requires experimental validation.
Conclusion
In conclusion, the current study innovatively combined LASSO logistic regression, ssGSEA, and WGCNA algorithms to screen diagnostic biomarkers associated with specific immune cells for OA. We found that CIRBP and TRPV4 were overexpressed in osteoarthritic tissues, and they were positively correlated with mast cell infiltration. These findings reveal a new strategy for the early diagnosis and immunomodulatory therapies of OA. Future work will focus on determining pathogenic targets and investigating immunopathology in OA.
Abbreviations
OA, osteoarthritis; ssGSEA, single-sample gene set enrichment analysis; GEO, Gene Expression Omnibus; WGCNA, weighted gene coexpression network analysis; DEGs, differentially expressed genes; LASSO, least absolute shrinkage and selection operator; MDSCs, myeloid-derived suppressor cells; CIRBP, cold-inducible RNA-binding protein; TRPV4, transient receptor potential vanilloid 4; PCA, principal component analysis; GS, gene significance; MM, module membership; MS, module significance; ROC, receiver operating characteristic; AUC, area under the receiver operating characteristic curve; TLR4, Toll-like receptor 4; MD2, differentiation factor 2; TNF-α, tumor necrosis factor-alpha; IL-6, interleukin-6.
Data Sharing Statement
The data in this study can be obtained from the corresponding author upon reasonable request.
Ethical Approval
This study has been granted an exemption by Medical Ethics Committee of The Second Affiliated Hospital of Soochow University. The public database mentioned in this study is publicly available for re-analyzing, and no ethical approval was required by the local ethics committees, so that this study does not require ethics approval.
Acknowledgments
We would like to acknowledge the reviewers for their invaluable comments on this study.
Funding
This work was funded by the Training project of “national tutor system” for young health talents in Suzhou (grant number 20042), Gusu Health Talents (grant number GSWS2020033), and the National Natural Science Foundation of China (grant number 81802161).
Disclosure
The authors declare that they have no competing interests.
References
1. Hunter DJ, Bierma-Zeinstra S. Osteoarthritis. Lancet. 2019;393(10182):1745–1759. doi:10.1016/s0140-6736(19)30417-9
2. Puig-Junoy J, Ruiz A. Socio-economic costs of osteoarthritis: a systematic review of cost-of-illness studies. Semin Arthritis Rheum. 2015;44(5):531–541. doi:10.1016/j.semarthrit.2014.10.012
3. Karsdal MA, Michaelis M, Ladel C, et al. Disease-modifying treatments for osteoarthritis (DMOADs) of the knee and hip: lessons learned from failures and opportunities for the future. Osteoarthritis Cartilage. 2016;24(12):2013–2021. doi:10.1016/j.joca.2016.07.017
4. Lopes EBP, Filiberti A, Husain SA, Humphrey MB. Immune contributions to osteoarthritis. Curr Osteoporos Rep. 2017;15(6):593–600. doi:10.1007/s11914-017-0411-y
5. Haseeb A, Haqqi TM. Immunopathogenesis of osteoarthritis. Clin Immunol. 2013;146(3):185–196. doi:10.1016/j.clim.2012.12.011
6. Zhang H, Cai D, Bai X. Macrophages regulate the progression of osteoarthritis. Osteoarthritis Cartilage. 2020;28(5):555–561. doi:10.1016/j.joca.2020.01.007
7. de Lange-brokaar BJE, Ioan-Facsinay A, van Osch G, et al. Synovial inflammation, immune cells and their cytokines in osteoarthritis: a review. Osteoarthritis Cartilage. 2012;20(12):1484–1499. doi:10.1016/j.joca.2012.08.027
8. Li YS, Luo W, Zhu SA, Lei GHT. Cells in osteoarthritis: alterations and beyond. Front Immunol. 2017;8. doi:10.3389/fimmu.2017.00356
9. Liu Q, Zhang X, Dai LH, et al. Long noncoding RNA related to cartilage injury promotes chondrocyte extracellular matrix degradation in osteoarthritis. Arthritis Rheumatol. 2014;66(4):969–978. doi:10.1002/art.38309
10. Liu Q, Zhang X, Hu XQ, et al. Circular RNA related to the chondrocyte ECM regulates MMP13 expression by functioning as a MiR-136ʹ sponge’ in human cartilage degradation. Sci Rep. 2016;6. doi:10.1038/srep22572
11. Liu Q, Zhang X, Hu XQ, et al. Emerging roles of circRNA related to the mechanical stress in human cartilage degradation of osteoarthritis. Mol Ther-Nucl Acids. 2017;7:223–230. doi:10.1016/j.omtn.2017.04.004
12. Ritchie ME, Phipson B, Wu D, et al. limma powers differential expression analyses for RNA-sequencing and microarray studies. Nucleic Acids Res. 2015;43(7):e47. doi:10.1093/nar/gkv007
13. Barbie DA, Tamayo P, Boehm JS, et al. Systematic RNA interference reveals that oncogenic KRAS-driven cancers require TBK1. Nature. 2009;462(7269):108–112. doi:10.1038/nature08460
14. Hänzelmann S, Castelo R, Guinney J. GSVA: gene set variation analysis for microarray and RNA-seq data. BMC Bioinform. 2013;14:7. doi:10.1186/1471-2105-14-7
15. Charoentong P, Finotello F, Angelova M, et al. Pan-cancer immunogenomic analyses reveal genotype-immunophenotype relationships and predictors of response to checkpoint blockade. Cell Rep. 2017;18(1):248–262. doi:10.1016/j.celrep.2016.12.019
16. Ginestet C. ggplot2: elegant graphics for data analysis. J R Stat Soc Ser. 2011;174(1):245–246. doi:10.1111/j.1467-985X.2010.00676_9.x
17. Langfelder P, Horvath S. WGCNA: an R package for weighted correlation network analysis. BMC Bioinform. 2008;9:559. doi:10.1186/1471-2105-9-559
18. Zhou Y, Zhou B, Pache L, et al. Metascape provides a biologist-oriented resource for the analysis of systems-level datasets. Nat Commun. 2019;10(1):1523. doi:10.1038/s41467-019-09234-6
19. Tibshirani R. Regression shrinkage and selection via the Lasso. J R Stat Soc. 1996;58(1):267–288. doi:10.1111/j.2517-6161.1996.tb02080.x
20. Friedman J, Hastie T, Tibshirani R. Regularization paths for generalized linear models via coordinate descent. J Stat Softw. 2010;33(1):1–22. doi:10.18637/jss.v033.i01
21. Glyn-Jones S, Palmer AJR, Agricola R, et al. Osteoarthritis. Lancet. 2015;386(9991):376–387. doi:10.1016/s0140-6736(14)60802-3
22. Wang YY, Xu JJ, Zhang XD, et al. TNF-alpha-induced LRG1 promotes angiogenesis and mesenchymal stem cell migration in the subchondral bone during osteoarthritis. Cell Death Dis. 2017;8. doi:10.1038/cddis.2017.129
23. Xiao P, Zhu X, Sun JP, et al. Cartilage tissue miR-214-3p regulates the TrkB/ShcB pathway paracrine VEGF to promote endothelial cell migration and angiogenesis. Bone. 2021;151:116034. doi:10.1016/j.bone.2021.116034
24. Zhu XZ, Buhrer C, Wellmann S. Cold-inducible proteins CIRP and RBM3, a unique couple with activities far beyond the cold. Cell Mol Life Sci. 2016;73(20):3839–3859. doi:10.1007/s00018-016-2253-7
25. Qiang XL, Yang WL, Wu RQ, et al. Cold-inducible RNA-binding protein (CIRP) triggers inflammatory responses in hemorrhagic shock and sepsis. Nat Med. 2013;19(11):
26. Bolognese AC, Sharma A, Yang WL, Nicastro J, Coppa GF, Wang P. Cold-inducible RNA-binding protein activates splenic T cells during sepsis in a TLR4-dependent manner. Cell Mol Immunol. 2018;15(1):38–47. doi:10.1038/cmi.2016.43
27. Zhong P, Peng JY, Yuan MJ, Kong B, Huang H. Cold-inducible RNA-binding protein (CIRP) in inflammatory diseases: molecular insights of its associated signalling pathways. Scand J Immunol. 2021;93(1). doi:10.1111/sji.12949
28. Lujan DA, Ochoa JL, Hartley RS. Cold-inducible RNA binding protein in cancer and inflammation. Wiley Interdiscip Rev-RNA. 2018;9(2). doi:10.1002/wrna.1462
29. Rahmati M, Mobasheri A, Mozafari M. Inflammatory mediators in osteoarthritis: a critical review of the state-of-The-art, current prospects, and future challenges. Bone. 2016;85:81–90. doi:10.1016/j.bone.2016.01.019
30. Robinson WH, Lepus CM, Wang Q, et al. Low-grade inflammation as a key mediator of the pathogenesis of osteoarthritis. Nat Rev Rheumatol. 2016;12(10):580–592. doi:10.1038/nrrheum.2016.136
31. Yoo IS, Lee SY, Park CK, et al. Serum and synovial fluid concentrations of cold-inducible RNA-binding protein in patients with rheumatoid arthritis. Int J Rheum Dis. 2018;21(1):148–154. doi:10.1111/1756-185x.12892
32. Yu L, Li QH, Deng F, Yu ZW, Luo XZ, Sun JL. Synovial fluid concentrations of cold-inducible RNA-binding protein are associated with severity in knee osteoarthritis. Clin Chim Acta. 2017;464:44–49. doi:10.1016/j.cca.2016.11.016
33. Clark AL, Votta BJ, Kumar S, Liedtke W, Guilak F. Chondroprotective role of the osmotically sensitive ion channel transient receptor potential vanilloid 4 age- and sex-dependent progression of osteoarthritis in Trpv4-deficient mice. Arthritis Rheum. 2010;62(10):2973–2983. doi:10.1002/art.27624
34. Fu S, Meng H, Inamdar S, et al. Activation of TRPV4 by mechanical, osmotic or pharmaceutical stimulation is anti-inflammatory blocking IL-1 beta mediated articular cartilage matrix destruction. Osteoarthritis Cartilage. 2021;29(1):89–99. doi:10.1016/j.joca.2020.08.002
35. Watanabe H, Vriens J, Prenen J, Droogmans G, Voets T, Nilius B. Anandamide and arachidonic acid use epoxyeicosatrienoic acids to activate TRPV4 channels. Nature. 2003;424(6947):434–438. doi:10.1038/nature01807
36. O’Conor CJ, Leddy HA, Benefield HC, Liedtke WB, Guilak F. TRPV4-mediated mechanotransduction regulates the metabolic response of chondrocytes to dynamic loading. Proc Natl Acad Sci U S A. 2014;111(4):1316–1321. doi:10.1073/pnas.1319569111
37. Xu B, Xing RL, Huang ZQ, et al. Excessive mechanical stress induces chondrocyte apoptosis through TRPV4 in an anterior cruciate ligament-transected rat osteoarthritis model. Life Sci. 2019;228:158–166. doi:10.1016/j.lfs.2019.05.003
38. O’Conor CJ, Ramalingam S, Zelenski NA, et al. Cartilage-specific knockout of the mechanosensory ion channel TRPV4 decreases age-related osteoarthritis. Sci Rep. 2016;6. doi:10.1038/srep29053
39. Driscoll C, Chanalaris A, Knights C, et al. Nociceptive sensitizers are regulated in damaged joint tissues, including articular cartilage, when osteoarthritic mice display pain behavior. Arthritis Rheumatol. 2016;68(4):857–867. doi:10.1002/art.39523
40. Simpson S, Preston D, Schwerk C, Schroten H, Blazer-Yost B. Cytokine and inflammatory mediator effects on TRPV4 function in choroid plexus epithelial cells. Am J Physiol-Cell Physiol. 2019;317(5):C881–C893. doi:10.1152/ajpcell.00205.2019
41. Phan MN, Leddy HA, Votta BJ, et al. Functional characterization of TRPV4 as an osmotically sensitive ion channel in porcine articular chondrocytes. Arthritis Rheum. 2009;60(10):3028–3037. doi:10.1002/art.24799
42. Xing RL, Wang PM, Zhao LR, Xu B, Zhang NS, Li XC. Mechanism of TRPA1 and TRPV4 participating in mechanical hyperalgesia of rat experimental knee osteoarthritis. Arch Rheumatol. 2017;32(2):96–104. doi:10.5606/ArchRheumatol.2017.6061
43. Nigrovic PA, Lee DM. Synovial mast cells: role in acute and chronic arthritis. Immunol Rev. 2007;217:19–37. doi:10.1111/j.1600-065X.2007.00506.x
44. Uchida K, Takano S, Inoue G, et al. Increase in mast cell marker expression in the synovium of obese patients with osteoarthritis of the knee. Diabetes Metab Syndr Obes. 2019;12:377–382. doi:10.2147/dmso.S201523
45. de Lange-brokaar BJE, Kloppenburg M, Andersen SN, et al. Characterization of synovial mast cells in knee osteoarthritis: association with clinical parameters. Osteoarthritis Cartilage. 2016;24(4):664–671. doi:10.1016/j.joca.2015.11.011
46. Wang Q, Lepus CM, Raghu H, et al. IgE-mediated mast cell activation promotes inflammation and cartilage destruction in osteoarthritis. Elife. 2019;8. doi:10.7554/eLife.39905
 © 2021 The Author(s). This work is published and licensed by Dove Medical Press Limited. The full terms of this license are available at https://www.dovepress.com/terms.php and incorporate the Creative Commons Attribution - Non Commercial (unported, v3.0) License.
By accessing the work you hereby accept the Terms. Non-commercial uses of the work are permitted without any further permission from Dove Medical Press Limited, provided the work is properly attributed. For permission for commercial use of this work, please see paragraphs 4.2 and 5 of our Terms.
© 2021 The Author(s). This work is published and licensed by Dove Medical Press Limited. The full terms of this license are available at https://www.dovepress.com/terms.php and incorporate the Creative Commons Attribution - Non Commercial (unported, v3.0) License.
By accessing the work you hereby accept the Terms. Non-commercial uses of the work are permitted without any further permission from Dove Medical Press Limited, provided the work is properly attributed. For permission for commercial use of this work, please see paragraphs 4.2 and 5 of our Terms.