")
Back to Journals » Cancer Management and Research » Volume 12
Identification of Chemoresistance-Associated Key Genes and Pathways in High-Grade Serous Ovarian Cancer by Bioinformatics Analyses
Authors Wu Y , Xia L, Guo Q, Zhu J, Deng Y, Wu X
Received 27 February 2020
Accepted for publication 12 June 2020
Published 30 June 2020 Volume 2020:12 Pages 5213—5223
DOI https://doi.org/10.2147/CMAR.S251622
Checked for plagiarism Yes
Review by Single anonymous peer review
Peer reviewer comments 2
Editor who approved publication: Dr Antonella D'Anneo
Yong Wu,1,2,* Lingfang Xia,1,2,* Qinhao Guo,1,2,* Jun Zhu,1,2 Yu Deng,2,3 Xiaohua Wu1,2
1Department of Gynecologic Oncology, Fudan University Shanghai Cancer Center, Shanghai, People’s Republic of China; 2Department of Oncology, Shanghai Medical College, Fudan University, Shanghai, People’s Republic of China; 3Department of Pathology, Fudan University Shanghai Cancer Center, Shanghai, People’s Republic of China
*These authors contributed equally to this work
Correspondence: Xiaohua Wu
Department of Gynecologic Oncology, Fudan University Shanghai Cancer Center, Shanghai 200000, People’s Republic of China
, Tel/Fax +86 21-64175590
Email [email protected]
Purpose: High-grade serous ovarian cancer (HGSOC) is the leading cause of death among gynecological malignancies. This is mainly attributed to its high rates of chemoresistance. To date, few studies have investigated the molecular mechanisms underlying this resistance to treatment in ovarian cancer patients. In this study, we aimed to explore these molecular mechanisms using bioinformatics analysis.
Methods: We analyzed microarray data set GSE51373, which included 16 platinum-sensitive HGSOC samples and 12 platinum-resistant control samples. Differentially expressed genes (DEGs) were identified using RStudio. Gene ontology (GO) and Kyoto Encyclopedia of Genes and Genomes (KEGG) pathway enrichment analyses were performed using DAVID, and a DEG-associated protein–protein interaction (PPI) network was constructed using STRING. Hub genes in the PPI network were identified, and the prognostic value of the top ten hub genes was evaluated. MGP, one of the hub genes, was verified by immunohistochemistry.
Results: All samples were confirmed to be of high quality. A total of 109 DEGs were identified, and the top ten enriched GO terms and four KEGG pathways were obtained. Specifically, the PI3K-AKT signaling pathway and the Rap1 signaling pathway were identified as having significant roles in chemoresistance in HGSOC. Furthermore, based on the PPI network, KIT, FOXM1, FGF2, HIST1H4D, ZFPM2, IFIT2, CCNO, MGP, RHOBTB3, and CDC7 were identified as hub genes. Five of these hub genes could predict the prognosis of HGSOC patients. Positive immunostaining signals for MGP were observed in the chemoresistant samples.
Conclusion: Taken together, the findings of this study may provide novel insights into HGSOC chemoresistance and identify important therapeutic targets.
Keywords: high-grade serous ovarian cancer, chemoresistance, gene expression profiling, bioinformatics analysis
Introduction
Epithelial ovarian cancer has the highest mortality rate of any gynecological cancer, with patients with high-grade serous ovarian cancer (HGSOC) having particularly poor outcomes.1,2 Typical treatments for HGSOC include surgical resection in combination with postoperative chemotherapy using cisplatin and paclitaxel.3 However, the vast majority of patients with advanced disease relapse within 5 years, often owing to metastasis and drug resistance of ovarian cancer cells.4–7 Therefore, there is a need to find more efficient therapeutic targets, including key genes and signaling pathways that drive therapy resistance.
Some progress has been made in determining the mechanisms of chemoresistance in HGSOC.5,8 For example, Zhang et al9 isolated CD44+/CD117+ ovarian cancer cell stem cells (CSCs) and found that they exhibited enhanced chemoresistance to the ovarian cancer chemotherapeutics cisplatin or paclitaxel. Liu et al10 found that C/EBPβ-mediated reprogramming of gene expression triggered a broad signaling network that synergistically promoted cisplatin resistance in HGSOC. Luo et al11 showed that loss of ARID1A in HGSOC led to multiple drug resistance through the upregulation of MRP2. Recently, tumor metabolism has also been implicated in chemoresistance; chemotherapeutic drugs combined with metabolic targeting appears to be a promising approach to overcoming chemoresistance.12,13 Nevertheless, these studies are only the tip of the iceberg regarding the mechanisms of platinum resistance in HGSOC. Stronger links between molecular profiles and drug resistance are needed.
Bioinformatics analysis is an effective and practical method to predict key genes and pathways in tumorigenesis or other pathological processes.14 In this study, we analyzed microarray profiles of 12 platinum-resistant HGSOC samples and 16 platinum-sensitive control samples from the Gene Expression Omnibus (GEO) database. Differentially expressed genes (DEGs) were screened, and gene ontology (GO) and Kyoto Encyclopedia of Genes and Genomes (KEGG) pathway enrichment analyses were conducted. We also constructed a protein–protein interaction (PPI) network and screened out the hub genes involved in the development of platinum-based chemotherapy resistance in HGSOC patients. Finally, we evaluated the significance of these hub genes with respect to prognosis, and chose one marker to validate its expression. This study may provide novel insights into HGSOC chemoresistance and identify potentially important therapeutic targets.
Materials and Methods
Data Sets
Microarray gene expression profiles from the GSE51373 data set15 were downloaded from the GEO database (http://www.ncbi.nlm.nih.gov/geo/). This data set is based on the GPL570 Affymetrix Human Genome U133 Plus 2.0 Array platform (Affymetrix Inc., Santa Clara, CA, USA) and contained 28 patients, who were divided into two groups (chemoresistant and chemosensitive groups). The inclusion criterion was as follows: patients with high-grade serous HGSOC, treated with the same standard platinum-based chemotherapy (Carboplatin/paclitaxel). Twelve patients demonstrating relative resistance to platinum chemotherapy corresponding to shorter progression-free survival (PFS < 8 months) were compared with 16 platinum-sensitive patients (PFS > 18 months).
Data Pre‑processing and Differential Expression Analysis
RStudio software (version 1.1.447) and various R packages were used to analyze the original array data. In short, we first assessed the quality of the raw data by plotting the normalized unscaled standard error (NUSE) boxplot and plot of residuals. Then, background correction and quantile normalization were performed on the raw data using the robust multi-array average algorithm in the R affy package. Subsequently, the DEGs between the chemosensitive and chemoresistant group samples were sorted by paired t-tests using the limma package in R. Multiple comparisons were corrected by the Benjamini–Hochberg method to obtain adjusted P-values. Finally, genes with adjusted P<0.05 and |log2 fold change (FC)|>1 were considered to be significant.
Functional Enrichment Analysis
GO enrichment and KEGG pathway analyses were performed for gene annotation and functional enrichment using the online tool Database for Annotation, Visualization and Integrated Discovery (DAVID, http://david.abcc.ncifcrf.gov/).16 The resulting GO terms and KEGG pathways with P<0.05 were considered to be significantly enriched in the obtained DEGs.
Construction of PPI Network
To evaluate the interactive relationships among DEGs, we mapped the DEGs to the STRING database (http://string-db.org). Only the interactions with a combined score >0.15 were considered significant. Hub genes were then selected from the PPI network and a score was calculated for each gene (the number of genes directly interacting with it). The top ten hub genes in the network were identified based on their scores.
Evaluation of the Prognostic Significance of Top Ten Hub Genes
Kaplan–Meier Plotter, an online survival analysis tool (http://kmplot.com/analysis/),17,18 was used to evaluate the prognostic significance of the top ten hub genes in HGSOC. According to their median expression value, the patient samples were divided into high- and low-expression groups. Hazard ratios with 95% confidence intervals and log-rank P-values were calculated.
Immunohistochemistry
Immunohistochemical analyses were performed using the Envision System with diaminobenzidine (Gene Tech Co., Ltd., Shanghai) according to the manufacturer’s protocol. Chemoresistant and chemosensitive samples were collected from Fudan University Shanghai Cancer Center. In brief, specimens were incubated first with an anti-MGP antibody (10734-1-AP; 1:400, Proteintech, China) overnight at 4°C and then with a biotinylated secondary antibody (1:100, goat anti-rabbit IgG) for 30 mins at 37°C.
Ethics Statement
The tissue samples from patients in this study were used with approval from the Ethics Committee of Fudan University Shanghai Cancer Center and with informed consent from all patients. All procedures were performed in accordance with the Declaration of Helsinki and relevant policies in China.
Results
Quality Control of Data Sets
Good quality control is essential for successful microarray data analysis. In the present study, we used NUSE boxplots and residual plots to assess the quality of the data sets. As described in the literature, if a microarray data set is very reliable, its NUSE values will be very close to one. Our results (Figure 1A) show that this was the case for our data set. The residuals were distributed uniformly (shown in red and blue in Figure 1B), which further confirmed the quality of the data set.
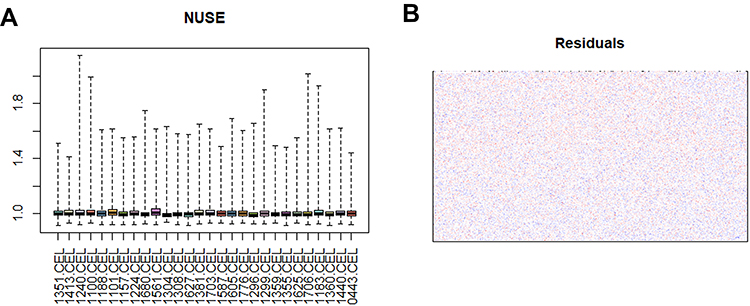 |
Figure 1 Evaluation of the quality of the microarray data set. (A) Normalized unscaled standard error (NUSE) boxplot for all samples. (B) Plot of residuals also confirmed the quality of the microarray data set. |
Screening of DEGs
After quality assessment, a set of 20,460 genes were mapped to probes for each CEL file. Then, we defined 109 DEGs between chemoresistant and chemosensitive samples, of which 64 (58.7%) were upregulated and 45 (41.3%) were downregulated (Table S1). Genes with |logFC| >1 and adjusted P<0.05 are marked in red in the volcano plot in Figure 2A. A heat map of these DEGs is presented in Figure 2B, and the top ten DEGs are listed in Table 1.
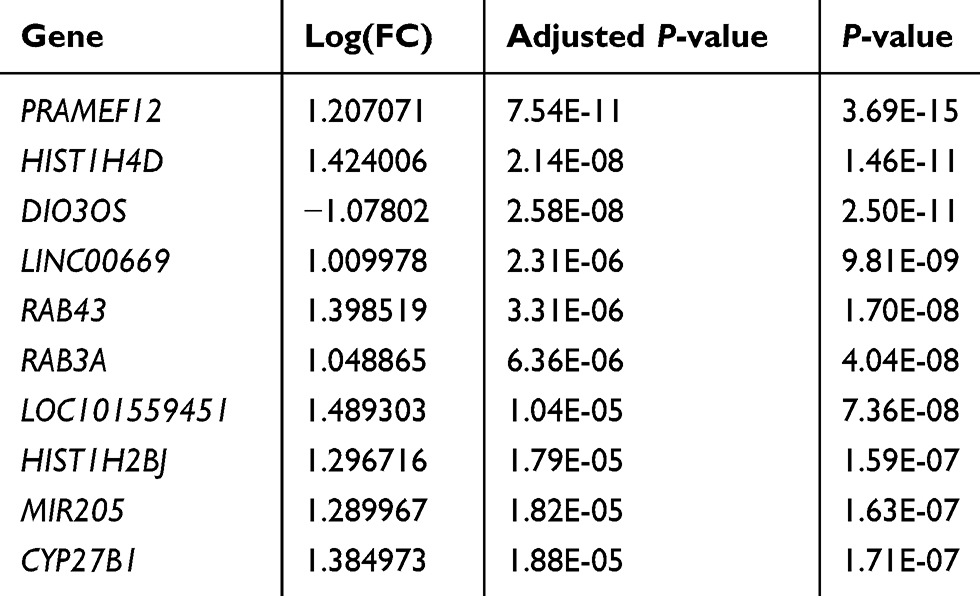 |
Table 1 Top Ten Differentially Expressed Genes Between Chemosensitive and Chemoresistant Samples |
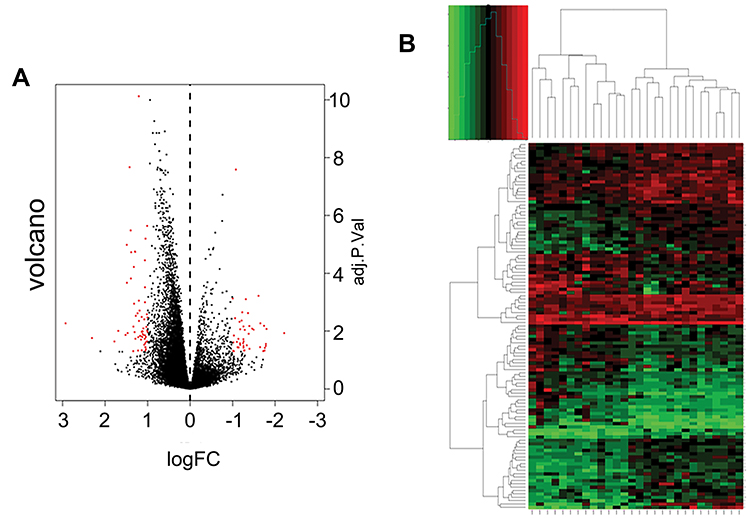 |
Figure 2 Expression levels of genes and distributions in microarray data set. (A) Volcano plots of microarray data. Y-axis represents log2 FC. X-axis represents adjusted P-value (chemosensitive vs chemoresistant samples). Red dots indicate DEGs. (B) Heatmap of DEG clustering. Green represents downregulation and red represents upregulation. |
Significant Functions and Pathway Enrichment Analysis
Potential biological functions associated with these DEGs may imply intrinsic chemoresistance mechanisms. We used the online software DAVID to identify the representative GO categories and KEGG pathways. The top ten most enriched GO terms according to P-values and numbers of enriched pathways are shown in Figure 3 and Table 2. These GO terms included response to stimulus, cell communication, positive regulation of biological process, and cellular component organization or biogenesis. Many of these terms are closely related to chemoresistance and tumorigenesis. The four KEGG pathways that were enriched are presented in Figure 3 and Table 2. These included the PI3K-AKT signaling pathway and the Rap1 signaling pathway, which may have important roles in chemoresistance in HGSOC patients.
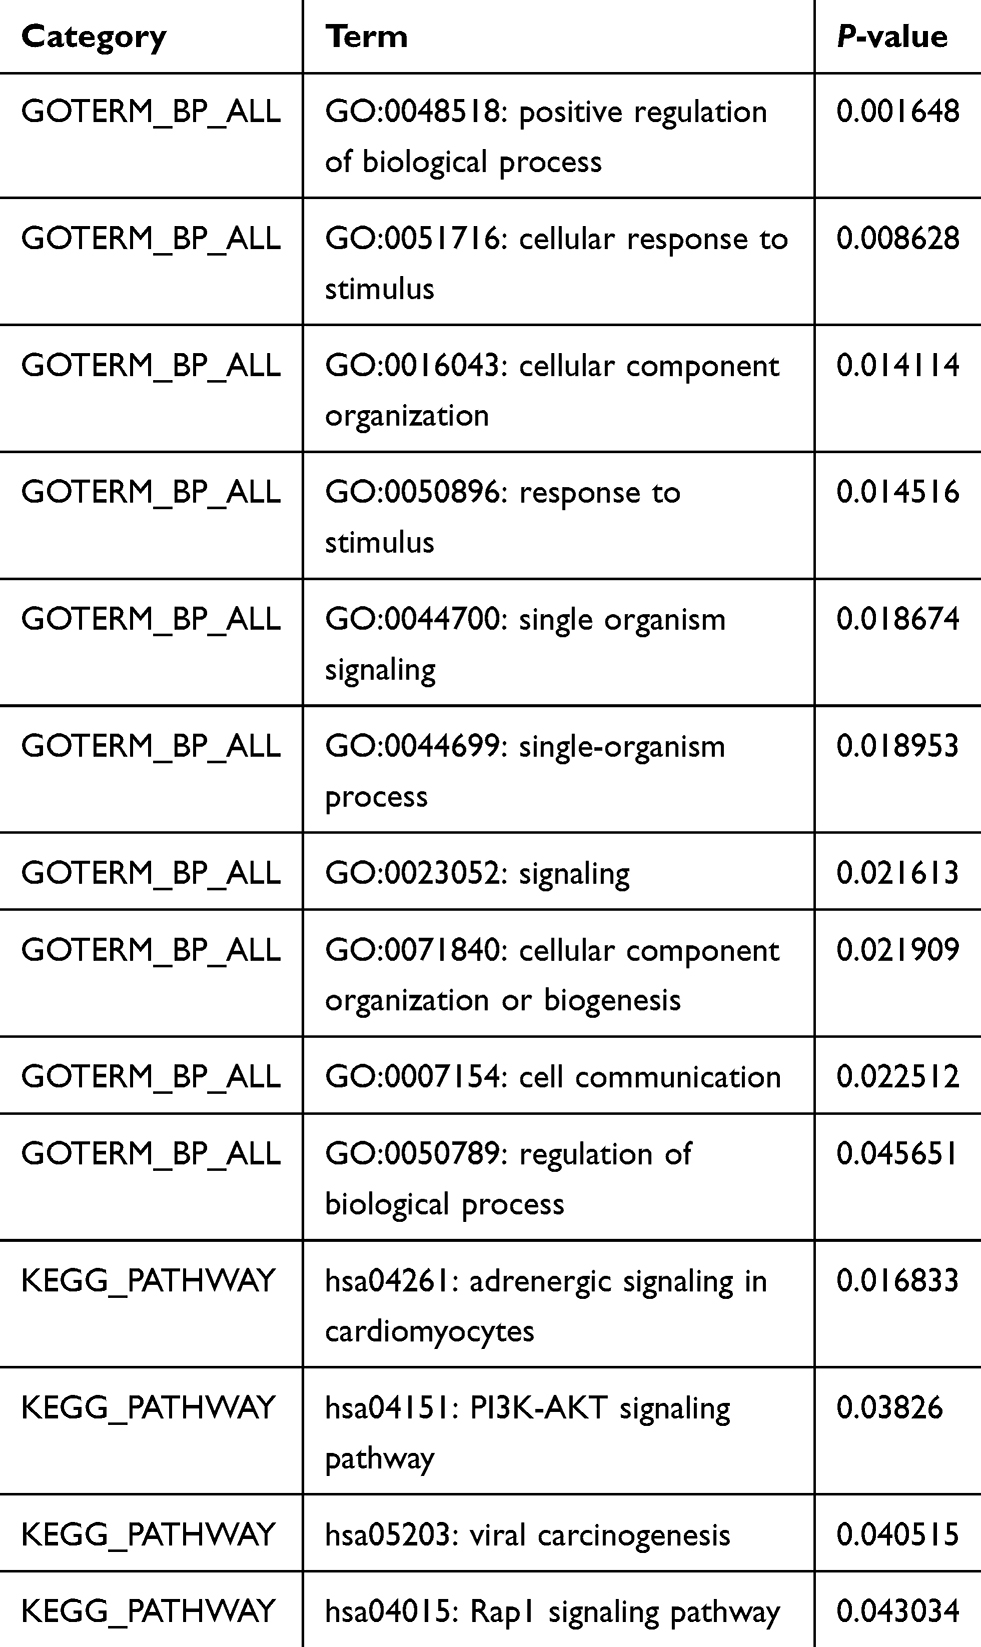 |
Table 2 Enriched GO Terms and KEGG Pathways for the Identified DEGs |
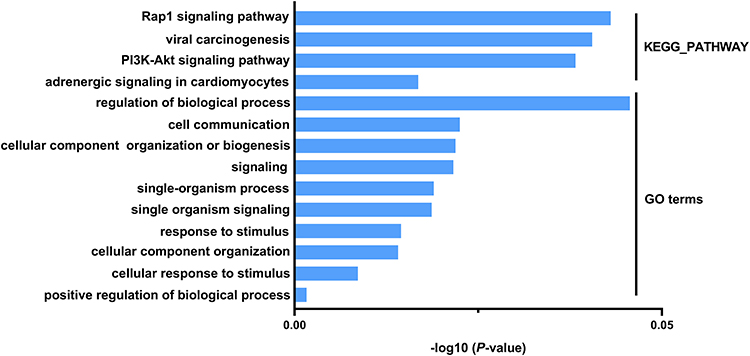 |
Figure 3 Representative GO categories and KEGG pathways obtained using DAVID. |
PPI Network Analysis and Hub Genes Screening
To determine the interactions among the identified genes, we constructed a PPI network using the online tool STRING. Only genes with score >0.15 were included in the network. As shown in Figure 3A, we obtained a network containing a total of 213 PPI relationships and 97 nodes after removing the effects of free protein pairs, accounting for 89% of all DEGs.
In PPI networks, hub genes, which have strong interactions with many other genes, can exert huge effects on tumorigenesis. Owing to their key positions, hub genes are potential drivers of disease. In order to identify the key genes in chemoresistance of HGSOC, the cytoHubba plugin for Cytoscape was used to screen the hub genes. As shown in Figure 3B and Table 3, we obtained ten hub genes (nodes colored red or orange in the figure) according to their scores; these were proto-oncogene c-Kit (KIT), forkhead box protein M1 (FOXM1), fibroblast growth factor 2 (FGF2), H4 clustered histone 4 (HIST1H4D), zinc finger protein FOG family member 2 (ZFPM2), IFN-induced protein with tetratricopeptide repeats 2 (IFIT2), cyclin O (CCNO), matrix Gla protein (MGP), rho-related BTB domain-containing 3 (RHOBTB3), and cell division cycle 7 (CDC7). The hub genes identified in the PPI network analysis may be key players in the development of cancer chemoresistance. Table 4 provides a brief overview of the functions of these hub genes. In addition, we tested the expression of hub genes using a data set from The Cancer Genome Atlas (Figure S1); however, the expression of some hub genes in this data set, including KIT, did not match the results of the current bioinformatics analyses. This was probably due to the small data set itself or the changes in the genome during the development of platinum resistance in ovarian cancer patients.
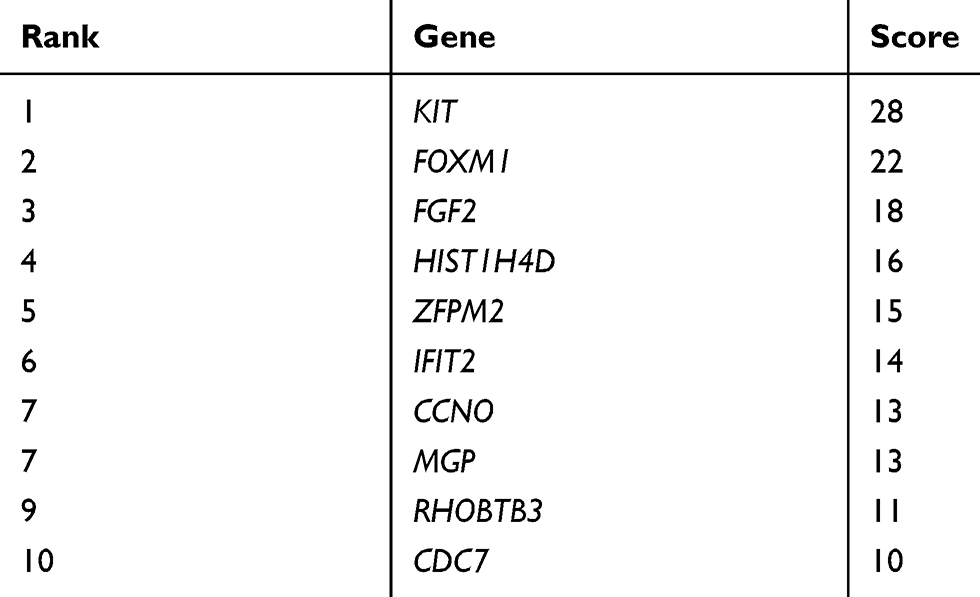 |
Table 3 Identified Hub Genes in the PPI Network |
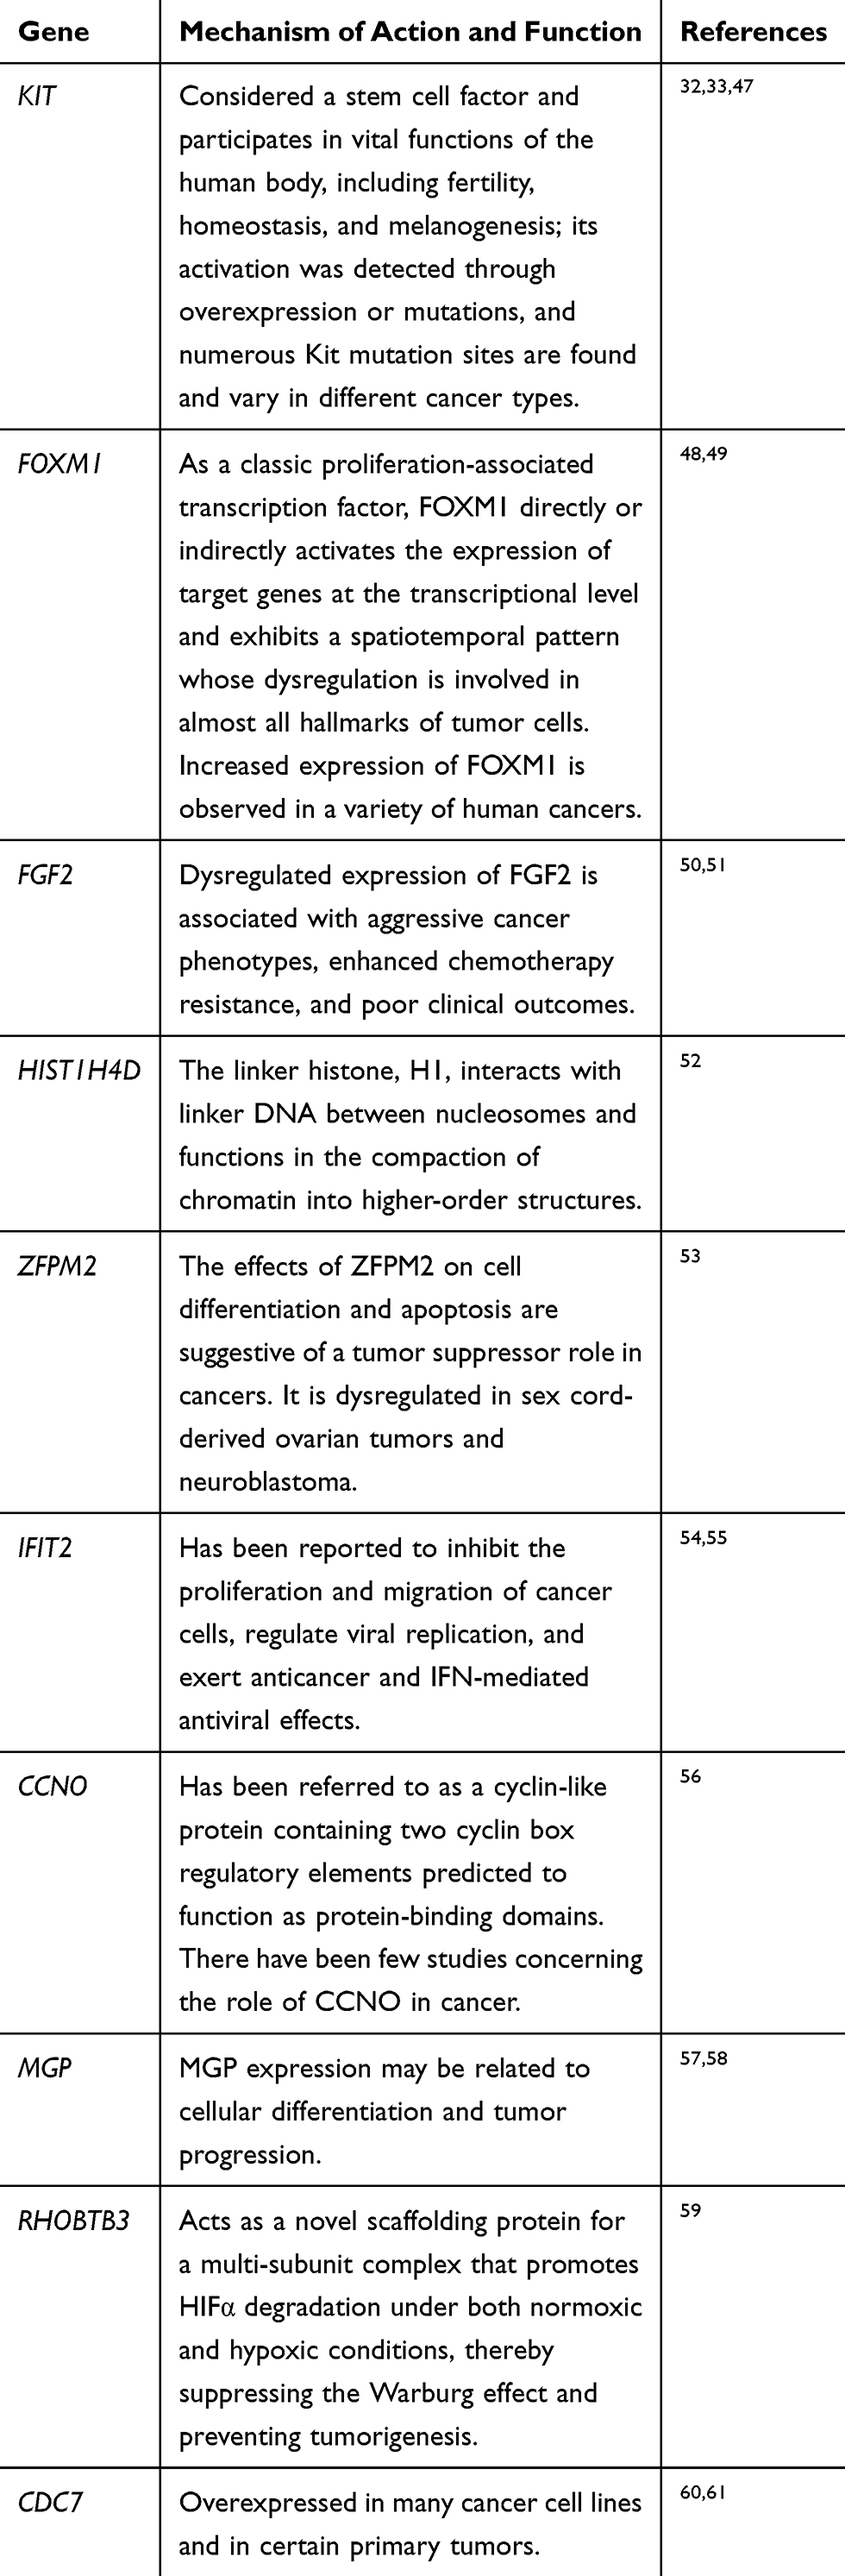 |
Table 4 Overview of the Functions of Top Ten Hub Genes |
Evaluation of Hub Genes as Prognostic Markers for HGSOC Patients
Given their vital roles in the process of tumor chemoresistance, we explored the prognostic significance of the hub genes in HGSOC patients. Survival analysis was performed using Kaplan–Meier Plotter, which contains a large number of HGSOC microarray data sets. As shown in Figure 4, we found that five of the ten hub genes could predict the prognosis of HGSOC patients (Figure 5, P<0.05). High expression levels of ZFPM2, MGP, and RHOBTB3 were correlated with decreased overall survival, whereas high expression levels of another two genes, HIST1H4D and CCNO, were associated with positive prognosis.
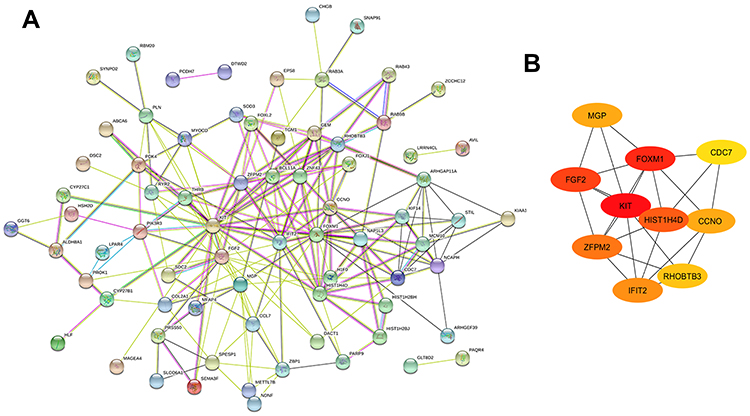 |
Figure 4 PPI network of DEGs. (A) A total of 213 PPI relationships and 97 nodes were obtained; PPIs with a score >0.15 were selected. (B) Sub-network of ten hub genes. Color gradient from orange to red indicates increasing score. |
Validation of the Expression of MGP in Patients
To further validate the findings, we performed immunostaining with antibodies on chemoresistant (platinum-resistant) and chemosensitive (platinum-sensitive) HGSOC samples collected from our cancer center. Given that no antibodies specific to HIST1H4D, RHOBTB3, CCNO, or ZFPM2 were commercially available, we detected the protein expression of MGP only. Positive immunostaining signals for MGP were observed in the chemoresistant samples (n=3, Figure 6).
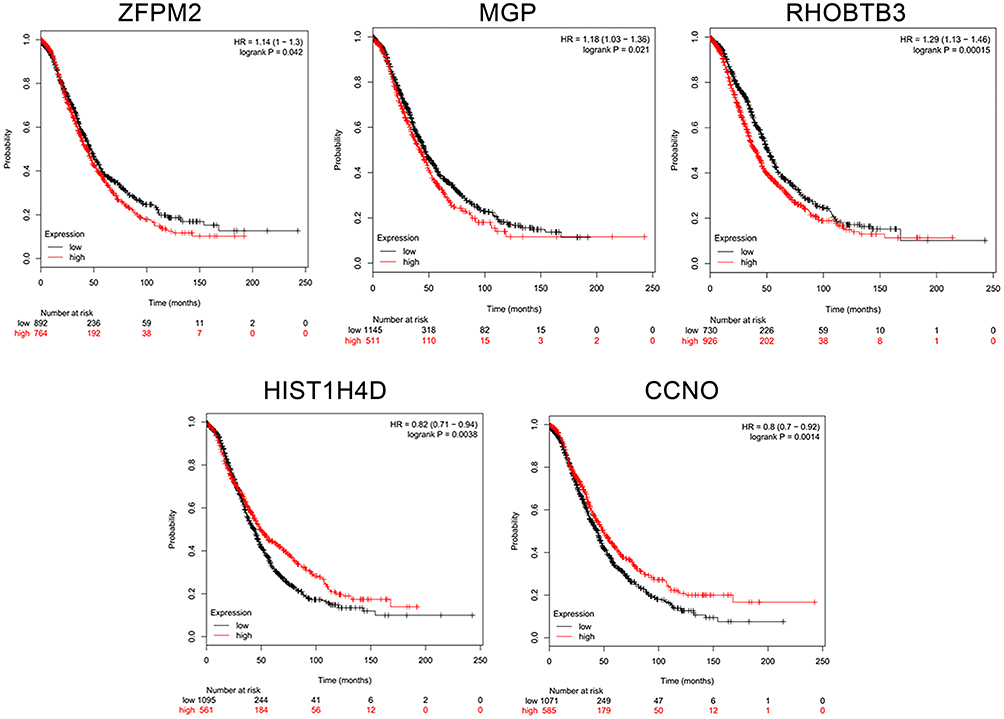 |
Figure 5 Exploration of prognostic value of hub genes. Survival data were analyzed using Kaplan–Meier Plotter, and overall survival curves were plotted based on data of all ovarian cancer patients (n=1656). Red line: patients with expression above the median; black line: patients with expression below the median. Abbreviation: HR, hazard ratio. |
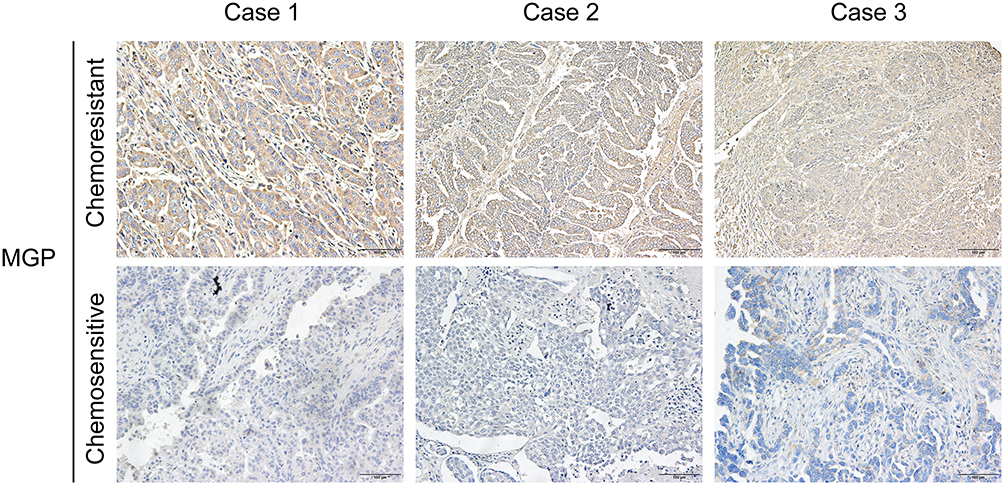 |
Figure 6 Expression of MGP detected in platinum-resistant HGSOC samples compared with platinum-sensitive tissues. |
Discussion
Platinum resistance is a major obstacle that limits the efficacy of platinum-based chemotherapy in ovarian cancer.7 Therefore, new therapeutic targets are urgently needed. In the present study, the GSE51373 data set was analyzed and all DEGs between chemosensitive and chemoresistant samples were identified. Quality control of the test arrays before analysis confirmed that the samples were of good quality. A total of 109 DEGs were identified, comprising 64 upregulated and 45 downregulated genes.
To obtain a more in-depth understanding of these DEGs, GO analysis was performed to identify related biological processes. The results showed that positive regulation of biological process, cellular response to stimulus, cellular component organization, response to stimulus, and single organism signaling were the top five abundant functions. In addition, we conducted KEGG analysis to investigate the pathways involved. The enriched KEGG pathways for the DEGs included the PI3K-AKT and Rap1 signaling pathways. The PI3K-AKT signaling pathway, mediated by PI3K, is one of the most important signaling cascades, with pivotal roles in various cellular biological processes including survival, growth, proliferation, differentiation, and apoptosis. Dysregulation of this signaling cascade has commonly been observed in a broad range of human cancers.19–23 A recent study showed that alterations of the PI3K pathway are also part of the chemoresistance profile in ovarian cancer patients.23 PI3K, a frequently mutated kinase that is known to increase chemoresistance in ovarian cancer, usually acts as an essential lipid second messenger in the translocation of protein kinase B (AKT) to the plasma membrane.24 Downstream of PI3K, AKT is phosphorylated at two sites, T308 in the kinase domain and S473 in the regulatory tail. Phosphorylation at T308 and S473 is essential for maximal AKT activation. Phosphorylated AKT regulates the functions of a broad array of intracellular proteins involved in chemoresistance against platinum in ovarian cancer.25 The Rap1 signaling pathway was also highly enriched. Rap1, which belongs to the Ras family, regulates two important cellular processes: B-RAF/MEK/ERK activation, and integrin-mediated cell adhesion and migration. Many studies have shown that Rap1 and its upstream regulators play an important part in the development of human malignancies.26–29 However, few studies have investigated its relationship with platinum resistance in ovarian cancer.
A network of interactions between proteins helps to dig up the hub gene, which may be a potential therapeutic target in HGSOC. A series of hub genes in this study were discovered, the top three of which were KIT, FOXM1, and FGF2. KIT, a type III receptor tyrosine kinase, has a crucial role in cancer biology.30,31 Currently, c-Kit is mainly considered as a stem cell factor. In addition, early studies on c-Kit identified it as an oncogene.32,33 Chau et al34 first reported a relationship between c-Kit and chemoresistance of ovarian cancer, and showed that c-Kit mediates chemoresistance and the tumor-initiating capacity of ovarian cancer cells through activation of Wnt/β-catenin-ATP-binding cassette G2 signaling. The second hub gene, FOXM1, a transcription factor of the forkhead family, has been demonstrated to be critical for proliferation, apoptosis, migration, and invasion of human cancers.35 FOXM1 has been shown to be overexpressed in cancer cells with resistance to DNA-damaging agents, and its expression can confer resistance to genotoxic agents.36–38 For example, FOXM1 modulates sensitivity to the DNA-damaging agents cisplatin and doxorubicin through regulating Exo1 in ovarian and breast cancer, respectively.39,40 The third hub gene, FGF2, a pleiotropic angiogenesis inducer belonging to the heparin-binding FGF growth factor family, is expressed by numerous tumor types and exerts its proangiogenic activity by interacting with tyrosine kinase receptors, heparan-sulfate proteoglycans, and integrins.41–43 Moreover, accumulating evidence indicates that FGF2 contributes to cytoprotection against drug toxicity via regulating apoptotic mediators and thus has an important role in cancer drug resistance.44–46 In summary, these hub genes may represent potential therapeutic targets for overcoming platinum resistance in ovarian cancer. However, the role of these genes has not been experimentally confirmed, and there may be some discrepancies owing to sample size, etc. Generally, our results suggest a possible role of some genes in platinum resistance of ovarian cancer from a bioinformatics perspective.
There were several limitations to the current study. First, this study was based on microarray data mining. Post-transcriptional modifications may exist, and protein expression levels may be different from mRNA levels. Therefore, further studies are necessary to confirm these results. Second, the results were only analyzed using bioinformatics; experimental verification is required to confirm our findings. Third, the threshold we set for constructing the PPI network may not have been stringent enough, because we screened out a relatively small number of DEGs. Therefore, PPI networks may not be constructed under a more stringent threshold.
Conclusions
In the present study, we analyzed a data set of microarray profiles from chemoresistant HGSOC patients and control chemosensitive samples using bioinformatics tools. Enriched GO terms and KEGG pathways were identified. Moreover, a PPI network was constructed and network modules were analyzed. Finally, we found that five of the top ten hub genes were associated with the prognosis of HGSOC patients. Collectively, these results may provide a basis for the screening of drug candidates and prognostic factors for HGSOC.
Disclosure
The authors declare that they have no conflicts of interest in this work.
References
1. Barnett R. Ovarian cancer. Lancet. 2016;387(10025):1265. doi:10.1016/S0140-6736(16)30024-1
2. Bertone-Johnson ER. Epidemiology of ovarian cancer: a status report. Lancet. 2005;365(9454):101–102. doi:10.1016/S0140-6736(05)17716-2
3. Assis J, Pereira D, Nogueira A, Medeiros R. Ovarian cancer overview: molecular biology and its potential clinical application. Ovarian Cancer. 2018.
4. Li SS, Ma J, Wong AST. Chemoresistance in ovarian cancer: exploiting cancer stem cell metabolism. J Gynecol Oncol. 2018;29(2):e32. doi:10.3802/jgo.2018.29.e32
5. Cornelison R, Llaneza DC, Landen CN. Emerging therapeutics to overcome chemoresistance in epithelial ovarian cancer: a mini-review. Int J Mol Sci. 2017;18(10):2171. doi:10.3390/ijms18102171
6. Krzystyniak J, Ceppi L, Dizon DS, Birrer MJ. Epithelial ovarian cancer: the molecular genetics of epithelial ovarian cancer. Ann Oncol. 2016;27(Suppl 1):i4–i10. doi:10.1093/annonc/mdw083
7. Patch AM, Christie EL, Etemadmoghadam D, et al. Whole-genome characterization of chemoresistant ovarian cancer. Nature. 2015;521(7553):489–494. doi:10.1038/nature14410
8. Ahmed N, Abubaker K, Findlay JK. Ovarian cancer stem cells: molecular concepts and relevance as therapeutic targets. Mol Aspects Med. 2014;39:110–125. doi:10.1016/j.mam.2013.06.002
9. Zhang S, Balch C, Chan MW, et al. Identification and characterization of ovarian cancer-initiating cells from primary human tumors. Cancer Res. 2008;68(11):4311–4320. doi:10.1158/0008-5472.CAN-08-0364
10. Liu D, Zhang XX, Li MC, et al. C/EBPbeta enhances platinum resistance of ovarian cancer cells by reprogramming H3K79 methylation. Nat Commun. 2018;9(1):1739. doi:10.1038/s41467-018-03590-5
11. Luo Q, Wu X, Zhang Y, et al. ARID1A ablation leads to multiple drug resistance in ovarian cancer via transcriptional activation of MRP2. Cancer Lett. 2018;427:9–17. doi:10.1016/j.canlet.2018.04.013
12. Gottlieb E, Tomlinson IP. Mitochondrial tumour suppressors: a genetic and biochemical update. Nat Rev Cancer. 2005;5(11):857–866. doi:10.1038/nrc1737
13. Zhou Y, Zhou Y, Shingu T, et al. Metabolic alterations in highly tumorigenic glioblastoma cells: preference for hypoxia and high dependency on glycolysis. J Biol Chem. 2011;286(37):32843–32853. doi:10.1074/jbc.M111.260935
14. Zhou Q, Hong L, Wang J. Identification of key genes and pathways in pelvic organ prolapse based on gene expression profiling by bioinformatics analysis. Arch Gynecol Obstet. 2018;297(5):1323–1332. doi:10.1007/s00404-018-4745-1
15. Koti M, Gooding RJ, Nuin P, et al. Identification of the IGF1/PI3K/NF kappaB/ERK gene signalling networks associated with chemotherapy resistance and treatment response in high-grade serous epithelial ovarian cancer. BMC Cancer. 2013;13(1):549. doi:10.1186/1471-2407-13-549
16. Gene Ontology C. The gene ontology (GO) project in 2006. Nucleic Acids Res. 2006;34(Databaseissue):D322–326. doi:10.1093/nar/gkj021
17. Gyorffy B, Lanczky A, Szallasi Z. Implementing an online tool for genome-wide validation of survival-associated biomarkers in ovarian-cancer using microarray data from 1287 patients. Endocr Relat Cancer. 2012;19(2):197–208. doi:10.1530/ERC-11-0329
18. Lanczky A, Nagy A, Bottai G, et al. miRpower: a web-tool to validate survival-associated miRNAs utilizing expression data from 2178 breast cancer patients. Breast Cancer Res Treat. 2016;160(3):439–446. doi:10.1007/s10549-016-4013-7
19. Previs RA, Armaiz-Pena GN, Ivan C, et al. Role of YAP1 as a marker of sensitivity to dual AKT and P70S6K inhibition in ovarian and uterine malignancies. J Natl Cancer Inst. 2017;109(7). doi:10.1093/jnci/djw296.
20. McKinnon BD, Kocbek V, Nirgianakis K, Bersinger NA, Mueller MD. Kinase signalling pathways in endometriosis: potential targets for non-hormonal therapeutics. Hum Reprod Update. 2016;22(3):382–403. doi:10.1093/humupd/dmv060
21. Huang Y, Hua K, Zhou X, et al. Activation of the PI3K/AKT pathway mediates FSH-stimulated VEGF expression in ovarian serous cystadenocarcinoma. Cell Res. 2008;18(7):780–791. doi:10.1038/cr.2008.70
22. Hanrahan AJ, Schultz N, Westfal ML, et al. Genomic complexity and AKT dependence in serous ovarian cancer. Cancer Discov. 2012;2(1):56–67. doi:10.1158/2159-8290.CD-11-0170
23. Janku F, Wheler JJ, Westin SN, et al. PI3K/AKT/mTOR inhibitors in patients with breast and gynecologic malignancies harboring PIK3CA mutations. J Clin Oncol. 2012;30(8):777–782. doi:10.1200/JCO.2011.36.1196
24. Kinross KM, Montgomery KG, Kleinschmidt M, et al. An activating Pik3ca mutation coupled with Pten loss is sufficient to initiate ovarian tumorigenesis in mice. J Clin Invest. 2012;122(2):553–557. doi:10.1172/JCI59309
25. Zheng HC. The molecular mechanisms of chemoresistance in cancers. Oncotarget. 2017;8(35):59950–59964. doi:10.18632/oncotarget.19048
26. Shah S, Brock EJ, Ji K, Mattingly RR. Ras and Rap1: a tale of two GTPases. Semin Cancer Biol. 2018.
27. Gloerich M, Bos JL. Regulating Rap small G-proteins in time and space. Trends Cell Biol. 2011;21(10):615–623. doi:10.1016/j.tcb.2011.07.001
28. Bos JL, de Bruyn K, Enserink J, et al. The role of Rap1 in integrin-mediated cell adhesion. Biochem Soc Trans. 2003;31(Pt 1):83–86. doi:10.1042/bst0310083
29. Scheele JS, Ripple D, Lubbert M. The role of Ras and other low molecular weight guanine nucleotide (GTP)-binding proteins during hematopoietic cell differentiation. Cell Mol Life Sci. 2000;57(13–14):1950–1963. doi:10.1007/PL00000675
30. Shah YM, van den Brink GR. c-Kit as a novel potential therapeutic target in colorectal cancer. Gastroenterology. 2015;149(3):534–537. doi:10.1053/j.gastro.2015.07.027
31. Ashman LK. The biology of stem cell factor and its receptor C-kit. Int J Biochem Cell Biol. 1999;31(10):1037–1051. doi:10.1016/S1357-2725(99)00076-X
32. Furitsu T, Tsujimura T, Tono T, et al. Identification of mutations in the coding sequence of the proto-oncogene c-kit in a human mast cell leukemia cell line causing ligand-independent activation of c-kit product. J Clin Invest. 1993;92(4):1736–1744. doi:10.1172/JCI116761
33. Yavuz AS, Lipsky PE, Yavuz S, Metcalfe DD, Akin C. Evidence for the involvement of a hematopoietic progenitor cell in systemic mastocytosis from single-cell analysis of mutations in the c-kit gene. Blood. 2002;100(2):661–665. doi:10.1182/blood-2002-01-0203
34. Chau WK, Ip CK, Mak AS, Lai HC, Wong AS. c-Kit mediates chemoresistance and tumor-initiating capacity of ovarian cancer cells through activation of Wnt/beta-catenin-ATP-binding cassette G2 signaling. Oncogene. 2013;32(22):2767–2781. doi:10.1038/onc.2012.290
35. Gartel AL. FOXM1 in cancer: interactions and vulnerabilities. Cancer Res. 2017;77(12):3135–3139. doi:10.1158/0008-5472.CAN-16-3566
36. Yao S, Fan LY, Lam EW. The FOXO3-FOXM1 axis: a key cancer drug target and a modulator of cancer drug resistance. Semin Cancer Biol. 2017.
37. Westhoff GL, Chen Y, Teng NNH. Targeting FOXM1 improves cytotoxicity of paclitaxel and cisplatinum in platinum-resistant ovarian cancer. Int J Gynecol Cancer. 2017;27(8):1602–1609. doi:10.1097/IGC.0000000000001063
38. Tassi RA, Todeschini P, Siegel ER, et al. FOXM1 expression is significantly associated with chemotherapy resistance and adverse prognosis in non-serous epithelial ovarian cancer patients. J Exp Clin Cancer Res. 2017;36(1):63. doi:10.1186/s13046-017-0536-y
39. Park YY, Jung SY, Jennings NB, et al. FOXM1 mediates dox resistance in breast cancer by enhancing DNA repair. Carcinogenesis. 2012;33(10):1843–1853. doi:10.1093/carcin/bgs167
40. Zhou J, Wang Y, Wang Y, et al. FOXM1 modulates cisplatin sensitivity by regulating EXO1 in ovarian cancer. PLoS One. 2014;9(5):e96989. doi:10.1371/journal.pone.0096989
41. Bhadada SV, Goyal BR, Patel MM. Angiogenic targets for potential disorders. Fundam Clin Pharmacol. 2011;25(1):29–47. doi:10.1111/j.1472-8206.2010.00814.x
42. Katoh M. Cancer genomics and genetics of FGFR2 (review). Int J Oncol. 2008;33(2):233–237.
43. Vacca A, Ria R, Ribatti D, Bruno M, Dammacco F. Angiogenesis and tumor progression in melanoma. Recenti Prog Med. 2000;91(11):581–587.
44. Sugimoto K, Miyata Y, Nakayama T, et al. Fibroblast growth factor-2 facilitates the growth and chemo-resistance of leukemia cells in the bone marrow by modulating osteoblast functions. Sci Rep. 2016;6(1):30779. doi:10.1038/srep30779
45. Pardo OE, Arcaro A, Salerno G, Raguz S, Downward J, Seckl MJ. Fibroblast growth factor-2 induces translational regulation of Bcl-XL and Bcl-2 via a MEK-dependent pathway. Correlation with resistance to etoposide-induced apoptosis. J Biol Chem. 2015;290(25):15390. doi:10.1074/jbc.A115.109006
46. Song S, Wientjes MG, Gan Y, Au JL. Fibroblast growth factors: an epigenetic mechanism of broad spectrum resistance to anticancer drugs. Proc Natl Acad Sci U S A. 2000;97(15):8658–8663. doi:10.1073/pnas.140210697
47. Ashman LK, Griffith R. Therapeutic targeting of c-KIT in cancer. Expert Opin Investig Drugs. 2013;22(1):103–115. doi:10.1517/13543784.2013.740010
48. Zona S, Bella L, Burton MJ, Nestal de Moraes G, Lam EW. FOXM1: an emerging master regulator of DNA damage response and genotoxic agent resistance. Biochim Biophys Acta. 2014;1839(11):1316–1322. doi:10.1016/j.bbagrm.2014.09.016
49. Wierstra I. FOXM1 (Forkhead box M1) in tumorigenesis: overexpression in human cancer, implication in tumorigenesis, oncogenic functions, tumor-suppressive properties, and target of anticancer therapy. Adv Cancer Res. 2013;119:191–419.
50. Powers CJ, McLeskey SW, Wellstein A. Fibroblast growth factors, their receptors and signaling. Endocr Relat Cancer. 2000;7(3):165–197. doi:10.1677/erc.0.0070165
51. Korc M, Friesel RE. The role of fibroblast growth factors in tumor growth. Curr Cancer Drug Targets. 2009;9(5):639–651. doi:10.2174/156800909789057006
52. Plotnikov AN, Yang S, Zhou TJ, Rusinova E, Frasca A, Zhou MM. Structural insights into acetylated-histone H4 recognition by the bromodomain-PHD finger module of human transcriptional coactivator CBP. Structure. 2014;22(2):353–360. doi:10.1016/j.str.2013.10.021
53. Laitinen MP, Anttonen M, Ketola I, et al. Transcription factors GATA-4 and GATA-6 and a GATA family cofactor, FOG-2, are expressed in human ovary and sex cord-derived ovarian tumors. J Clin Endocrinol Metab. 2000;85(9):3476–3483. doi:10.1210/jcem.85.9.6828
54. Lai KC, Chang KW, Liu CJ, Kao SY, Lee TC. IFN-induced protein with tetratricopeptide repeats 2 inhibits migration activity and increases survival of oral squamous cell carcinoma. Mol Cancer Res. 2008;6(9):1431–1439. doi:10.1158/1541-7786.MCR-08-0141
55. Chen L, Liu S, Xu F, et al. Inhibition of proteasome activity induces aggregation of IFIT2 in the centrosome and enhances IFIT2-induced cell apoptosis. Int J Biol Sci. 2017;13(3):383–390. doi:10.7150/ijbs.17236
56. Li L, Cao Y, Zhou H, et al. Knockdown of CCNO decreases the tumorigenicity of gastric cancer by inducing apoptosis. Onco Targets Ther. 2018;11:7471–7481. doi:10.2147/OTT.S176252
57. Zhao J, Warburton D. Matrix Gla protein gene expression is induced by transforming growth factor-beta in embryonic lung culture. Am J Physiol. 1997;273(1 Pt 1):L282–287. doi:10.1152/ajplung.1997.273.1.L282
58. Yoshimura K, Takeuchi K, Nagasaki K, et al. Prognostic value of matrix Gla protein in breast cancer. Mol Med Rep. 2009;2(4):549–553. doi:10.3892/mmr_00000135
59. Zhang CS, Liu Q, Li M, et al. RHOBTB3 promotes proteasomal degradation of HIFalpha through facilitating hydroxylation and suppresses the warburg effect. Cell Res. 2015;25(9):1025–1042. doi:10.1038/cr.2015.90
60. Bonte D, Lindvall C, Liu H, Dykema K, Furge K, Weinreich M. Cdc7-Dbf4 kinase overexpression in multiple cancers and tumor cell lines is correlated with p53 inactivation. Neoplasia. 2008;10(9):920–931. doi:10.1593/neo.08216
61. Montagnoli A, Moll J, Colotta F. Targeting cell division cycle 7 kinase: a new approach for cancer therapy. Clin Cancer Res. 2010;16(18):4503–4508. doi:10.1158/1078-0432.CCR-10-0185
 © 2020 The Author(s). This work is published and licensed by Dove Medical Press Limited. The full terms of this license are available at https://www.dovepress.com/terms.php and incorporate the Creative Commons Attribution - Non Commercial (unported, v3.0) License.
By accessing the work you hereby accept the Terms. Non-commercial uses of the work are permitted without any further permission from Dove Medical Press Limited, provided the work is properly attributed. For permission for commercial use of this work, please see paragraphs 4.2 and 5 of our Terms.
© 2020 The Author(s). This work is published and licensed by Dove Medical Press Limited. The full terms of this license are available at https://www.dovepress.com/terms.php and incorporate the Creative Commons Attribution - Non Commercial (unported, v3.0) License.
By accessing the work you hereby accept the Terms. Non-commercial uses of the work are permitted without any further permission from Dove Medical Press Limited, provided the work is properly attributed. For permission for commercial use of this work, please see paragraphs 4.2 and 5 of our Terms.