")
Back to Journals » International Journal of General Medicine » Volume 15
Identification of Biomarkers Related to Regulatory T Cell Infiltration in Oral Squamous Cell Carcinoma Based on Integrated Bioinformatics Analysis
Authors Wang C, Chen Z, Yang X, Zhang W, Zhou J, Zhang H, Ding X, Ye J, Wu H, Wu Y, Zheng Y, Song X
Received 23 November 2021
Accepted for publication 4 February 2022
Published 2 March 2022 Volume 2022:15 Pages 2361—2376
DOI https://doi.org/10.2147/IJGM.S349379
Checked for plagiarism Yes
Review by Single anonymous peer review
Peer reviewer comments 4
Editor who approved publication: Dr Scott Fraser
Chao Wang,1,2,* Zhihong Chen,1,2,* Xueming Yang,1,3,* Wei Zhang,1 Junbo Zhou,4 Hongchuang Zhang,5 Xu Ding,1,2 Jinhai Ye,1,2 Heming Wu,1,2 Yunong Wu,1,2 Yang Zheng,1,6 Xiaomeng Song1,2
1Jiangsu Key Laboratory of Oral Diseases, Nanjing Medical University, Nanjing, Jiangsu, People’s Republic of China; 2Department of Oral and Maxillofacial Surgery, Affiliated Hospital of Stomatology, Nanjing Medical University, Nanjing, Jiangsu, People’s Republic of China; 3Department of Stomatology, The Affiliated People’s Hospital of Jiangsu University, Zhenjiang, Jiangsu, People’s Republic of China; 4Department of Stomatology, Nanjing Integrated Traditional Chinese and Western Medicine Hospital, Nanjing, Jiangsu, People’s Republic of China; 5Department of Stomatology, Xuzhou No. 1 People’s Hospital, Xuzhou, Jiangsu, People’s Republic of China; 6Department of Oral Maxillofacial & Head and Neck Oncology, Shanghai Ninth People’s Hospital Affiliated to Shanghai Jiao Tong University School of Medicine, National Clinical Research Center for Oral Disease, National Center of Stomatology, Shanghai, People’s Republic of China
*These authors contributed equally to this work
Correspondence: Xiaomeng Song, Jiangsu Key Laboratory of Oral Diseases and Stomatological Institute of Nanjing medical University, No.1, Shanghai Road, Gulou District, Nanjing, Jiangsu, 210029, People’s Republic of China, Tel +86-25-69593100, Email [email protected] Yang Zheng, Department of Oral Maxillofacial & Head and Neck Oncology, Shanghai Ninth People’s Hospital Affiliated to Shanghai Jiao Tong University School of Medicine, National Clinical Research Center of Stomatology, No.639, Zhizaoju Road, 200011, Shanghai, People’s Republic of China, Tel +86-21-23271699, Email [email protected]
Background: Oral squamous cell carcinoma (OSCC) is one of the most prevalent malignancies worldwide. More recently, the administration of immune checkpoint inhibitors has opened up more possibilities for cancer treatment.
Methods: We utilized a weighted gene co-expression network and the single sample gene set enrichment analysis (ssGSEA) algorithm in the TCGA database and identified a module highly correlated with regulatory T cell (Treg) abundance in OSCC. Subsequently, we verified the results by tissue microarrays and utilized immunohistochemical staining (IHC) to test the relationship between the expression level and clinicopathological staging. CCK-8, transwell, and wound healing assays were utilized to detect the functions of OSCC cells.
Results: LCK, IL10RA, and TNFRSF1B were selected as biomarkers related to regulatory T cell infiltration. IHC staining showed significantly increased expression of LCK, IL10RA or TNFRSF1B in OSCC patients, and the expression levels were associated with tumor stage, lymph node metastasis, pathological stage, clinical status and the overall survival. In vitro experiments showed that LCK, IL10RA or TNFRSF1B knockdown efficiently impaired the proliferative, migrative, and invasive capacity in OSCC cell lines.
Conclusion: We performed a series of bioinformatics analyses in OSCC and identified three oncogenic indicators: LCK, IL10RA, TNFRSF1B. These findings uncovered the potential prognostic values of hub genes, thus laying foundations for in-depth research in OSCC.
Keywords: oral squamous cell carcinoma, regulatory T cell, lymphocyte cell-specific protein-tyrosine kinase, LCK, TNF receptor superfamily member 1B, TNFRSF1B, interleukin 10 receptor subunit alpha, IL10RA
Introduction
Head and neck squamous cell carcinoma (HNSCC) is the eighth most prevalent tumors in the world, with more than 350,000 new confirmed cases annually. Oral squamous cell carcinoma (OSCC) is the most prevalent malignant tumor of HNSCC.1–3 In terms of the treatment for various malignant neoplasm, the application of immune checkpoint inhibitors has gradually been implemented in adjuvant therapy.4–6 The immune checkpoint inhibitors, such as pembrolizumab and nivolumab, have been permitted in the treatment of recurrent or metastatic OSCC, and pembrolizumab is considered as a potential method for unresectable disease.7 To date, the next step in immunotherapy can be concentrated to examine the causes for failure of immuno-oncology treatments and the complexity of interactivity between immunocytes and cancer cells.8
Regulatory T cells are a group of immunocytes with immunosuppressive effects and are in balance with effector T cells in the adaptive immune response.9 Infiltration of regulatory T cells may be a cause for failure of immune checkpoint therapy.10 However, few literatures have reported the hub genes related to the mediation of immune response triggered by regulatory T cells in OSCC. Therefore, the identification of biomarkers which are highly correlated with Treg cells infiltration is of great significance considering the breakdown of peripheral tolerance and anti-tumor therapy.11,12
Weighted gene co-expression network analysis (WGCNA) is a commonly used algorithm that explores the highly correlated genes and summarizes these genes into clusters.13 Single-sample gene set enrichment analysis (ssGSEA) is a program that estimates genetic expression and considers as a degree of immune cell infiltration.14
In the current study, we utilized WGCNA and ssGSEA algorithm in the TCGA database and identified a module highly correlated with Treg cell abundance in OSCC. We screened out 12 hub genes whose expression levels were correlated with the degree of Treg cell infiltration. Considering the PPI network and module membership, we selected LCK, IL10RA, and TNFRSF1B as the most promising prognostic biomarkers associated with immunity in OSCC.
The protein expression levels of these three biomarkers (LCK, IL10RA, and TNFRSF1B) were then measured using TMA (tissue microarray analysis). Immunostaining analysis showed that all these three indicators were highly expressed in tumor tissues compared with normal oral mucosa. Additionally, as the tumor stage progressed, we observed an increase in the expression of biomarkers. By performing in vitro experiments, we found that knockdown of LCK, IL10RA or TNFRSF1B significantly attenuated the cell migration, proliferation and invasion. In conclusion, we performed a series of bioinformatics analyses in OSCC and identified three prognostic indicators related to Treg infiltration. These findings discovered the potential prognostic values of hub genes, thus laying foundations for further research in OSCC.
Materials and Methods
Data Collection
The RNA expression data and related clinical information for OSCC were obtained from The Cancer Genome Atlas (TCGA) database (https://portal.gdc.cancer.gov/), containing 504 files and 460 cases. Patients with Oral squamous carcinoma among head and neck squamous carcinoma were selected, and data from patients with nasopharyngeal and laryngeal carcinoma were excluded.
The Fraction of Various Immune Cells in TME
The evaluation of immune cell abundance was done by R package “GSVA”. Single sample gene set enrichment analysis (ssGSEA) was an extended application of GSEA algorithm.14 We used a gene set of 782 genes for predicting the abundance of 28 TIICs in individual tissue samples (http://software.broadinstitute.org/gsea/msigdb/index.jsp), and the expression levels of each gene were z-score normalized across all patients, then ranked in descending order according to their z-scores.
Construction of the Weighted Co-Expression Network
The R package “WGCNA” was used to construct the weighted co-expression network.13 The Pearson correlation coefficients between genes were first calculated and then transformed into a similarity matrix. After picking a suitable soft thresholding power, the similarity matrix was transformed into an adjacency matrix. Then, it strengthened strong correlations and reduced weak correlations between genes to achieve scale-free networks. Finally, the topological overlap matrix was computed to reduce noise and spurious correlations and obtain a new distance matrix. By using dynamic hybrid cutting, genes that might have similar functions would be grouped into a module.
Function Annotation and Gene Set Enrichment Analysis (GSEA)
To find the biological functions of thegenes in the hub modules, Kyoto Encyclopedia of Genes and Genomes (KEGG) and Gene Ontology (GO) enrichment analyses were performed using the clusterProfiler package in R.15 Then, the most significant biological processes and KEGG pathways were visualized with a bar diagram. GSEA was used to assess trends on the distribution of genes ranked by their correlation to the phenotype, and thus to determine their contribution to the phenotype.14 Bounded by the median expression of a gene, the sample can be divided into two high and low groups, and “c7.all.v7.1.entrez” gene set enrichment analysis was carried out.
Oncomine Analysis
Oncomine (https://www.oncomine.org/) was a cancer microarray database and integrated data-mining platform for DNA and RNA sequence analysis.16
PPI Network Construction
The STRING (http://string-db.org/) online website was used to predict the PPI co-expression genes network,17 which was then further mapped by Cytoscape.18 To find core genes in the PPI network, the Cytoscape plugin cytoHubba was used to describe the importance of genes in the PPI network.19
Patients and Tissue Samples
This study was approved by the Ethics Committee of Nanjing Medical University. We obtained informed consent from all patients. Briefly, 276 patient samples were collected from the Stomatological Hospital of Jiangsu Province (In 2014–2019). We collected tissues beyond 3 cm from the negative cut edge of the tumor as normal tissue. Typical areas of tumor or normal tissue were removed in circles about 1 mm in diameter and neatly attached to the slides. A total of 229 tissues were included in this study, including 197 primary OSCC samples and 32 normal oral mucosa (Table 1).20 Patient clinical information included age, gender, tumor size, histological grade (the percentage of undifferentiated cancer cells was used as the basis; less than 25% was grade I, 25–50% was grade II, 50–70% was grade III 75% or more was grade IV), metastatic lymph node, clinical stage (as defined by the American Joint Committee on Cancer 7th edition), and postoperative survival rate (as of December 2019).
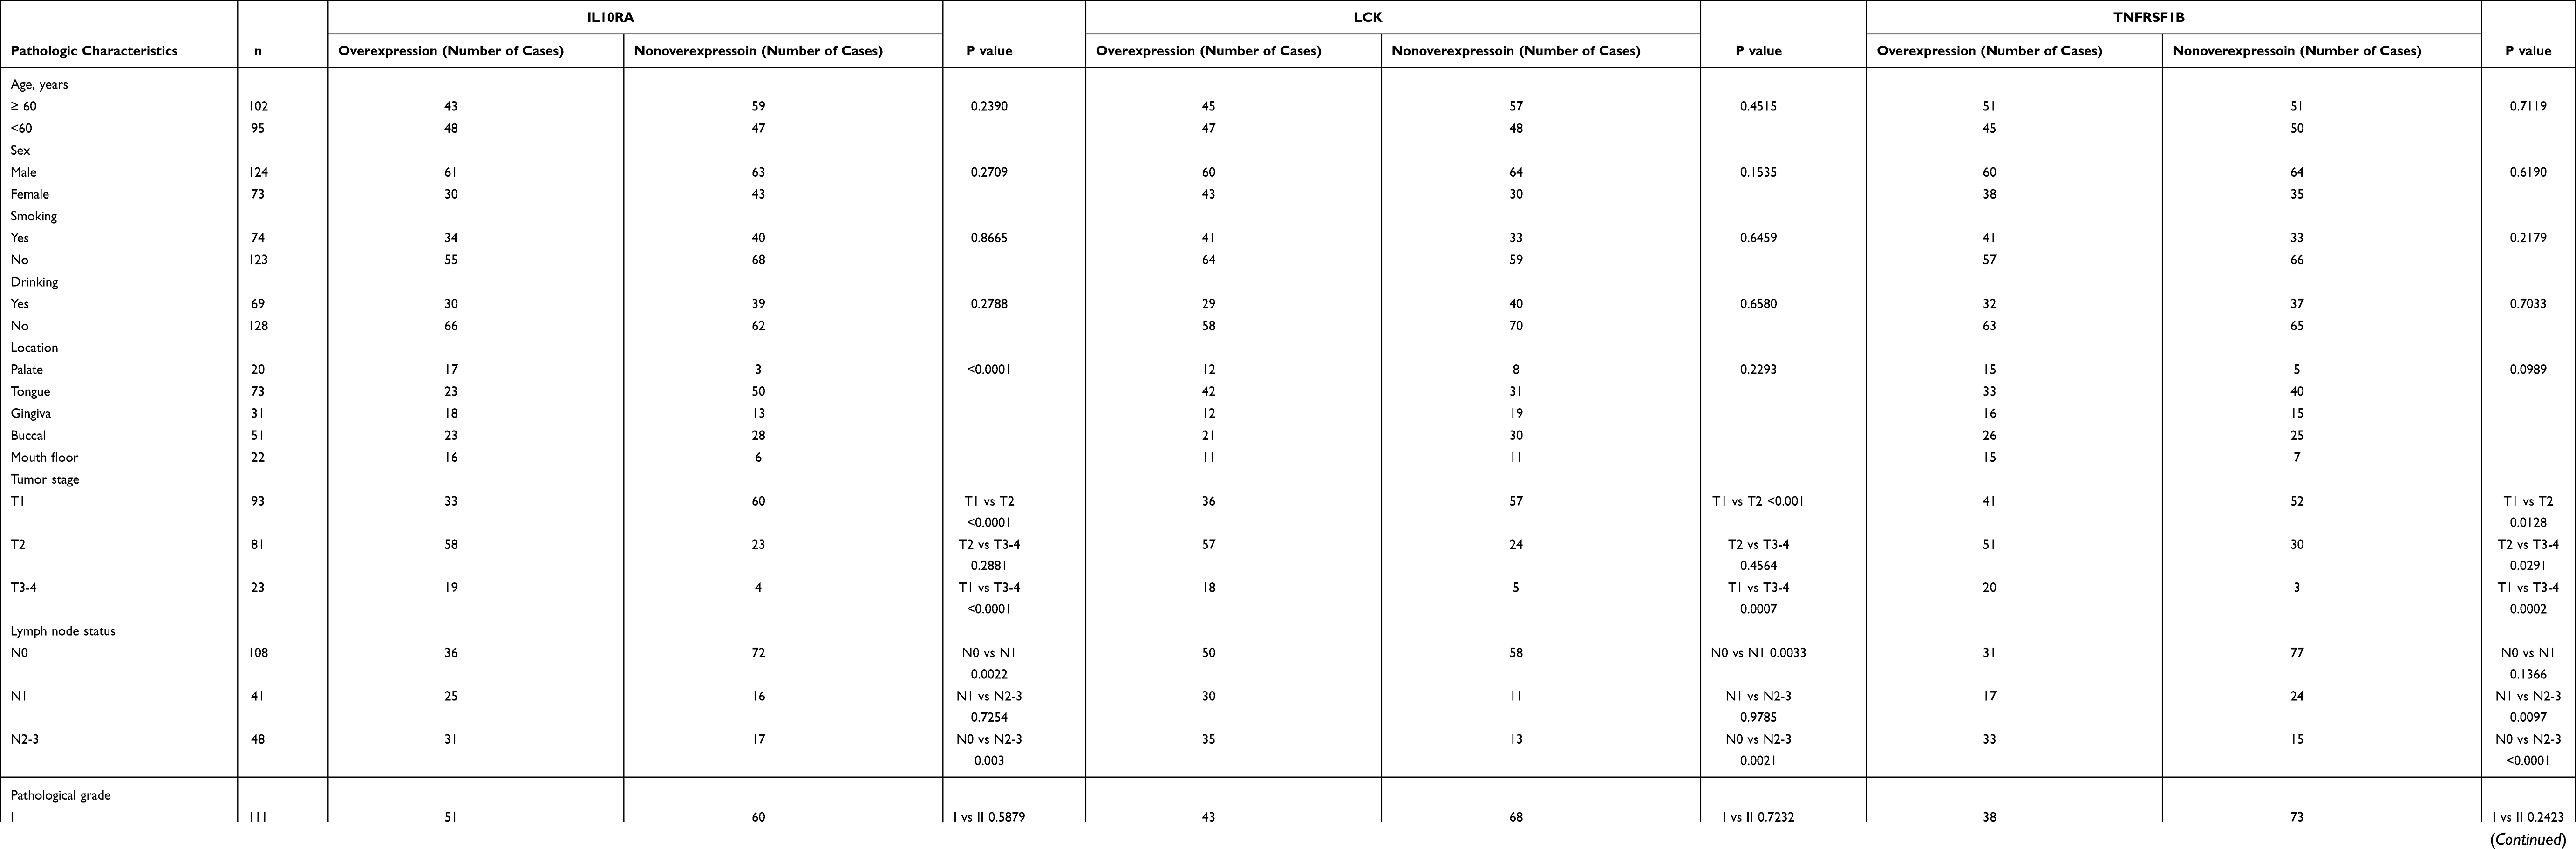 |
Table 1 Correlation Between IL10RA, LCK or TNFRSF1B and Clinicopathologic Characteristics in 197 OSCC Cases |
Immunohistochemistry
Tissue microarray sections were stained with primary antibodies against LCK (1:600, 60162-1, Proteintech), IL10RA (1:100, DF6643, Affinity) and TNFRSF1B (1:200, 19272-1, Proteintech) overnight following secondary antibody incubation for 30 minutes. All of the sections were counterstained using haematoxylin, dehydrated, cleared and mounted before examination using a microscope (DM4000B, Leica, Germany). LCK, IL10RA or TNFRSF1B immunoreactivity in microarray samples was calculated according to staining concentration and proportion semi-quantitatively. The score for the scale of positive cells was demonstrated as follows: 0, negative; 1, <20%; 2, 20–50%; 3, 51–75%; and 4, >75% positive cells. For staining strength, grading system was classified as below: 0, no staining; 1, light yellow; 2, brownish yellow; 3, dark brownish yellow. The result was calculated by multiplying the two scores as mentioned above. Scores for >4 points were regarded as positive.
Cell Culture and Transfection
Two human cell lines (HN4, HN6) were obtained from ATCC. They were cultivated in DMEM + 10% FBS (CellMax cell Technology (Beijing) Co., Ltd SA311.02) in a humidified incubator at 37°C, 5% CO2. Si-LCK, si-TNFRSF1B, si-IL10RA and negative control were obtained from PharmaCore Labs, NanTong, China. Cells were seeded in a 6-well plate and transfected using Lipofectamine 2000 (Invitrogen, Carlsbad, CA, USA) for 48 hr. The transfection efficiency was confirmed by qRT-PCT.
RNA Extraction and Quantitative Reverse Transcription PCR (qRT-PCR)
RNA samples were extracted from cells with TRIzol reagent (Invitrogen) and then reverted to cDNA using 5 × PrimeScript RT Master Mix (TaKaRa) after 15 minutes at 37°C and 5 seconds at 85°C. To determine the relative transcript level, PCR was quantified in real-time using a Q7 Real-Time PCR System. SYBR Green was used as the fluorophore. The RNA levels of GAPDH, LCK, TNFRSF1B and IL10RA were determined with the following primers:
TNFRSF1B-F: 5’- GGATGAAGCCCAGTTAACCA-3’
TNFRSF1B-R: 5’- GCAGAGGCTTTCCACAACTC-3’
IL10RA-F: 5’- TCCTCGGGAAGATTCAGCTA-3’
IL10RA-R: 5’- GTTACTTCGGGAAGCGACAG-3’
LCK-F: 5’- AGTACCAGCCTCAGCCTTGA-3’
LCK-R: 5’- TGCAGAGTCCACGCAACTAC-3’
GAPDH-F: 5’- GAAGGTGAAGGTCGGAGT C-3’
GAPDH-R: 5’- GAGATGGTGATGGGATTTC −3’
Western Blot
When the cells were transfected after 72 hours, the RIPA buffer (P0013B, Beyotime) was used to lysed cells. The proteins were separated on SDS-PAGE and transferred to a PVDF membrane. Membranes were put into 5% milk for blocking. After that, membranes were incubated with primary antibodies 4°C overnight. Membranes were washed by TBST the next day. Then they were incubated with secondary antibodies for 1 h. Primary antibodies used were: LCK (1:1500, 60162-1, Proteintech), IL10RA (1:1000, DF6643, Affinity) and TNFRSF1B (1:700, 19272-1, Proteintech), β-actin (1:5000, 66009-1-lg, Proteintech).
CCK-8 and Cell Colony Formation Assays
Transfected cells were seeded in a 96-well plate (2×10³ cells/well). Optical density at 450 nm was measured by CCK-8 kit (Dojindo, Japan), followed by depicting cell viability curves.
For the cell colony formation experiment, transfected cells were seeded in a medium dish (2×10³ cells/well), and incubated for 2 weeks. Visible colonies were fixed in formaldehyde, dyed in crystal violet and captured under a microscope (DM4000B, Leica, Germany). Colonies were calculated using ImageJ software.
Cell Migration and Invasion Assay
The transfected cells were seeded in 6-well plates and cultured to 100% confluence. Then, cells were scratched by a 200 µL pipette tip and were cultured in a serum-free medium for 24 hr. Wound healing images were collected at 0 and 12 hr.
Tumor cell invasion was examined using the Transwell chambers (8 μm) pre-coated with diluted Matrigel (BD Biosciences). 5×10⁵ cells were seeded in each chamber and were cultured for 24 hr. Then the invading cells were fixed in paraformaldehyde, stained in crystal violet, and three randomly selected cells in each chamber were captured View.
Statistical Analysis
The statistical analysis of the data was done in R (Version 3.6). The Student’s t-test and chi-square test were used to evaluate the relationship between LCK, IL10RA or TNFRSF1B and clinicopathological parameters, respectively. The association between LCK, IL10RA or TNFRSF1B and OSCC overall survival (OS) was estimated using the Log rank test. OS was determined as the outcome variable. Data were presented as the mean ± SD from three independent experiments. GraphPad Prism (ver. 7.0; GraphPad Software, USA) was used for statistical analysis. P < 0.05 was considered to be significant unless stated otherwise.
Results
Construction of Co-Expression Network
The data was downloaded from The Cancer Genome Atlas (TCGA) database (https://portal.gdc.cancer.gov/), including 504 files and 460 cases of OSCC. We removed genes with an average expression <1 (Figure S1). ssGSEA showed the proportion of primary immunocytes in oral cancers and noncancerous tissues (Figure 1A). Then, the fraction of regulatory T cells in each specimen was opted for characters of WGCNA.
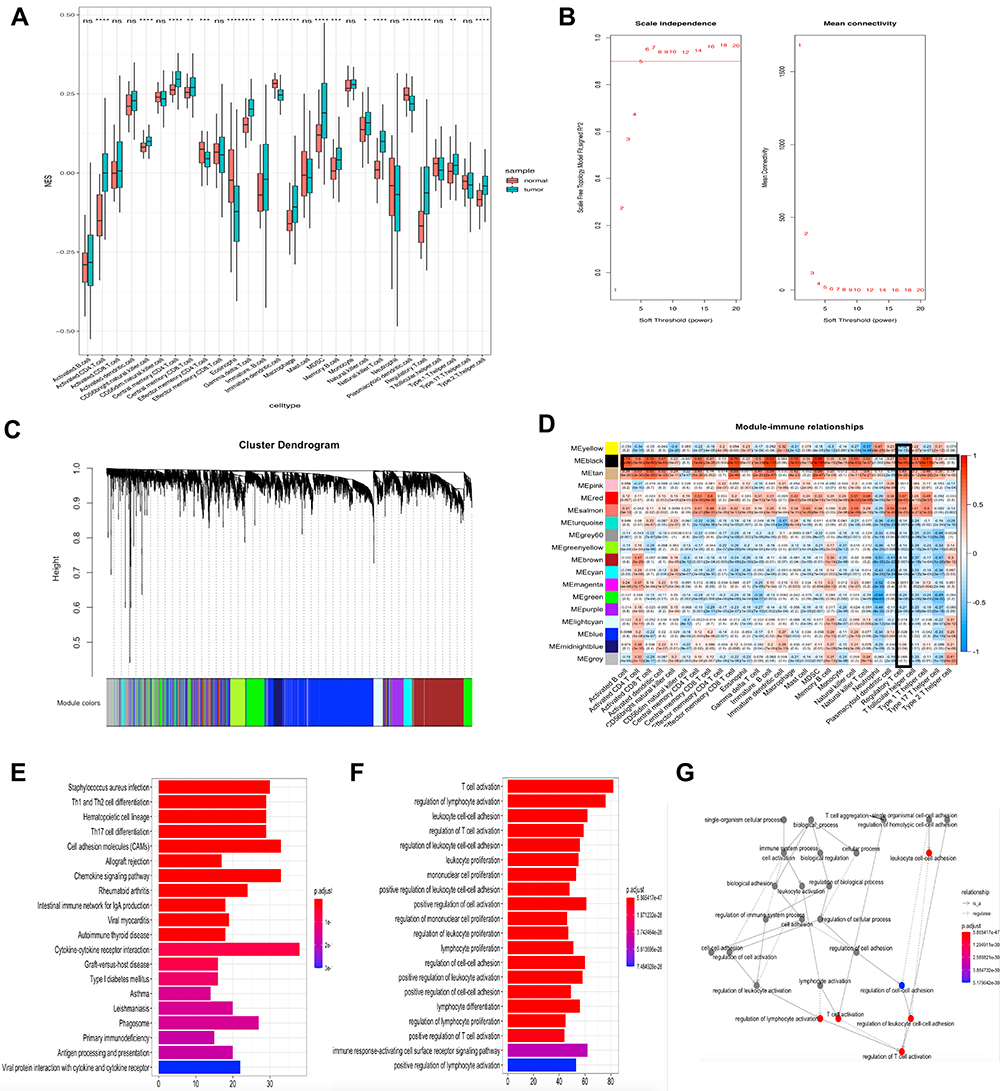 |
Figure 1 Construct the co-expression network and select the immune-related module. (A) Quantification of 28 types of TIICs infiltration in OSCC by ssGSEA. (B) Analyze the average connectivity and the scale-free fit index of 1–20 soft threshold power. A soft thresholding power equaled to 5 was the most appropriate. (C) Genes were clustered into 18 modules, with different colors representing different modules. (D) The heat map showed the correlation between the modules and the 28 immune cells. The black module was highly correlated with immune cells, including a correlation of up to 0.76 with regulatory T cells (p = 5e-95). (E) The 20 KEGG terms with the highest level of enrichment, and the four most highly enriched terms were staphylococcus aureus infection, Th1 and Th2 cell differentiation, hematopoietic cell lineage and Th17 cell differentiation. (F) The 20 GO terms with the highest level of enrichment, and the four most highly enriched terms were T cell activation, regulation of lymphocyte activation, leukocyte cell-cell adhesion, regulation of T cell activation. (G) The network is constructed with each enrichment as a node. *P < 0.05; **P < 0.01; ***P < 0.001; ****P < 0.0001; ns means not significant. |
In this study, we chose β (soft thresholding power) = 5 when the scale-free topology model fit index nearly equaled to 0.9, and the mean connectivity also near 0 (Figure 1B). Then the connectivity and resemblance between genes were computed. And the coefficient of dissimilar genes was inferred. After that, genes were demonstrated through the hierarchical cluster analysis and the dendrogram was gained by dynamic hybrid cutting. According to this algorithm, genes that might have similar functions would be grouped into a module. Eighteen modules were generated (Figure 1C). Of the eighteen modules, the black module was significantly related with the infiltration of cells related to the immune systems. It reached a correlation of 0.76 with regulatory T cells (p = 5e-95), 0.89 with Myeloid-derived suppressor cells (p = 7e-169; Figure 1D). Since we aimed to study the relationship between regulatory T cells and oral squamous cell carcinoma, the black module, which was highly correlated with regulatory T cells, was considered to be the key section. The genes in the black module were used for KEGG and GO enrichment analysis afterwards. The results illustrated that the 20 terms with highest enrichment of KEGG and GO were mostly immune-related. The four most highly enriched KEGG terms were staphylococcus aureus infection, Th1 and Th2 cell differentiation, hematopoietic cell lineage and Th17 cell differentiation. The four most highly enriched GO terms were T cell activation, regulation of lymphocyte activation, leukocyte cell-cell adhesion, regulation of T cell activation. (Figure 1E and F). We also showed the network of inter-regulatory relationships between these GO terms (Figure 1G).
Recognition and Verification of Hub Genes
Those with high connectivity to other genes in the module were considered to be hub genes potentially associated with the degree of regulatory T cell infiltration. We used module membership (MM), gene significance (GS) and High intramodular D within the module (KIM) as indicators for screening. MM >0.7, GS >0.4 and KIM >20 were listed as the conditions for screening candidate hub genes. We established a protein-protein interaction (PPI) network, ranked the genes by degree, and then visualized the network using Cytoscape. The higher the connectivity, the darker the color of the node. LCK, TNFRSF1B were located in the center of the network. (Figure 2A). Combining the two selection criteria, we selected 12 genes (Figure 2B) as hub genes (BTK, CD247, PDCD1, IL10RA, LAIR1, TNFRSF1B, LCK, C3AR1, IL2RB, DOK2, CXCR3, CCR5). To verify the relationship of these 12 genes to regulatory T cells, we calculated the correlation between the gene expression and Tregs abundance. Their correlations were all above 0.4, with the highest being close to 0.8, and the darker the blue the smaller the p-value (Figure 2C). The calculated results demonstrated a significant positive relationship between these 12 genes and the infiltration of regulatory T cells in oral cavity tumors. The calculations showed a positive correlation between hub genes and tumor-infiltrating lymphocytes, with Myeloid-derived suppressor cells and Tregs showing the highest correlation. Scatter plots of the connection between these 12 genes and the degree of Tregs infiltration were demonstrated in OSCC (Figure 2D–O). Next, we calculated the Spearman correlation coefficient between expression of genes that in the Center of modules and tumor-infiltrating lymphocyte abundance. These analyses validated that the identified hub genes were closely correlated with the level of regulatory T cell infiltration (Figure 2P) and played a pivotal role in the immune microenvironment.
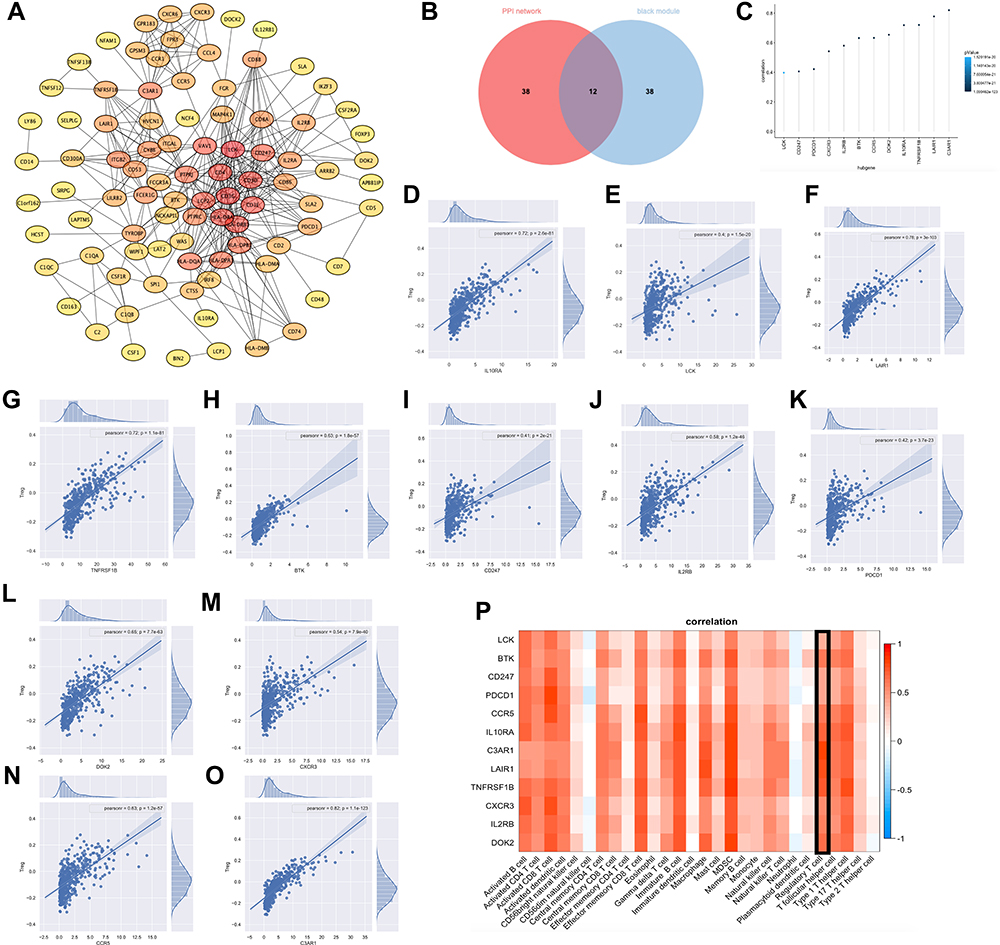 |
Figure 2 Recognition and verification of hub genes. (A) PPI network of genes from the black module. The higher the connectivity, the darker the color of the node. LCK, TNFRSF1B were located in the center of the network. (B) 12 hub genes were selected based on overlap between PPI and co-expression networks, they were BTK, CD247, PDCD1, IL10RA, LAIR1, TNFRSF1B, LCK, C3AR1, IL2RB, DOK2, CXCR3, CCR5. (C) Correlation between expression of hub genes and regulatory T cell abundance. Their correlations were all above 0.4, with the highest being close to 0.8, and the darker the blue the smaller the p-value. (D–O) Regression fit plots of the correlation between the expression of 12 hub genes and Treg abundance. Their Pearson correlation were 0.72 (p = 2.6e-81, IL10RA), 0.4 (p = 1.5e-20, LCK), 0.78 (p = 3e-103, LAIR1), 0.72 (p = 1.1e-81, TNFRSF1B), 0.63 (p = 1.8e-57, BTK), 0.41 (p = 2e-21, CD247), 0.58 (p = 1.2e-46, IL2RB), 0.42 (p = 3.7e-23, PDCD1), 0.65 (p = 7.7e-63, DOK2), 0.54 (p = 7.9e-40, CXCR3), 0.63 (p = 1.2e-57, CCR5), 0.82 (p = 1.1e-123, C3AR1). (P) Heat map of the correlation between Hub genes and the abundance of multiple immune cells. |
Determination of Clinical Characteristics and Identification of Prognostic Biomarkers
We obtained the expressive information about 12 genes from the TCGA database and performed a differential analysis, which manifested that these genes’ expression in neoplastic lesions was enhanced notably than that in noncancerous section (Figure 3A). To verify the association of these 12 genes with clinical characteristics, we analyzed their association with tumor grade in the UALCAN website. The results showed that BTK, CD247, IL2RB, IL10RA, LCK, PDCD1 and TNFRSF1B were remarkably concerned with tumor grade (p < 0.05), and the expression of the genes increased when the tumor grade was increased (Figure 3B). Although the expression of C3AR1, CCR5, CXCR3, DOK2 and LAIR1 did not differ significantly between grades, the expression of these genes showed an overall upward trend with increasing tumor grade (data not shown). Considering that external data should be used to check the differential expression of genes we selected, we used the four analyses in Oncomine for meta-analysis (Figure 3C). TNFRSF1B, LCK and C3AR1 had Median Rank values less than 2000. IL10RA, IL2RB and LAIR1 had Median Rank values less than 3000. The results showed that these genes were significantly overexpressed in the tumor tissue, which was in accordance with what we concluded in the TCGA database. Combining neighborliness in PPI networks and co-expression networks, Oncomine meta-analysis and correlation analysis of tumor grade, we selected a combination of LCK, TNFRSF1B and IL10RA as prognostic biomarkers. LCK, TNFRSF1B, and IL10RA were highly associated with immune cell infiltration and immune checkpoint gene expression in a variety of cancers (Figures S5–S10).
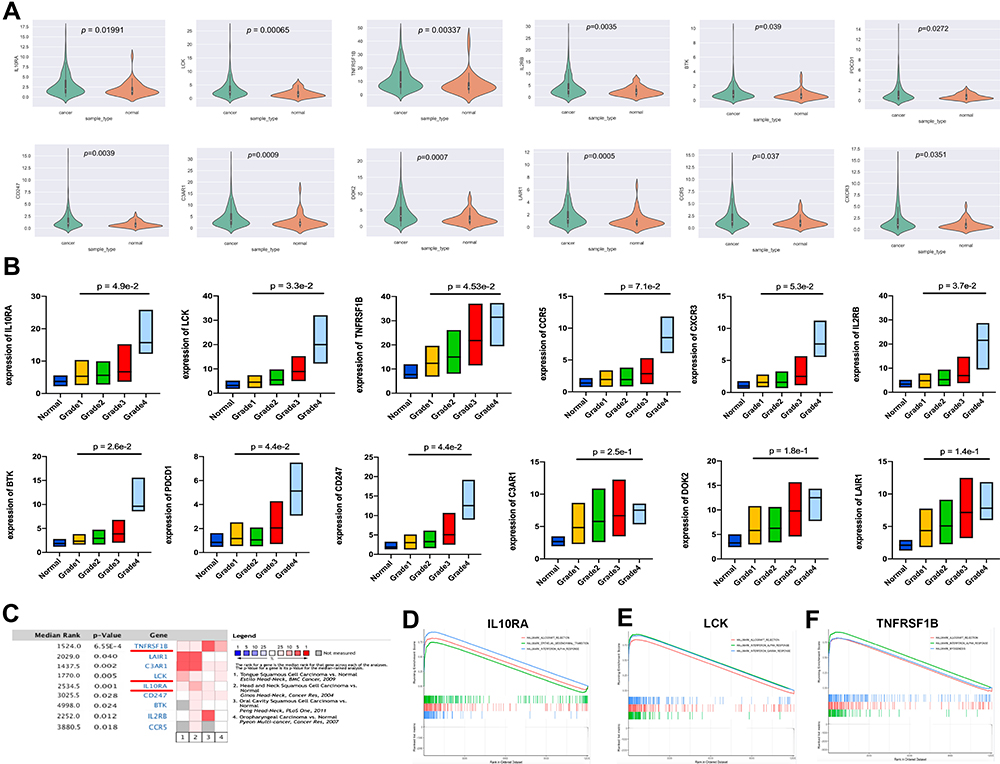 |
Figure 3 Determination of clinical characteristics and identification of prognostic biomarkers. (A) The expression of 12 hub genes in oral squamous carcinoma tissues was significantly higher than their expression in normal tissues. (B) The expression of 12 hub genes in oral squamous carcinoma tissues in relation to pathological grade increased with increasing pathological grade. (C) A meta-analysis that included four data sets showed that these genes were significantly overexpressed in tumor tissue. (D–F) GSEA plots of LCK, IL10RA, TNFRSF1B showed that immune-related pathways were enriched in the high expression group. For LCK, the three most enriched pathways were “Allograft Rejection”, “Interferon-alpha response”, and “Interferon-gamma response”. For IL10RA, the three most enriched pathways were “Allograft Rejection”, “Epithelial-mesenchymal transition”, and “Interferon-alpha response”. For TNFRSF1B, the three most enriched pathways were “Allograft Rejection”, “Interferon-alpha response”, and “Myogenesis”. |
In the light of the median expression of LCK, TNFRSF1B and IL10RA, oral cancer samples from TCGA were divided into high and low expressive groups. Then, we utilized the pathway gene set enrichment analysis to study the two groups we separated. The outcome gave the fact that immune-related pathways were accumulated on the portion in which genes expressed highly (Figure 3D–F).
LCK, TNFRSF1B and IL10RA Was Upregulated in OSCC Patients and Was Associated with Poor Prognosis
The expression levels of LCK, TNFRSF1B, and IL10RA in a variety of cancers are shown in Figures S2–S4. To validate the predictive efficacy of biomarkers, 197 OSCC sections and 32 normal oral mucosa tissues were analyzed by tissue microarrays. Clinicopathological parameters were assessed in an independent cohort (clinical and pathological data are listed in Table 1). Immunohistochemistry (IHC) was demonstrated in Figure 4A. The weak/moderate/strong levels of LCK, TNFRSF1B or IL10RA staining were shown. We found a higher expression of LCK, TNFRSF1B or IL10RA in oral neoplastic lesions compared with the noncancerous section (Figure 4B). Moreover, results showed that either increased LCK, TNFRSF1B or IL10RA expression was correlated with higher tumor grade (Figure 4C), lymph node metastasis (Figure 4D), pathological grade (Figure 4E) as well as clinical stages (Figure 4F). Moreover, as the tumor progressed, the expression of LCK, TNFRSF1B and LCK gradually appeared in the lymphocytes around the tumor cells. On the basis of the median immunohistochemistry score, we then divided the tissues into group of high expression and the opposite part, and performed Kaplan-Meier survival analysis in combination with OS data obtained from follow-up patients. Patients with high expression of LCK, TNFRSF1B or LCK tended to have shorter survival (Figure 4G). When univariate and multivariate cox regressions were performed for the three genes, they were all significant for prognosis independent of other clinical features, suggesting that they are independent prognostic factors (Table 2).
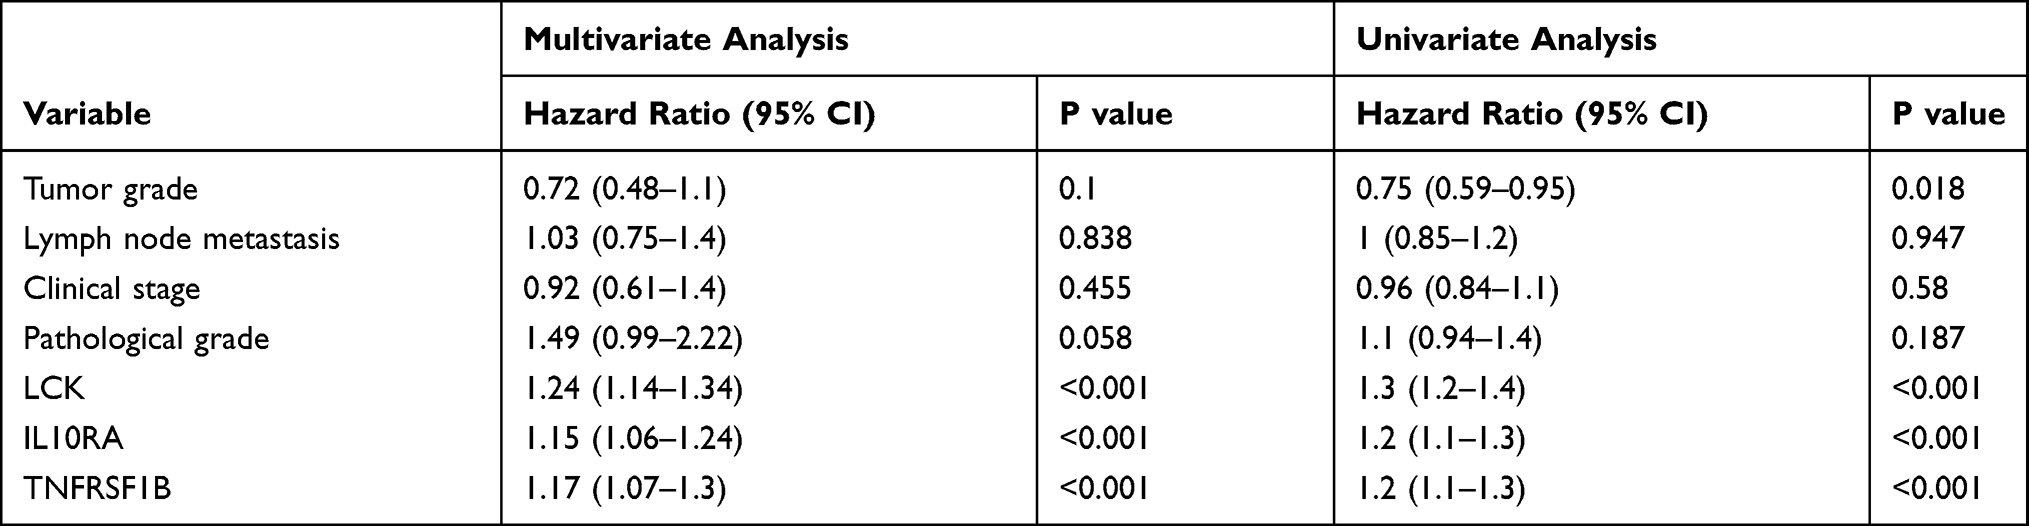 |
Table 2 Multiple and Univariate Cox Regression Analysis of the Effect of LCK, TNFRSF1B and IL10RA on Overall Survival |
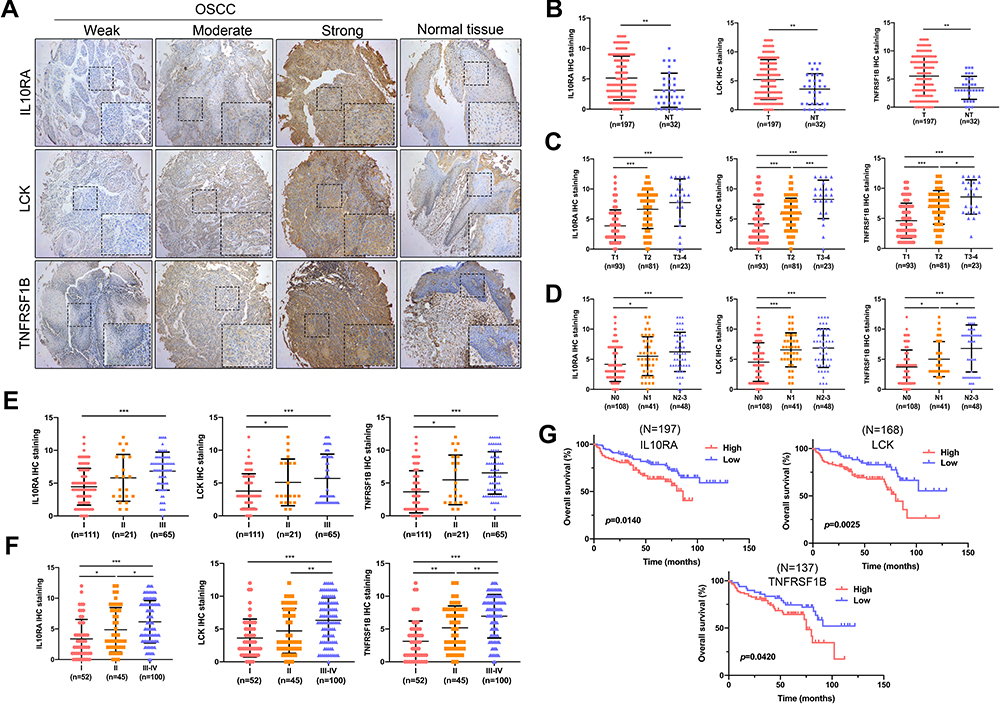 |
Figure 4 LCK, TNFRSF1B and IL10RA was upregulated in OSCC patients and was associated with poor prognosis. (A) Immunohistochemical staining of tissue microarrays. As clinical staging progressed, staining for IL10RA, LCK and TNFRSF1B ranged from normal tissue to weak to moderate to strong. (B) Differential expression of Biomarkers between tumour tissue and normal tissue in tissue microarrays. (C) The expression of biomarkers increased with increasing tumour grade. (D) The expression of biomarkers was positively correlated with lymph node metastasis. (E and F) The expression of biomarkers increased with increasing pathological grade as well as clinical stages. (G) Kaplan-Meier survival analysis showed that patients with high expression of biomarkers have a shortened overall survival (OS) compared with the nonoverexpression of them. *P < 0.05; **P < 0.01; ***P < 0.001. |
Knockdown of IL10RA, LCK or TNFRSF1B Significantly Reduced Cell Proliferation and Invasion
In order to verify the role of LCK, IL10RA or TNFRSF1B in OSCC, we introduced small interfering RNA (RNAi) to suppress the expression of LCK, IL10RA and TNFRSF1B (Figure 5A, Figures S11–S13) in HN4 and HN6 cell lines. Cell Counting Kit-8 (CCK-8) and colony formation assays were performed to detect changes in cell proliferative ability. We discovered that the cell proliferation was diminished after these biomarkers knocking down (Figure 5B and C). Invasive and migrative capacity was also assessed by Transwell and wound healing experiments, respectively. Results showed that the LCK, IL10RA or TNFRSF1B-knockdown group migrated slower compared with the control group (Figure 5D). Silencing of LCK, IL10RA or TNFRSF1B significantly decreased the invasive ability of HN4 and HN6 cell lines (Figure 5E).
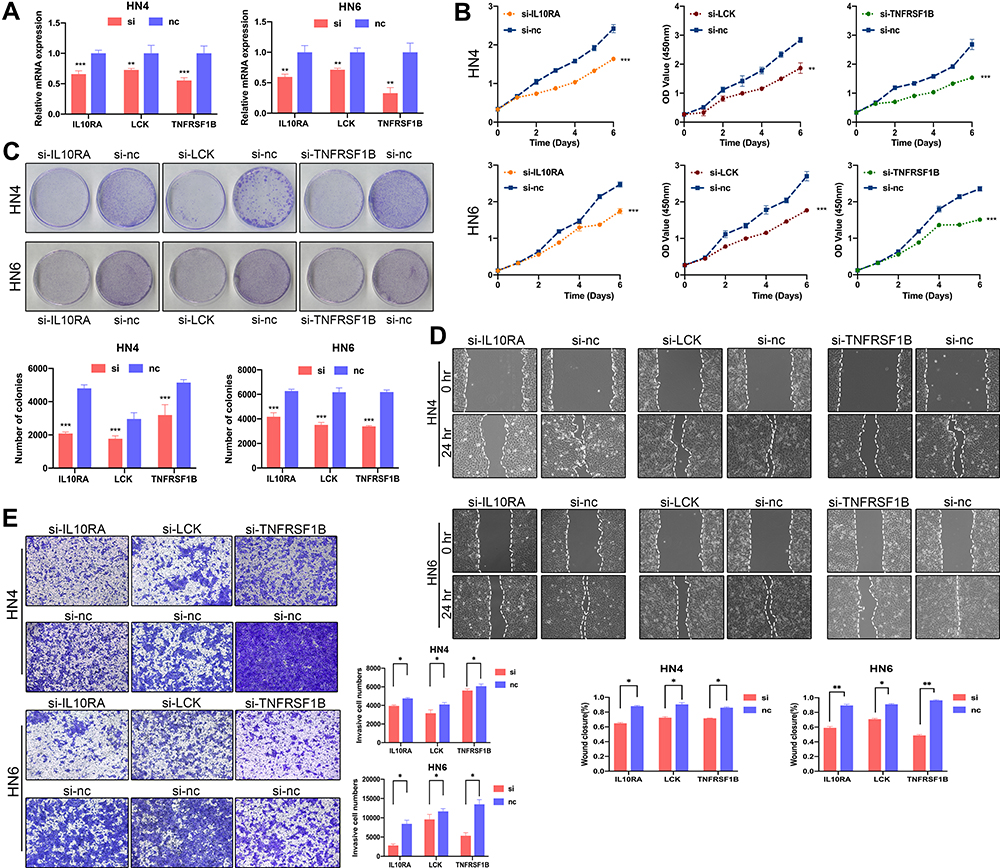 |
Figure 5 Knockdown of IL10RA, LCK, TNFRSF1B significantly reduced cell proliferation and invasion. (A) Relative mRNA expression of biomarkers after transfection with si-LCK, si-TNFRSF1B and si-IL10RA in oral squamous carcinoma cell lines was tested by real time qPCR. (B) CCK8 assays showed decreased proliferation of cells after knockdown of biomarkers. (C) Colony formation assays showed decreased proliferation of cells after knockdown of biomarkers. (D) Colony formation assays showed decreased proliferation of cells after knockdown of biomarkers. (E) Transwell assays showed that the invasive ability of cells was reduced after knocking down biomarkers. *P < 0.05; **P < 0.01; ***P < 0.001. |
Discussion
OSCC has the characteristics of high proliferation ability and poor prognosis.21–23 We used TCGA’s OSCC high-throughput sequencing data to set up a weighted gene co-expression network and quantify the degree about immune cell infiltration, identifying the gene modules most relevant to Treg cells based on their correlation. After considering the PPI network, module membership, we finally selected LCK, IL10RA and TNFRSF1B as the most promising prognostic biomarkers associated with the abundance of regulatory T cells in OSCC.
LCK is a member of the Src kinase family and its expression is associated with poor prognosis.24 It belonged to the Src kinase family and had a hand in signal transduction downstream of many cell surface receptors,24 the phosphorylation of it on T cell receptors was a key step in the establishment and connection of signals in the process of T cell activation.25 Besides, LCK has been covered that it express highly in a great majority of tumors, such as breast cancer,26,27 nasopharyngeal carcinoma28 and glioma.29 In addition to leukemia, some solid tumors have been treated with pan-Src family kinase inhibitors, such as dasatinib and saracatinib, both of which are effective in inhibiting tumor growth.30–34 Furthermore, patients with chronic myeloid leukemia who achieved complete molecular remission with imatinib treatment showed selective depletion of effector regulatory T cells and an increase in CD8+ T cells.35 LCK may further stabilize CD28-LCK as a signaling complex by mediating the phosphorylation of CD28 Tyr(207) and subsequent binding of the Src homology 2 (SH2) structural domain of Lck to this phosphorylated tyrosine.36 In our study, LCK was at the center of a module highly correlated with Treg cell abundance, and the statistical results of tissue microarrays showed a poorer prognosis for patients with high LCK expression. Therefore, we hypothesized that LCK may influence the immune response to OSCC by regulating Treg cells. IL10RA is a high-affinity IL10 receptor,37 which was initially recognized as a inhibiting factor in the function of immune cells.38 It was a part of the IL10R tetramer structure, and it bound IL10 together with IL10RB, mediating downstream signal transduction through JAK1/TYK2 and STAT3, and it is a high-affinity receptor for IL10. In 21% of diffuse large B-cell lymphomas IL10RA was significantly amplified and blockade of IL10RA with IL10RA antibody induced tumor cell death.39 In another case study, upregulation of IL10RA expression in anaplastic large cell lymphoma can bring about tumor progression by reconnecting the STAT3 pathway.40 IL10 has been reported to be a cytokine that suppresses the immune response mainly through IL10R,41 and some Treg subpopulations can directly produce IL10 thereby suppressing the antitumor immune response.42 In contrast to LCK, we hypothesize that Treg cells may inhibit the antitumor effects of other lymphocytes by producing IL10 and thus binding IL10RA. Although depletion of Treg cells with small molecule drugs would greatly benefit tumor therapy, the window period of Treg cells depletion is short and the subsequent autoimmune sequelae are highly detrimental,43 so the possible core downstream of Treg cells: IL10-IL0RA has a more significant significance. TNFRSF1B belonged to the TNF-receptor superfamily, and it is in high abundance in microenvironment of tumor tissues.40 Its expression was often restricted relative to TNFR1, and in mammals its expression was mostly in minor subpopulations of the lymphoid-like system, such as MDSCs,44 but was abundant in the tumor microenvironment. Also, TNFRSF1B was 10-fold more abundant than TNFR1 in Treg in human blood. In a variety of human and murine cancers, the researchers found that Treg cells expressing TNFRSF1B were abundant in the tumor microenvironment.40
In our study, OSCC cells were transfected with si-LCK, si-TNFRSF1B or si-IL10RA. Results showed a decrease in proliferation, migration and invasion ability. Immunohistochemistry also showed higher expression levels of LCK, TNFRSF1B and IL10RA in OSCC tissues compared with non-tumor tissues. Moreover, the expression levels were associated with tumor stage, lymph node metastasis, pathological stage and clinical status. We also observed that patients with high expression of biomarkers had shorter overall survival. We, therefore, infer that LCK, IL10RA, and TNFRSF1B are all important links in regulating or being regulated by Treg cells. However, the present study lacks direct experimental data that can demonstrate the interaction of these three biomarkers with Treg cells, which requires further studies to prove.
Conclusion
Overall, this study first utilized the WGCNA and ssGSEA algorithms to screen for biomarkers that are highly correlated with Treg cells in OSCC. TNFRSF1B, LCK and IL10RA were identified as biomarkers indicative of poor prognosis and possible therapeutic targets for OSCC. Further studies are needed on the specific mechanisms of how these biomarkers regulate Treg cells leading to the development of oral squamous carcinoma.
Declarations
The results here are in part based upon data generated by the TCGA Research Network: https://www.cancer.gov/tcga.
Ethical Approval
This study was reviewed and approved by the Ethics Committee of Affiliated Hospital of Stomatology, Nanjing Medical University (Nanjing, China). All patients signed the informed consent to participate in this study. We obey the principles of the 1983 Declaration of Helsinki. In other words, all of experiments in this paper obey this principle.
Consent to Participate
A signed written informed consent was obtained from each patient.
Consent for Publication
Written informed consent for publication was obtained from each participant.
Author Contributions
CW, ZC and XY analyzed and interpreted the data regarding, WZ, JZ and HZ performed the examination of cell, XD, HW and JY wrote the manuscript, YW, YZ and XS revised the manuscript. All authors made a significant contribution to the work reported, whether that is in the conception, study design, execution, acquisition of data, analysis and interpretation, or in all these areas; took part in drafting, revising or critically reviewing the article; gave final approval of the version to be published; have agreed on the journal to which the article has been submitted; and agree to be accountable for all aspects of the work.
Funding
Our research was funded by the National Natural Science Foundation of China (81402236, 81772887), Jiangsu Provincial Medical Innovation Team (CXTDA2017036), the Priority Academic Program Development of Jiangsu Higher Education Institutions (PAPD, 2018-87), Jiangsu Provincial Medical Youth Talent (QNRC2016854) and Natural Science Foundation of Jiangsu Province of China (BK20171488).
Disclosure
The authors declared that they have no conflicts of interest.
References
1. Pons-Fuster Lopez E, Gomez Garcia F, Lopez Jornet P. Combination of 5-florouracil and polyphenol EGCG exerts suppressive effects on oral cancer cells exposed to radiation. Arch Oral Biol. 2019;101:8–12. doi:10.1016/j.archoralbio.2019.02.018
2. Chow LQM. Head and Neck Cancer. N Engl J Med. 2020;382(1):60–72. doi:10.1056/NEJMra1715715
3. Sung H, Ferlay J, Siegel RL, et al. Global cancer statistics 2020: GLOBOCAN estimates of incidence and mortality worldwide for 36 cancers in 185 countries. CA Cancer J Clin. 2021;71(3):209–249. doi:10.3322/caac.21660
4. Wolchok JD, Chiarion-Sileni V, Gonzalez R, et al. Overall survival with combined nivolumab and ipilimumab in advanced melanoma. N Engl J Med. 2017;377(14):1345–1356. doi:10.1056/NEJMoa1709684
5. Overman MJ, Lonardi S, Wong KYM, et al. Durable clinical benefit with nivolumab plus ipilimumab in DNA mismatch repair-deficient/microsatellite instability-high metastatic colorectal cancer. J Clin Oncol. 2018;36(8):773–779. doi:10.1200/JCO.2017.76.9901
6. Garon EB, Rizvi NA, Hui R, et al.; Investigators, K.-. Pembrolizumab for the treatment of non-small-cell lung cancer. N Engl J Med. 2015;372(21):2018–2028. doi:10.1056/NEJMoa1501824
7. Johnson DE, Burtness B, Leemans CR, Lui VWY, Bauman JE, Grandis JR. Head and neck squamous cell carcinoma. Nat Rev Dis Primers. 2020;6(1):92. doi:10.1038/s41572-020-00224-3
8. Kubli SP, Berger T, Araujo DV, Siu LL, Mak TW. Beyond immune checkpoint blockade: emerging immunological strategies. Nat Rev Drug Discov. 2021;20(12):899–919.
9. Sakaguchi S, Yamaguchi T, Nomura T, Ono M. Regulatory T cells and immune tolerance. Cell. 2008;133(5):775–787. doi:10.1016/j.cell.2008.05.009
10. Kujan O, Agag M, Smaga M, et al. PD-1/PD-L1, Treg-related proteins, and tumour-infiltrating lymphocytes are associated with the development of oral squamous cell carcinoma. Pathology. 2021. doi:10.1016/j.pathol.2021.09.013
11. Tanaka A, Sakaguchi S. Regulatory T cells in cancer immunotherapy. Cell Res. 2017;27(1):109–118. doi:10.1038/cr.2016.151
12. Tanaka A, Sakaguchi S. Targeting Treg cells in cancer immunotherapy. Eur J Immunol. 2019;49(8):1140–1146. doi:10.1002/eji.201847659
13. Langfelder P, Horvath S. WGCNA: an R package for weighted correlation network analysis. BMC Bioinform. 2008;9(1):559. doi:10.1186/1471-2105-9-559
14. Subramanian A, Tamayo P, Mootha VK, et al. Gene set enrichment analysis: a knowledge-based approach for interpreting genome-wide expression profiles. Proc Natl Acad Sci U S A. 2005;102(43):15545–15550. doi:10.1073/pnas.0506580102
15. Yu G, Wang LG, Han Y, He QY. clusterProfiler: an R package for comparing biological themes among gene clusters. OMICS. 2012;16(5):284–287. doi:10.1089/omi.2011.0118
16. Rhodes DR, Yu J, Shanker K, et al. ONCOMINE: a cancer microarray database and integrated data-mining platform. Neoplasia. 2004;6(1):1–6. doi:10.1016/S1476-5586(04)80047-2
17. Szklarczyk D, Gable AL, Lyon D, et al. STRING v11: protein-protein association networks with increased coverage, supporting functional discovery in genome-wide experimental datasets. Nucleic Acids Res. 2019;47(D1):D607–D613. doi:10.1093/nar/gky1131
18. Shannon P, Markiel A, Ozier O, et al. Cytoscape: a software environment for integrated models of biomolecular interaction networks. Genome Res. 2003;13(11):2498–2504. doi:10.1101/gr.1239303
19. Chin CH, Chen SH, Wu HH, Ho CW, Ko MT, Lin CY. cytoHubba: identifying hub objects and sub-networks from complex interactome. BMC Syst Biol. 2014;8(Suppl 4):S11. doi:10.1186/1752-0509-8-S4-S11
20. Zheng Y, Wang C, Song A, et al. CMTM6 promotes cell proliferation and invasion in oral squamous cell carcinoma by interacting with NRP1. Am J Cancer Res. 2020;10(6):1691–1709.
21. Siegel RL, Miller KD, Jemal A. Cancer statistics, 2019. CA Cancer J Clin. 2019;69(1):7–34. doi:10.3322/caac.21551
22. Siegel RL, Miller KD, Jemal A. Cancer statistics, 2020. CA Cancer J Clin. 2020;70(1):7–30. doi:10.3322/caac.21590
23. Gupta B, Johnson NW, Kumar N. Global epidemiology of head and neck cancers: a continuing challenge. Oncology. 2016;91(1):13–23. doi:10.1159/000446117
24. Parsons SJ, Parsons JT. Src family kinases, key regulators of signal transduction. Oncogene. 2004;23(48):7906–7909. doi:10.1038/sj.onc.1208160
25. Rossy J, Owen DM, Williamson DJ, Yang Z, Gaus K. Conformational states of the kinase Lck regulate clustering in early T cell signaling. Nat Immunol. 2013;14(1):82–89. doi:10.1038/ni.2488
26. Santpere G, Alcaraz-Sanabria A, Corrales-Sanchez V, Pandiella A, Gyorffy B, Ocana A. Transcriptome evolution from breast epithelial cells to basal-like tumors. Oncotarget. 2018;9(1):453–463. doi:10.18632/oncotarget.23065
27. Chakraborty G, Rangaswami H, Jain S, Kundu GC. Hypoxia regulates cross-talk between Syk and Lck leading to breast cancer progression and angiogenesis. J Biol Chem. 2006;281(16):11322–11331. doi:10.1074/jbc.M512546200
28. Liew K, Yu GQS, Wei Pua LJ, et al. Parallel genome-wide RNAi screens identify lymphocyte-specific protein tyrosine kinase (LCK) as a targetable vulnerability of cell proliferation and chemoresistance in nasopharyngeal carcinoma. Cancer Lett. 2021;504:81–90. doi:10.1016/j.canlet.2021.02.006
29. Zepecki JP, Snyder KM, Moreno MM, et al. Regulation of human glioma cell migration, tumor growth, and stemness gene expression using a Lck targeted inhibitor. Oncogene. 2019;38(10):1734–1750. doi:10.1038/s41388-018-0546-z
30. Arcaroli JJ, Touban BM, Tan AC, et al. Gene array and fluorescence in situ hybridization biomarkers of activity of saracatinib (AZD0530), a Src inhibitor, in a preclinical model of colorectal cancer. Clin Cancer Res. 2010;16(16):4165–4177. doi:10.1158/1078-0432.CCR-10-0066
31. Chan CM, Jing X, Pike LA, et al. Targeted inhibition of Src kinase with dasatinib blocks thyroid cancer growth and metastasis. Clin Cancer Res. 2012;18(13):3580–3591. doi:10.1158/1078-0432.CCR-11-3359
32. Levitt JM, Yamashita H, Jian W, Lerner SP, Sonpavde G. Dasatinib is preclinically active against Src-overexpressing human transitional cell carcinoma of the urothelium with activated Src signaling. Mol Cancer Ther. 2010;9(5):1128–1135. doi:10.1158/1535-7163.MCT-10-0096
33. Trevino JG, Summy JM, Lesslie DP, et al. Inhibition of SRC expression and activity inhibits tumor progression and metastasis of human pancreatic adenocarcinoma cells in an orthotopic nude mouse model. Am J Pathol. 2006;168(3):962–972. doi:10.2353/ajpath.2006.050570
34. Zhang S, Huang WC, Zhang L, et al. SRC family kinases as novel therapeutic targets to treat breast cancer brain metastases. Cancer Res. 2013;73(18):5764–5774. doi:10.1158/0008-5472.CAN-12-1803
35. Tanaka A, Nishikawa H, Noguchi S, et al. Tyrosine kinase inhibitor imatinib augments tumor immunity by depleting effector regulatory T cells. J Exp Med. 2020;217(2). doi:10.1084/jem.20191009
36. Dobbins J, Gagnon E, Godec J, et al. Binding of the cytoplasmic domain of CD28 to the plasma membrane inhibits Lck recruitment and signaling. Sci Signal. 2016;9(438):ra75. doi:10.1126/scisignal.aaf0626
37. Moore KW, de Waal Malefyt R, Coffman RL, O’Garra A. Interleukin-10 and the interleukin-10 receptor. Annu Rev Immunol. 2001;19:683–765. doi:10.1146/annurev.immunol.19.1.683
38. Prokoph N, Probst NA, Lee LC, et al. IL10RA modulates crizotinib sensitivity in NPM1-ALK+ anaplastic large cell lymphoma. Blood. 2020;136(14):1657–1669. doi:10.1182/blood.2019003793
39. Beguelin W, Sawh S, Chambwe N, et al. IL10 receptor is a novel therapeutic target in DLBCLs. Leukemia. 2015;29(8):1684–1694. doi:10.1038/leu.2015.57
40. Chen X, Subleski JJ, Hamano R, Howard OM, Wiltrout RH, Oppenheim JJ. Co-expression of TNFR2 and CD25 identifies more of the functional CD4+FOXP3+ regulatory T cells in human peripheral blood. Eur J Immunol. 2010;40(4):1099–1106. doi:10.1002/eji.200940022
41. Yoon SI, Logsdon NJ, Sheikh F, Donnelly RP, Walter MR. Conformational changes mediate interleukin-10 receptor 2 (IL-10R2) binding to IL-10 and assembly of the signaling complex. J Biol Chem. 2006;281(46):35088–35096. doi:10.1074/jbc.M606791200
42. Sawant DV, Yano H, Chikina M, et al. Adaptive plasticity of IL-10(+) and IL-35(+) Treg cells cooperatively promotes tumor T cell exhaustion. Nat Immunol. 2019;20(6):724–735. doi:10.1038/s41590-019-0346-9
43. Shimizu J, Yamazaki S, Sakaguchi S. Induction of tumor immunity by removing CD25+CD4+ T cells: a common basis between tumor immunity and autoimmunity. J Immunol. 1999;163(10):5211–5218.
44. Polz J, Remke A, Weber S, et al. Myeloid suppressor cells require membrane TNFR2 expression for suppressive activity. Immun Inflamm Dis. 2014;2(2):121–130. doi:10.1002/iid3.19
 © 2022 The Author(s). This work is published and licensed by Dove Medical Press Limited. The full terms of this license are available at https://www.dovepress.com/terms.php and incorporate the Creative Commons Attribution - Non Commercial (unported, v3.0) License.
By accessing the work you hereby accept the Terms. Non-commercial uses of the work are permitted without any further permission from Dove Medical Press Limited, provided the work is properly attributed. For permission for commercial use of this work, please see paragraphs 4.2 and 5 of our Terms.
© 2022 The Author(s). This work is published and licensed by Dove Medical Press Limited. The full terms of this license are available at https://www.dovepress.com/terms.php and incorporate the Creative Commons Attribution - Non Commercial (unported, v3.0) License.
By accessing the work you hereby accept the Terms. Non-commercial uses of the work are permitted without any further permission from Dove Medical Press Limited, provided the work is properly attributed. For permission for commercial use of this work, please see paragraphs 4.2 and 5 of our Terms.