")
Back to Journals » International Journal of General Medicine » Volume 14
Identification of Autophagy-Related Genes in the Progression from Non-Alcoholic Fatty Liver to Non-Alcoholic Steatohepatitis
Received 3 May 2021
Accepted for publication 18 June 2021
Published 5 July 2021 Volume 2021:14 Pages 3163—3176
DOI https://doi.org/10.2147/IJGM.S317785
Checked for plagiarism Yes
Review by Single anonymous peer review
Peer reviewer comments 2
Editor who approved publication: Dr Scott Fraser
Mengyao Ma, Wenhua Xie, Xi Li
Department of Laboratory Medicine, Biology Science Institutes, Chongqing Medical University, Chongqing, 400032, People’s Republic of China
Correspondence: Xi Li
Institute of Life Sciences, Chongqing Medical University, Chongqing, 400032, People’s Republic of China
Tel +8613764350606
Email [email protected]
Background: Non-alcoholic fatty liver disease (NAFLD) is the most common cause of chronic liver disease worldwide. Autophagy plays a vital role in NAFLD development and progression. We aimed to establish a novel autophagy-related gene (ARG) signature as a therapeutic target in NAFLD patients based on high-throughput sequencing data.
Methods: ARGs obtained from the HAMdb and high-sequencing data obtained from the Gene Expression Omnibus (GEO) database were analyzed to identify differentially expressed ARGs (DEARGs) between normal and NASH tissues. Then, gene ontology (GO) and Kyoto Encyclopedia of Genes and Genomes (KEGG) analysis were performed to explore potential biological and pathological functions of DEARGs. The protein–protein interaction (PPI) network of the DEARGs was established through the STRING website, and visualized by Cytoscape. In addition, hub genes were validated by an independent dataset GSE89632. Finally, we performed Gene Set Variation Analysis (GSVA) pathway-related analysis to identify the pivotal signaling pathways and genes for the progression of non-alcoholic fatty liver (NAFL) to non-alcoholic steatohepatitis (NASH).
Results: A total of 76 DEARGs were identified in the GSE126848 dataset, of which 45 genes were upregulated and 31 genes were downregulated. GO analysis showed that the biological functions of DEARGs focused primarily on autophagy, cellular response to external stimulus, fibroblast proliferation, late endosome, and ubiquitin protein ligase binding. KEGG pathway analysis showed that these DEARGs were mainly involved in the apoptosis, PI3K-Akt signaling pathway, and estrogen signaling pathway. Among DEGs, 9 most closely related genes were identified from the PPI network. Furthermore, NOS3, IGF1, VAMP8, FOS, and HMOX1 were verified in the GSE89632 dataset. At last, the MAPK signal pathway was identified as important pathway, and JUN was identified as a key gene involved in the progression from NAFL to NASH.
Conclusion: This study may provide credible molecular biomarkers in terms of screening and diagnosis for NAFLD. Meanwhile, it also serves as a basis for exploring the molecular mechanisms underlying the progression of NAFL to NASH.
Keywords: GEO data, autophagy, NAFLD, hub gene
Introduction
NAFLD is a progressive disease characterized by excess fat deposition in the liver due to reasons other than chronic alcohol abuse and specific factor of liver damage. With the global trend of obesity and its related metabolic syndrome, NAFLD has become an important cause of chronic liver disease in wealthy areas. Over 30% of people with NAFLD may have NASH, about 10% to 29% of which may progress to cirrhosis, and finally, 4% to 27% of cirrhosis patients induced by NASH may progress to hepatocellular carcinoma (HCC).1 In addition, NAFLD also affects the progression of other chronic liver diseases and is involved in the pathogenesis of diabetes and atherosclerosis, which seriously affects the quality of life and life expectancy of patients. Therefore, NAFLD remains one of the greatest challenges facing the medical domain today.
The diagnosis of NAFLD mainly depends on liver biopsy, imaging, and fibrosis scoring system. Though fatty liver is defined as over 5% steatosis, steatosis can be accurately detected by ultrasound or computed tomography when it accounts for > 20% of liver mass.2 Magnetic resonance imaging can detect 5% steatosis but it is relatively expensive.2 Although liver biopsy is considered the gold standard for the diagnosis of NAFLD, it is invasive and manipulation-dependent. In recent years, compared with liver biopsy, non-invasive imaging diagnostic methods have been proved to have better diagnostic accuracy, but it has brought a lot of economic pressure to patients. In addition, several scoring systems have been proposed for the assessment of fibrosis or cirrhosis of NAFLD based on demographic and blood tests, but these still do not improve poor prognosis in NAFLD. Therefore, there is an urgent need to find new biomarkers.
For the liver, in recent years, there has been strong evidence that autophagy plays an important role in maintaining liver homeostasis and inhibiting the occurrence of primary tumors.3–5 Autophagy including three primary types of autophagy: microautophagy, macroautophagy, and chaperone-mediated autophagy (CMA), is a cellular degradation and recycling process, highly conserved in all eukaryotes.6 Autophagy is a procession in which a cell engulfs its cytoplasmic protein or organelle and wraps it into a vesicle, fuses with the lysosome to form autolysosome, and degrades its encapsulated content, in order to achieve the metabolic needs of the cell itself and the renewal of some organelle. Studies have shown that it can degrade and remove lipid droplets from cells by lipid phagocytosis. It is reported that lipophagy participates in selective degradation of cytoplasmic LDs7 to improve NAFLD and lipotoxic effects such as insulin resistance and oxidative stress caused by excessive triglycerides and free fatty acids in NAFLD suppress autophagy activity,8–10 while the use of drugs to enhance autophagy can reduce hepatic steatosis and facilitate the degradation of Mallory-Denk bodies.10–14 Existing studies generally believe that autophagy in hepatocytes is regarded as a defense mechanism to prevent NAFLD. However, the role of ARGs in NAFLD is poorly understood.
In this study, based on high-throughput sequencing data, we identified a total of nine hub genes for NAFLD, namely NOS3, JUN, IGF1, KDR, VAMP8, FOS, CYBB, HSP90AA1, and HMOX1, of which, NOS3, IGF1, KDR, FOS, CYBB, and HMOX1 might be more prevalent. Furthermore, the MAPK signaling pathway was found to play an important role in the progression from NAFL to NASH, and the hub gene, JUN, which was involved in this signaling pathway, could also effectively differentiate between NAFL and NASH. Our study provided theoretical guidance for future studies of new autophagy-related biomarkers in NAFLD.
Materials and Methods
Data Acquisition
A total of 796 ARGs were obtained from the HAMdb (http://hamdb.scbdd.com/). We obtained the RNA sequencing (RNA-seq) data (GSE126848 and GSE89632) of NAFLD through the GEO database (http://www.ncbi.nlm.nih.gov/). The GSE126848 dataset contained 14 normal, 12 obese individuals, 15 NAFLDs, and 16 NASH liver biopsy samples. The GSE89632 dataset contained 24 healthy controls, 20 simple steatosis (NAFL), and 19 NASH liver biopsies samples. In this study, the GSE126848 dataset was mainly utilized for differential gene expression analysis, GSVA, and receiver operating characteristic (ROC) curves; the GSE89632 dataset was only employed to validate the expression patterns of the selected hub genes.
Identification of DEARGs
The DEGs were determined between normal and NAFLD tissues in the GSE126848 dataset by using the “limma” R package. The |log2 fold change (FC)| > 1 and false discovery rate (FDR) < 0.05 were regarded as the cut-off criteria to determine DEGs. DEARGs were identified by taking the intersection of DEGs and ARGs. The results of DEARGs were drawn into a heatmap and box plot.
GO and KEGG Analysis
The “clusterProfiler” R package was used to conduct GO and KEGG pathway enrichment analysis of the above-mentioned DEGs, and P < 0.05 was defined as the threshold value. GO database annotates gene products from the aspects of molecular functions (MF), biological processes (BP), and cellular components (CC) of biology. The potential functions of the DEARGs involved in signaling pathways were analyzed using the KEGG.
Construction of the PPI Network
STRING database (www.string-db.org) collected and integrated known and predicted protein–protein association data for a large number of organisms, including Homo sapien.15 In the present study, STRING was used to construct the PPI network of DEARGs with a minimum required interaction score of 0.7. Cytoscape software V3.7.1 was used to display the PPI network. The top ten nodes were calculated and ranked by the maximal clique centrality (MCC) method and were analyzed using Cytoscape software.16
GSVA Analysis
GSVA is a non-parametric unsupervised method that transforms the genes of the sample matrix into predefined gene sets without a priori knowledge of experiment design.17 In the present study, we used the R package “GSVA” to calculate the scores for each patient (NAFL and NASH samples in the GES126848) based on previously defined gene sets of KEGG pathways. Subsequently, the R package limma was used to build linear models for comparing GSVA scores between NAFL and NASH patients we defined pathways with a P < 0.05.
Statistical Analysis
All statistical analyses in this study were performed using the R version. The differences between different groups were compared by the Mann–Whitney-Wilcoxon test. And the correlation among variables was evaluated by Pearson’s chi-square test. The P-value < 0.05 was considered statistically significant.
Results
Identification of DEARGs Between Normal and NAFLD Tissues
The expression level of DEGs was compared between normal and NAFLD tissues in the GSE126848 dataset. 1957 DEGs were identified, of which 1240 were upregulated and 717 were downregulated. The DEGs were shown in the volcano plot (Figure 1A). A total of 76 DEARGs were identified by taking the intersection of 1957 DEGs and 796 ARGs, including 45 up-regulated and 31 down-regulated genes (Figure 1B) (Table 1). A heatmap and a box plot showed the expression levels of these DEARGs (Figure 1C and D).
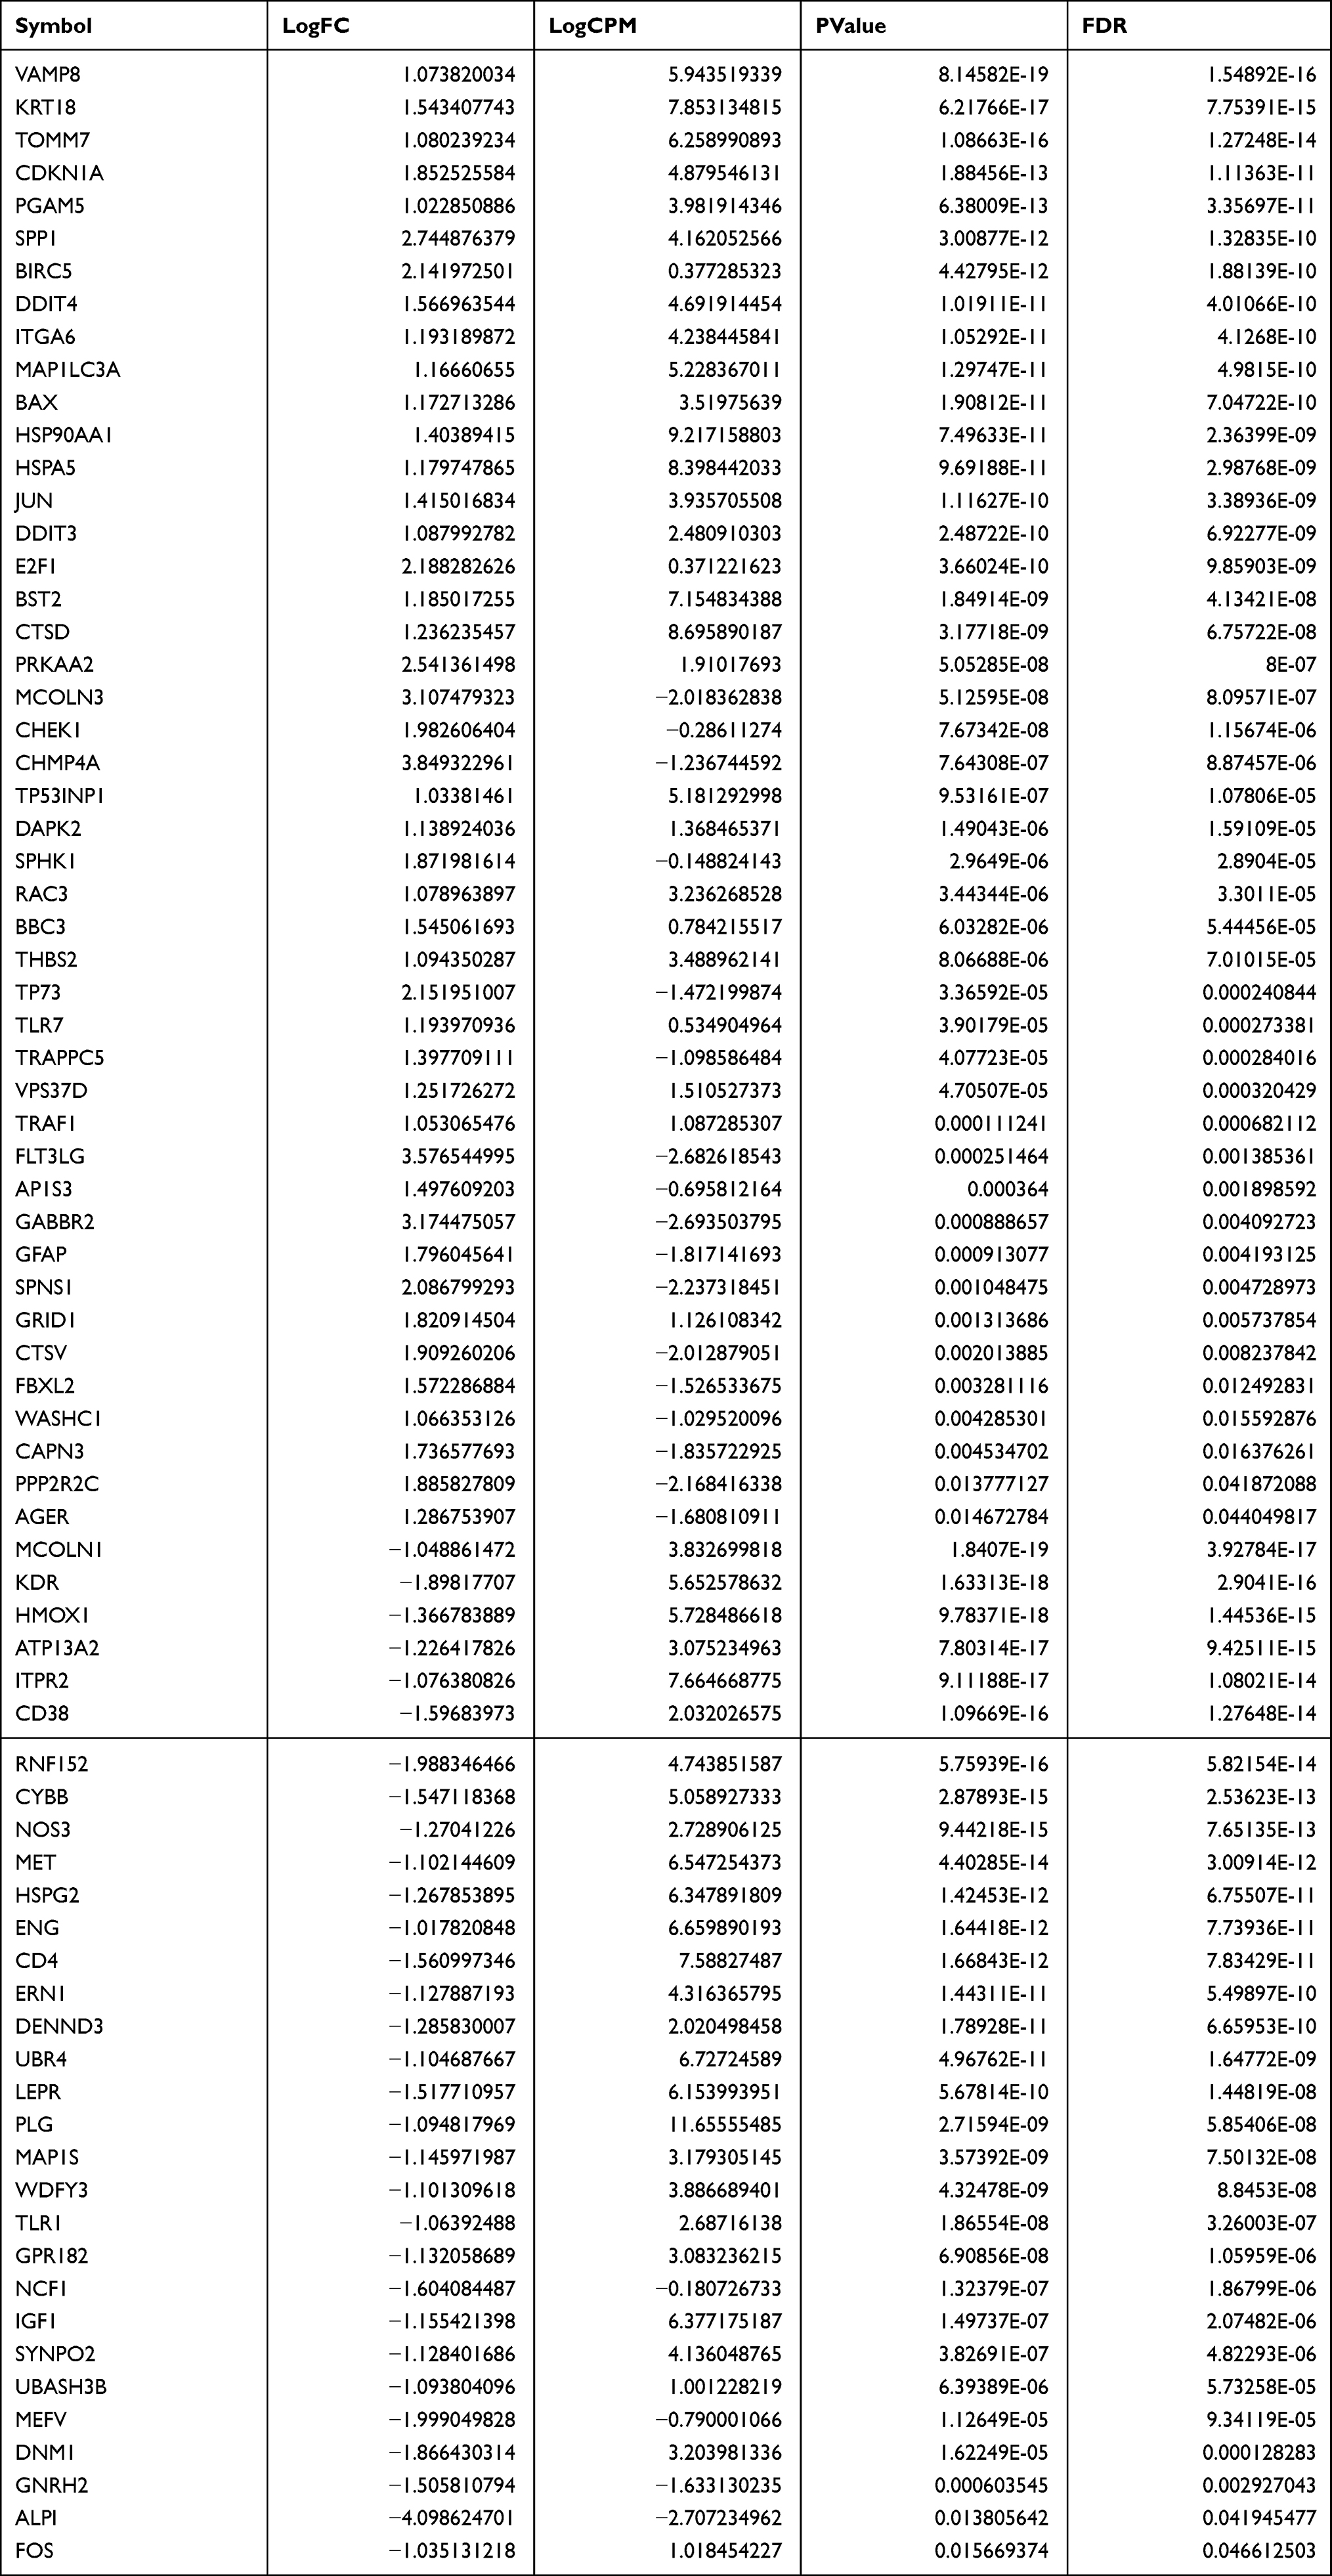 |
Table 1 Differential Expression of 76 DEARGs Identified by Taking the Intersection of 1957 DEGs and 796 ARGs |
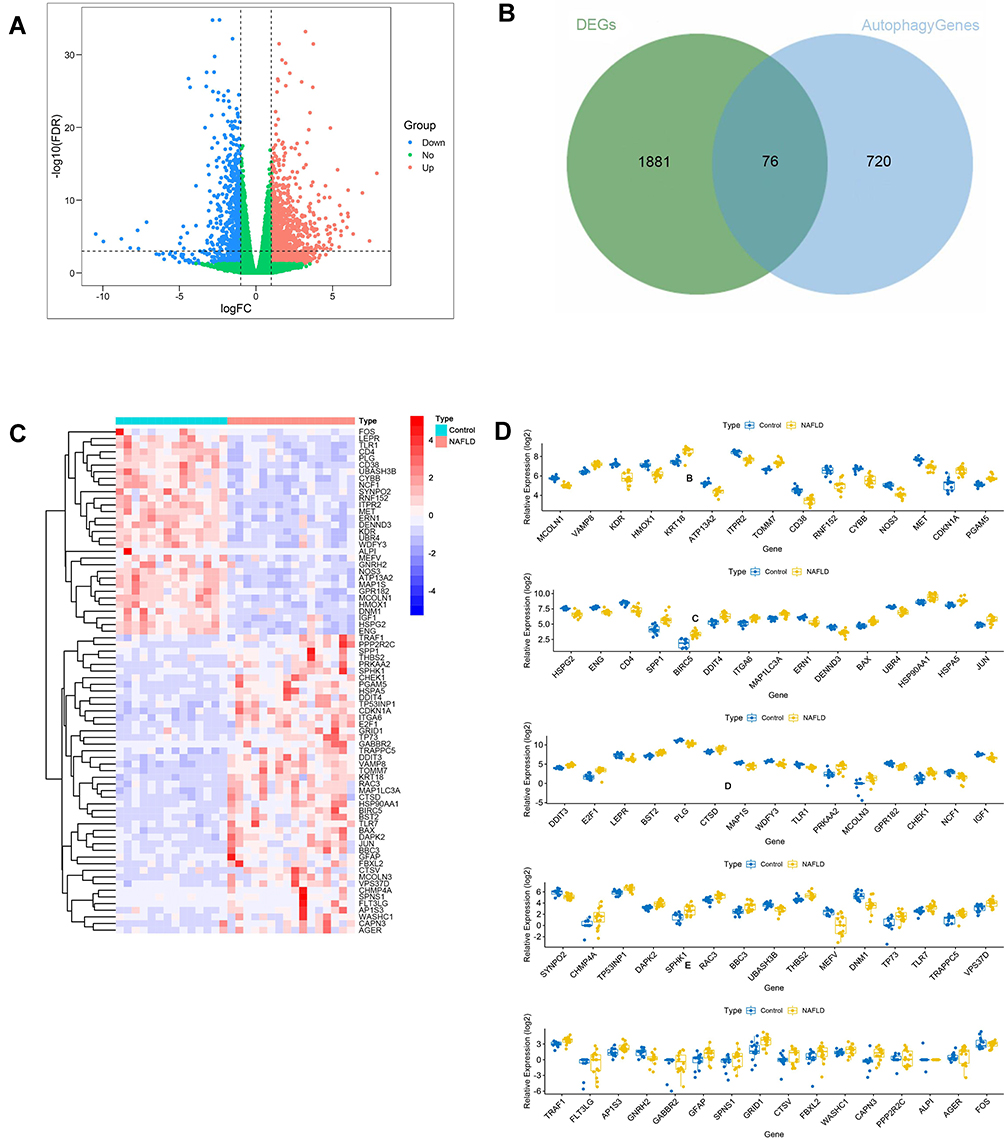 |
Figure 1 Identification of DEARGs. (A) Differential expression analysis of 1957 DEGs. (B) Identified 76 DEARGs. (C) Heatmap for the differential expression of 76 DEARGs between NAFLDs and normal. (D) Box plot of the differential expression of 76 DEARGs between NAFLDs and normal. |
Functional Enrichment of the DEARGs
We performed GO and KEGG pathway enrichment analyses to determine the potential functions of these DEARGs in the development of NAFLD. The BP analysis indicated that in the NAFLD, these genes were associated with the autophagy, process utilizing autophagic, as well as with the Regulation of autophagy (Figure 2A). In terms of the CCs, these genes were involved in the autophagosome, late endosome, and vacuolar membrane (Figure 2B). With regard to MF, these genes participated in certain key functions, such as ubiquitin protein ligase binding, calcium-release channel activity, and scaffold protein binding (Figure 2C) (Table 2).
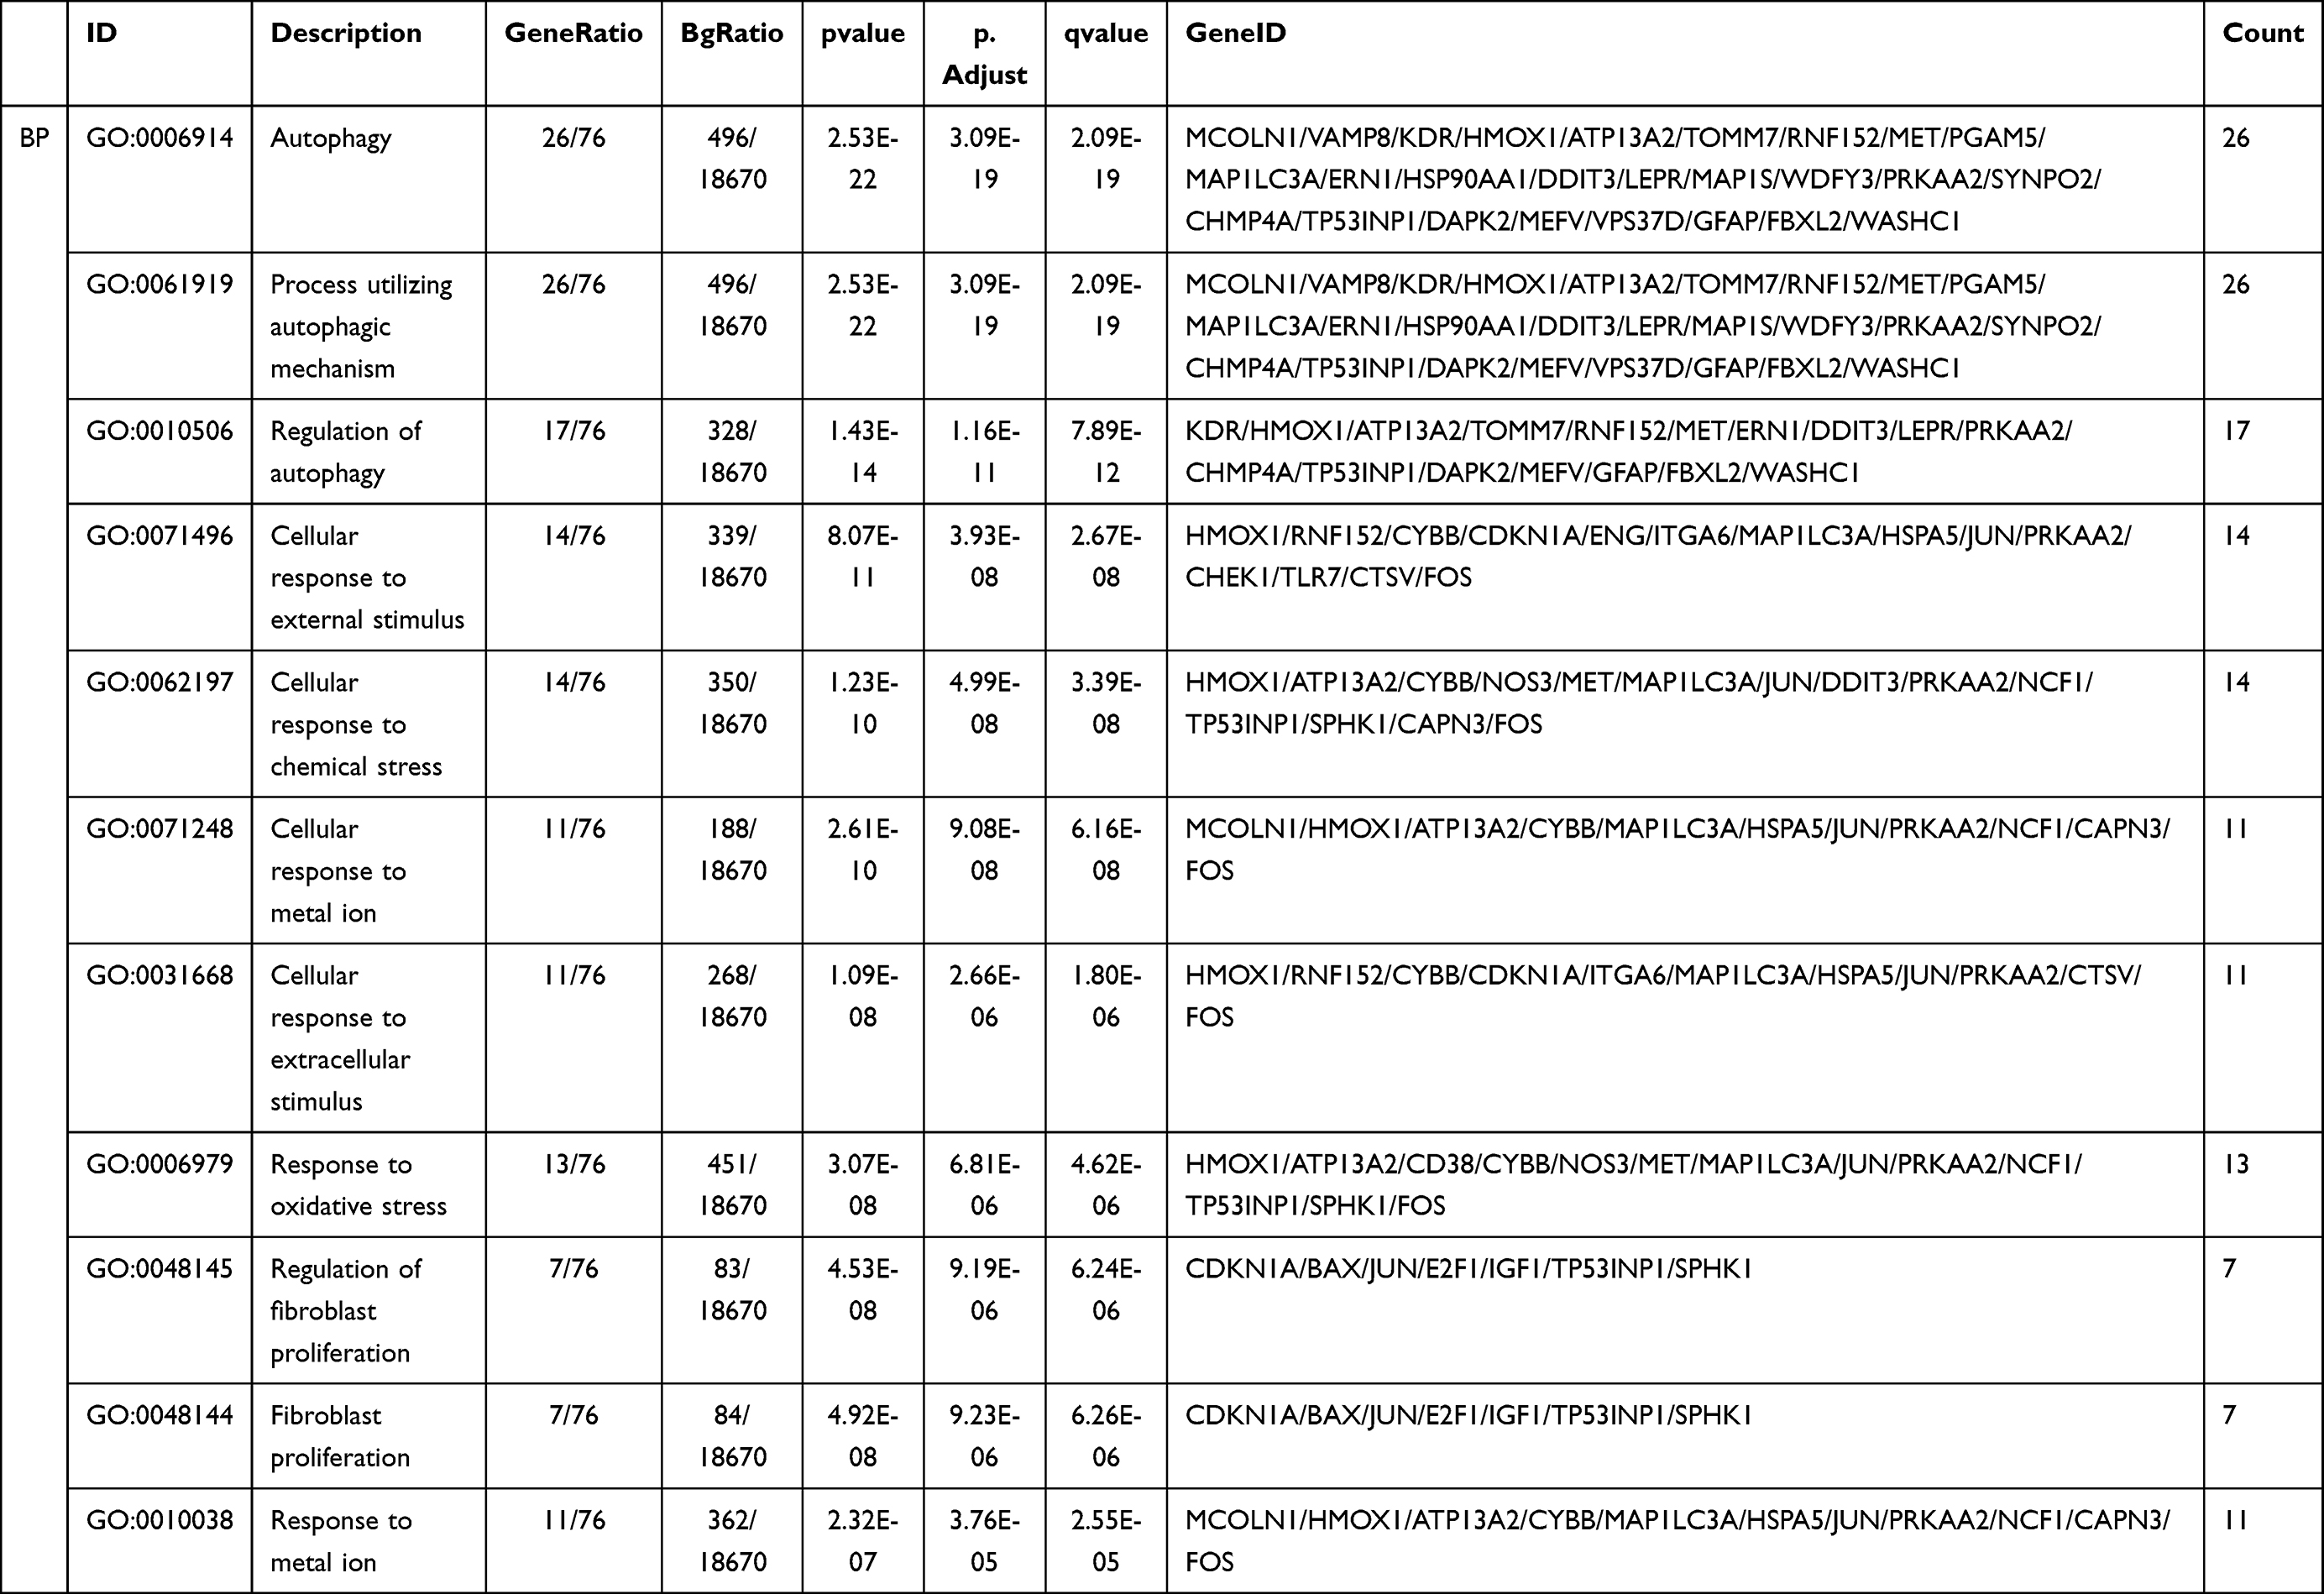 |
Table 2 The GO Enrichment Analysis (BP, MF, CC) |
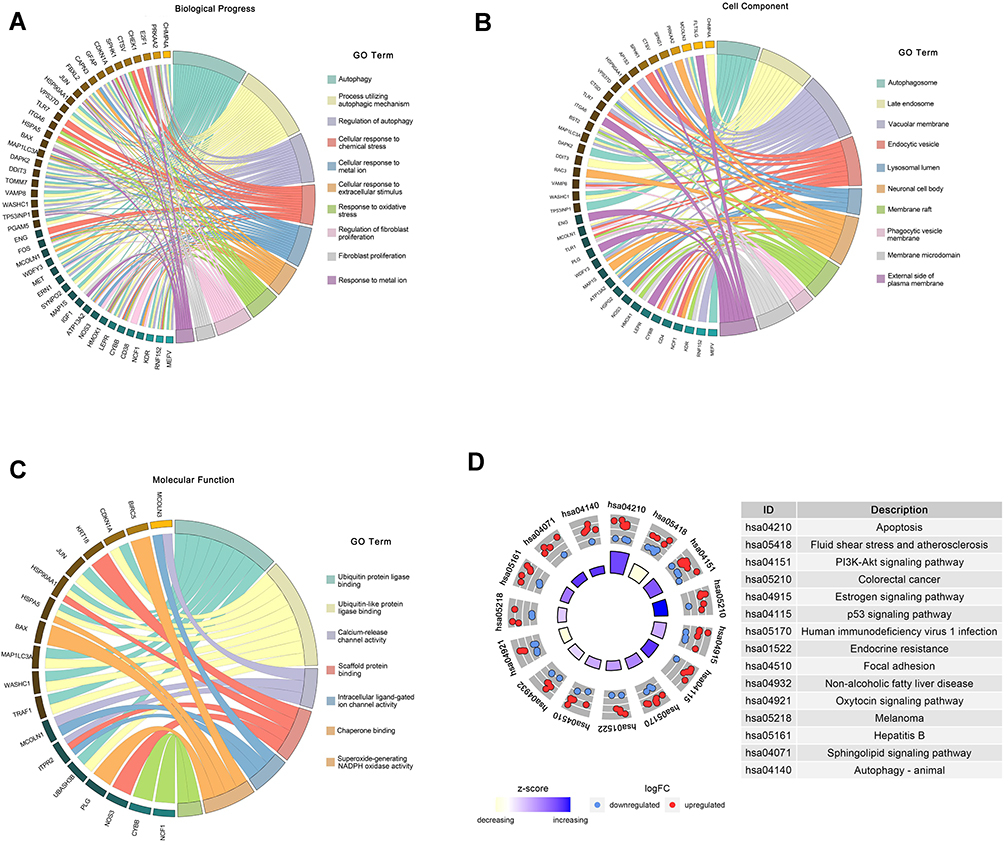 |
Figure 2 Functional enrichment of the DEARGs. (A) BP enrichment analysis of 76 DEARGs. (B) CC enrichment analysis of 76 DEARGs. (C) MF enrichment analysis of 76 DEARGs. (D) KEGG pathway enrichment analysis of 76 DEARGs. |
The DEARGs were mainly enriched some signaling pathways associated with the apoptosis, PI3K-Akt signaling pathway, and estrogen signaling pathway. In addition, the KEGG pathway enrichment analysis indicated that these genes were associated with Apoptosis, PI3K-Akt signaling pathway, Non-alcoholic fatty liver disease, and Autophagy-animal. (Figure 2D) (Table 3).
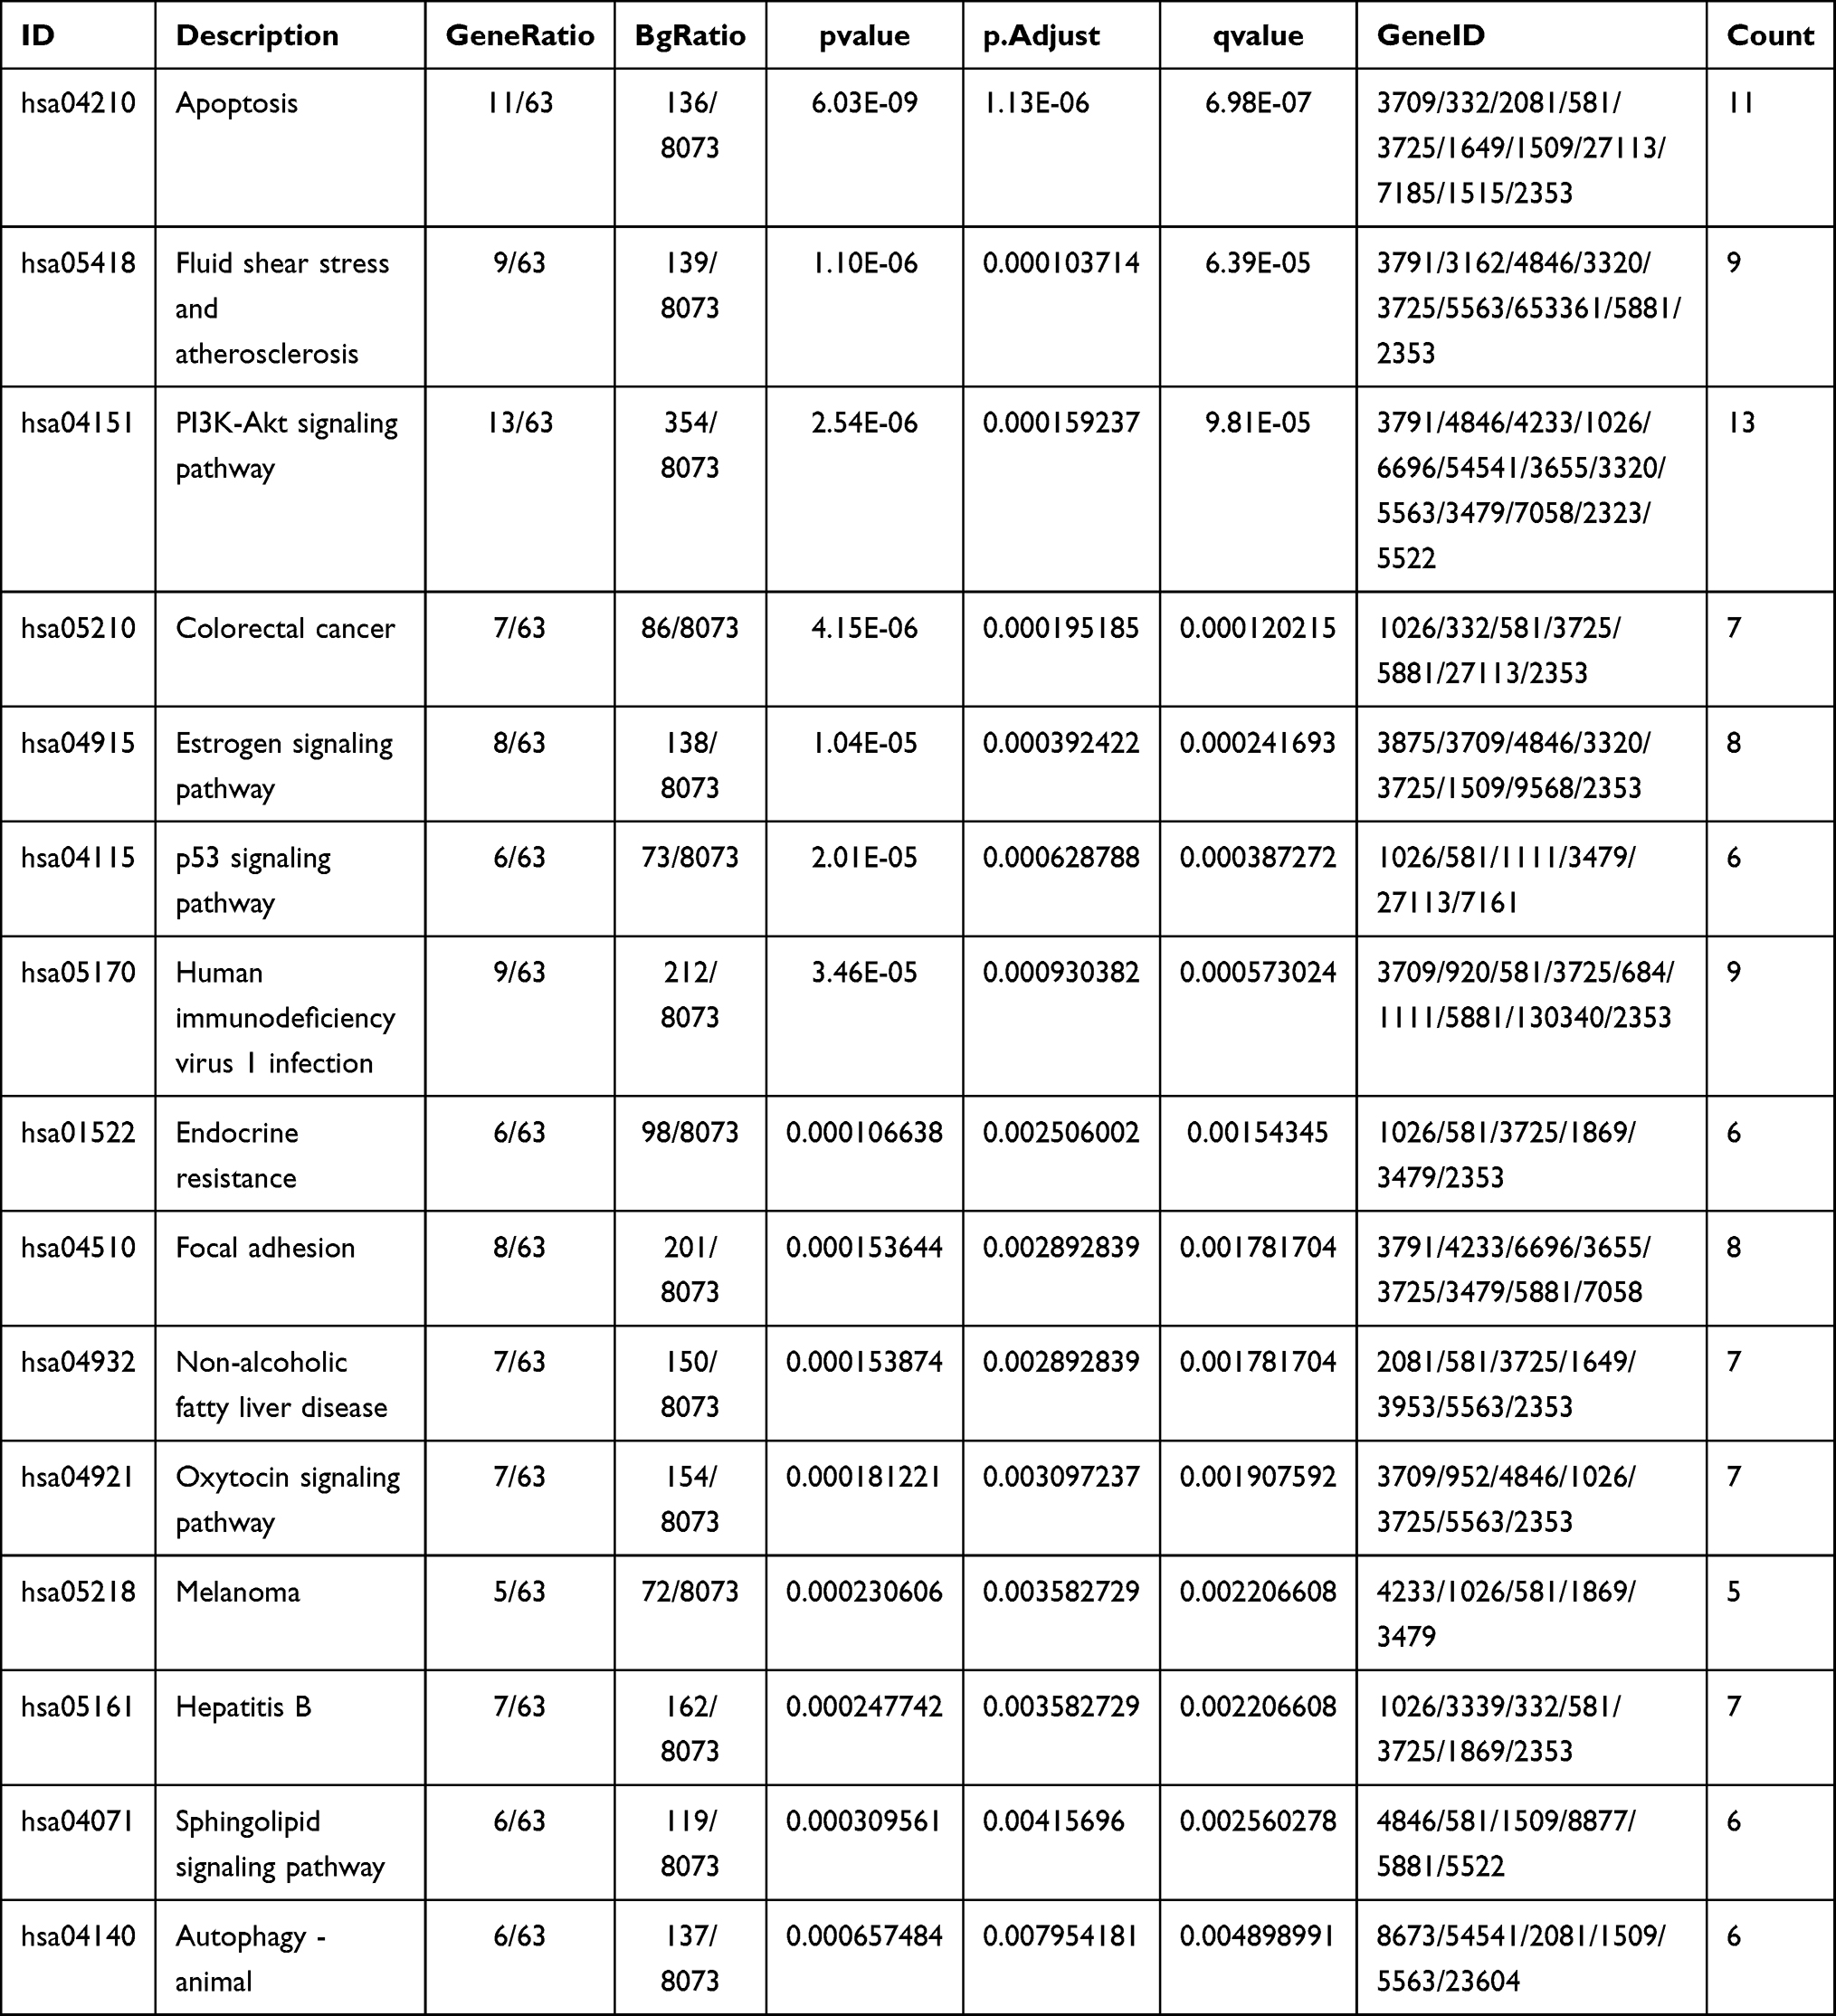 |
Table 3 The KEGG Pathway Enrichment Analysis |
Identification and Verification of Hub Genes
The PPI network of DEARGs was constructed, including 40 nodes (genes) and 59 edges (interactions) (Figure 3A; Supplementary Table 1). The 9 top hub genes were selected, which were ranked by the MCC method using Cytoscape software, including NOS3, JUN, IGF1, KDR, VAMP8, FOS, CYBB, HSP90AA1, and HMOX1 (Figure 3B). The expression distribution of the hub genes was shown in the Volcano plot (Figure 3C). Among these DEGs, the up-regulated genes were JUN, VAMP8, and HSP90AA1, while the down-regulated genes were NOS3, IGF1, KDR, FOS, CYBB, and HMOX1.
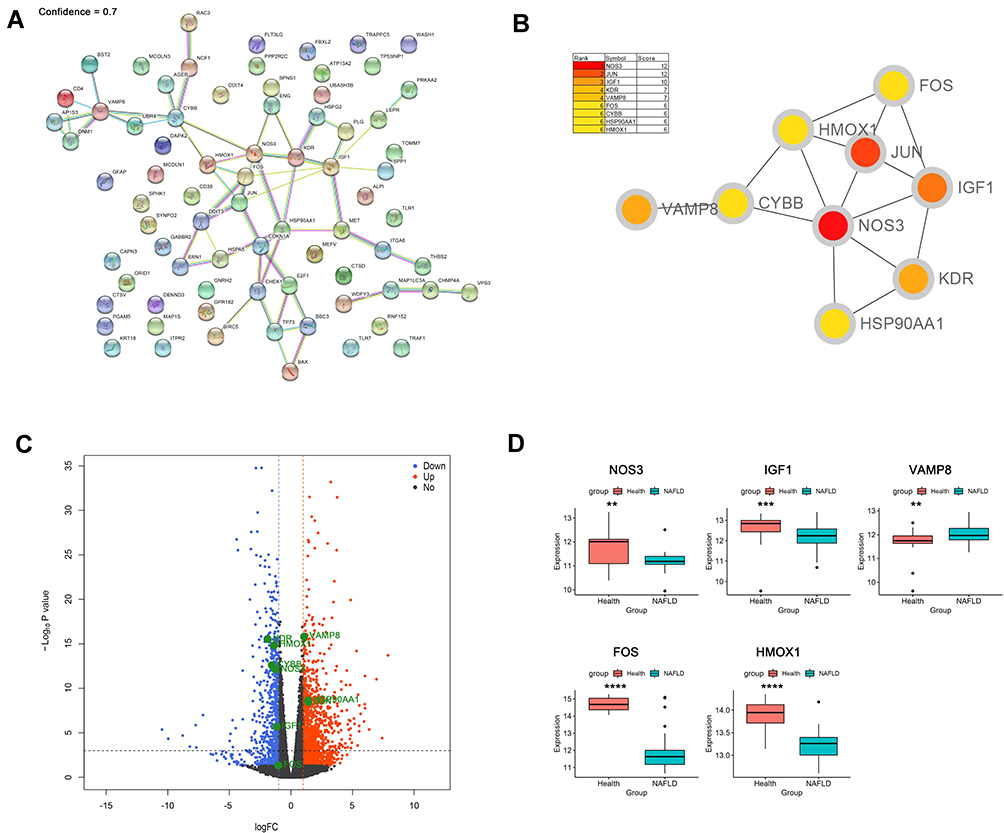 |
Figure 3 Identification and verification of hub genes. (A) PPI network analysis of 76 DEARGs (minimum required interaction score 0.7). (B) Identification of hub genes. (C) Volcano plot of the distribution of hub genes expression. (D) Validation of identified gene expression between NAFLDs and normals. (**P<0.01, ***P<0.001, ****P<0.0001). |
To further verify the differential expression of the critical hub genes in NASH, we evaluated the expression profiles of 9 hub genes in the GSE89632 dataset. Consistent with our results, 5 out of 9 hub genes were found to share similar differential expression, including NOS3, IGF1, VAMP8, FOS, and HMOX1 (Figure 3D).
Identification of Central Signaling Pathways and Genes in the Progression from NAFL to NASH
NAFLD stages range from simple steatosis (NAFL) to non-alcoholic steatohepatitis (NASH), which can progress to cirrhosis and hepatocellular carcinoma.18 Therefore, we performed GSVA analysis to explore the important signaling pathways and genes at different stages of NAFLD (NAFL and NASH). The results showed that the MAPK signal pathway had a significant difference between NAFL and NASH tissues (Figure 4A). The JUN, IGF1, and FOS participate in the MAPK pathway based on the enrichment analysis of KEGG (Table 4). Next, we generated ROC curves to evaluate the effectiveness of the GSVA scores (MAPK pathway’s score) and the area under the curves was 0.893 (Figure 4B). Then, ROC curves to evaluate the diagnostic value of the JUN, IGF1, and FOS and the area under the curves was 0.636, 0.971, 0.907 between NAFLD and normal (Figure 4C). The diagnostic value of the JUN, IGF1, and FOS and the area under the curves was 0.727, 0.540, 0.667 between NASH and NAFL (Figure 4D). Moreover, we revealed that the expression of JUN was higher in NAFLD (NAFL and NASH) than in the normal group. Notably, the expression level of JUN was significantly higher in NASH patients than in NAFL patients (Figure 4E), suggesting that the expression level of JUN was climbing gradually as NAFL progressed to NASH. As mentioned above, JUN may be involved in the progression from NAFL to NASH by regulating the MAPK signaling pathway, and may also serve as a valid diagnostic marker to distinguish NAFL from NASH.
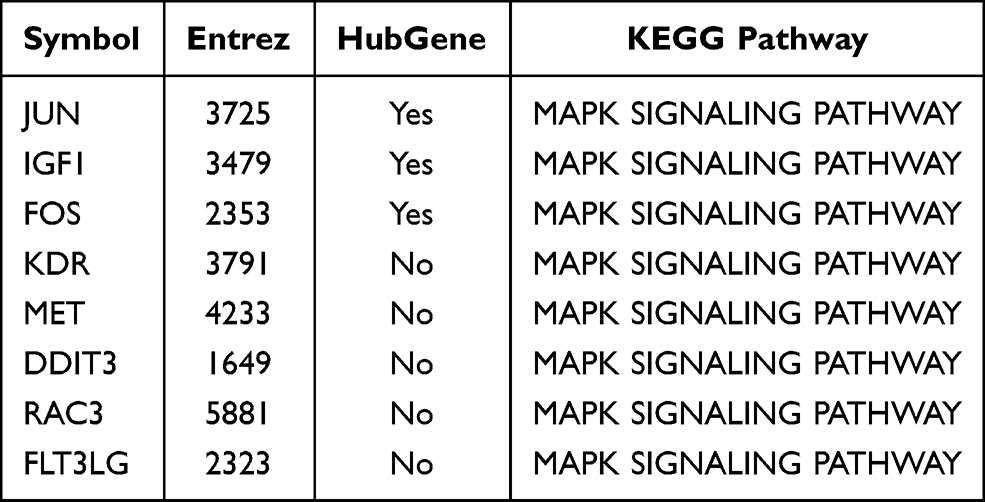 |
Table 4 Hub Genes Participate in the MAPK Pathway Based on the KEGG Pathway Enrichment Analysis |
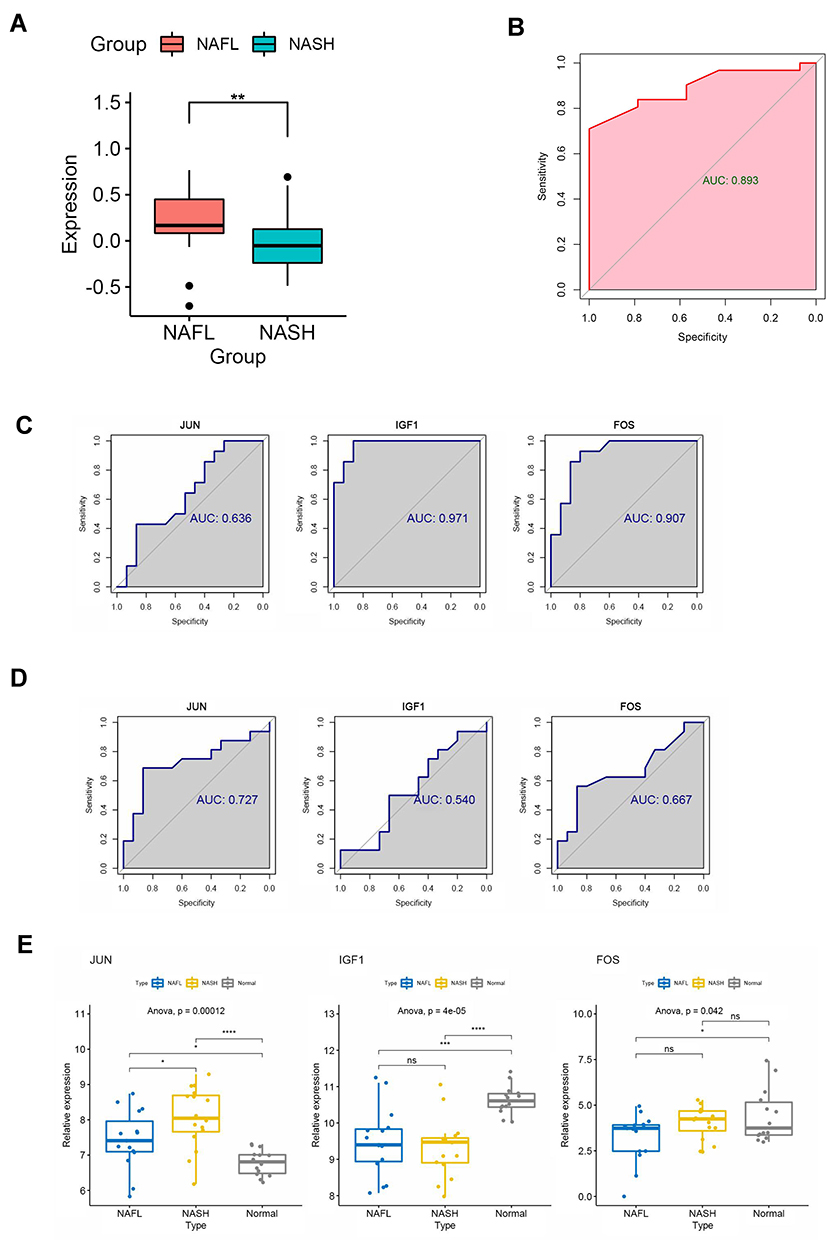 |
Figure 4 Identification of central signaling pathways and genes in the development of NAFLD. (A) Difference of MAPK pathway between NAFLs and NASHs by GSVA algorithm. (B) ROC curve to evaluate the effectiveness of the GSVA scores. (C) ROC curves to evaluate the diagnostic value of the identified genes between NAFLDs and normal. (D) ROC curves to evaluate the diagnostic value of the genes between NASHs and NAFLs. (E) The expression of the genes between NASHs, NAFLs, and normal. (*P<0.05,**P<0.01, ***P<0.001, ****P<0.0001). Abbreviation: ns, no significant. |
Discussion
Regarding an increase in the prevalence of overweight and obesity, NAFLD has been the most common cause of chronic liver disease worldwide. More sensitive and specific biomarkers for NAFLD remain to be further elucidated. Early studies have shown that the progression of NAFLD is closely related to autophagy impairment. In NAFLD, hepatic autophagy deficiency occurs at complicated levels through many mechanisms and is linked to NASH and NAFLD-related HCC.19 As a result of suppression of autophagy, accumulation of inactive mitochondria and elevated oxidative stress leads to hyper-activation of the SQSTM1 KEAP1 NRF2 pathway, which in turn elicits many negative effects finally leads to liver injury.20,21 And the restoration of autophagy can improve NAFLD. Blocking autophagy or silence of autophagy-related genes by drug inhibitors can lead to retention of triglycerides and lipid droplets in hepatocytes, reduction of oxidation of free fatty acids (FFAs), and reduction of secretion of very low-density lipoprotein (VLDL).7 However, numerous autophagy genes in NAFLD are not fully understood. Therefore, to identify ARGs in NAFLD, the discovery cohort (15 NAFLD samples and 14 healthy controls) from the GSE126848 dataset was used to screen out 76 DEARGs in NAFLD livers compared with those in healthy livers.
The evolution from simple steatosis to NASH is the result of a complex interaction involving hepatic cell populations (both parenchymal and non-parenchymal) and pathological signals from other organs (such as visceral adipose tissue and intestine).22 Autophagy plays a role in lipid metabolism, insulin resistance, liver cell injury, inflammation, and other aspects of NAFLD. Since lipophagy (isolation of triglycerides and cholesterol from liver lipid droplets by autophagosome is involved in the selective degradation of cytoplasmic lipid droplets, autophagy of liver cells can be considered as a way against NAFLD. On the other hand, it has been reported that lipotoxic effects, such as insulin resistance and oxidative stress, caused by excess triglycerides and FFAs in NAFLD, suppress autophagy activity. Therefore, GO and KEGG enrichment analyses were performed to determine the potential functions of DEARGs in NAFLD. They are associated with many functions, such as fibroblasts proliferation, ubiquitin protein ligase binding, calcium-release channel activity. Related signaling pathways including PI3K Apoptosis, estrogen signaling pathway. It has been reported that PI3K/AKT signaling pathway is implicated in liver fibrosis in NAFLD.23 Smad ubiquitination regulatory factor 1(Smurf1)-deficient mice have been fed with a high-fat diet (HFD) for 19 weeks, in which liver steatosis was alleviated and the underlying mechanism of Smurf1 promotes the process of liver steatosis is that Smurf1 enhances the stability of sterol regulatory element-binding protein-1c (SREBP-1c) and activates of lipid synthesis.24 NAFLD also may result in liver regeneration (LR) which depends on calcium signaling, including type II inositol 1,4,5-trisphosphate receptor (ITPR2), the principal calcium release channel in hepatocytes and NAFLD induce a c-Jun-mediated decrease in ITPR2 in hepatocytes.25 In addition, estrogen therapy and hormone treatment approaches can protect against fatty liver, insulin resistance, and diabetes.26
Subsequently, a PPI network was constructed and hub genes were identified including NOS3, JUN, IGF1, KDR, VAMP8, FOS, CYBB, HSP90AA1, and HMOX1. Then 5 hub genes were verified in the GSE89632 dataset, including NOS3, IGF1, VAMP8, FOS, and HMOX1, sharing similar differential expression. So far, 76 DEARGs were identified and their functions were analyzed, and 9 hub genes were selected. Some of these genes have been shown to be associated with NAFLD. About NOS3, deficiency of endothelial nitric oxide synthase (eNOS) exacerbates early-stage NAFLD pathogenesis by changing the fat distribution.27 The decrease of IGF1 expression caused by inflammatory cytokines is related to the occurrence and development of NAFLD, and is related to the progression of NAFLD.28 It has also been reported that HMOX-1 upregulation by icosapent ethyl on obesity induced large white adipocytes causes a marked increase in the uncoupling proteins UCP1 and PRDM16 and FGF21 expression, which are key transcriptional regulators in promoting brown fat adipogenesis.29 As for FOS and JUN, many research think they are closely associated with the NAFLD.
Though there have been many studies of autophagy in NAFLD, it has not been figured out that how autophagy functions in NAFLD progression. Basing on the KEGG signaling pathway enrichment analysis, we found a significant difference in the MAPK pathway between NAFL and NASH tissues by GSVA algorithm (P<0.05) and that 3 hub genes, JUN, IGF1, and FOS, participated in the MAPK signaling pathway. To explore the role of these genes in the progression of NAFLD through the MAPK pathway, we evaluated their diagnostic value between NAFLD, NASH, and normal tissues by ROC curve. As a result of the ROC curve and the verification of expression of these genes, finally, we had concluded that JUN can regulate the progression in NAFLD through the MAPK pathway. Published data have indicated that JNK/c-Jun was associated with NAFLD progression. MAPK signaling pathway includes three major subfamilies: the c-Jun N-terminal kinase or stress-activated protein kinases (JNK or SAPK); the extracellular-signal-regulated kinases (ERK MAPK) and MAPK14.30 It has been shown that c-Jun/AP-1(AP-1 transcription factor c-Jun, an important regulator of hepatic stress responses) activation is a vital regulator of hepatic alterations in NAFLD and c-Jun is central in the largest connected deregulated sub-network in NASH-inducing diet livers. Evaluated hepatic c-Jun levels in NAFLD and NASH patients associated with inflammation, and significantly, with the degree of hepatic steatosis.31 It has also been found out that c-Jun promotes NASH progression and hepatic fibrosis.32 Another study has shown that JNK/c-Jun can inhibit the expression of C70RF41 by directly binding to its promoter, and C70RF41 protects palmitic acid (PA)-induced liver inflammation and steatosis by suppressing NF-kB activity. Eventually, they identify a novel c-Jun/C7ORF41/ NF-kB regulatory network that leads to liver inflammation and lipid accumulation during the progression of NAFLD.33 More and more studies all conclude that c-Jun expression associates with disease progression from steatosis to NASH in patients. However, there are no studies on how autophagy affects NAFLD through the MAPK pathway. By referring to the literature and combining with our previous analysis, we hope to provide ideas for the future research on MAPK signaling pathway and autophagy in NAFLD. Previous studies have shown that MAPK/JNK signaling is a potential autophagy regulation pathway. JNK can modulate autophagy at multiple regulatory levels, including protein phosphorylation, lipid and processing,34–37 ATG gene expression, transcription of ATG genes,38 the post-translational modification of Bcl-2 and the dissociation of Beclin 1 from Bcl-2.39 In addition, reactive oxygen species (ROS) and calcium have been reported to be associated with autophagy. ROS may aggravate cell injury through oxidative stress, while autophagy in turn can clear ROS-damaged mitochondria and Proteins, reduce cell injury and promote cell survival. In the cytoplasm, ROS may also affect the formation of autophagic membrane by adjusting Atg4 activity.40 ROS may induce autophagy by activating the MCOLN1-lysosome Ca2+-TFEB pathway, facilitating the removal of damaged mitochondria and excess ROS.41 Furthermore, intracellular Ca2+ signal was essential for mTOR-dependent autophagy and One of the best investigated mechanisms of autophagy induction which is mTOR-dependent was IP3-R-Beclin 1-Bcl-2 pathway.42
Conclusion
In conclusion, we identified nine hub genes for NAFLD based on differentially expressed autophagy-related genes, namely NOS3, JUN, IGF1, KDR, VAMP8, FOS, CYBB, HSP90AA1, and HMOX1. In particular, Jun, which was involved in the MAPK signaling pathway, was identified as a key gene in the progression of NAFL to NASH. There is also a deficiency in our study, which does not explain how JUN affects the progress of autophagy participation in NAFLD, and the mechanisms need to be identified later. Compared with other research, the study of autophagy in the liver starts relatively late. These may be promising diagnostic biomarkers and potential treatment targets in NAFLD.
Abbreviations
AUC, area under the curve; FDR, false discovery rate; log FC, log2 (Fold Change); logCPM, log2 (counts per million); BP, biological processes; MF, molecular functions; CC, cellular components.
Funding
This study was funded by the fundamental research and frontier exploration project of Yuzhong district, Chongqing [No.20180151] to S. Yang. The funding body had no role in the design of the study and collection, analysis, and interpretation of data and in writing the manuscript.
Disclosure
The authors report no conflicts of interest in this work.
References
1. Yu J, Shen J, Sun TT, Zhang X, Wong N. Obesity, insulin resistance, NASH and hepatocellular carcinoma. Semin Cancer Biol. 2013;23(6 Pt B):483–491. doi:10.1016/j.semcancer.2013.07.003
2. Friedman SL, Neuschwander-Tetri BA, Rinella M, Sanyal AJ. Mechanisms of NAFLD development and therapeutic strategies. Nat Med. 2018;24(7):908–922. doi:10.1038/s41591-018-0104-9
3. Ueno T, Komatsu M. Autophagy in the liver: functions in health and disease. Nat Rev Gastroenterol Hepatol. 2017;14(3):170–184. doi:10.1038/nrgastro.2016.185
4. Martinez-Lopez N, Singh R. Autophagy and Lipid Droplets in the Liver. Annu Rev Nutr. 2015;35:215–237. doi:10.1146/annurev-nutr-071813-105336
5. Akkoç Y, Gözüaçık D. Autophagy and liver cancer. Turk J Gastroenterol. 2018;29(3):270–282. doi:10.5152/tjg.2018.150318
6. Parzych KR, Klionsky DJ. An overview of autophagy: morphology, mechanism, and regulation. Antioxid Redox Signal. 2014;20(3):460–473. doi:10.1089/ars.2013.5371
7. Singh R, Kaushik S, Wang Y, et al. Autophagy regulates lipid metabolism. Nature. 2009;458(7242):1131–1135. doi:10.1038/nature07976
8. Fukuo Y, Yamashina S, Sonoue H, et al. Abnormality of autophagic function and cathepsin expression in the liver from patients with non-alcoholic fatty liver disease. Hepatol Res. 2014;44(9):1026–1036. doi:10.1111/hepr.12282
9. Yang L, Li P, Fu S, Calay ES, Hotamisligil GS. Defective hepatic autophagy in obesity promotes ER stress and causes insulin resistance. Cell Metab. 2010;11(6):467–478. doi:10.1016/j.cmet.2010.04.005
10. Park HW, Park H, Semple IA, et al. Pharmacological correction of obesity-induced autophagy arrest using calcium channel blockers. Nat Commun. 2014;5:4834. doi:10.1038/ncomms5834
11. Lin CW, Zhang H, Li M, et al. Pharmacological promotion of autophagy alleviates steatosis and injury in alcoholic and non-alcoholic fatty liver conditions in mice. J Hepatol. 2013;58(5):993–999. doi:10.1016/j.jhep.2013.01.011
12. Sinha RA, Farah BL, Singh BK, et al. Caffeine stimulates hepatic lipid metabolism by the autophagy-lysosomal pathway in mice. Hepatology. 2014;59(4):1366–1380. doi:10.1002/hep.26667
13. Sun L, Zhang S, Yu C, et al. Hydrogen sulfide reduces serum triglyceride by activating liver autophagy via the AMPK-mTOR pathway. Am J Physiol Endocrinol Metab. 2015;309(11):E925–35. doi:10.1152/ajpendo.00294.2015
14. Harada M, Hanada S, Toivola DM, Ghori N, Omary MB. Autophagy activation by rapamycin eliminates mouse Mallory-Denk bodies and blocks their proteasome inhibitor-mediated formation. Hepatology. 2008;47(6):2026–2035. doi:10.1002/hep.22294
15. Szklarczyk D, Morris JH, Cook H, et al. The STRING database in 2017: quality-controlled protein-protein association networks, made broadly accessible. Nucleic Acids Res. 2017;45(D1):D362–d368. doi:10.1093/nar/gkw937
16. Otasek D, Morris JH, Bouças J, Pico AR, Demchak B. Cytoscape Automation: empowering workflow-based network analysis. Genome Biol. 2019;20(1):185. doi:10.1186/s13059-019-1758-4
17. Hänzelmann S, Castelo R, Guinney J. GSVA: gene set variation analysis for microarray and RNA-seq data. BMC Bioinform. 2013;14:7. doi:10.1186/1471-2105-14-7
18. Aizawa Y. [Progress in the Management of NAFLD/NASH]. Rinsho Byori. 2016;64(7):797–805. Japanese.
19. Wu WKK, Zhang L, Chan MTV. Autophagy, NAFLD and NAFLD-Related HCC. Adv Exp Med Biol. 2018;1061:127–138. doi:10.1007/978-981-10-8684-7_10
20. Hayes JD, McMahon M. NRF2 and KEAP1 mutations: permanent activation of an adaptive response in cancer. Trends Biochem Sci. 2009;34(4):176–188. doi:10.1016/j.tibs.2008.12.008
21. Taguchi K, Motohashi H, Yamamoto M. Molecular mechanisms of the Keap1–Nrf2 pathway in stress response and cancer evolution. Genes Cells. 2011;16(2):123–140. doi:10.1111/j.1365-2443.2010.01473.x
22. González-Rodríguez A, Mayoral R, Agra N, et al. Impaired autophagic flux is associated with increased endoplasmic reticulum stress during the development of NAFLD. Cell Death Dis. 2014;5(4):e1179. doi:10.1038/cddis.2014.162
23. Elpek G. Cellular and molecular mechanisms in the pathogenesis of liver fibrosis: an update. World J Gastroenterol. 2014;20(23):7260–7276. doi:10.3748/wjg.v20.i23.7260
24. Zhang X, Zhan Y, Lin W, et al. Smurf1 aggravates non-alcoholic fatty liver disease by stabilizing SREBP-1c in an E3 activity-independent manner. FASEB j. 2020;34(6):7631–7643. doi:10.1096/fj.201902952RR
25. Khamphaya T, Chukijrungroat N, Saengsirisuwan V, et al. Nonalcoholic fatty liver disease impairs expression of the type II inositol 1,4,5-trisphosphate receptor. Hepatology. 2018;67(2):560–574. doi:10.1002/hep.29588
26. Palmisano BT, Zhu L, Stafford JM. Role of Estrogens in the Regulation of Liver Lipid Metabolism. Adv Exp Med Biol. 2017;1043:227–256. doi:10.1007/978-3-319-70178-3_12
27. Nozaki Y, Fujita K, Wada K, et al. Deficiency of eNOS exacerbates early-stage NAFLD pathogenesis by changing the fat distribution. BMC Gastroenterol. 2015;15:177. doi:10.1186/s12876-015-0409-9
28. Hribal ML, Procopio T, Petta S, et al. Insulin-like growth factor-I, inflammatory proteins, and fibrosis in subjects with nonalcoholic fatty liver disease. J Clin Endocrinol Metab. 2013;98(2):E304–8. doi:10.1210/jc.2012-3290
29. Sasson A, Kristoferson E, Batista R, McClung JA, Abraham NG, Peterson SJ. The pivotal role of heme Oxygenase-1 in reversing the pathophysiology and systemic complications of NAFLD. Arch Biochem Biophys. 2021;697:108679. doi:10.1016/j.abb.2020.108679
30. Fang JY, Richardson BC. The MAPK signalling pathways and colorectal cancer. Lancet Oncol. 2005;6(5):322–327. doi:10.1016/s1470-2045(05)70168-6
31. Dorn C, Engelmann JC, Saugspier M, et al. Increased expression of c-Jun in nonalcoholic fatty liver disease. Lab Invest. 2014;94(4):394–408. doi:10.1038/labinvest.2014.3
32. Schulien I, Hockenjos B, Schmitt-Graeff A, et al. The transcription factor c-Jun/AP-1 promotes liver fibrosis during non-alcoholic steatohepatitis by regulating Osteopontin expression. Cell Death Differ. 2019;26(9):1688–1699. doi:10.1038/s41418-018-0239-8
33. Yan FJ, Wang X, Wang SE, et al. C-Jun/C7ORF41/NF-κB axis mediates hepatic inflammation and lipid accumulation in NAFLD. Biochem J. 2020;477(3):691–708. doi:10.1042/bcj20190799
34. Scott RC, Juhász G, Neufeld TP. Direct induction of autophagy by Atg1 inhibits cell growth and induces apoptotic cell death. Curr Biol. 2007;17(1):1–11. doi:10.1016/j.cub.2006.10.053
35. Klionsky DJ, Abeliovich H, Agostinis P, et al. Guidelines for the use and interpretation of assays for monitoring autophagy in higher eukaryotes. Autophagy. 2008;4(2):151–175. doi:10.4161/auto.5338
36. Kabeya Y, Mizushima N, Yamamoto A, Oshitani-Okamoto S, Ohsumi Y, Yoshimori T. LC3, GABARAP and GATE16 localize to autophagosomal membrane depending on form-II formation. J Cell Sci. 2004;117(\(Pt 13)):2805–2812. doi:10.1242/jcs.01131
37. Mizushima N, Noda T, Yoshimori T, et al. A protein conjugation system essential for autophagy. Nature. 1998;395(6700):395–398. doi:10.1038/26506
38. Xu P, Das M, Reilly J, Davis RJ. JNK regulates FoxO-dependent autophagy in neurons. Genes Dev. 2011;25(4):310–322. doi:10.1101/gad.1984311
39. Zhou YY, Li Y, Jiang WQ, Zhou LF. MAPK/JNK signalling: a potential autophagy regulation pathway. Biosci Rep. 2015;35(3). doi:10.1042/bsr20140141
40. Li L, Tan J, Miao Y, Lei P, Zhang Q. ROS and Autophagy: interactions and Molecular Regulatory Mechanisms. Cell Mol Neurobiol. 2015;35(5):615–621. doi:10.1007/s10571-015-0166-x
41. Zhang X, Yu L, Xu H. Lysosome calcium in ROS regulation of autophagy. Autophagy. 2016;12(10):1954–1955. doi:10.1080/15548627.2016.1212787
42. Vicencio JM, Ortiz C, Criollo A, et al. The inositol 1,4,5-trisphosphate receptor regulates autophagy through its interaction with Beclin 1. Cell Death Differ. 2009;16(7):1006–1017. doi:10.1038/cdd.2009.34
 © 2021 The Author(s). This work is published and licensed by Dove Medical Press Limited. The full terms of this license are available at https://www.dovepress.com/terms.php and incorporate the Creative Commons Attribution - Non Commercial (unported, v3.0) License.
By accessing the work you hereby accept the Terms. Non-commercial uses of the work are permitted without any further permission from Dove Medical Press Limited, provided the work is properly attributed. For permission for commercial use of this work, please see paragraphs 4.2 and 5 of our Terms.
© 2021 The Author(s). This work is published and licensed by Dove Medical Press Limited. The full terms of this license are available at https://www.dovepress.com/terms.php and incorporate the Creative Commons Attribution - Non Commercial (unported, v3.0) License.
By accessing the work you hereby accept the Terms. Non-commercial uses of the work are permitted without any further permission from Dove Medical Press Limited, provided the work is properly attributed. For permission for commercial use of this work, please see paragraphs 4.2 and 5 of our Terms.