")
Back to Journals » OncoTargets and Therapy » Volume 14
Identification of a Six-Gene Signature for Predicting the Overall Survival of Cervical Cancer Patients
Authors Huo X, Zhou X, Peng P, Yu M, Zhang Y, Yang J, Cao D, Sun H, Shen K
Received 13 August 2020
Accepted for publication 6 January 2021
Published 5 February 2021 Volume 2021:14 Pages 809—822
DOI https://doi.org/10.2147/OTT.S276553
Checked for plagiarism Yes
Review by Single anonymous peer review
Peer reviewer comments 4
Editor who approved publication: Dr Leo Jen-Liang Su
Xiao Huo,1 Xiaoshuang Zhou,2,3 Peng Peng,2 Mei Yu,2 Ying Zhang,2 Jiaxin Yang,2 Dongyan Cao,2 Hengzi Sun,4 Keng Shen2
1Medical Research Center, Peking University Third Hospital, Beijing,, People’s Republic of China; 2Department of Obstetrics and Gynecology, Peking Union Medical College Hospital, Chinese Academy of Medical Sciences and Peking Union Medical College, Beijing, People’s Republic of China; 3Department of Ultrasound, Sun Yat-Sen University Cancer Center, State Key Laboratory of Oncology in South China, Collaborative Innovation Center for Cancer Medicine, Beijing, People’s Republic of China; 4Department of Obstetrics and Gynecology, Beijing Chao-Yang Hospital, Capital Medical University, Beijing, People’s Republic of China
Correspondence: Keng Shen
Department of Obstetrics and Gynecology, Peking Union Medical College Hospital, Chinese Academy of Medical Sciences and Peking Union Medical College, No. 1 Shuaifuyuan, Dongcheng District, Beijing, 100730, People’s Republic of China
Tel +86-10-69155200
Email [email protected]
Correspondence: Hengzi Sun
Department of Obstetrics and Gynecology, Beijing Chao-Yang Hospital, Capital Medical University, No. 8 GongTiNan Road, Chaoyang District, Beijing, 100020, People’s Republic of China
Tel +86 010 85231760
Email [email protected]
Background: Although the incidence of cervical cancer has decreased in recent decades with the development of human papillomavirus vaccines and cancer screening, cervical cancer remains one of the leading causes of cancer-related death worldwide. Identifying potential biomarkers for cervical cancer treatment and prognosis prediction is necessary.
Methods: Samples with mRNA sequencing, copy number variant, single nucleotide polymorphism and clinical follow-up data were downloaded from The Cancer Genome Atlas database and randomly divided into a training dataset (N=146) and a test dataset (N=147). We selected and identified a prognostic gene set and mutated gene set and then integrated the two gene sets with the random survival forest algorithm and constructed a prognostic signature. External validation and immunohistochemical staining were also performed.
Results: We obtained 1416 differentially expressed prognosis-related genes, 624 genes with copy number amplification, 1038 genes with copy number deletion, and 163 significantly mutated genes. A total of 75 candidate genes were obtained after overlapping the differentially expressed genes and the genes with genomic variations. Subsequently, we obtained six characteristic genes through the random survival forest algorithm. The results showed that high expression of SLC19A3, FURIN, SLC22A3, and DPAGT1 and low expression of CCL17 and DES were associated with a poor prognosis in cervical cancer patients. We constructed a six-gene signature that can separate cervical cancer patients according to their different overall survival rates, and it showed robust performance for predicting survival (training set: p ˂ 0.001, AUC = 0.82; testing set: p ˂ 0.01, AUC = 0.59).
Conclusion: Our study identified a novel six-gene signature and nomogram for predicting the overall survival of cervical cancer patients, which may be beneficial for clinical decision-making for individualized treatment.
Keywords: cervical cancer, bioinformatics, prognostic signature, Gene Expression Omnibus, overall survival
Introduction
Cervical cancer (CC) is one of the main causes of cancer-related death in women and the third leading malignancy among women worldwide, after breast and colorectal cancers, and accounts for 569,000 new cancer cases each year.1,2 CC is still a major problem for healthy women worldwide despite significant efforts. Although the development of CC screening has led to a drastic reduction in the incidence of CC, there are still many challenges in reducing the incidence of advanced lesions. Therefore, searching for potential biomarkers for CSCC treatment and prognosis prediction with multiomics data is necessary. However, few studies have been conducted to explore the relationship between genomic factors and CSCC prognosis.
At present, the biomarkers used for the prognosis of CSCC are mainly divided into two categories. One category consists of clinical biomarkers for CSCC survival prediction, such as squamous cell antigen (SCC). The other category consists of prognosis-related signatures constructed from several prognostic genes by high-throughput sequencing data analysis. For instance, Shen et al discovered that the CD28 and PTEN genes play important roles in the occurrence and development of CSCC through methylated microarray data analysis.3 Mao et al identified long noncoding RNAs (lncRNAs) related to the prognosis of CSCC from the TCGA database and developed a 15-lncRNA signature risk score to comprehensively assess the prognostic role of lncRNAs.4 Ma et al found a potential microRNA (miRNA) expression signature capable of predicting survival time for CSCC patients.5 Therefore, the identification of genes of prognostic value by bioinformatics analysis will likely be crucial and helpful in CSCC treatment and prognosis prediction. High-throughput multiomics sequencing data have laid a solid foundation for identifying genes related to cancer prognosis. Multiomics data analysis can reveal the mechanism of cancer development from multiple perspectives.
In this study, we analyzed transcriptome data to obtain genes related to the prognosis of CSCC. Then, we analyzed the copy number variation (CNV) data and mutation data of CSCC patients to obtain genes related to the occurrence and development of CSCC. Subsequently, we integrated the results and proposed a prognostic gene signature by using the random survival forest algorithm. We proved that the model performed effectively in the test dataset and the external independent dataset and that the signature shows strong clinical independence. Overall, the prognostic gene signature can effectively predict the prognosis of CSCC and provide a basis for a better understanding of the pathogenesis of CSCC.
Materials and Methods
Collection and Preprocessing of Publicly Available Data
The CSCC RNA sequencing (RNA-seq) fragments per kilobase of transcript per million mapped reads (FPKM) dataset and corresponding clinical follow-up information were downloaded from the publicly available TCGA database by the University of California, Santa Cruz (UCSC) Genome Browser (https://xenabrowser.net/datapages/); these datasets contain information on 309 samples and 306 samples, respectively. The CNV dataset of the SNP 6.0 array contains information for a total of 297 samples. The mutation annotation file (MAF) downloaded from the GDC client contains information for a total of 289 samples. The GSE44001 expression profile data and clinical follow-up information were downloaded from the Gene Expression Omnibus (GEO) database (https://www.ncbi.nlm.nih.gov/geo/) and contains information for a total of 300 samples. To process the GSE44001 data, the software package GenomeStudio was applied to extract raw data. The intensity of the probes was log2-transformed and then normalized using the quantile normalization method.
The TCGA transcriptome data were standardized, and the samples were randomly divided into two groups: the training dataset (n=146) and the test dataset (n=147). GSE44001 was used as an independent validation dataset. The age, survival status, grade and tumor stage of patients who provided the samples are expressed in Table S1.
Univariate Cox Proportional Hazards Regression Analysis
Univariate Cox proportional hazards regression analysis was performed for each gene with transcriptome data in TCGA training dataset, and genes with a significance level of p < 0.05 were selected as prognostic genes.
CNV Analysis
GISTIC 2.06 software was used to identify the genes with significant amplification or deletion. The threshold criteria were set as an amplification or a deletion length greater than 0.1 and z significance level of p < 0.05.
Gene Mutation Analysis
MUTSIG 2.0 software was used to identify the genes in MAF with significant mutations with p < 0.05.
Gene Signature Construction
First, the candidate genes significantly related to survival were screened for significant amplification, deletion, and mutation. Then, we used the random survival forest algorithm7 to rank the importance of the genes. The number of Monte Carlo iterations was 100, and the number of advances was 5 (nrep = 100, nstep = 5). Genes with a relative importance greater than 0.5 were identified as characteristic genes. Finally, we performed a multivariate Cox regression analysis to build the risk score model:
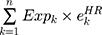
where N is the number of prognostic genes,  is the expression value of prognostic genes, and
  is the estimated regression coefficient of genes in the multivariate Cox regression analysis.
Functional Enrichment Analysis
Gene Ontology (GO) and Kyoto Encyclopedia of Genes and Genomes (KEGG) pathway enrichment analyses of genes were performed by using the R package clusterProfiler8 to identify overrepresented GO biological process terms and KEGG pathways. For this analysis, a false discovery rate (FDR) <0.05 was considered to denote statistical significance.
Immunohistochemical Staining (IHC)
We collected a total of 160 human cervical tissue samples, 130 of which had accompanying follow-up information, and 30 cancer-adjacent cervical tissue samples from paraffin-embedded tissue archives between January 2010 and January 2014 at the Department of Pathology of Peking Union Medical College Hospital. The follow-up was performed until December 2018. The pathological diagnoses were reconfirmed by a pathologist. The project was approved by the Ethical Committee (Peking Union Medical College Hospital), and informed consent was acquired from patients or family members (As some patients have passed away when signing the reconfirmed consent). IHC was performed as previously described.9 Antibodies against the following targets were used: CCL17 (1:200); DES (desmin; 1:100); DPAGT1 (1:200); FURIN (1:200); SLC19A3 (1:500); and SLC22A3 (1:500). The scoring details have been described previously.10 Positive staining was defined as follows: five random microscope fields were selected for semiquantification of the staining. The intensity of immunostaining was graded as follows: 1+, weak; 2+, moderate; 3+, strong or 4+, very strong. The area of positive cancer cells in each microscopic field was categorized as follows: 1+, 0 to 25%; 2+, 25 to 50%; 3+, 50 to 75% or 4+, 75 to 100%. A total score between 5 and 80 was obtained by multiplying the two scores by 5. A total score from 0 to 42 was assigned as “low expression” and that from 43 to 80 was assigned as “high expression”. Two pathologists independently reviewed the slides using their individual criteria, and consensus interpretations were used as the final interpretations. Discrepant interpretations were adjudicated by a third pathologist.
Results
Selection and Identification of the Prognostic Gene Set and the Mutated Gene Set
From the TCGA training dataset, a total of 1412 genes were selected as prognostic candidate genes based on univariate Cox regression analysis (p < 0.05). The top 20 most significant prognostic genes with the lowest p values are listed in Table 1 (more details in Table S2)
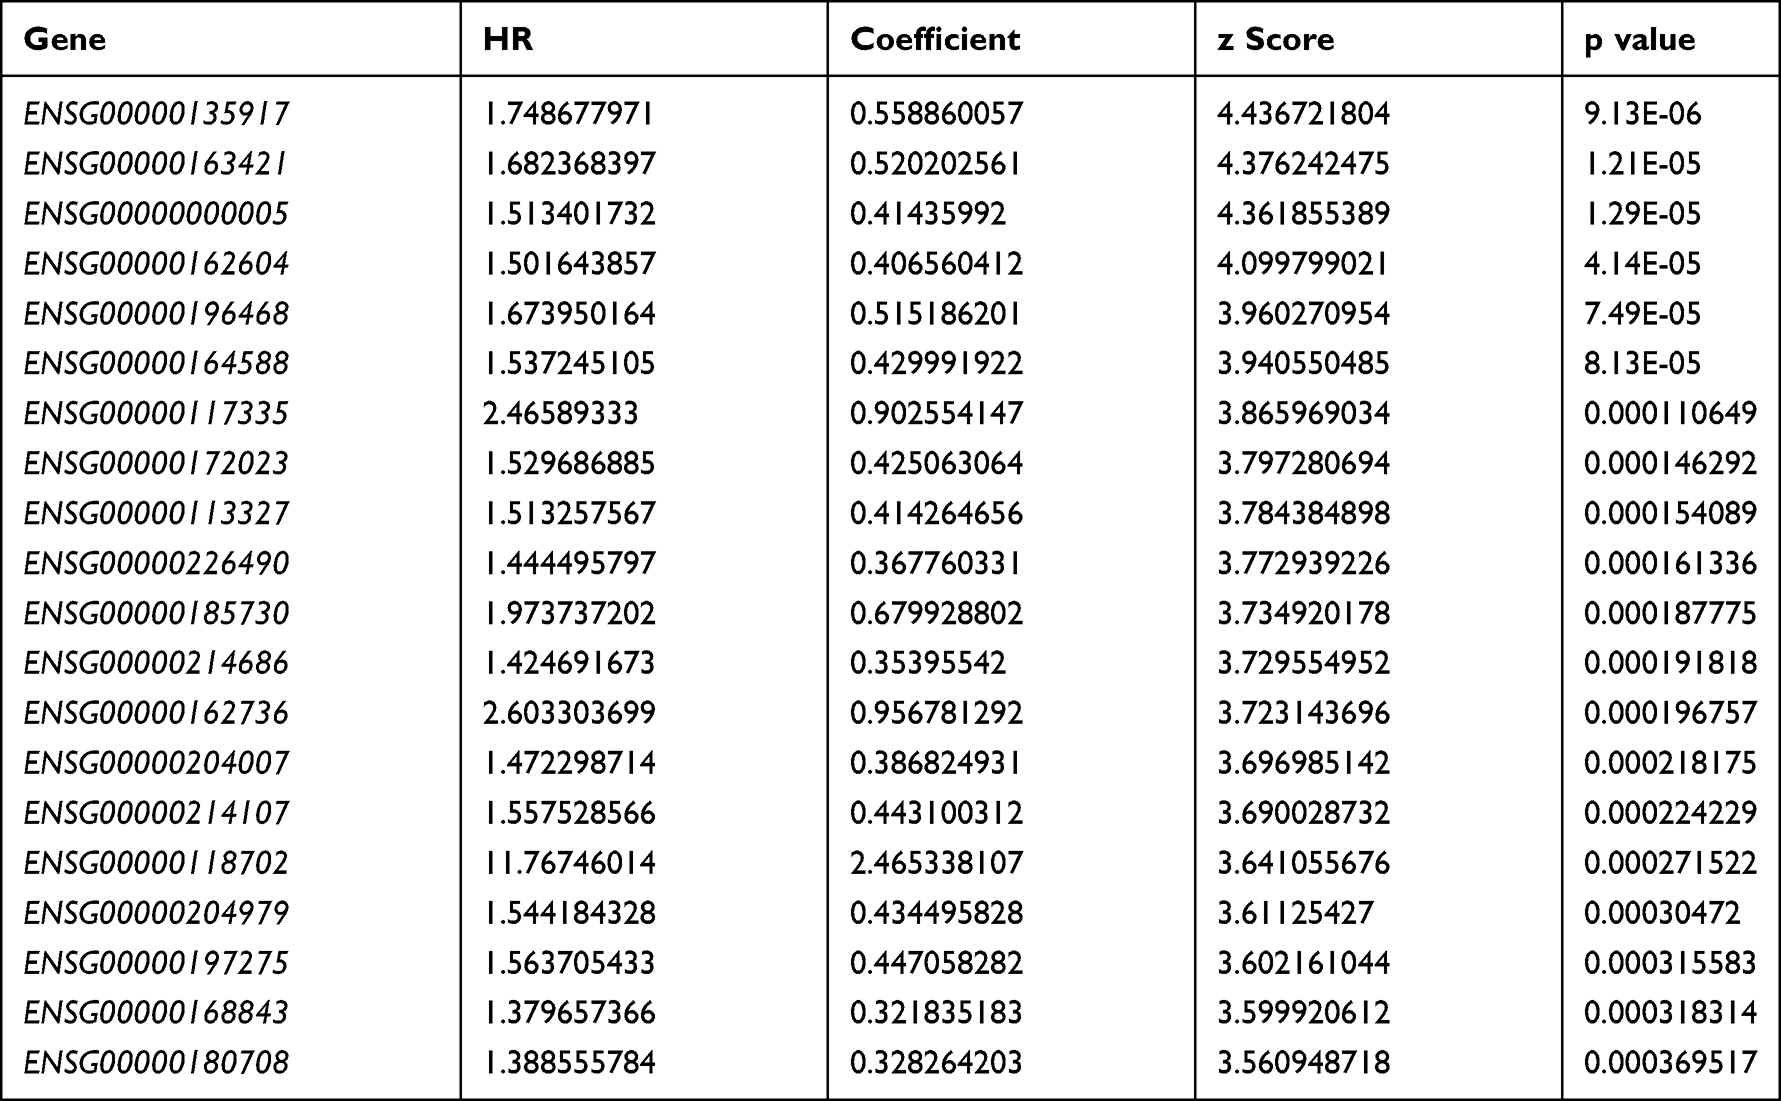 |
Table 1 Top 20 Most Significant Prognostic Genes |
Moreover, genes with significant amplification or deletion were identified by GISTIC 2.0. Figure 1A shows the significantly amplified segments in the CC genome. The significantly amplified genes on each segment are listed in Table S3. For instance, ERBB2 was significantly amplified on the 17q12 segment (q value = 5.62E-12), MYC was significantly amplified on the 8q24.21 segment (q value = 7.70E-09), and EGFR was significantly amplified on the 7p11.2 segment (q value = 0.01188). In total, 624 genes were identified with significant amplification. Figure 1B shows the significantly deleted segments in the CC genome. The significantly deleted genes in each segment are recorded in Table S4. For instance, CD3D was significantly deleted in the 11q24.2 segment (q value = 9.11E-26), SMAD4 was significantly deleted in the 18q21.2 segment (q value = 0.0010189), and PTEN was significantly deleted in 10q23.31 (q value = 0.0077083). A total of 1038 genes were identified with significant deletions.
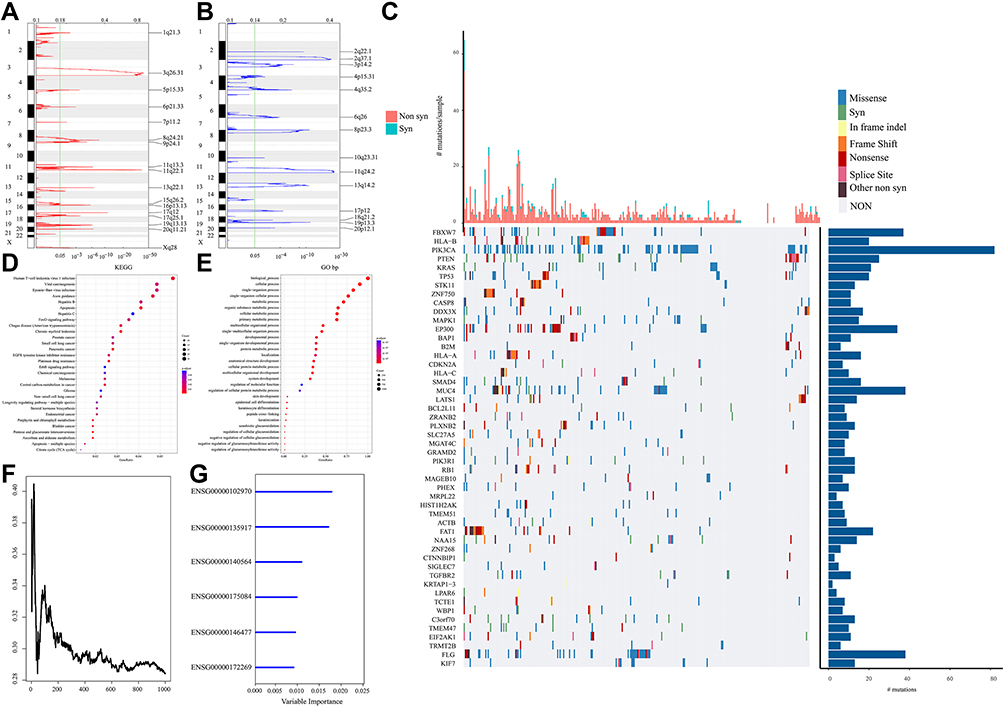 |
Figure 1 (A) Significantly amplified segments in the CC genome. (B) Significantly deleted segments in the CC genome. (C) The top 50 genes with the most significant p values. The upper histogram represents the total number of synonymous and nonsynonymous mutations in the 50 genes from each patient, and the right histogram represents the mutation proportion of 50 genes in all samples. (D) A total of 839 genes with significant copy number variation and mutations were included in the KEGG pathway analysis. (E) A total of 839 genes with significant CNV and mutations were included in the GO biological process analysis. (F) The relationship between prediction error rates and the number of separate trees. (G) The out-of-bag importance rank of the top 6 genes. |
Subsequently, we used MUTSIG 2.0 to identify genes with significant mutations from the TCGA MAF data. P < 0.05 was set as the threshold. A total of 163 genes were identified with significant mutation frequencies. Figure 1C shows the top 50 genes with the highest mutation frequencies and the distribution of the different mutation forms, including synonymous mutations, missense mutations, frame insertions or deletions, frame movements, nonsense mutations, splice sites and other nonsynonymous mutations, in the training dataset. The upper histogram represents the total number of synonymous and nonsynonymous mutations among the 50 genes in each patient, and the right histogram represents the mutation proportion of the 50 genes in all samples. Some of these genes, such as FBXW7, PIK3CA, PTEN, KRAS, and TP53, were reported to be closely related to the occurrence and development of cancer in previous studies.
Furthermore, we analyzed the pathways and biological processes involved in genes with CNVs and mutations to investigate the potential mechanism. After the integration of genes with CNVs and genes with mutations, a total of 1643 genes were obtained for functional enrichment analysis. As shown in Figure 1D, the 1643 genes were significantly enriched in human T-cell leukemia virus 1 infection, apoptosis, the FoxO signaling pathway, the ErbB signaling pathway, central carbon metabolism in cancer, endometrial cancer, etc. As shown in Figure 1E, the 1643 genes were significantly associated with developmental processes, protein metabolic processes, and epidermal cell differentiation.
Prognostic Signature Construction for CSCC Patients
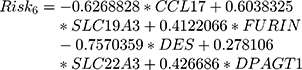
In this study, we aimed to obtain a prognostic signature for CSCC prognosis prediction. Therefore, we selected 75 genes with significant CNVs and mutations among the prognostic candidate gene set for stepwise importance ranking by the random survival forest algorithm. Finally, we identified 6 genes with relative importance greater than 0.5 as final candidates for the prognostic signature. The hazard risk (HR), z-score, p value, importance and relative importance of the 6 genes are shown in Table 2. Figure 1F shows the relationship between the prediction error rates and the number of separate trees, and Figure 1G expresses the out-of-bag importance rank of the top 6 genes. Multivariant Cox regression analysis was conducted to develop a 6-gene signature, and the risk model was constructed as follows:
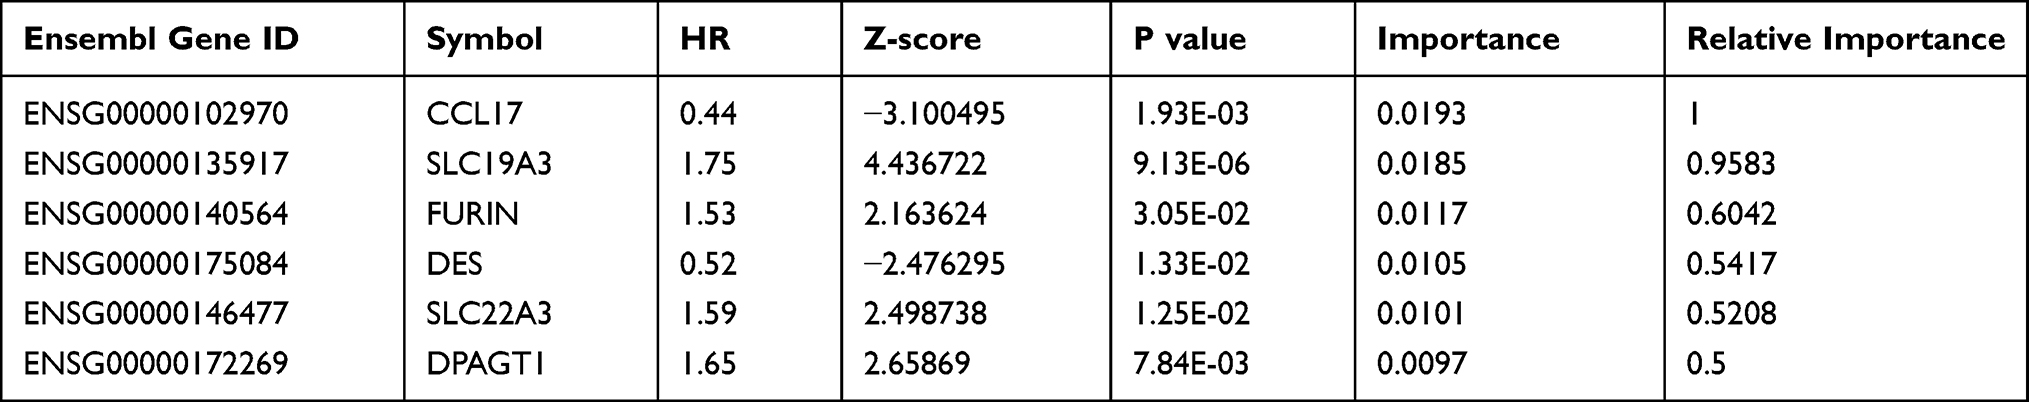 |
Table 2 6-Genes Significantly Associated with the Overall Survival in the Training-Set Patients |
Then, the 6-gene signature risk score for each sample was calculated. According to the median value of all the samples, patients were divided into a high-risk group and a low-risk group (cutoff=0.02513276). The scores from this 6-gene signature model in the TCGA training dataset are shown in Figure 2. Figure 2A shows that 73 patients each were divided into the high-risk group and the low-risk group. Figure 2B demonstrates the receiver operating characteristic (ROC) curve, and the area under the curve (AUC) at 60 months was 0.82. Figure 2C shows that as the risk score increased, the survival period decreased significantly, and the majority of patients in the high-risk group died within 60 months. We also analyzed the expression level of 6 genes in patients with high versus low-risk scores. Patients in the high-risk group tended to have higher expression levels of SLC19A3, FURIN, SLC22A3 and DPAGT1 and lower expression levels of CCL17 and DES. We also compared the calibration of the model in 1, 3, and 5 years. Figure 2D shows that the difference between the predicted value and the true value is small, which indicates the robust prediction performance of the model.
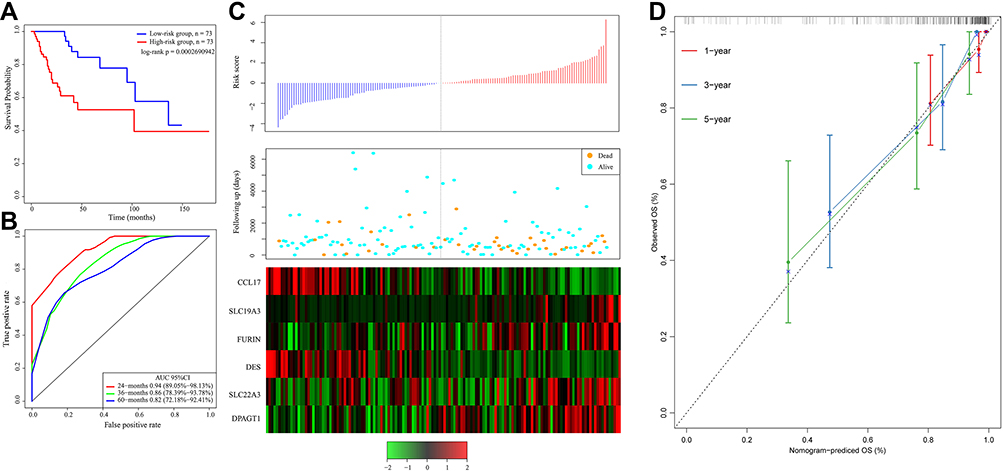 |
Figure 2 (A) Kaplan–Meier survival curve of patients stratified according to the 6-gene signature in the TCGA training dataset. (B) ROC curve and AUC of the 6-gene signature. (C) Risk score, survival period and gene expression level. (D) The nomogram prediction of OS. |
We also analysis of the expression of 6 genes in normal tissues and tumor tissues as shown in Figure S1. None of the 6 genes showed significant differences. In the TCGA data set, there are only 3 normal samples and 304 primary tumor samples. Therefore, statistical tests may be biased.
Detection of the Robustness of the Gene Signature
To verify the accuracy of the 6-gene signature, the test dataset was assessed with the same model and cutoff value as training dataset. The Kaplan–Meier survival curve, ROC curve and AUC of the 6-gene signature and the relationships between the risk score, survival period and gene expression levels are shown in Figure 3. Figure 3A demonstrates the significant prognostic difference between the high-risk group and the low-risk group (log-rank p = 0.009019433). Figure 3B and C shows that SLC19A3, FURIN, SLC22A3 and DPAGT1 might be risk factors, while CCL17 and DES might be protective factors, which is consistent with the findings in the training dataset.
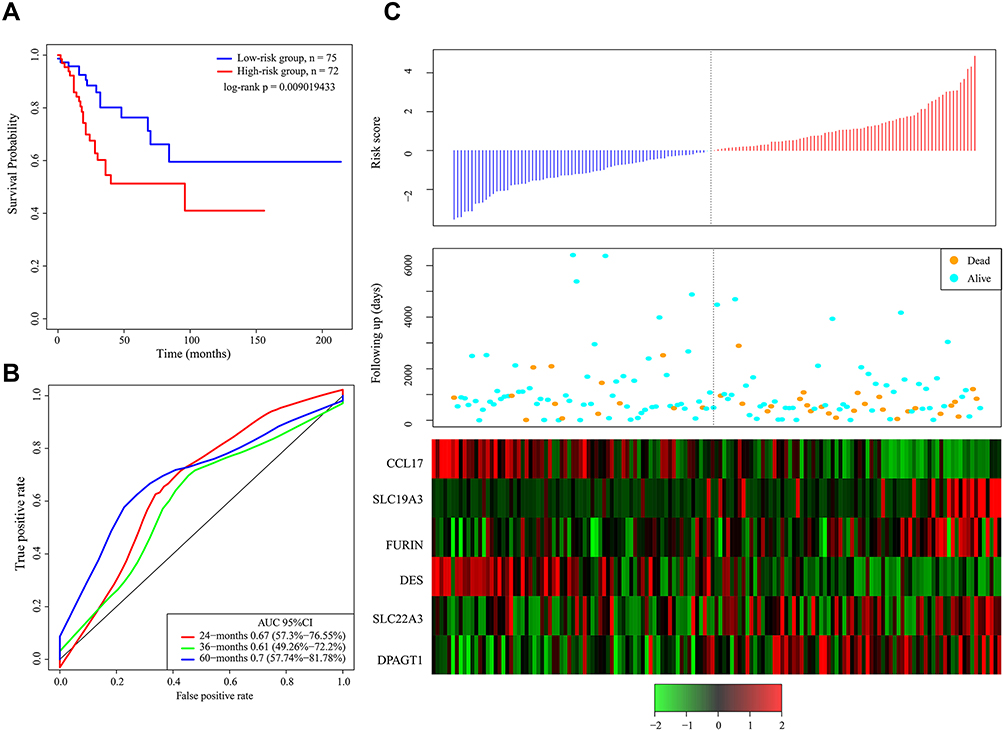 |
Figure 3 (A) Kaplan–Meier survival curve of patients stratified according to the 6-gene signature in the TCGA test dataset. (B) ROC curve and AUC of the 6-gene signature. (C) Risk score, survival period and gene expression level. |
Furthermore, we validated the 6-gene signature in an external independent dataset downloaded from the GEO to confirm the stability with different platforms. The same formula and cutoff value were applied. Consistent with our previous findings, Figure 4 demonstrates the Kaplan–Meier curves of the GSE44001 dataset, which further suggested a significantly prolonged survival time in the low-risk patients compared to the high-risk patients (Figure 4A). The AUC at 60 months was 0.59, and the relation between gene expression levels and the risk score was also consistent with that in the TCGA dataset (Figure 4B and C). Therefore, the 6-gene signature has robust prognostic capabilities.
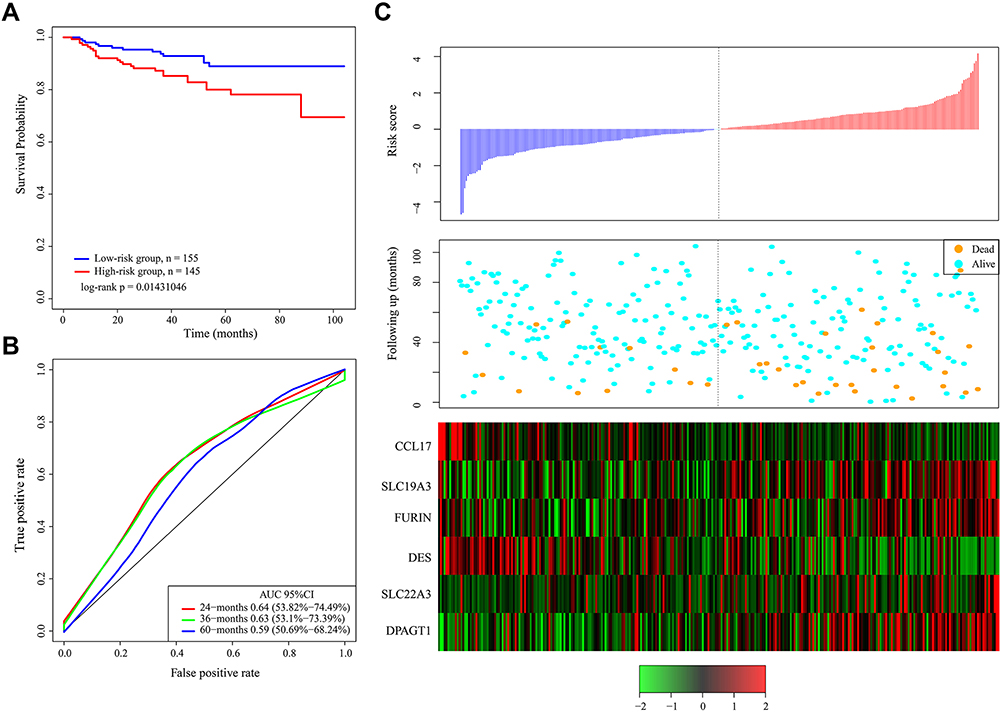 |
Figure 4 (A) Kaplan–Meier survival curve of patients stratified according to the 6-gene signature in independent validation dataset. (B) ROC curve and AUC of the 6-gene signature. (C) Risk score, survival period and gene expression level. |
Independence Evaluation of the Prognostic Signature
To confirm the independence of the 6-gene signature in clinical application, univariate and multivariate Cox regression analyses were conducted with the TCGA training dataset, the TCGA test dataset and the GSE44001 dataset. Variates, including age, grade, pathologic T stage, pathologic N stage, pathologic M stage, tumor stage and 6-gene risk group, were analyzed systemically, and the results are shown in Table 3 (Table S5). Univariate Cox regression analysis verified that high-risk classification, pathologic T3/T4, and tumor stage III/IV were significantly related to survival in the TCGA training dataset; multivariate Cox regression analysis verified that high-risk classification (HR = 2.89, 95% CI = 1.20–6.94, p = 0.018), pathologic T3/T4, and tumor stage III/IV were independent prognostic factors. Moreover, high-risk classification, pathologic T4 stage and pathologic N1 stage were significantly related to survival in the TCGA test dataset, and high-risk classification (HR = 1.444, 95% CI = 1.05–1.97, p = 0.020), pathologic T4 stage and pathologic N1 stage were clinically independent prognostic markers. For the GSE44001 data, high-risk classification was significantly related to survival and was a clinically independent prognostic marker (HR = 1.40, 95% CI = 1.09–1.78, p = 0.007). We have included prognostic-related clinical features T and Stage, and built a nomogram such as Figure S2 with our RiskScore; it can be observed that nomogram, RiskScore and T staging benefit significantly Higher than the extreme curve, in which Nomogram is higher than RiskScore, T stage is similar to RiskScore, which indicates that nomogram has good reliability.
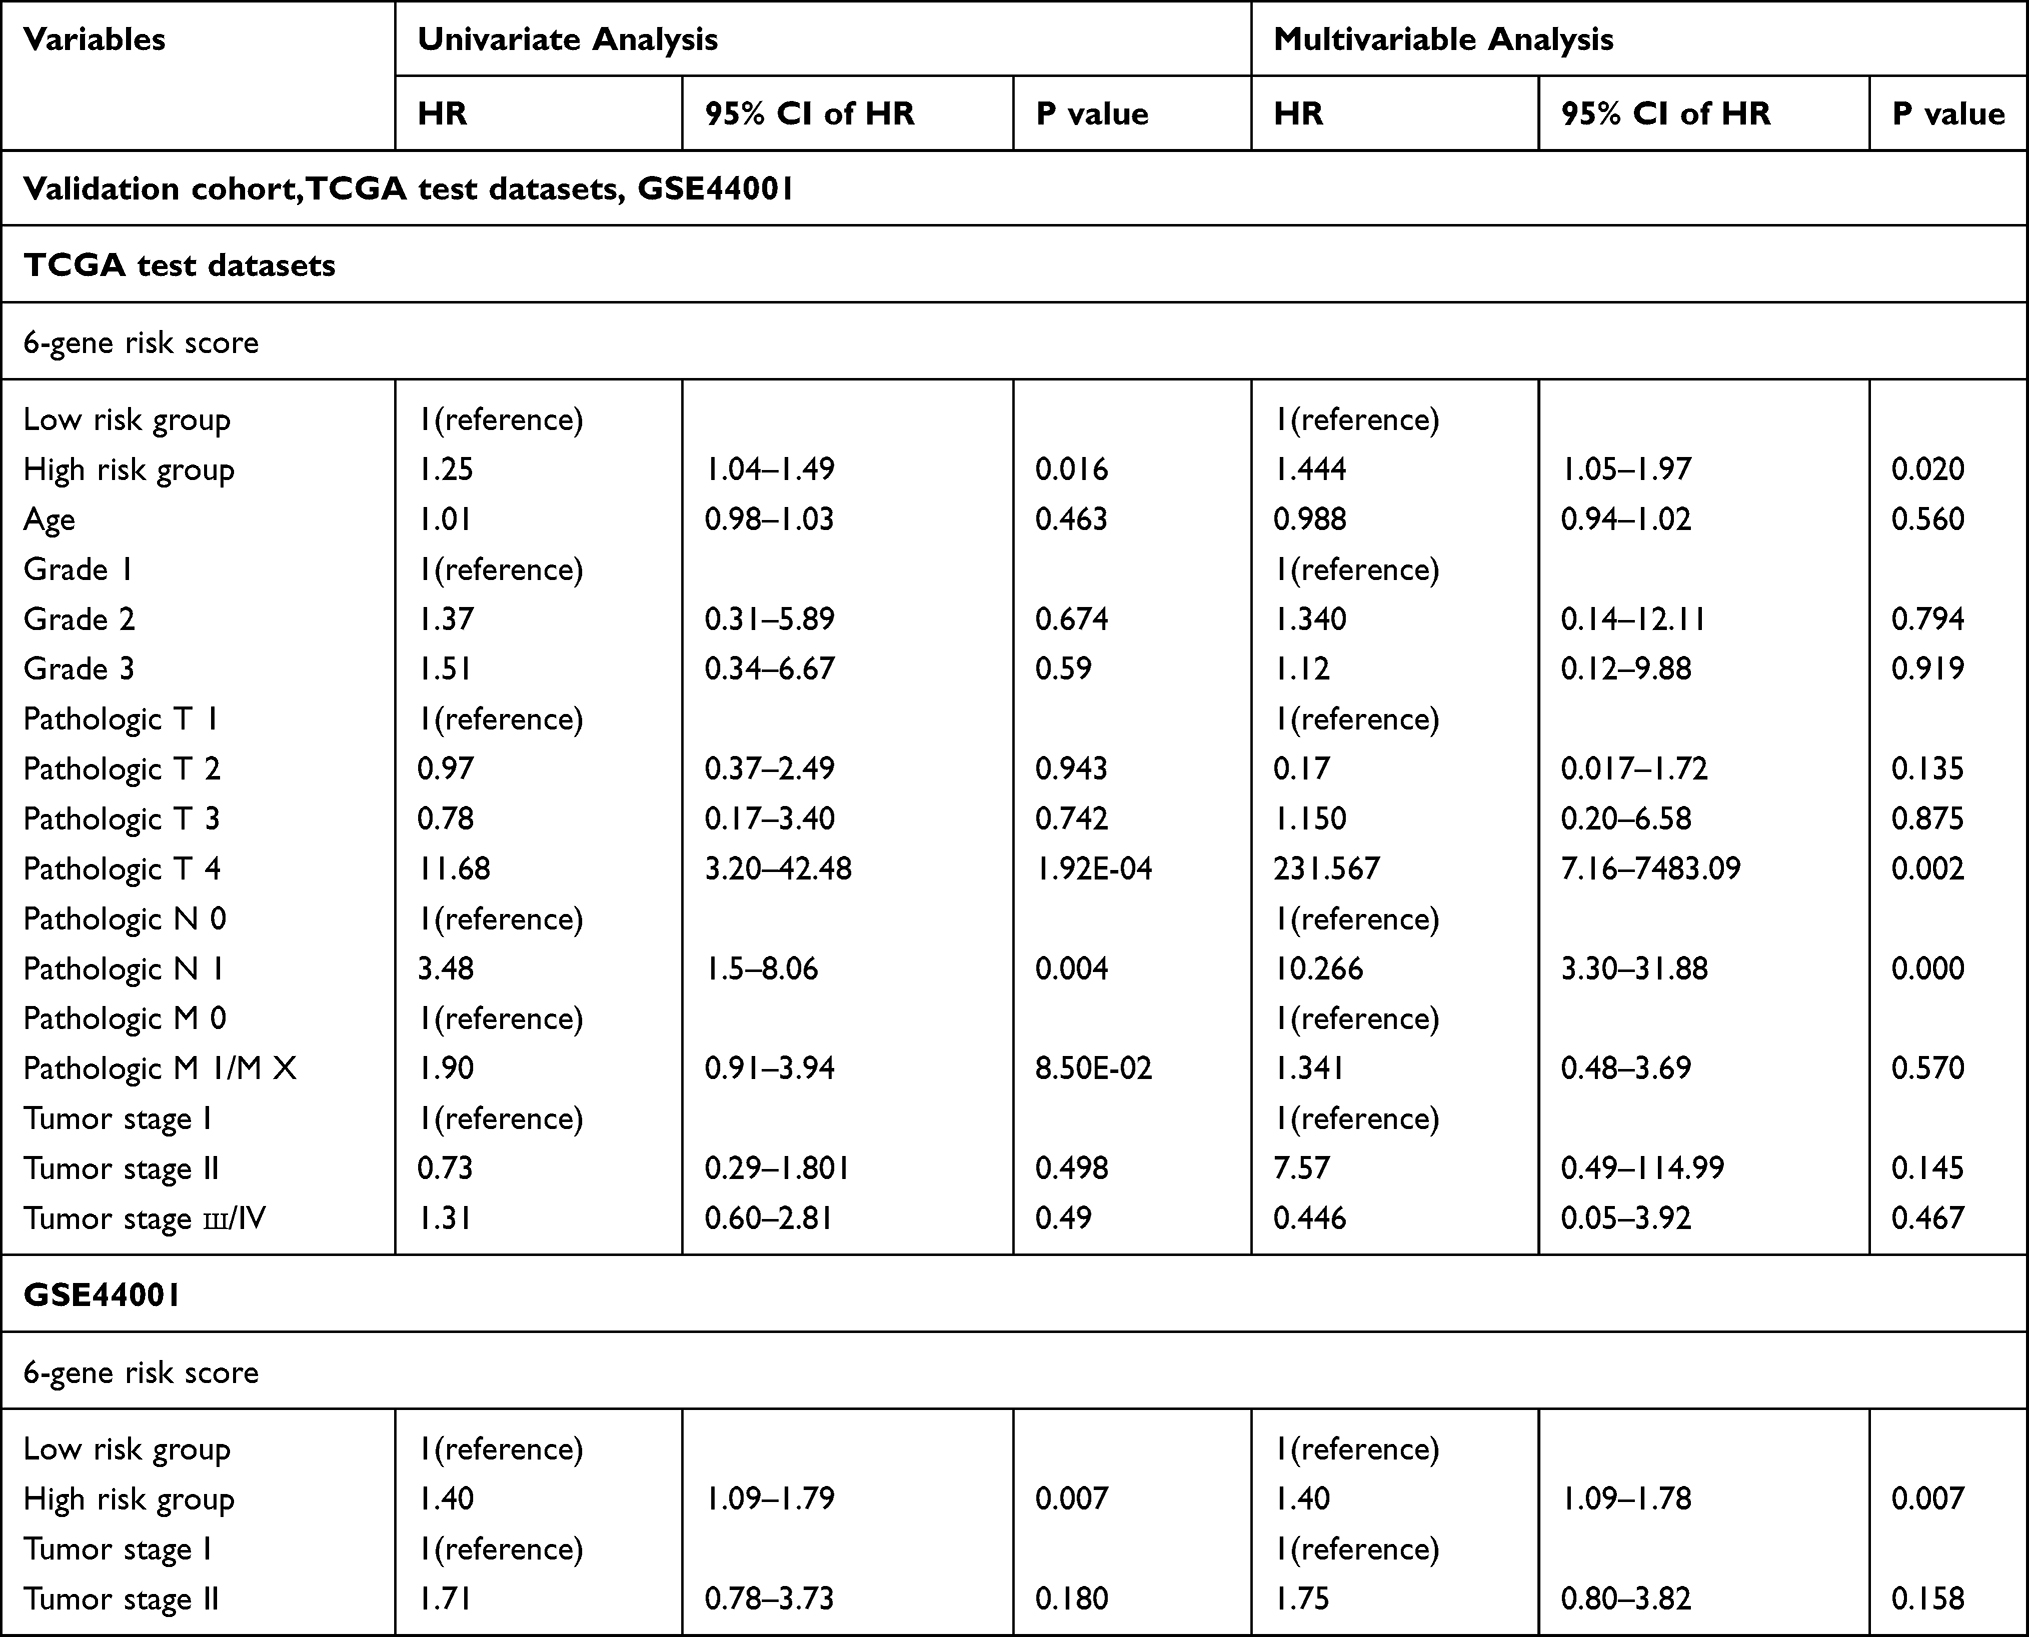 |
Table 3 Univariate and Multivariate Cox Regression Analysis to Verify the Independence of 6-Gene Signature in Test Datasets |
To compare the 6-gene model with existing signatures, we selected several recently reported cervical cancer-related prognostic signatures, such as the 6-gene signature of Chen et al11, the 4-gene signature of mei et al12, and Pan et al13. We used the same method to calculate the risk score of each patient in the TCGA data set, and compared the RiskScore with the 1, 3, and 5-year ROC of these three models, such as Figure S3A–D. It can be observed that the RiskScore is 1, 3 and 5 years have the highest AUC. In addition, comparing the C-index of these four models shows that RiskScore has the highest C-index such as Figure S3E. DCA analysis shows that RiskScore has the highest benefit curve (Figure S3F).
Evaluation of the Prognostic Signature in CSCC by IHC
Table S6 summarizes the characteristics of all patients, including age, disease stage, and tumor grade. The expression of the six genes was evaluated in CSCC by IHC. The differences in CCL17, DES, DPAGT1, FURIN, SLC19A3 and SLC22A3 expression between CC tissues and adjacent normal tissues are shown in Figure 5. The expression of DPAGT1 (53.77 ± 1.84 vs 21.00 ± 3.49, p < 0.001), FURIN (48.55 ± 1.56 vs 28.83 ± 2.39, p < 0.001), SLC19A3 (52.45 ± 1.77 vs 29.67 ± 4.48, p < 0.001) and SLC22A3 (47.16 ± 1.44 vs 25.33 ± 3.32, p < 0.001) was significantly higher in CC tissues than in adjacent cancer tissues. Conversely, CCL17 (26.73 ± 1.65 vs 49.50 ± 3.79, p < 0.001) and DES (30.55 ± 1.50 vs 54.00 ± 2.90, p < 0.01) showed lower expression levels in CC tissues. The correlations between the expression of these genes and CC prognosis are shown in Figure 6. These data reveal that high expression of DPAGT1 (overall survival [OS], HR = 2.469, 95% CI 1.170–4.586, p = 0.016; progression-free survival [PFS], HR = 2.126, 95% CI 1.097–3.851, p = 0.025), FURIN (OS, HR = 2.291, 95% CI 1.158–4.589, p = 0.018; PFS, HR = 1.924, 95% CI 1.035–3.683, p = 0.040), SLC19A3 (OS, HR = 1.908, 95% CI 0.979–4.178, p = 0.058; PFS, HR = 1.993, 95% CI 1.093–4.184, p = 0.027) and SLC22A3 (OS, HR = 2.272, 95% CI 1.147–4.544, p = 0.019; PFS, HR = 2.113, 95% CI 1.135–4.030, p = 0.019) and low expression of CCL17 (OS, HR = 2.396, 95% CI 1.252–5.180, p = 0.010; PFS, HR = 2.102, 95% CI 1.132–4.157, p = 0.020) and DES (OS, HR = 2.179, 95% CI 1.079–4.231, p = 0.030; PFS, HR = 1.981, 95% CI 1.049–3.687, p = 0.036) is associated with a poor prognosis in patients with CC.
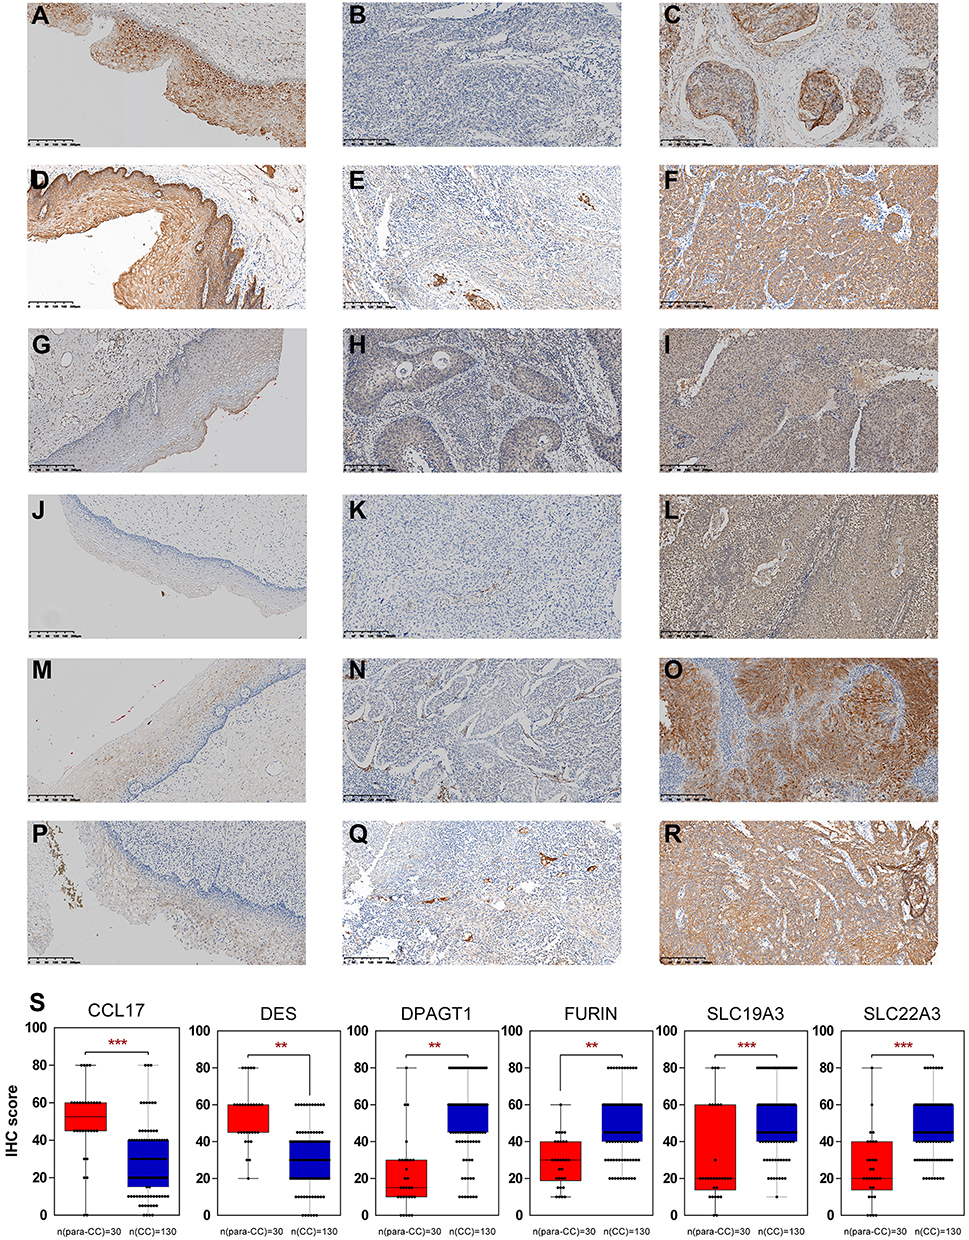 |
Figure 5 IHC for CCL17, DES, DPAGT1, FURIN, SLC19A3 and SLC22A3. CC-adjacent tissue (N=30) and CC tissue (N=130) samples. CC-adjacent tissue samples with weak immunostaining scores for DPAGT1 (G), FURIN (J), SLC19A3 (M), and SLC22A3 (P) and strong immunostaining scores for CCL17 (A) and DES (D). CC samples with weak and strong immunostaining scores for CCL17 (B and C), DES (E and F), DPAGT1 (H and I), FURIN (K and L), SLC19A3 (N and O) and SLC22A3 (Q and R). The expression of the CCL17, DES, DPAGT1, FURIN, SLC19A3 and SLC22A3 genes is depicted in S slides (X 100). **p < 0.01, ***p < 0.001. |
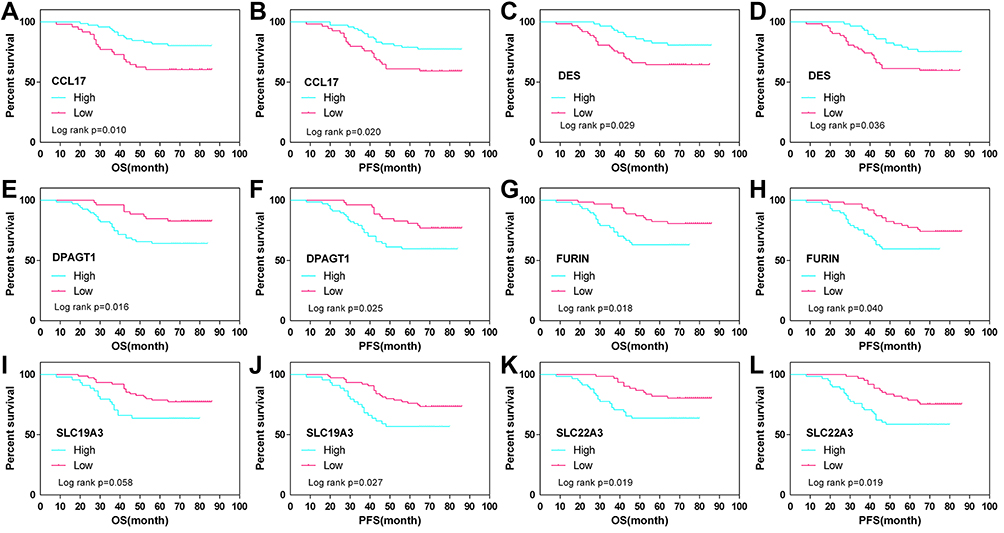 |
Figure 6 OS and PFS curves for CC (N=130) according to CCL17 (A and B), DES (C and D), DPAGT1 (E and F), FURIN (G and H), SLC19A3 (I and J) and SLC22A3 (K and L) gene expression status (low or high). The expression status for each sample was classified according to the median gene expression value. |
Discussion
There were estimated 569,800 new CC cases and 311,400 CC-related deaths worldwide in 2018.14 Nearly 90% of CC-related deaths occur in developing parts of the world. In several Western countries, where screening programs have long been established, CC incidence rates have decreased by as much as 65% over the past 40 years. However, in contrast to the favorable overall trends, the CC incidence rate is reported to be rising in Uganda and in some countries of Eastern Europe (Estonia, Lithuania, and Bulgaria).15 Although increasingly preventable through the use of vaccines and curable through early cytological detection, women with the advanced or recurrent disease face a dismal prognosis with a potentially considerable risk of morbidity and mortality.16 CC treatment and prognostic prediction remain a major challenge. Heterogeneity is evident in the data regarding OS, PFS and local recurrence.17 If tumor behavior can be reliably predicted at the initial diagnosis, the prognosis of CSCC would probably be greatly improved. Therefore, it is critical to investigate the molecular mechanism of CSCC and to identify novel biomarkers.
Some gene signatures, such as multigene signature panels (MSPs), are currently being used in the clinic to evaluate breast cancer recurrence,18 which indicates that screening gene prognostic biomarkers by gene expression profiling is a reliable molecular identification method. Lin et al constructed a prognostic model for CC patients undergoing radiotherapy and chemotherapy with stage IB-IV disease based on magnetic resonance imaging (MRI), the whole-tumor apparent diffusion coefficient (ADC), and HPV genotyping.19 Mao et al developed a 26-IncRNA signature to predict the OS of CSCC patients.20 In our study, we downloaded RNA-seq data, CNV data and MAF data for the CC samples from the TCGA database and divided them into a training dataset (N=146) and a test dataset (N=147). By analyzing the CNV data and mutation data of the training set, potential genes related to the occurrence and development of CC were obtained, and the transcriptome data were used to screen for biomarkers related to the prognosis of CC. Subsequently, the two sets of results were integrated. The prognostic signature model was determined by applying the random survival forest algorithm to the overlapping results. A 6-gene model was constructed, and the test dataset and external dataset (GSE44001) further verified that it was robust. The 6-gene signature has a higher AUC and fewer genes than the existing signature, which might be conducive to its clinical application.
In our 6-gene signature, DPAGT1, FURIN, SLC19A3 and SLC22A3 were verified to be risk factors, while CCL17 and DES were verified to be protective factors. Some previous studies have revealed the association between the 6 genes we identified and the pathogenesis of some other cancers. It was reported that CCL17 plays a critical role in preventing tumorigenesis due to its ability to engage CCR4+CD8+ T cells.21–23 Okada et al transfected an RGD fiber-mutant adenoviral vector into the tumors of melanoma-bearing mice and found that recombinant AdRGD-CCL17 induced CD8+ cytotoxic T lymphocyte (CTL) aggregation in the tumor tissue, which effectively inhibited tumor growth.24 In addition, the Naoko team also used tumor-bearing animal experiments to confirm that injecting recombinant CCL17 adenovirus into the tumors of mice with colorectal cancer induces the infiltration of activated CD8+ CTLs and exerts significant antitumor immune function.25 Zhan et al also inoculated CCL17-loaded drug-eluting stents into pancreatic cancer-bearing mice, and locally released CCL17 recruited CCR4+CD8+ T cells to pancreatic tumor tissues, thereby inhibiting the occurrence and metastasis of pancreatic tumors.26 Interestingly, many studies have shown that CCL17 can also stimulate cancer cell proliferation and migration.27,28 However, in the present study, the expression of CCL17 was evaluated in CC tissue, and the results showed that lower expression of CCL17 was associated with a poor prognosis in CC patients.29,30 DES encodes a muscle-specific class III intermediate filament that plays a crucial role in maintaining the structure of sarcomeres, interconnecting Z-disks and forming myofibrils.31 A study revealed that the expression of DES was significantly downregulated in gallbladder carcinogenesis according to its correlation with promoter hypermethylation, which indicates its potential as a candidate biomarker for gallbladder carcinogenesis.32 DES was also demonstrated to inhibit telomerase activity in prostate cancer cells.33 Moreover, previous studies also reported that the DES is a prognostic predictor and therapeutic target for colorectal cancer.34,35 However, there are few studies on DES in CC. In the present study, we demonstrated that DES was significantly downregulated in CC, which was associated with a poor prognosis. DPAGT1 is an upstream regulator of E-cadherin N-glycosylation status and adherens junction composition, and dysregulation of DPAGT1 may cause disturbances in intercellular adhesion in oral cancer.36,37 In 2019, data demonstrated that overexpression of DPAGT1 was significantly associated with a poor chemotherapeutic response in hepatitis B virus-positive hepatocellular carcinoma patients.38 FURIN encodes a member of the subtilisin-like proprotein convertase family, which includes proteases that process protein and peptide precursor trafficking through regulated or constitutive branches of the secretory pathway. Studies have revealed that FURIN is associated with the prognosis of pancreatic cancer,39 laryngeal cancer,40 and lung cancer.41 More importantly, Zhao et al recently proposed a five-mRNA signature to predict recurrence and survival in CC that also included DPAGT1 and FURIN.42 However, the difference is that they only analyzed gene expression in CC, and we performed an integrated analysis of mRNA, CNV and gene mutation data to identify changes that were significantly related to HPV integration. In the present study, we also evaluated the expression of signature genes in more CC tissue by IHC. SLC19A3 is an ubiquitously expressed transmembrane thiamine transporter. It was demonstrated that downregulation of SLC19A3 can inhibit breast cancer metastasis.43 Another study revealed that aberrant SLC19A3 promoter hypermethylation in plasma may be a novel biomarker for breast and gastric cancer diagnosis.44 SLC22A3 is an integral plasma membrane protein located in a cluster on chromosome 6. Xin-Guan et al reported that the expression of SLC22A3 was associated with the early development and progression of familial esophageal cancer.45 The rs2504938 SNP in SLC22A3 significantly influenced the OS of pancreatic cancer patients. Moreover, SLC22A3 was found to play an important role in colorectal cancer development and progression.46
We integrated multiomics data, including transcriptome, CNV data and mutation data, and eventually constructed a 6-gene signature for CC prognosis. The signature was verified to be robust and stable in different datasets. Furthermore, the signature was shown to be optimally independent, even considering the influence of many clinical factors. However, the current study also has several limitations. First, the present study is based on bioinformatics analysis and verified the prognostic of single gene; however, the signature cannot be verified by experimental verification at present; secondly, the value of the 6-gene signature for therapeutic strategies has not been shown in patients’ cohorts, such as immunotherapeutic and chemotherapeutic prediction; Finally, the signature was constructed by the FPKM data, which is widely used in bioinformatics analysis; therefore, further study should strive to transform the signature into clinically applicable models. Therefore, further experimental verification studies are necessary.
Conclusion
In the present study, we constructed a 6-gene signature for CC prognosis based on multiomics data. The predictive value of the signature was further tested in a training dataset and an external independent validation dataset by applying Kaplan–Meier survival curves. The signature shows strong robustness and clinical independence. Therefore, the 6-gene signature can be used as a prognostic assessment tool for CC patients.
Abbreviations
CC, cervical cancer; HPV, human papillomavirus; CSCC, cervical squamous cell carcinoma; SCC, squamous cell antigen; CNV, copy number variation; MAF, mutation annotation file; TCGA, The Cancer Genome Atlas; MAF, mutation annotation file; GO, Gene Ontology; KEGG, Kyoto Encyclopedia of Genes and Genomes; IHC, immunohistochemical staining; HR, hazard risk; ROC, receiver operating characteristic; AUC, area under the curve; MRI, magnetic resonance imaging.
Data Sharing Statement
The datasets used and/or analyzed during the current study are available from the corresponding author upon reasonable request.
Ethics Approval
All procedures performed in studies involving human participants were in accordance with the ethical standards of the institutional and national research committee and with the 1964 Helsinki declaration and its later amendments (the name and affiliation of the ethics committee that approved this study: The Institutional Ethics Committee of Peking Union Medical College Hospital, CAMS Chinese Academy of Medical Sciences, No. S-183 2019).
Acknowledgments
Co-corresponding authors: Keng Shen and Hengzi Sun.
Funding
This study was funded by the National Natural Science Foundation of China [81402140] and [CAMS Innovation Fund for Medical Sciences (CIFMS) CAMS-2017-I2M-1-002] (Shen Keng).
Disclosure
The authors declare that they have no conflicts of interest for this work.
References
1. Bray F, Ferlay J, Soerjomataram I, Siegel RL, Torre LA, Jemal A. Global cancer statistics 2018: GLOBOCAN estimates of incidence and mortality worldwide for 36 cancers in 185 countries. CA Cancer J Clin. 2018;68(6):394–424. doi:10.3322/caac.21492
2. Johnson CA, James D, Marzan A, Armaos M. Cervical cancer: an overview of pathophysiology and management. Semin Oncol Nurs. 2019;35(2):166–174. doi:10.1016/j.soncn.2019.02.003
3. Shen F, Zheng H, Zhou L, Li W, Liu J, Xu X. Identification of CD28 and PTEN as novel prognostic markers for cervical cancer. J Cell Physiol. 2019;234(5):7004–7011. doi:10.1002/jcp.27453
4. Mao X, Qin X, Li L, et al. A 15-long non-coding RNA signature to improve prognosis prediction of cervical squamous cell carcinoma. Gynecol Oncol. 2018;149(1):181–187. doi:10.1016/j.ygyno.2017.12.011
5. Wei Q, Ma C, Zhang W, et al. Identification of a microRNA signature associated with survivability in cervical squamous cell carcinoma. PLoS One. 2018;13(3):e0193625. doi:10.1371/journal.pone.0193625
6. Mermel CH, Schumacher SE, Hill B, Meyerson ML, Beroukhim R, Getz G. GISTIC2.0 facilitates sensitive and confident localization of the targets of focal somatic copy-number alteration in human cancers. Genome Biol. 2011;12(4). doi:10.1186/gb-2011-12-4-r41
7. Jeremy MG, Taylor P. Random survival forests. J Thorac Oncol. 2011;6:1974–1975. doi:10.1097/JTO.0b013e318233d835
8. Yu G, Wang LG, Han Y, He QY. clusterProfiler: an R package for comparing biological themes among gene clusters. OMICS. 2012;16(5):284–287. doi:10.1089/omi.2011.0118
9. Li YL, Ye F, Cheng XD, et al. Identification of glia maturation factor beta as an independent prognostic predictor for serous ovarian cancer. Eur J Cancer (Oxford, England: 1990). 2010;46(11):2104–2118. doi:10.1016/j.ejca.2010.04.015
10. Zhang SF, Wang XY, Fu ZQ, et al. TXNDC17 promotes paclitaxel resistance via inducing autophagy in ovarian cancer. Autophagy. 2015;11(2):225–238. doi:10.1080/15548627.2014.998931
11. Chen H, Deng Q, Wang W, Tao H, Gao Y. Identification of an autophagy-related gene signature for survival prediction in patients with cervical cancer. J Ovarian Res. 2020;13(1):131. doi:10.1186/s13048-020-00730-8
12. Mei J, Xing Y, Lv J, et al. Construction of an immune-related gene signature for prediction of prognosis in patients with cervical cancer. Int Immunopharmacol. 2020;88:106882. doi:10.1016/j.intimp.2020.106882
13. Pan J, Xu L, Pan H. Development and validation of an m6A RNA methylation regulator-based signature for prognostic prediction in cervical squamous cell carcinoma. Front Oncol. 2020;10:1444. doi:10.3389/fonc.2020.01444
14. Ferlay J, Colombet M, Soerjomataram I, et al. Estimating the global cancer incidence and mortality in 2018: GLOBOCAN sources and methods. Int J Cancer. 2019;144(8):1941–1953. doi:10.1002/ijc.31937
15. Torre LA, Bray F, Siegel RL, Ferlay J, Lortet-Tieulent J, Jemal A. Global cancer statistics, 2012. CA Cancer J Clin. 2015;65(2):87–108. doi:10.3322/caac.21262
16. Menderes G, Black J, Schwab CL, Santin AD. Immunotherapy and targeted therapy for cervical cancer: an update. Expert Rev Anticancer Ther. 2016;16(1):83–98. doi:10.1586/14737140.2016.1121108
17. Green JA, Kirwan JM, Tierney JF, et al. Survival and recurrence after concomitant chemotherapy and radiotherapy for cancer of the uterine cervix: a systematic review and meta-analysis. Lancet. 2001;358(9284):781–786. doi:10.1016/S0140-6736(01)05965-7
18. Bhutiani N, Egger ME, Ajkay N, Scoggins CR, Martin RCG, McMasters KM. Multigene signature panels and breast cancer therapy: patterns of use and impact on clinical decision making. J Am Coll Surg. 2018;226(4):406–412.e401. doi:10.1016/j.jamcollsurg.2017.12.043
19. Lin G, Yang L-Y, Lin Y-C, et al. Prognostic model based on magnetic resonance imaging, whole-tumour apparent diffusion coefficient values and HPV genotyping for stage IB-IV cervical cancer patients following chemoradiotherapy. Eur Radiol. 2018;29(2):556–565. doi:10.1007/s00330-018-5651-4
20. Mao Y, Fu Z, Dong L, Zheng Y, Dong J, Li X. Identification of a 26-lncRNAs risk model for predicting overall survival of cervical squamous cell carcinoma based on integrated bioinformatics analysis. DNA Cell Biol. 2019;38(4):322–332. doi:10.1089/dna.2018.4533
21. Inoue H, Iga M, Xin M, et al. TARC and RANTES enhance antitumor immunity induced by the GM-CSF-transduced tumor vaccine in a mouse tumor model. Cancer Immunol Immunother. 2008;57(9):1399–1411. doi:10.1007/s00262-008-0476-7
22. Hirata A, Hashimoto H, Shibasaki C, Narumi K, Aoki K. Intratumoral IFN-α gene delivery reduces tumor-infiltrating regulatory T cells through the downregulation of tumor CCL17 expression. Cancer Gene Ther. 2019;26(9–10):334–343. doi:10.1038/s41417-018-0059-5
23. Semmling V, Lukacs-Kornek V, Thaiss CA, et al. Alternative cross-priming through CCL17-CCR4-mediated attraction of CTLs toward NKT cell-licensed DCs. Nat Immunol. 2010;11(4):313–320. doi:10.1038/ni.1848
24. Okada N, Sasaki A, Niwa M, et al. Tumor suppressive efficacy through augmentation of tumor-infiltrating immune cells by intratumoral injection of chemokine-expressing adenoviral vector. Cancer Gene Ther. 2006;13(4):393–405. doi:10.1038/sj.cgt.7700903
25. Nishioka M, Tanemura A, Yang L, Tanaka A, Arase N, Katayama I. Possible involvement of CCR4+ CD8+ T cells and elevated plasma CCL22 and CCL17 in patients with rhododenol-induced leukoderma. J Dermatol Sci. 2015;77(3):188–190. doi:10.1016/j.jdermsci.2015.02.014
26. Zhan Q, Shen B, Fang Y, et al. Drug-eluting scaffold inhibited in vivo pancreatic tumorigenesis by engaging murine CCR4(+)CD8(+) T cells. Colloids Surf B Biointerfaces. 2017;158:469–473. doi:10.1016/j.colsurfb.2017.07.021
27. Liu LB, Xie F, Chang KK, et al. Chemokine CCL17 induced by hypoxia promotes the proliferation of cervical cancer cell. Am J Cancer Res. 2015;5(10):3072–3084.
28. Li J, Yang C, Yang J, Zou L. Down-regulation of CCL17 in cancer-associated fibroblasts inhibits cell migration and invasion of breast cancer through ERK1/2 pathway. Cancer Manag Res. 2019;11:7439–7453. doi:10.2147/CMAR.S211651
29. Al-haidari AA, Syk I, Jirström K, Thorlacius H. CCR4 mediates CCL17 (TARC)-induced migration of human colon cancer cells via RhoA/Rho-kinase signaling. Int J Colorectal Dis. 2013;28(11):1479–1487. doi:10.1007/s00384-013-1712-y
30. Al-Haidari AA, Syk I, Thorlacius H. HMG-CoA reductase regulates CCL17-induced colon cancer cell migration via geranylgeranylation and RhoA activation. Biochem Biophys Res Commun. 2014;446(1):68–72. doi:10.1016/j.bbrc.2014.02.078
31. Hnia K, Ramspacher C, Vermot J, Laporte J. Desmin in muscle and associated diseases: beyond the structural function. Cell Tissue Res. 2015;360(3):591–608. doi:10.1007/s00441-014-2016-4
32. Bhunia S, Barbhuiya MA, Gupta S, Shrivastava BR, Tiwari PK. Epigenetic downregulation of desmin in gall bladder cancer reveals its potential role in disease progression. Indian J Med Res. 2020;151(4):311–318. doi:10.4103/ijmr.IJMR_501_18
33. Geier R, Adler S, Rashid G, Klein A. The synthetic estrogen diethylstilbestrol (DES) inhibits the telomerase activity and gene expression of prostate cancer cells. Prostate. 2010. doi:10.1002/pros.21166
34. Arentz G, Chataway T, Price TJ, et al. Desmin expression in colorectal cancer stroma correlates with advanced stage disease and marks angiogenic microvessels. Clin Proteomics. 2011;8(1):16. doi:10.1186/1559-0275-8-16
35. Wang Y, Li Y, Chen Z. The evaluation of colorectal cancer risk in serum by anti-DESMIN-conjugated CdTe/CdS quantum dots. Clin Lab. 2017;63(3):579–586. doi:10.7754/Clin.Lab.2016.161005
36. Nita-Lazar M, Noonan V, Rebustini I, Walker J, Menko AS, Kukuruzinska MA. Overexpression of DPAGT1 leads to aberrant N-glycosylation of E-cadherin and cellular discohesion in oral cancer. Cancer Res. 2009;69(14):5673–5680. doi:10.1158/0008-5472.CAN-08-4512
37. Jamal B, Sengupta PK, Gao ZN, et al. Aberrant amplification of the crosstalk between canonical Wnt signaling and N-glycosylation gene DPAGT1 promotes oral cancer. Oral Oncol. 2012;48(6):523–529. doi:10.1016/j.oraloncology.2012.01.010
38. Li R, Xu T, Wang H, et al. Dysregulation of the miR-325-3p/DPAGT1 axis supports HBV-positive HCC chemoresistance. Biochem Biophys Res Commun. 2019;519(2):358–365. doi:10.1016/j.bbrc.2019.08.116
39. Zhou YZM, Wei H, Zhou H, He J, Lu Y. Furin promotes epithelial-mesenchymal transition in pancreatic cancer cells via Hippo-YAP pathway. Int J Oncol. 2017;50:1352–1362. doi:10.3892/ijo.2017.3896
40. Lee M, Ryu CH, Chang HW, Kim GC, Kim SW, Kim SY. Radiotherapy-associated furin expression and tumor invasiveness in recurrent laryngeal cancer. Anticancer Res. 2016;36(10):5117–5126. doi:10.21873/anticanres.11081
41. Bassi DE, Zhang J, Renner C, Klein-Szanto AJ. Targeting proprotein convertases in furin-rich lung cancer cells results in decreased in vitro and in vivo growth. Mol Carcinog. 2017;56(3):1182–1188. doi:10.1002/mc.22550
42. Ju M, Qi A, Bi J, et al. A five-mRNA signature associated with post-translational modifications can better predict recurrence and survival in cervical cancer. J Cell Mol Med. 2020;24(11):6283–6297. doi:10.1111/jcmm.15270
43. Shin IWCVY, Siu MT, Tsang JY, et al. Association of EP2 receptor and SLC19A3 in regulating breast cancer metastasis. Am J Cancer Res. 2015;5(11):3389–3399.
44. Ng EK, Leung CP, Shin VY, et al. Quantitative analysis and diagnostic significance of methylated SLC19A3 DNA in the plasma of breast and gastric cancer patients. PLoS One. 2011;6(7):e22233. doi:10.1371/journal.pone.0022233
45. Fu L, Qin YR, Ming XY, et al. RNA editing of SLC22A3 drives early tumor invasion and metastasis in familial esophageal cancer. Proc Natl Acad Sci U S A. 2017;114(23):E4631–e4640. doi:10.1073/pnas.1703178114
46. Ren A, Sun S, Li S, et al. Genetic variants in SLC22A3 contribute to the susceptibility to colorectal cancer. Int J Cancer. 2019;145(1):154–163. doi:10.1002/ijc.32079
 © 2021 The Author(s). This work is published and licensed by Dove Medical Press Limited. The full terms of this license are available at https://www.dovepress.com/terms.php and incorporate the Creative Commons Attribution - Non Commercial (unported, v3.0) License.
By accessing the work you hereby accept the Terms. Non-commercial uses of the work are permitted without any further permission from Dove Medical Press Limited, provided the work is properly attributed. For permission for commercial use of this work, please see paragraphs 4.2 and 5 of our Terms.
© 2021 The Author(s). This work is published and licensed by Dove Medical Press Limited. The full terms of this license are available at https://www.dovepress.com/terms.php and incorporate the Creative Commons Attribution - Non Commercial (unported, v3.0) License.
By accessing the work you hereby accept the Terms. Non-commercial uses of the work are permitted without any further permission from Dove Medical Press Limited, provided the work is properly attributed. For permission for commercial use of this work, please see paragraphs 4.2 and 5 of our Terms.