")
Back to Journals » International Journal of General Medicine » Volume 15
Identification of a Pyroptosis-Related Gene Signature and Effect of Silencing the CHMP4C and CASP4 in Pancreatic Adenocarcinoma
Received 21 December 2021
Accepted for publication 8 March 2022
Published 19 March 2022 Volume 2022:15 Pages 3199—3213
DOI https://doi.org/10.2147/IJGM.S353849
Checked for plagiarism Yes
Review by Single anonymous peer review
Peer reviewer comments 2
Editor who approved publication: Dr Scott Fraser
Yajun Chen, Yiming Liu, Menghao Wang
Department of Hepatobiliary Surgery, the Second Affiliated Hospital of Chongqing Medical University, Chongqing, People’s Republic of China
Correspondence: Menghao Wang; Yiming Liu, Email [email protected]; [email protected]
Background: Pancreatic adenocarcinoma (PAAD) is a highly malignant tumor with an extremely poor prognosis. Pyroptosis has been demonstrated to play an important role in tumor prognosis. However, the expression of pyroptosis-related genes in PAAD and their correlations with prognosis remains unclear.
Methods: In this study, the 36 pyroptosis-related genes that were differentially expressed between normal pancreatic tissues and PAAD tissues were identified via the “limma” R package. Based on these differentially expressed genes (DEGs), a five-gene signature was established by applying the least absolute shrinkage and selection operator Cox regression in the TCGA cohort and was validated in the GEO cohort. The Gene Ontology and Kyoto Encyclopedia of Genes and Genomes analyses of DEGs based on the risk model indicated that immune-associated biological processes and pathways were enriched. In vivo, we detected the expressions of CASP4 and CHMP4C by immunohistochemistry in tumor tissues and adjacent normal tissues. In vitro, we silenced CASP4 and CHMP4C to explore their effects on pancreatic cancer cells.
Results: PAAD patients in the low-risk group showed significantly higher survival possibilities than those in the high-risk group. The expressions of CASP4 and CHMP4C in tumor tissue were higher than those in the adjacent normal tissues in vivo. The knockdown of CASP4 significantly inhibited the invasion and migration but not the proliferation of PANC-1 cells. The knockdown of CHMP4C obviously inhibited the proliferation, migration, and invasion of PANC-1 cells.
Conclusion: Pyroptosis-related genes play important roles in predicting the prognosis of PAAD, and CASP4 and CHMP4C affect the metastasis of PAAD.
Keywords: pancreatic adenocarcinoma, pyroptosis, signature, prognosis, CASP4, CHMP4C
Introduction
Pancreatic adenocarcinoma (PAAD) is one of the most lethal malignant tumors, which is characterized by late diagnosis, limited treatment success, and dismal prognosis.1 The incidence and mortality rate of PAAD patients has continued to increase in recent years.2 The five-year survival rate (merely 10%) which is much lower than that of other tumors reveals the serious treatment challenges associated with pancreatic cancer. Approximately 80–85% of patients cannot undergo resection because of local invasion and early metastasis of PAAD at the time of definitive diagnosis. Another small proportion of patients who are diagnosed with a localized, resectable tumor still have a poor prognosis, and the five-year survival rate is only 20% after surgery.3 Furthermore, immunotherapeutic strategies concluding immune-checkpoint inhibition have yielded limited effect in treating PAAD owing to its distinctive tumor microenvironment (TME) with high heterogeneity, which shows crosstalks with the subpopulations of neoplastic cells that include cancer stem cells.4,5 Therefore, it is important to identify potential therapeutic targets for PAAD treatment, and bioinformatics-based therapy may play a major role in this.
Pyroptosis—a novel non-apoptotic form of programmed cell death primarily triggered by inflammasomes and executed by caspases (caspase-1/-3/-4/-5/-8/-11) and the gasdermin protein family—is the outcome of complete apoptosis; hence, it is also called secondary necrosis.6–9 In the canonical pathways of pyroptosis, a series of pathogen-associated molecular patterns (PAMPs) or danger-associated molecular patterns (DAMPs) overactive the inflammasome to activate caspase 1 that, in turn, promotes the maturation of interleukin-1 beta (IL-1β) and interleukin-18 (IL-18) and simultaneously cleaves the gasdermin D (GSDMD) protein into two fragments (N-terminal domain and C-terminal domain).10,11 Moreover, the N-terminal-induced membrane pores further promote the release of inflammatory factors and cell membrane rupture and ultimately lead to pyroptosis.12,13 In the noncanonical pathways of pyroptosis, caspase-4/5 (caspase 11 in mice) activated by lipopolysaccharide (LPS) cleaves the GSDMD and further induces membrane pore formation, IL-1β maturation and release, cell membrane rupture, and eventually pyroptosis.14,15
Recently, many researchers have highlighted the correlation between pyroptosis and its role in the modulation of cancer progression. Gao et al showed that upregulation of GSDMD in nonsmall-cell lung cancer (NSCLC) promotes aggressive traits including larger tumor size and more advanced tumor-node-metastasis (TNM) stages, which indicate a poor prognosis.16 However, pyrolysis induced by NOD-like receptor family pyrin domain-containing 3 (NLRP3) significantly inhibits tumor metastasis and proliferation in hepatocellular carcinoma.17 Pyroptosis plays the role of a double-edged sword in tumors and had hence gained increasing attention. Researchers have found that pyrolysis-associated genes are closely related to prognostic progress in glioblastoma, renal cell carcinoma, breast cancer, head, and neck squamous cell carcinoma, and lung adenocarcinoma.18–22 While pyroptosis-associated genes play a significantly important role in oncogenesis and prognostic processes, there is limited data on the importance of pyroptosis in PAAD. Hence, we developed a risk score model for predicting prognosis via least absolute shrinkage and selection operator (LASSO) Cox analysis.
Materials and Methods
Datasets
The normalized RNA sequencing (RNA-seq) expression data as transcripts per million (TPM) and corresponding clinical information of 182 PAAD samples were obtained from The Cancer Genome Atlas (TCGA) database (https://xenabrowser.net/datapages/, until Sep 01, 2021). Thirty-one samples were rejected from our study based on the merged sample quality annotations (https://gdc.cancer.gov/about-data/publications/pancanatlas). The normalized RNA-seq data as TPM of 168 normal pancreas samples were collected from the Genotype-Tissue Expression (GTEx) database (https://xenabrowser.net/datapages/, until Sep 01, 2021). The RNA-seq data and clinical information of 49 PAAD samples from the GSE78229 dataset were downloaded from the GEO database (https://www.ncbi.nlm.nih.gov/geo) as a validation cohort. One patient was rejected from our study based on insufficient clinical data. All RNA-seq data were log2-transformed for further analysis.
Identification of Pyroptosis-Associated Differentially Expressed Genes
As shown in Table S1, the 52 pyroptosis-associated genes were obtained from GSEA (http://www.gsea-msigdb.org/gsea/index.jsp) and previous research.22 The DEGs of 168 normal pancreas samples from the GTEx database and 151 PAAD samples from the TCGA database were identified via the “limma” R package. |Log2FC|>1 and P value <0.05 (the adjusted p-value via the BH method) were considered statistically significant. The pyroptosis-associated DEGs were selected through the “VennDiagram” package, and their PPI network was obtained from Search Tool for the Retrieval of Interacting Genes (STRING) (https://www.string-db.org/, version 11.5). The consensus clustering analysis of 151 PAAD patients in the TCGA cohort was constructed via the “ConsensusClusterPlus” package.
Constitution and Validation of the Prognostic Model for Pyroptosis-Associated Differentially Expressed Genes
First, we performed univariate Cox proportional hazards regression analysis to identify which gene was closely associated with the survival status of PAAD patients in the TCGA-PAAD cohort. The six genes, namely IL18, CHMP2B, CHMP4A, CHMP4C, CHMP3, and CASP4 with P value <0.2 were identified as the survival-associated genes. Then, the most suitable number of DEGs was selected via using 10-fold cross-validation of the LASSO-penalized Cox regression analysis in the “glmnet” R package. Then, the prognostic model was developed based on the five genes (IL18, CHMP2B, CHMP4A, CHMP4C, and CASP4) and their coefficients, and the penalty parameter (λ) was decided by the minimum criteria. The risk score of each patient was calculated according to regression coefficients derived from the LASSO-Cox regression model multiplied with its gene expression level, as follows: Risk score= (X: coefficients, Y: gene expression level). The 151 patients were divided into low and high pyroptosis risk groups based on the median risk score, and the overall survival (OS) time was compared between the two groups by using Kaplan–Meier analysis. The area under the curve (AUC) of the receiver operating characteristic (ROC) curve based on the “survival,” “survminer,” and “time-ROC” R packages was used to evaluate the performance of the prognostic model. The risk score of each patient in the GSE79668 cohort was obtained via the same formula used for the TCGA cohort. The Kaplan–Meier analysis and area under the curve (AUC) of the receiver operating characteristic (ROC) curve were used to verify the performance of the prognostic model.
Identification of Independent Prognostic Analysis
To identify independent prognostic factors and validate the independent prognostic value of the risk score, the risk score and the clinicopathological factors including age, sex, TNM stage, smoking and drinking histories, and diabetes in the TCGA and GSE78229 datasets were analyzed via univariate and multivariate Cox regression models.
Functional Enrichment Analysis of the DEGs Between the Low-Risk and High-Risk Groups
The DEGs between the low-risk and high-risk groups divided by the median risk score were identified via the “limma” R package. |Log2FC|>1 and P<0.05 were considered to indicate statistically significant differences. The Gene Ontology (GO) and Kyoto Encyclopedia of Genes and Genomes (KEGG) enrichment analyses of those DEGs were performed via the “clusterProfiler” R package.
Evaluation of Immune Cells and Immune Pathways
The PAAD patients in the TCGA cohort were classified according to the median risk score into two groups. The “gsva” package was used to perform single-sample gene set enrichment analysis (ssGSEA) to calculate the scores of infiltrating immune cells and evaluate the activity of immune-related pathways. Differences in immune scores for immune cells and immune pathways in the two groups were calculated by the “limma” package.
CASP4 and CHMP4C siRNA Transfection
PAAD cells (PANC-1) were plated in 6-well plates with complete medium (DMEM containing 10% FPS and 100 U/mL streptomycin/penicillin) and allowed to reach 50% confluence by the time of transfection. PANC-1 cells were then infected with CASP4 or CHMP4C small interfering RNA (siRNA) for 4 h in DMEM without serum. In addition, PANC-1 cells were cultured for 48 h after replacing the serum-free medium with complete medium. The CASP4 and CHMP4C siRNA were obtained from GenePharma Company Ltd. (Shanghai, China). The primer sequences are shown in Table S2.
Quantitative RT-PCR
An RNA-Quick Purification Kit (YiShan Biotech) was used to extract RNA, the purity and concentration of which were measured with an ultramicrospectro-photometer. Complementary DNA (cDNA) was synthesized using 1 µg of total RNA by first-strand cDNA synthesis with RT Master Mix for qPCR (MCE). Reverse transcription-PCR (RT-PCR) was performed using the CFX 96 qPCR system (Bio-Rad). An SYBR RT-PCR kit (MCE) was used for qRT-PCR analysis. All samples were normalized according to β-actin expression. The primer sequences are presented in Table S2. The results were statistically analyzed using the 2−ΔΔCT method.
Western Blotting
Cells in a Petri dish were washed with PBS three times, after which RIPA lysis buffer and protease and phosphatase inhibitor cocktails were added to the Petri dish. The cells were collected by scraping and lysed on ice for 20 minutes. Then, the lysate was centrifuged at 12,000 rpm and 4 °C for 15 minutes. In addition, the supernatant was aspirated and added to a 1/4 volume of loading buffer. The supernatant was heated at 100 °C for 10 minutes. After the gel had been equilibrated, samples containing equal amounts of protein were added to each well. The protein samples were electrophoresed for 120 minutes at a constant voltage of 80 volts. Then, the protein samples were transferred to a PVDF membrane at a constant current of 250 mA. Then, the PVDF membrane was blocked with bovine serum albumin (BSA) for 60 minutes at room temperature. The PVDF membrane was incubated with primary antibody overnight at 4°C and then washed with PBS for 10 minutes three times. After the excess primary antibody had been washed off, the PVDF membrane was incubated with the secondary antibody for 1 h at room temperature and washed with PBS for 10 minutes three times to wash off the excess secondary antibody. Finally, the PVDF membrane was covered with ECL working solution and analyzed by Image Lab Touch Software upon exposure.
Cell Proliferation
The 2000 PANC-1 cells (purchased from Procell) were seeded into 96-well plates and cultured with complete medium in 5% CO2. Then, we assessed the cell viability of PANC-1 cells on days 1, 2, 3, and 4 after being cocultured with CCK-8 for 2 h. The absorbance at 450 nm was measured via a microplate reader. The CCK-8 kit was obtained from GlpBio Company Ltd. (Shanghai, China).
Transwell Assay
The transwell assays were performed in Boyden chambers and placed in 24-well cell culture plates, with pore sizes of 8 μm in polycarbonate membranes. Boyden chambers with a pre-coated layer of basement membrane matrix were used for the invasion assay, and those without a coated matrix were used for the migration assay. After transfection for 48 h, 1×10⁵ PANC-1 cells were added to the upper chamber with 200 μL serum-free medium, and 500 μL 20% FBS-containing medium used as the chemical attractant was added to the lower chamber. After incubation for 24 h, the remaining cells in the upper chamber were removed using the cotton swab. Paraformaldehyde (4%) was used to fix the cells in the bottom membrane, and the 0.1% crystal violet was used for cell staining. The fields were randomly selected on an inverted light microscope (100× magnification), and the cell numbers were counted using ImageJ software.
Immunohistochemical Staining
Paraffin sections were placed in a 60°C oven to melt the paraffin and soaked in xylene and ethanol at different concentrations to elute the paraffin. Then, the sections were incubated with 3% H2O2 at room temperature for 10 minutes to eliminate endogenous peroxidase activity. The sections were immersed in boiling EDTA repair solution for 10 minutes and allowed to cool naturally. Then, the sections were incubated with 5% BSA blocking solution at 37°C for 30 minutes. The sections were incubated with appropriately diluted CHMP4C (Abcam, ab272638) and CASP4 (ABclonal Technology, A19305) primary antibody at 4°C overnight. The next day, the sections were washed with PBS for 10 minutes three times. The sections were incubated with secondary antibodies at room temperature for 60 minutes. After washing with PBS for 10 minutes three times, the tissues were stained with DAB and hematoxylin. Then, the sections were sequentially immersed in 60%, 75%, 80%, 95%, and 100% ethanol for dehydration. Finally, the sections were sealed with neutral gum and observed with a light microscope.
Statistical Analysis
The DEGs between the normal pancreas and PAAD tissues were analyzed with Single-factor analysis. The Kaplan–Meier method with a two-sided Log rank test was utilized to compare the OS of patients between the two groups. The univariate and multivariate Cox regression models were applied to validate the independent prognostic value of the risk model. All statistical analyses were completed by R software (v4.1.0). GraphPad Prism was used to test differences between groups with normally distributed data using the Student’s t-test, the results of which were shown as mean±SD. P<0.05 was considered to indicate statistically significant differences.
Results
The Pyroptosis-Associated DEGs in PAAD Patients
The 9192 DEGs (|Log2FC|>1 and P<0.05) that contained 8732 enriched genes and 460 downregulated genes in the tumor group, between 168 normal and 151 tumor tissues from the pooled GTEx, and TCGA data were identified through the “limma” package (Table S3). To further explore whether pyrolysis-related genes are differentially expressed in pancreatic cancer, 52 pyrolysis-related genes downloaded from GSEA were intersected with the above differential genes through the “VennDiagram” package. We found that 36 pyroptosis-associated genes (BAK1, BAX, CASP1, CASP3, CASP4, CASP6, CASP8, CHMP2A, CHMP2B, CHMP3, CHMP4A, CHMP4B, CHMP4C, CHMP6, CHMP7, CYCS, GPX4, GSDMB, GSDMD, GZMA, GZMB, HMGB1, IL18, IL1B, IL6, IRF1, IRF2, NLRP1, NLRP3, NOD1, NOD2, PLCG1, PRKACA, PYCARD, SCAF11, and TP53) were differentially expressed in pancreatic cancer. As the heatmaps show (Figure 1A blue: low expression level; red: high expression level), all of them are up-regulated in the tumor group, which indicates that pyrolysis occurs at a high rate in pancreatic cancer. We established a protein-protein interaction (PPI) network to investigate the interactions of these pyroptosis-related genes, as shown in Figure 1B.
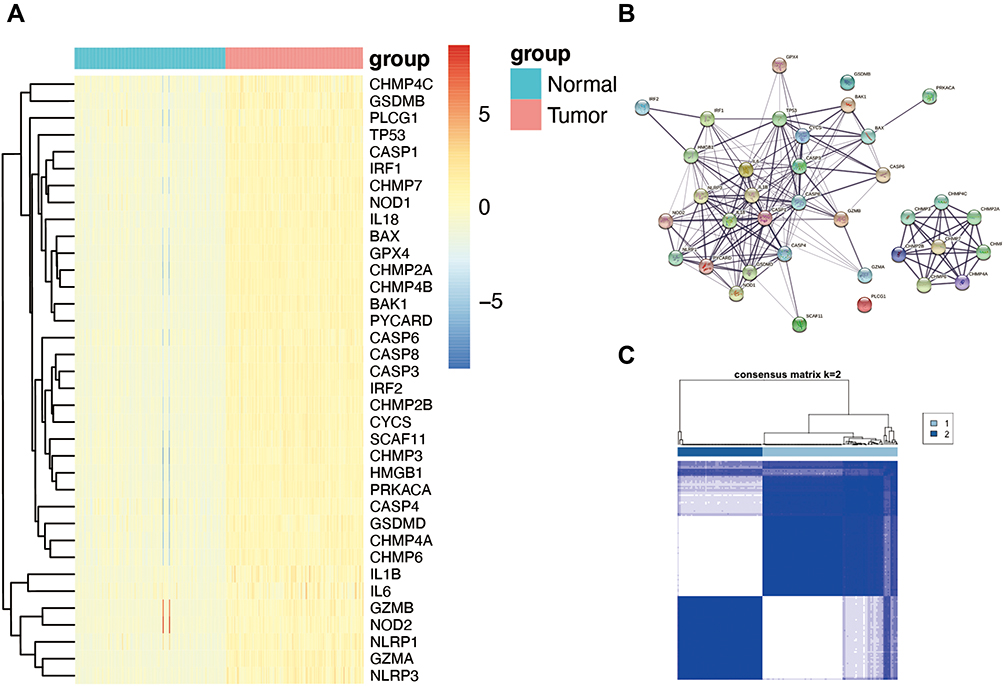 |
Figure 1 Expression of the 36 pyroptosis-associated genes and tumor classification based on them. (A) The expression of the pyroptosis-associated genes between the normal and tumor tissues (blue: low expression level; red: high expression level). (B) The PPI network among the 36 pyroptosis-associated genes (interaction score=0.4). (C) The tumor classification of 151 PAAD patients based on the consensus clustering matrix (k=2). |
The consensus clustering analysis of 151 PAAD patients in the TCGA cohort was constructed to explore the connections between the expression of the 36 pyroptosis-associated DEGs and PAAD subtypes. As seen in Figure 1C, the 151 PAAD patients could be well divided into two clusters based on the 36 DEGs.
Establishment of the Five-Gene Prognostic Risk Model
To establish a prognostic model of pyroptosis-associated genes, univariate Cox regression analysis was used for primary screening of the survival-related genes. The six genes—CHMP2B, CHMP4C, CASP4, IL18, CHMP4A, and CHMP3—were selected for further analysis based on the criteria of P<0.2. Of these, CHMP2B, CHMP4C, CASP4, IL18, and CHMP3 were associated with increased risk with HRs >1, while the CHMP4A gene was a protective gene with HRs <1 (Figure 2A). In the following LASSO Cox regression analysis, a 5-gene (CHMP2B, CHMP4C, CASP4, IL18, and CHMP4A) prognostic model was constructed based on the optimum λ value (Figure 2B and C). The risk score was calculated as follows:
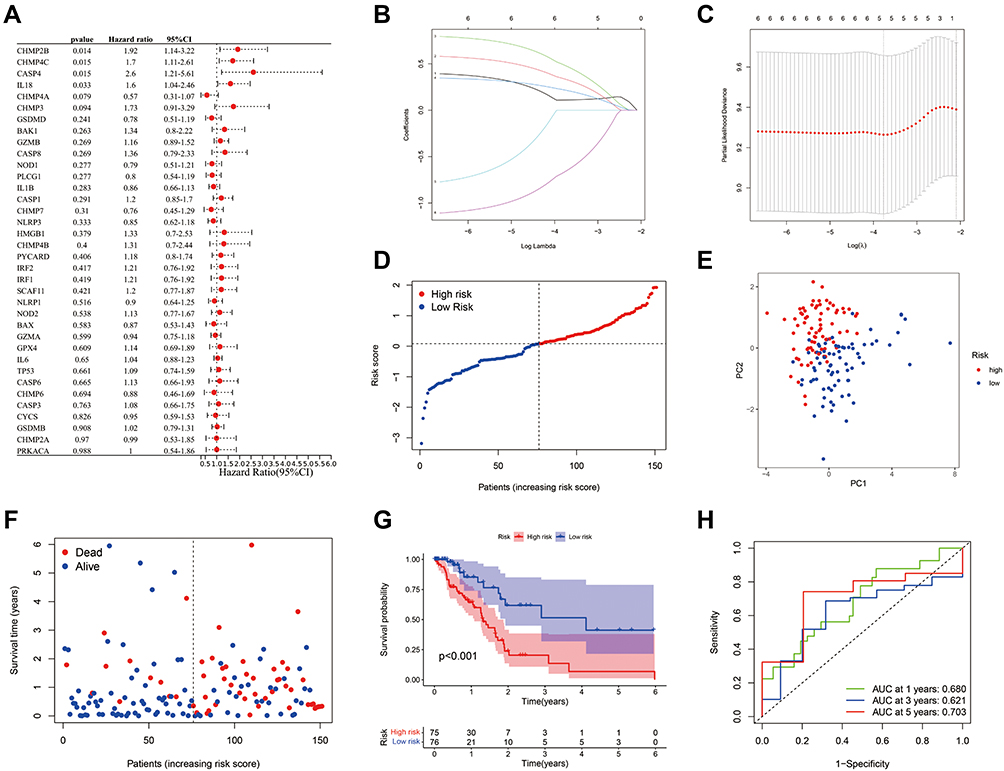 |
Figure 2 Establishment and prognostic efficacy of the prognostic risk model. (A) The OS time of 36 pyroptosis-associated genes and six genes with P<0.2 was analyzed via Univariate Cox regression analysis. (B) LASSO regression of the six OS-related genes. (C) Cross-validation for tuning the parameter selection in the LASSO regression. (D) Distribution of PAAD patients in the TCGA cohort according to the median risk score. (E) PCA plot for PAAD patients according to the risk score. (F) Patient survival status distribution in the high-risk and low-risk groups (Blue dot: Alive, Red dot: Dead). (G) Kaplan–Meier OS analysis of PAAD patients between the high-risk and low-risk groups. (H) Prognostic value of the risk score shown via ROC curve. |
Risk score = (0.111*CHMP2B exp.) + (0.323* CHMP4C exp.) + (0.464*CASP4 exp.) + (0.209* IL18 exp.) + (−0.639* CHMP4A exp.)
The 151 patients were divided into low-risk and high-risk groups based on median risk score, and we found that risk score was increased with higher patient risk levels (Figure 2D). As seen in Figure 2E, low- and high-risk patient groups were satisfactorily separated into two clusters based on principal component analysis (PCA). Patients in the low-risk group had a longer survival time and a higher survival rate than those in the high-risk group (Figure 2F). Then, we estimated the prognostic value of risk score via Kaplan–Meier analysis, which showed that the survival probability of the high-risk group was remarkably lower than that of the low-risk group (P<0.001, Figure 2G). The sensitivity and specificity of the prognostic risk model were assessed via time-dependent ROC analysis and the area under the ROC curve (AUC) was 0.680 for the 1-year, 0.621 for the 3-year, and 0.703 for the 5-year survival (Figure 2H).
External Validation of the Prognostic Risk Model
The GSE78229 dataset including gene expression data and clinical information of 49 patients was utilized as the validation set. The gene expression data was centralized and standardized by the “Scale” function for further analysis. The 49 patients were classified into low-risk and high-risk groups based on median risk score from the TCGA cohort, and the patients of the two groups were well separated into two clusters via PCA (Figure 3A and B). As same as the TCGA cohort, the patients in the low-risk group had a lower mortality ratio than those in the high-risk group (Figure 3C). In addition, the significant difference in the survival rate between the two groups was revealed by Kaplan–Meier analysis (P=0.022, Figure 3D). The sensitivity and specificity of the prognostic risk model were assessed via time-dependent ROC analysis and the area under the ROC curve (AUC) was 0.596 for 1-year, 0.687 for 3-year, and 0.732 for 5-year survival (Figure 3E).
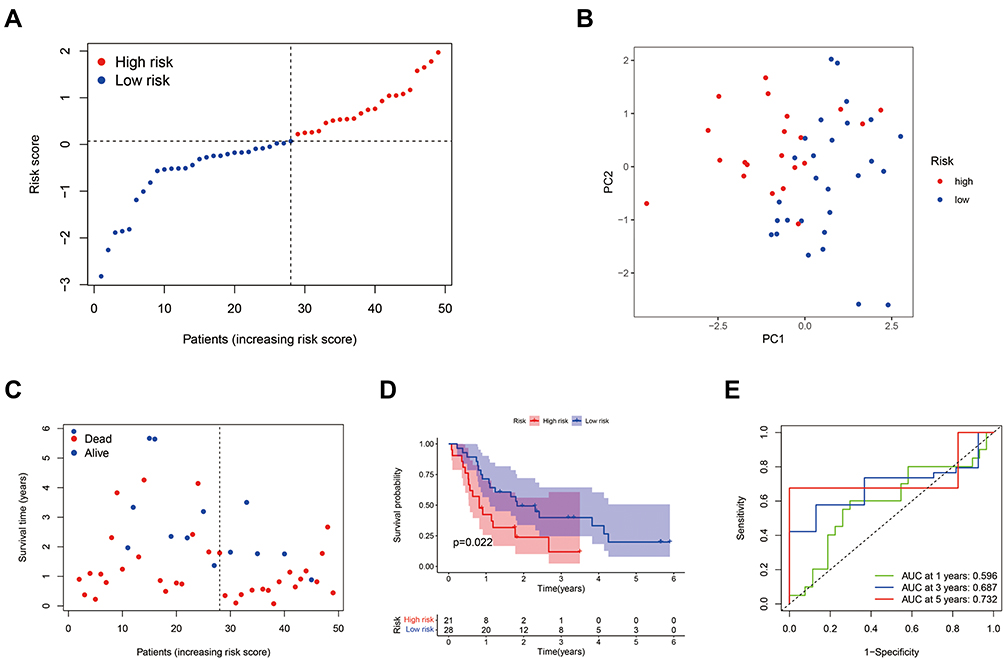 |
Figure 3 External validation of the prognostic risk model. (A) Distribution of PAAD patients in the GEO cohort based on the median risk score from the TCGA cohort. (B) PCA plot for PAAD patients according to the risk score. (C) Patient survival status distribution in the high-risk and low-risk groups (Blue dot: Alive, Red dot: Dead). (D) Kaplan–Meier OS analysis of PAAD patients between the high-risk and low-risk groups. (E) Prognostic value of the risk score shown via time-dependent ROC curve. |
Independent Prognostic Value of the Risk Score
Univariate and multivariate Cox regression analyses were used to evaluate whether the risk score could be an independent prognostic factor for predicting survival in patients with PAAD. The univariate Cox regression analysis revealed that the T stage, N stage, and risk score were associated with OS in the TCGA cohort (Figure 4A). Then, multivariate Cox regression analysis showed that both the risk score and N stage were independent prognostic factors in PAAD (Figure 4B). In the GEO cohort, the univariate Cox regression analysis revealed that the grade and risk score were associated with OS, and multivariate Cox regression analysis showed that risk score was an independent prognostic factor in PAAD (Figure 4D and E). The heatmaps with clinical features of the two cohorts showed that the N stage of patients was diversely distributed between the low-risk and high-risk groups in the TCGA cohort and the grade of patients was differently distributed between the two groups in the GEO cohort (Figure 4C and F).
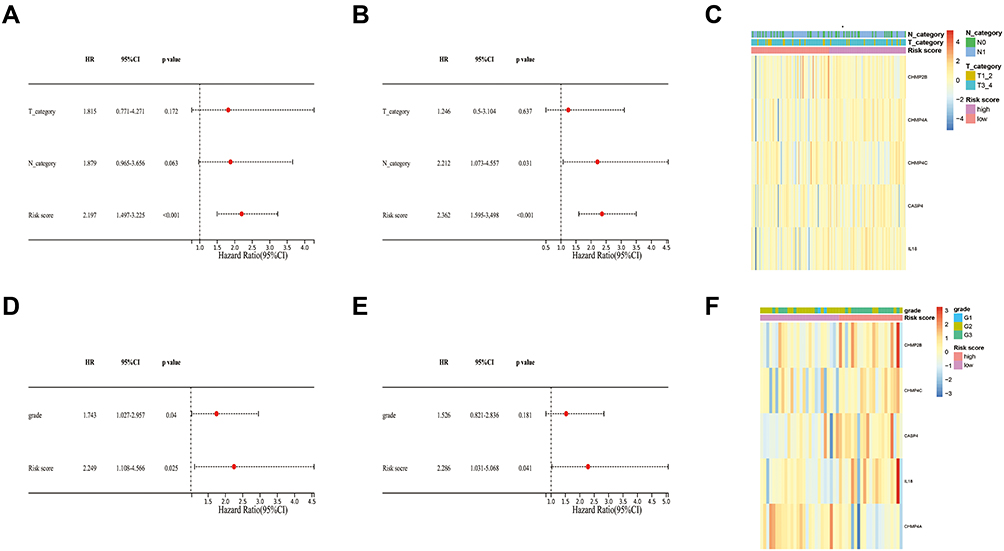 |
Figure 4 Prognostic value of the risk score. (A) The independent prognostic values of the risk score and other clinical features in the TCGA cohort were evaluated by univariate Cox analysis. (B) The independent prognostic values of the risk score and other clinical features in the TCGA cohort were evaluated by multivariate Cox analysis. (C) The expression of the five pyroptosis-associated genes and distribution of T stage and N stage in TCGA cohort. (D) The independent prognostic values of the risk score and other clinical features in the GEO cohort were evaluated by univariate Cox analysis. (E) The independent prognostic values of the risk score and other clinical features in the TCGA cohort were evaluated by multivariate Cox analysis. (F) The expression of the five pyroptosis-associated genes and distribution of T stage and N stage in the GEO cohort. |
Functional Enrichment Analyses of the Risk Model
The 1305 DEGs (|Log2FC|>1 and P<0.05) contained 1120 enriched genes and 185 downregulated genes in the high-risk group, between the high-risk group and low-risk group, were identified via the “limma” package (Table S4). The GO and KEGG pathway enrichment analyses of these DEGs were performed to investigate the functional differences based on the risk model. As Figure 5A shows, the biological process of these DEGs mainly focuses on the immune process including humoral immune response and its regulation, activating cell surface receptor signaling pathway, and B cell-associated process. The enriched corresponding cellular components (immunoglobulin complex, T cell receptor complex, and plasma membrane signaling receptor complex) and enriched corresponding molecular function (receptor-ligand activity, signaling receptor activator activity, and antigen-binding) support these biological processes (Figure 5B and C). The KEGG of these DEGs mainly focuses on neuroactive ligand-receptor interaction, cytokine-cytokine receptor interaction, and pancreatic secretion (Figure 5D).
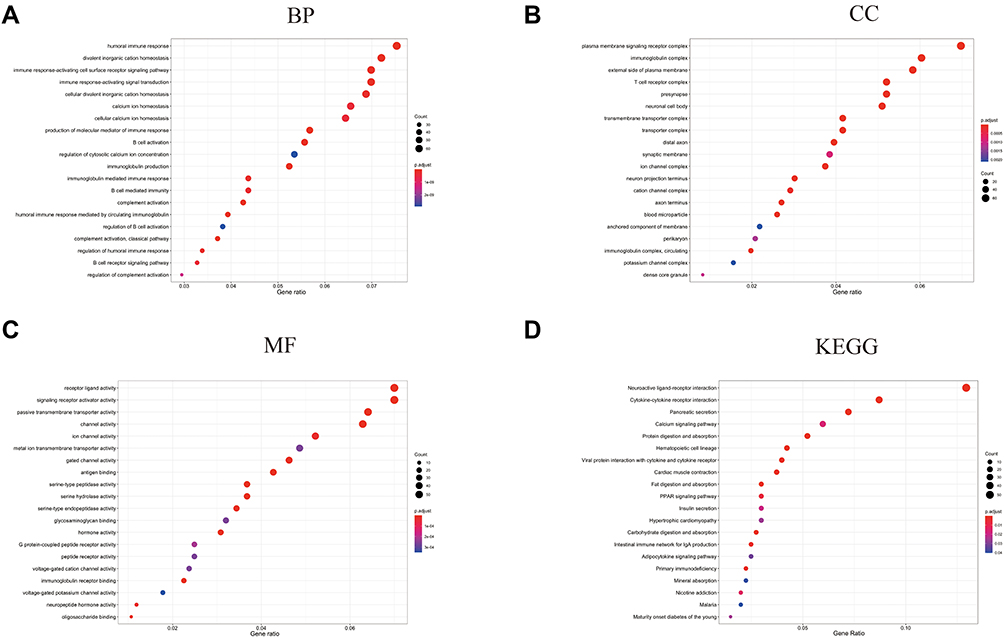 |
Figure 5 Functional enrichment analyses based on the DEGs from the risk model. (A) The Biological Process (BP) enrichment analysis is based on the DEGs from the risk model. (B) The Cellular Component (CC) enrichment analysis is based on the DEGs from the risk model. (C) The Molecular Function (MF) enrichment analysis is based on the DEGs from the risk model. (D) The KEGG enrichment analysis is based on the DEGs from the risk model. |
Analyses of Immune Cells and Immune Pathways Between the Two Groups
Based on the functional enrichment analyses of the risk model, we found that the immune-associated biological process and pathways were enriched. To further explore the differences of immune cell and immune-associated pathways between the two groups, we studied the enrichment scores of 28 types of immune cells and the activity of 13 immune-related pathways between the groups by employing the single-sample gene set enrichment analysis (ssGSEA). As shown in Figure 6A, the enrichment scores of immune cells including macrophages, eosinophils, CD8+ T cells, CD4+ T cells, and type 1 T helper cells in the low-risk group were markedly higher than those in the high-risk group. Simultaneously, the enrichment scores of immune-associated pathways involving check-point, cytolytic activity, T-cell co-inhibition, T-cell co-stimulation, and type II IFN response in the low-risk group were significantly higher than these in the high-risk group (Figure 6B). Then, to further investigate the prognostic values of the differentially expressed immune cells between the two groups, the univariate Cox proportional hazard regression models were applied. As shown in Figure 6C, the high abundance of center memory CD4+ T cell, macrophage, eosinophil, and activated dendritic cells were significantly associated with favorable survival outcomes. We estimated the prognostic value of center memory CD4+ T cell via Kaplan–Meier analysis, which showed the survival probability of the enriched group was significantly higher than that in the low expression group (Figure 6D).
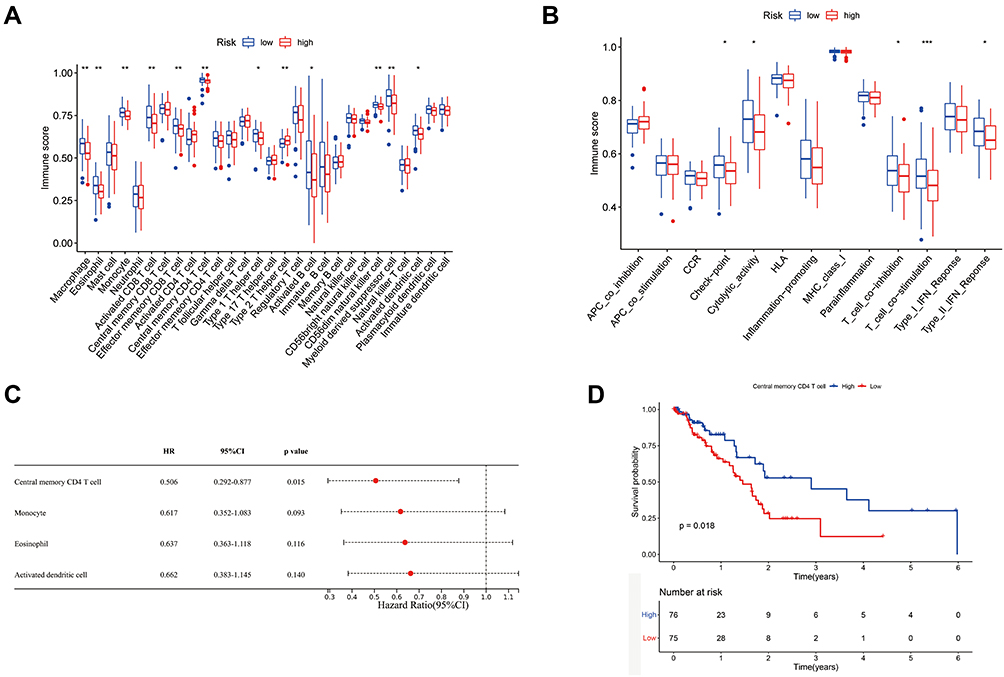 |
Figure 6 Analyses of immune cells and immune pathways between two groups. (A) The enrichment scores of 28 immune cells between low-risk and high-risk groups. (B) The enrichment scores of immune-associated pathways between low-risk and high-risk groups. (C) The OS time of immune cells was analyzed via univariate Cox regression analysis. (D) Kaplan–Meier OS analysis of center memory CD4+ T cells. *P<0.05, **P<0.01, ***P<0.001. |
Differential Expressions of CASP4 and CHMP4C in Tumor and Adjacent Normal Tissues
To investigate the effect of the five aforementioned genes in the risk model for PAAD, we established a PPI network to investigate the interactions of these genes. As shown in Figure 7A, CASP4 and IL18 were closely linked to the main process of pyroptosis, and CHMP4A, CHMP4C, and CHMP2B were closely linked to the main compositions of the endosomal sorting complex required for transport-III (ESCRT-III). In addition, we estimated the prognostic value of these genes via Kaplan–Meier analysis, which showed that the survival probability of CASP4 and CHMP4C in the high-expression group were remarkably lower than that in the low-expression group (Figure 7B). Then, we used immunohistochemical staining to explore the differential expressions of CASP4 and CHMP4C in tumor and adjacent normal tissues. We found that the expressions of CASP4 and CHMP4C in tumor tissue were higher than those in the adjacent normal tissues (Figure 7C and D).
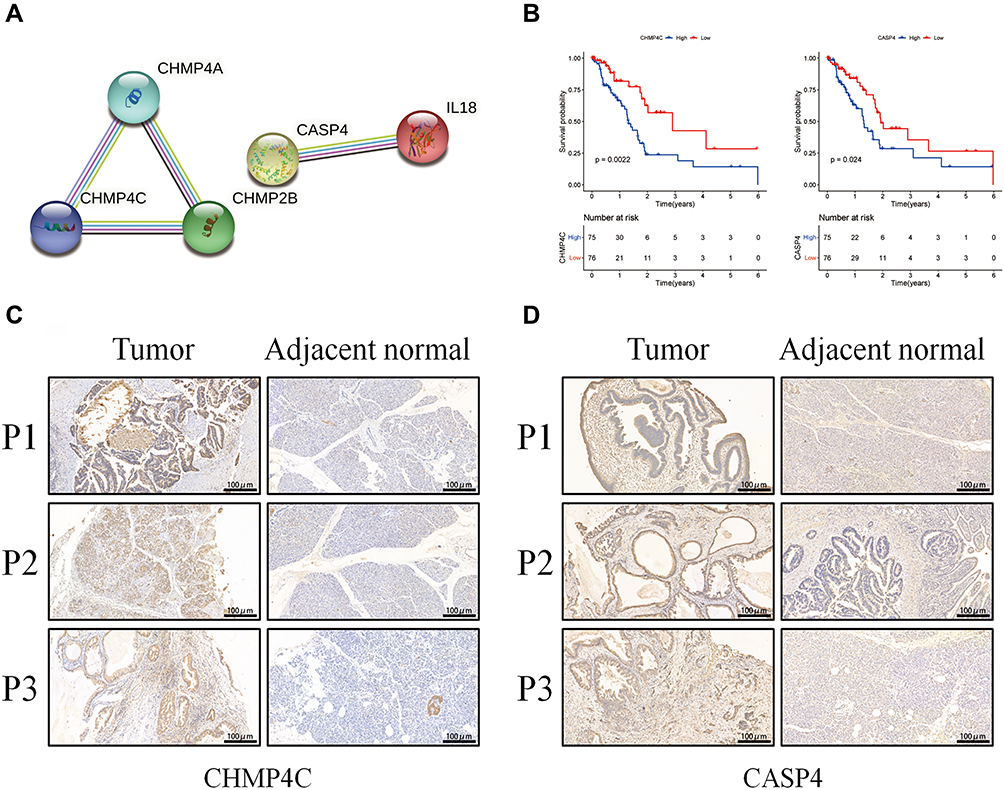 |
Figure 7 Expressions of CASP4 and CHMP4C in tumor and adjacent normal tissues. (A) The PPI network among the five pyroptosis-associated genes of the risk model (interaction score=0.4). (B) Kaplan–Meier OS analysis of PAAD patients based on the expression of CASP4 and CHMP4C. (C) The expressions of CHMP4C in tumor and adjacent normal tissues. (D) The expressions of CASP4 in tumor and adjacent normal tissues. |
Effects of CASP4 and CHMP4C Knockdown on PANC-1 Growth and Metastasis
Next, we constructed the siRNA group by transfecting the siRNA of CASP4 and CHMP4C to PANC-1 cells. The silencing effect of siRNA was verified by qPCR and Western blotting, and the groups with the better silence effect were used for further analyses (Figure 8A-D). As shown in Figure 8E, the proliferation of PANC-1 cells among the three groups showed no obvious difference. Next, the transwell assay was performed to assess cell migration and invasion. As shown in Figure 8F and G, the CASP4 knockdown obviously reduced migration and invasion of PANC-1 cells. Meanwhile, the proliferation of the si-NC group was significantly higher than that of the si-CHMP4C1 and si-CHMP4C2 groups (Figure 8H). The CHMP4C knockdown also reduced migration and invasion of PANC-1 cells (Figure 8I and J). In conclusion, both the CASP4 and CHMP4C knockdown significantly inhibited the metastasis of PANC-1 cells, and silencing CHMP4C also inhibited the proliferation of PANC-1 cells.
 |
Figure 8 Effects of CASP4 and CHMP4C knockdown on PANC-1 cells’ growth and metastasis. (A and B) The relative mRNA expression levels of CASP4 and CHMP4C in PANC-1 cells were evaluated by real-time PCR. (C and D), The levels of CASP4 and CHMP4C in PANC-1 cells were detected via WB (E), The Cell Counting Kit-8 assay was performed to assess the proliferation of PANC-1 cells with knockdown of CASP4. (F and G), The migratory and invasive abilities of PANC-1 cells with knockdown of CASP4 were detected using transwell assays (the scale bar values: 100nm). (H) The Cell Counting Kit-8 assay was performed to assess the proliferation of PANC-1 cells with knockdown of CHMP4C. (I and J) The migratory and invasive abilities of PANC-1 cells with knockdown of CHMP4C were detected using transwell assays (the scale bar values: 50μm). All data shown are the averages of three independent experiments (mean ± SD). *P<0.05, **P<0.01, ***P<0.001, ****P<0.0001, ns: no significance. |
Discussion
There are still some controversies in the inhibition or promotion effect of pyroptosis-associated genes on tumors. Peng et al reported that overexpression of GSDMD promoted tumor proliferation and demonstrated a significantly poorer prognosis and overall survival rate in bladder cancer.23 However, Cui et al showed that caspase-1-induced pyroptosis activated by MST1 promoted PAAD cell death and inhibited the proliferation, migration, invasion, and cell spheroid formation of PAAD.24
To investigate the function of pyroptosis-associated genes in PAAD, we intersected the 52 currently known pyroptosis-related genes and DEGs between PAAD tissues to obtain 36 pyroptosis-associated DEGs and found that all of them were highly expressed in PAAD. To further explore the prognostic value of these pyroptosis-related DEGs, a five-gene risk model was constructed via univariate Cox analysis and LASSO Cox regression analysis, which was fully and effectively verified in the external dataset.
Our studies indicated that out of the five genes including CHMP2B, CHMP4C, CASP4, IL18, and CHMP4A, CHMP2B, CHMP4C, CASP4, and IL18 were negative prognostic factors, while only CHMP4A was a favorable prognostic factor for PAAD. The expressions of CHMP2B, CHMP4C, CASP4, and IL18 in the high-risk group were significantly higher than those in the low-risk group and the expression of CHMP4A in the high-risk group was significantly lower than that in the low-risk group, both in the TCGA and GEO cohorts. The CASP4 can cleave GSDMD through the non-classical pathways of pyroptosis to promote the release of IL18.25 Upregulation of CASP4 affects the prognosis of clear cell renal cell carcinoma by regulating tumor drug resistance.26 The CHMP4A, CHMP4C, and CHMP2B subunits are particularly important building blocks of the ESCRT-III, because all the known ESCRT-III-associated membrane fission processes require them.27 The sorting of transmembrane proteins such as cell surface receptors into the multivesicular body pathway to the lysosomal/vacuolar lumen requires the function of the ESCRT protein complexes. On the one hand, they are necessary for the process of transmembrane proteins such as cell surface receptors into the multivesicular body of the lysosome/vacuolar lumen. On the other hand, the ESCRT system is essential for membrane abscission in cytokinesis and the budding of enveloped viruses like human immunodeficiency virus 1.28,29 Moreover, Morita et al reported that ESCRT-III proteins function at centrosomes to help regulate cell proliferation, thereby helping to ensure the ordered progression through the different stages of cell division.30
Next, we knocked down CASP4 and CHMP4C to further investigate their effects on PANC-1 cells in vitro. The results demonstrated that both of them remarkably impaired the migration and invasion of PANC-1 cells and CHMP4C also impaired the proliferation of PANC-1 cells. In addition, Papoff et al reported that CASP4 can regulate cell migration through actin remodeling and uncovered a novel role of CASP4 in cancer cell behavior.31 Moreover, CHMP4C can be used as a potential diagnostic and prognostic biomarker for lung squamous cell carcinoma because of its regulatory function on the proliferation of tumor cells through the cell cycle.32 Lin et al reported that CHMP4C facilitates malignant development including cell proliferation, migration, and invasion of cervical cancer cells, by modulating epithelial-mesenchymal transition.33
Functional analyses of the DEGs between the low- and high-risk groups were completed and the result indicated that DEGs were mainly enriched in immune-related pathways. We found that immune cell infiltration (CD8+ T cell, CD4+ T cell, and type-1 T helper cell) and immune-associated pathways (check-point, cytolytic activity, T-cell co-inhibition, T-cell co-stimulation, type-II IFN) in the low-risk group were universally increased compared to those in the high-risk group. The anti-tumor immune response requires processes including dendritic cells-associated tumor recognition, cytotoxic and helper T-cell activation, tumor bed infiltration, and T-cell–mediated tumor cell killing. The immune cells including activated dendritic cell, type 2 T helper cell, type 1 T helper cell, activated CD8 T cell and natural killer cell, and immune-associated pathways closely related to the anti-tumor immune process in the low-risk group are highly expressed, which may be why the low-risk group has a favorable prognosis. However, PAAD has successfully evaded immune surveillance and suppressing immune response based on the low tumor antigenicity, immune activation deficiency, and unique suppressive tumor microenvironment.34 Although CTLA-4 and PD-L1 T-cell checkpoint inhibitors constitute the cornerstone of modern immunotherapy, neither of them has satisfactory effects in the treatment of PAAD.35,36 The distinctive microenvironment of PDAC is composed of increased desmoplasia and the presence of several noncellular components, various cell types, such as cancer-associated fibroblasts (CAFs), pancreatic stellate cells (PSCs), and immune cells.37 The extracellular matrix of PAAD is produced by the PSC and CAF components, which results in elevated tumor pressure, diminished vascularization, attenuated drug delivery, and failure of immunotherapy.38 Identifying new immune checkpoints and immunotherapy is the direction for the treatment of PAAD, which needs further research.
Conclusions
In summary, we systematically analyzed pyroptosis-associated DEGs between normal and PAAD tissues and calculated the risk score, which was an independent risk factor for predicting PAAD in both the TCGA and GEO cohorts, based on five pyroptosis-related genes. Silencing the two main genes CASP4 and CHMP4C significantly inhibited the metastasis of PANC-1 cells. The DEGs based on the low-risk and high-risk groups were enriched in immune cells and immune related-pathways. Our research put forward a new view on the effect of pyroptosis on the TME of PAAD. In conclusion, our prognostic model showed potential clinical applicability to improve the survival rate and find the potential therapeutic targets for PAAD patients.
Abbreviations
PAAD, pancreatic adenocarcinoma; RNA-seq, RNA sequencing; TCGA, The Cancer Genome Atlas; DEGs, differentially expressed genes; TME, tumor microen-vironment; PAMPs, pathogen-associated molecular patterns; DAMPs, danger-associated molecular patterns; IL-1β, interleukin-1 beta; IL-18, interleukin-18; GSDMD, simultaneously cleaves the gasdermin D; LPS, lipopolysaccharide; NSCLC, nonsmall-cell lung cancer; TNM, tumor-node-metastasis; NLRP3, NOD-like receptor family pyrin domain-containing 3; LASSO, least absolute shrinkage and selection operator; TPM, transcripts per million; GTEx, genotype-tissue expression; STRING, search tool for the retrieval of interacting genes; OS, overall survival; AUC, area under the curve; ROC, receiver operating characteristic; GO, Gene Ontology; KEGG, Kyoto Encyclopedia of Genes and Genomes; ssGSEA, single-sample gene set enrichment analysis; cDNA, complementary DNA.
Data Sharing Statement
All datasets in this study could be downloaded at (https://xenabrowser.net/, https://portal.gdc.cancer.gov/, and https://www.ncbi.nlm.nih.gov/geo/;GSE78229), and data of cell experiments are available upon request by contacting the Menghao Wang.
Ethics Approval and Consent to Participate
The protocols used in this research were evaluated and approved by the Ethics Committee of the Second Affiliated Hospital of Chongqing Medical University.
Funding
This study was supported by the National Natural Science Foundation of China (no. 81971880), the Natural Science Foundation of Chongqing (cstc2019jcyj-zdxmX0027, cstc2021jcyj-msxmX0294).
Disclosure
The authors declare that they have no competing interests in this work.
References
1. Chen X, Zeh HJ, Kang R, Kroemer G, Tang D. Cell death in pancreatic cancer: from pathogenesis to therapy. Nat Rev Gastroenterol Hepatol. 2021. doi:10.1038/s41575-021-00486-6
2. Siegel RL, Miller KD, Fuchs HE, Jemal A. Cancer Statistics, 2021. CA Cancer J Clin. 2021;71(1):7–33. doi:10.3322/caac.21654
3. Mizrahi JD, Surana R, Valle JW, Shroff RT. Pancreatic cancer. Lancet. 2020;395(10242):2008–2020. doi:10.1016/s0140-6736(20)30974-0
4. Ho WJ, Jaffee EM, Zheng L. The tumour microenvironment in pancreatic cancer - clinical challenges and opportunities. Nat Rev Clin Oncol. 2020;17(9):527–540. doi:10.1038/s41571-020-0363-5
5. Hosein AN, Brekken RA, Maitra A. Pancreatic cancer stroma: an update on therapeutic targeting strategies. Nat Rev Gastroenterol Hepatol. 2020;17(8):487–505. doi:10.1038/s41575-020-0300-1
6. Wang YY, Liu XL, Zhao R. Induction of Pyroptosis and Its Implications in Cancer Management. Front Oncol. 2019;9:971. doi:10.3389/fonc.2019.00971
7. Chen S, Mei S, Luo Y, Wu H, Zhang J, Zhu J. Gasdermin Family: a Promising Therapeutic Target for Stroke. Transl Stroke Res. 2018;9(6):555–563. doi:10.1007/s12975-018-0666-3
8. Hou J, Zhao R, Xia W, et al. Author Correction: PD-L1-mediated gasdermin C expression switches apoptosis to pyroptosis in cancer cells and facilitates tumour necrosis. Nat Cell Biol. 2020;22(11):1396. doi:10.1038/s41556-020-00599-1
9. Silva MT. Bacteria-induced phagocyte secondary necrosis as a pathogenicity mechanism. J Leukoc Biol. 2010;88(5):885–896. doi:10.1189/jlb.0410205
10. Latz E, Xiao TS, Stutz A. Activation and regulation of the inflammasomes. Nat Rev Immunol. 2013;13(6):397–411. doi:10.1038/nri3452
11. Schroder K, Tschopp J. The inflammasomes. Cell. 2010;140(6):821–832. doi:10.1016/j.cell.2010.01.040
12. Liu X, Zhang Z, Ruan J, et al. Inflammasome-activated gasdermin D causes pyroptosis by forming membrane pores. Nature. 2016;535(7610):153–158. doi:10.1038/nature18629
13. Ding J, Wang K, Liu W, et al. Pore-forming activity and structural autoinhibition of the gasdermin family. Nature. 2016;535(7610):111–116. doi:10.1038/nature18590
14. Shi J, Zhao Y, Wang Y, et al. Inflammatory caspases are innate immune receptors for intracellular LPS. Nature. 2014;514(7521):187–192. doi:10.1038/nature13683
15. Kayagaki N, Warming S, Lamkanfi M, et al. Non-canonical inflammasome activation targets caspase-11. Nature. 2011;479(7371):117–121. doi:10.1038/nature10558
16. Gao J, Qiu X, Xi G, et al. Downregulation of GSDMD attenuates tumor proliferation via the intrinsic mitochondrial apoptotic pathway and inhibition of EGFR/Akt signaling and predicts a good prognosis in nonsmall cell lung cancer. Oncol Rep. 2018;40(4):1971–1984. doi:10.3892/or.2018.6634
17. Zhang Y, Yang H, Sun M, et al. Alpinumisoflavone suppresses hepatocellular carcinoma cell growth and metastasis via NLRP3 inflammasome-mediated pyroptosis. Pharmacol Rep. 2020;72(5):1370–1382. doi:10.1007/s43440-020-00064-8
18. Xu D, Ji Z, Qiang L. Molecular Characteristics, Clinical Implication, and Cancer Immunity Interactions of Pyroptosis-Related Genes in Breast Cancer. Front Med. 2021;8:702638. doi:10.3389/fmed.2021.702638
19. Li XY, Zhang LY, Li XY, Yang XT, Su LX, Pyroptosis-Related Gene A. Signature for Predicting Survival in Glioblastoma. Front Oncol. 2021;11:697198. doi:10.3389/fonc.2021.697198
20. Sun Z, Jing C, Guo X, et al. Comprehensive Analysis of the Immune Infiltrates of Pyroptosis in Kidney Renal Clear Cell Carcinoma. Front Oncol. 2021;11:716854. doi:10.3389/fonc.2021.716854
21. Dong Z, Bian L, Wang M, Wang L, Wang Y. Identification of a Pyroptosis-Related Gene Signature for Prediction of Overall Survival in Lung Adenocarcinoma. J Oncol. 2021;2021:6365459. doi:10.1155/2021/6365459
22. Shen Y, Li X, Wang D, et al. Novel prognostic model established for patients with head and neck squamous cell carcinoma based on pyroptosis-related genes. Transl Oncol. 2021;14(12):101233. doi:10.1016/j.tranon.2021.101233
23. Peng J, Jiang H, Guo J, et al. CD147 Expression Is Associated with Tumor Proliferation in Bladder Cancer via GSDMD. Biomed Res Int. 2020;2020:7638975. doi:10.1155/2020/7638975
24. Cui J, Zhou Z, Yang H, et al. MST1 Suppresses Pancreatic Cancer Progression via ROS-Induced Pyroptosis. Mol Cancer Res. 2019;17(6):1316–1325. doi:10.1158/1541-7786.MCR-18-0910
25. Ma X, Li Y, Shen W, et al. LPS Mediates Bovine Endometrial Epithelial Cell Pyroptosis Directly Through Both NLRP3 Classical and Non-Classical Inflammasome Pathways. Front Immunol. 2021;12:676088. doi:10.3389/fimmu.2021.676088
26. Meng L, Tian Z, Long X, et al. Caspase 4 Overexpression as a Prognostic Marker in Clear Cell Renal Cell Carcinoma: a Study Based on the Cancer Genome Atlas Data Mining. Front Genet. 2020;11:600248. doi:10.3389/fgene.2020.600248
27. McCullough J, Colf LA, Sundquist WI. Membrane fission reactions of the mammalian ESCRT pathway. Annu Rev Biochem. 2013;82:663–692. doi:10.1146/annurev-biochem-072909-101058
28. Morita E, Sandrin V, McCullough J, Katsuyama A, Baci Hamilton I, Sundquist WI. ESCRT-III protein requirements for HIV-1 budding. Cell Host Microbe. 2011;9(3):235–242. doi:10.1016/j.chom.2011.02.004
29. Wollert T, Wunder C, Lippincott-Schwartz J, Hurley JH. Membrane scission by the ESCRT-III complex. Nature. 2009;458(7235):172–177. doi:10.1038/nature07836
30. Morita E, Colf LA, Karren MA, Sandrin V, Rodesch CK, Sundquist WI. Human ESCRT-III and VPS4 proteins are required for centrosome and spindle maintenance. Proc Natl Acad Sci U S A. 2010;107(29):12889–12894. doi:10.1073/pnas.1005938107
31. Papoff G, Presutti D, Lalli C, et al. CASP4 gene silencing in epithelial cancer cells leads to impairment of cell migration, cell-matrix adhesion and tissue invasion. Sci Rep. 2018;8(1):17705. doi:10.1038/s41598-018-35792-8
32. Liu B, Guo S, Li GH, et al. CHMP4C regulates lung squamous carcinogenesis and progression through cell cycle pathway. J Thorac Dis. 2021;13(8):4762–4774. doi:10.21037/jtd-21-583
33. Lin SL, Wang M, Cao QQ, Li Q. Chromatin modified protein 4C (CHMP4C) facilitates the malignant development of cervical cancer cells. FEBS Open Bio. 2020;10(7):1295–1303. doi:10.1002/2211-5463.12880
34. Heumann T, Azad N. Next-generation immunotherapy for pancreatic ductal adenocarcinoma: navigating pathways of immune resistance. Cancer Metastasis Rev. 2021. doi:10.1007/s10555-021-09981-3
35. Kamath SD, Kalyan A, Kircher S, et al. Ipilimumab and Gemcitabine for Advanced Pancreatic Cancer: a Phase Ib Study. Oncologist. 2020;25(5):e808–e15. doi:10.1634/theoncologist.2019-0473
36. O’Reilly EM, Oh DY, Dhani N, et al. Durvalumab With or Without Tremelimumab for Patients With Metastatic Pancreatic Ductal Adenocarcinoma: a Phase 2 Randomized Clinical Trial. JAMA Oncol. 2019;5(10):1431–1438. doi:10.1001/jamaoncol.2019.1588
37. Erkan M, Hausmann S, Michalski CW, et al. The role of stroma in pancreatic cancer: diagnostic and therapeutic implications. Nat Rev Gastroenterol Hepatol. 2012;9(8):454–467. doi:10.1038/nrgastro.2012.115
38. Binenbaum Y, Na’ara S, Gil Z. Gemcitabine resistance in pancreatic ductal adenocarcinoma. Drug Resist Updat. 2015;23:55–68. doi:10.1016/j.drup.2015.10.002
 © 2022 The Author(s). This work is published and licensed by Dove Medical Press Limited. The full terms of this license are available at https://www.dovepress.com/terms.php and incorporate the Creative Commons Attribution - Non Commercial (unported, v3.0) License.
By accessing the work you hereby accept the Terms. Non-commercial uses of the work are permitted without any further permission from Dove Medical Press Limited, provided the work is properly attributed. For permission for commercial use of this work, please see paragraphs 4.2 and 5 of our Terms.
© 2022 The Author(s). This work is published and licensed by Dove Medical Press Limited. The full terms of this license are available at https://www.dovepress.com/terms.php and incorporate the Creative Commons Attribution - Non Commercial (unported, v3.0) License.
By accessing the work you hereby accept the Terms. Non-commercial uses of the work are permitted without any further permission from Dove Medical Press Limited, provided the work is properly attributed. For permission for commercial use of this work, please see paragraphs 4.2 and 5 of our Terms.