")
Back to Journals » Cancer Management and Research » Volume 13
Identification of a Prognostic Index Based on a Metabolic-Genomic Landscape Analysis of Hepatocellular Carcinoma (HCC)
Authors Yang X, Liu Q, Zou J, Li YK, Xie X
Received 26 April 2021
Accepted for publication 5 July 2021
Published 15 July 2021 Volume 2021:13 Pages 5683—5698
DOI https://doi.org/10.2147/CMAR.S316588
Checked for plagiarism Yes
Review by Single anonymous peer review
Peer reviewer comments 2
Editor who approved publication: Dr Sanjeev K. Srivastava
Xin Yang,1 Qiong Liu,1 Juan Zou,2 Yu-kun Li,2 Xia Xie1
1Department of Infectious Diseases, The First Affiliated Hospital of University of South China, Heng Yang, Hunan, 421000, People’s Republic of China; 2Key Laboratory of Tumor Cellular and Molecular Pathology, College of Hunan Province, Cancer Research Institute, University of South China, Hengyang, Hunan, 421001, People’s Republic of China
Correspondence: Xia Xie
Department of Infectious Diseases, The First Affiliated Hospital of University of South China, Heng Yang, Hunan, 421000, People’s Republic of China
Email [email protected]
Background: Metabolic disorders have attracted increasing attention from scientists who conduct research on various tumours, especially hepatocellular carcinoma (HCC). The purpose of this study was to assess the prognostic significance of metabolism in HCC.
Methods: The expression profiles of metabolism-related genes (MRGs) of 349 surviving HCC patients were extracted from The Cancer Genome Atlas (TCGA) database. Subsequently, a series of biomedical computational algorithms were used to identify a seven-MRG signature as a prognostic model. GSEA indicated the function and pathway enrichment of these MRGs. Then, drug sensitivity analysis was used to identify the hub gene, which was tested using IHC staining.
Results: A total of 420 differential MRGs and 116 differentially expressed transcription factors (TFs) were identified in HCC patients based on data from the TCGA database. The GO and KEGG enrichment analyses indicated that metabolic disturbance might be involved in the development of HCC. LASSO regression analysis was used to construct a seven-MRG signature (DHDH, ENO1, G6PD, LPCAT1, PDE6D, PIGU and PPAT) that could predict the prognosis of HCC patients. GSEA revealed the functional and pathway enrichment of these seven MRGs. Then, drug sensitivity analysis indicated that G6PD might play a key role in the prognosis of HCC by promoting chemoresistance. Finally, we used IHC staining to demonstrate the relationship between G6PD expression levels and clinical parameters in HCC patients.
Conclusion: The results of this study provide a potential method for predicting the prognosis of HCC patients and avenues for further studies of HCC metabolism. Moreover, the function of G6PD may play a key role in the development and progression of HCC.
Keywords: bioinformatical analysis, hepatocellular carcinoma, metabolic-genomic landscape, The Cancer Genome Atlas, prognostic index
Background
Hepatocellular carcinoma (HCC) ranked sixth in incidence (over 800 thousand new cases) and fourth in overall mortality (over 780 thousand deaths) in 2018 and was responsible for approximately 1 in 10 cancer cases and related deaths that year.1 According to histopathological classification, HCC is one of the main types of liver cancer, accounting for more than 80% of cases.2 Surgical resection of liver cancer and complete and delicate liver transplantation are effective methods for the treatment of HCC. However, HCC still has poor clinical outcomes due to complications, such as local recurrence, chemotherapeutic resistance, and distant metastasis.3 Moreover, due to the occult onset of HCC and the lack of specific early markers, most patients with HCC are often diagnosed at an advanced stage with local or distant metastases, and their average survival time is approximately 6 months.4 Therefore, the identification of specific early diagnostic markers for HCC and the resolution of local recurrence, chemotherapeutic resistance and distant metastasis are urgent problems to be solved in clinical practice. The occurrence and development of HCC is an extremely complex pathological process, and its molecular mechanism remains elusive.5 Several studies have consistently shown that several cancer microenvironmental factors, including high proinflammatory cytokines induced by oxidation and endoplasmic reticulum stress, hyperinsulinaemia, changes in the intestinal microbiome, and adipokine dysregulation, are involved in the progression of HCC.6–11 However, the most important risk factor for HCC is excess body fat.12 Although the mechanisms by which excess body fat promotes carcinogenesis are still not fully understood in HCC, several studies have shown that cancer cell-intrinsic metabolic reprogramming plays a significant role in promoting carcinogenesis associated with obesity.
Metabolic reprogramming can promote carcinogenesis by disturbing signalling pathways, inducing cell adaptation, regulating cellular differentiation, and modulating epigenetic states.13 Changes in glucose metabolism are a marker of tumour metabolism. The most typical example is the Warburg effect, which induces aerobic glycolysis instead of mitochondrial oxidative phosphorylation to promote cancer cell proliferation.14 Changes in lipid metabolism are also a marker of cancer metabolism. Fatty acids are a source of signalling molecules, energy, structural components of cell membranes, and storage compounds, which are necessary for cancer cell proliferation. However, circulating exogenous lipids are preferentially used by normal cells, while cancer cells, such as liver cancer cells, have higher rates of de novo lipid formation.15 Moreover, another well-known metabolic disorder is increased glutaminolysis, which increases citrate and α-ketoglutarate production and enhances the activation of the mitochondrial tricarboxylic acid (TCA) cycle.
Cancer metabolic reprogramming is a complex molecular network that has recently received increasing attention. The difference between cancer and normal cell metabolic reprogramming is helpful for the more accurate diagnosis and prognosis evaluation of HCC patients.16 At present, bioinformatics analysis is a powerful tool for deriving information about HCC.17 Our aim in this study was to identify several metabolism-related genes (MRGs) as potential candidates for targeted HCC treatment. We assessed the expression level of MRGs and their impact on prognosis to generate an individualized prognosis prediction model for HCC patients. Bioinformatics analysis was also performed to explore the potential regulatory mechanisms involved in HCC. The results of this study provide a basis for further in-depth metabolism-related research and provide good prospects for the individualized treatment of HCC patients.
Materials and Methods
The Source Data and Preprocessing of Metabolism-Related Genes (MRGs) and Transcription Factors
Seventy MRGs sets were downloaded from the KEGG database of GSEA website, and a total of 1466 MRGs were included, using the same method as above.18 Three hundred and eighteen tumor-related transcription factors are extracted from cistrome database (http://cistrome.org/), to assist the integrated analysis of the molecular mechanisms of cancer development.
TCGA Data Acquisition
Our study included information from the TCGA database on a total of 349 HCC patients who were followed up for at least one month, with survival times ranging from 30 days to 3675 days. Download level 3 FPKM data for subsequent analysis. Univariate Cox regression was used to analyze mRNAs related to patient survival time for model construction.
Model Construction and Prognosis
Patients with HCC were randomly divided into training set and test set (7:3) in TCGA. First, a univariate Cox risk proportional regression model was selected from the training set to initially screen the genes related to prognosis (p < 0.05 and (HR > 1.5 or HR < 0.5)), and lasso regression was used to further construct the prognostic correlation model. After the expression values of each specific gene were included, the risk score formula for each patient was constructed and weighted by its estimated regression coefficients in the lasso regression analysis. According to the risk score formula, patients were divided into low-risk group and high-risk group according to the score value. Survival differences between the two groups were assessed by Kaplan-Meier and compared using log-rank statistical methods. Lasso regression analysis and stratified analysis were used to examine the role of risk scores in predicting patient outcomes. ROC curve was used to study the accuracy of model prediction.
Gene Ontology (GO) and Kyoto Encyclopedia of Gene and Genome (KEGG) Analyses
GO, an important bioinformatics analysis, contains biological processes (BPs), cellular component (CC), and molecular function (MF). KEGG is a complex analysis database resource for gene function system, which connects genomic information with higher-order functional information. David is used for GO and KEGG analysis. The cut-off standard was p<0.05.
The Analysis of GSEA
GSEA analysis uses predefined gene sets, sorts genes according to the degree of differential expression in the two types of samples, and then checks whether the preset gene sets are enriched at the top or bottom of the list. In this study, GSEA was used to compare the differences in signaling pathways between the high-risk group and the low-risk group to explore the possible molecular mechanism of the difference in prognosis between the two groups, in which the replacement times were set as 1000 and the replacement type as phenotype.
Drug Sensitivity Analysis
GSCALite (http://bioinfo.life.hust.edu.cn/web/GSCALite/) is a cancer genomic analysis platform that integrates cancer genomics data from TCGA for 33 cancer types, drug response data from GDSC and CTRP, and normal tissue data from GTEx for genomic analysis in a one-to-one data analysis process. In this study, GSCALite was used for pathway analysis of key hub genes, GDSC and CTRP drug sensitivity analysis.19
Patients and Specimens
We collected paraffin-embedded tissue blocks, which included 60 HCC tissues and corresponding para-carcinoma tissues from the Department of Pathology, the First Affiliated Hospital of the University of South China. Sixty Tissue sections from all HCC cases were reviewed by a pathologist. All HCC patients were classified according to the 7th Union for International Cancer Control TNM staging system. The clinical data of the specimens recorded in detail are accurate and complete. All HCC patients were regularly followed up for 4 to 81 months to assess postoperative survival. The collection and use of tissues followed the procedures according to the ethical standards as formulated in the Helsinki Declaration. Written informed consent was obtained from each patient, which was approved by the research ethics committee of the University of South China.
Immunohistochemistry (IHC) Staining
For IHC staining, these slices were dewaxed by xylene. Subsequently, they were rehydrated with a graded ethanol series, repaired antigen with microwave. Endogenous peroxidase activity was blocked by endogenous peroxidase for 20 min at 37°C. After rinsing, these slides were incubated overnight at 4°C with a first antibody that was diluted with PBST in a working solution (1: 1000 dilution, Ab231828, Abcam, MA, USA). After rinsing, subsequent operations follow this paper.20 The IHC score refers to this previous paper.21
Cell Culture and RNAi
The human HCC cell lines, HepG2, were commercially purchased from Procell Life Science & Technology Co., Ltd. (Wuhan, China), which were grown in DMEM with 10% FBS at 37 °C under 5% CO2. Transient transfection was performed using Lipofectamine 2000 (Invitrogen, Carlsbad, CA, USA) according to the manufacturer’s instructions.
The G6PD RNAi-1 shRNA targeting sequence is 5′-GGGCTATTTCGATGAATTTGG-3′, the G6PD RNAi-2 shRNA targeting sequence is 5′-AACTCAGATGACGTCCGTGAT-3′, and the control shRNA sequence is 5′-CCGCAGGTATGCACGCGT-3′. All the shRNA was synthesized by HonorGene (Changsha, China).
Reverse Transcription‑quantitative PCR (RT‑qPCR)
TaqMan polymerase with SYBR Green fluorescence (Nippon Gene, Japan) was applied to conduct quantitative real-time polymerase chain reaction (RT-qPCR). Analysis was performed using specific primers (G6PD: sense 5ʹ-TCATCATCATGGGTGCATCGG-3ʹ and antisense 5ʹ- CTTGAAGAAGGGCTCACTCTGTTTG-3ʹ).
Cell Proliferation Analysis
For MTT analysis, HepG2 cells were seeded in 96‑well (1×10³ cells/well) and treated with 0, 1, 5, 10 µg/mL of propofol for 48 h at 37°C. A total of 5×10³ cells/well were seeded into 96-well plates and cultured for 1, 2, 3, 4 and 5 days at 37°C. Twenty microliters MTT solution (5 mg/mL, Sigma‑Aldrich; Merck KGaA) was incubated for 4 h at 37°C. Then, 150 µL DMSO was added to dissolve the precipitates and the effect of cell number on absorbance at 490 nm was measured using a microplate reader (Molecular Devices, LLC). The experiments were performed in triplicate. For plate clone formation analysis, HepG2 cells were re-suspended and seeded in 12-well plates at a density of 2000 cells/well, incubated for 2 weeks, and then stained with 0.5% crystal violet for 30 min. Excess dye was rinsed off twice with phosphate buffered saline (PBS). Images were obtained using the computer software Quantity One® from Bio-Rad Laboratories, Inc.
Statistical Analysis
All statistical analyses were conducted in the R language (version 3.6). All the statistical tests were bilateral, and p<0.05 was statistically significant.
Results
Identification the Survival-Associated MRGs in HCC
A growing body of studies indicated a significant role of cancer metabolic reprogramming in HCC occurrence, development and progression. In order to ascertain MRGs for HCC prognosis, the analysis of differential gene expression was utilized. First, the expression profiles of MRGs were extracted from TCGA HCC data set, which contained 1466 MRGs (Figure 1A). Subsequently, we found that 357 differentially expressed genes (DEGs) were up-regulated, and 63 DEGs were down-regulated (p<0.05 and log|FC|>1) in these MRGs between HCC and normal liver samples via Volcano Plot (Figure 1B).
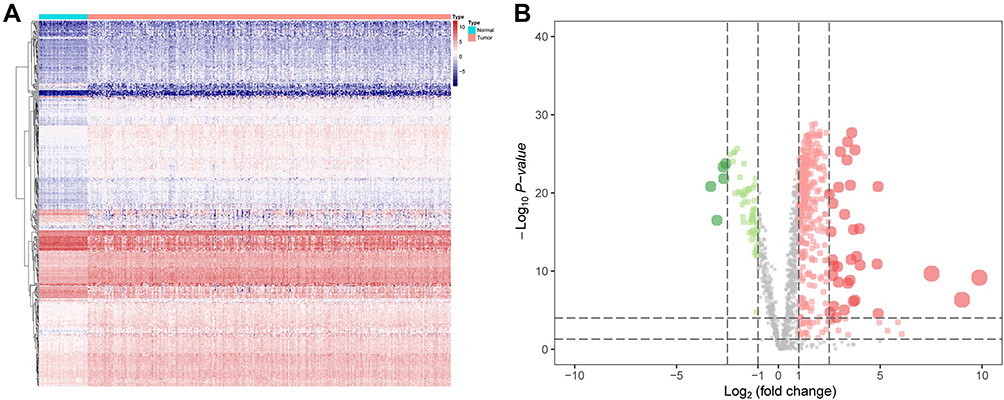 |
Figure 1 Identification the survival-associated MRGs in HCC. (A) Heat map shows the significant MRGs in TCGA datasets. (B) Volcano plot shows 1466 MRGs in HCC. Red means up-regulation significantly. Green means down-regulation significantly. (p<0.05 & log|FC|>1). |
Functional Enrichment Was Determined by GO and KEGG Analysis
These key MRGs were mapped utilizing GO terms and KEGG analysis, which suggested relevant functions and underlying mechanisms for HCC progression. Furthermore, we found that the MRGs were largely correlated with biological process (BP) of metabolism progression, including small-molecule catabolic process, phospholipid metabolic process and organic hydroxy compound metabolic process. In the part of cellular component (CC) and molecular function (MF), they were associated with mitochondrial matrix and cofactor binding, respectively (Figure 2A). For the analysis of KEGG, purine metabolism, drug metabolism-other enzymes and oxidative phosphorylation were the most frequent enrichment (Figure 2B).
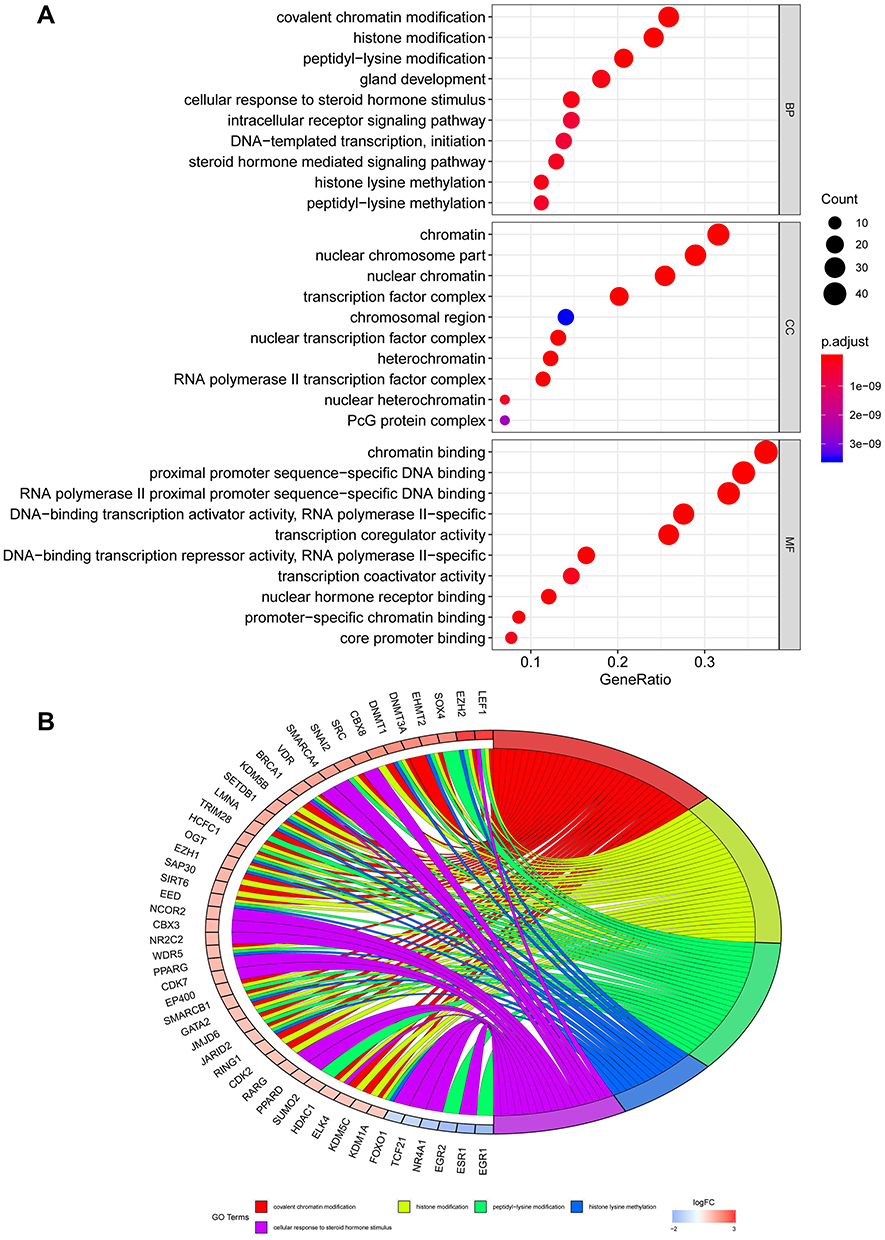 |
Figure 2 Gene ontology analysis of these MRGs. (A) In the part of biological process (BP), cellular component (CC) and molecular function (MF), them were associated with small molecule catabolic process, mitochondrial matrix and cofactor binding, respectively. (B) KEGG enrichment analysis indicated that purine metabolism, drug metabolism-other enzymes and oxidative phosphorylation were the most frequent enrichment for these MRGs. |
Validation the Differentially Expressed Transcription Factors in HCC
Previous research has illustrated how relationships between transcription factors (TFs) are highly related to the expression of MRGs. Similar to the study of Kalliopi Makarona,22 the expression of glucose 6-phosphate dehydrogenase (G6PD) could be enhanced by the HDAC inhibitor. Therefore, we firstly extracted the data of transcription factors in HCC and normal liver samples, which contain 318 TFs (Figure 3A). Furthermore, 202 TF had not changed significantly, 8 TFs were upregulated, and 108 TFs were downregulated (p<0.05 and log|FC|>1) (Figure 3B). In the analysis of GO, we found this set of TFs enriched in BP, CC and MF terms, including covalent chromatin modification, chromatin, and chromatin binding, respectively (Figure 3C). In the analysis of KEGG, this set of TFs involved in cell cycle, cellular senescence, and hepatocellular carcinoma (Figure 3D). The functional enrichment analysis indicates that these TFs might be involved in the development of HCC. Moreover, the PPI network also found extensive interactions between differentially expressed MRGs and key TFs, consistent with previous reports that MRGs and TFs in metabolic reprogramming worked together to form a delicate process conducive to cancer progression. After disconnected nodes are deleted, the PPI network is shown in Figure 3E. The regulatory network based on TFs clearly illuminated the regulation relationship among these MRGs.
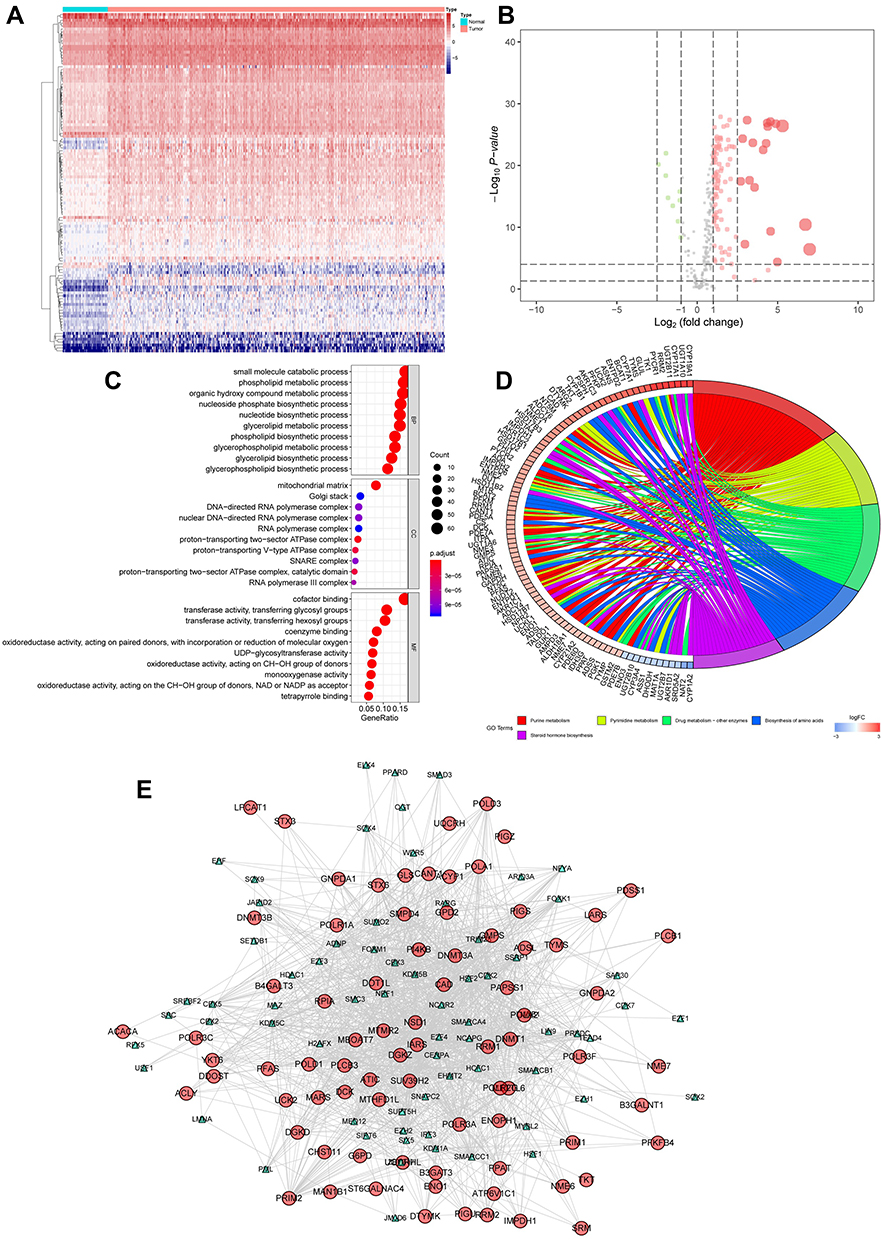 |
Figure 3 Validation the differentially expressed TFs in HCC. (A) Heat map shows the significant HCC related TFs in TCGA datasets. (B) Volcano plot shows 318 TFs in HCC. Red means up-regulation significantly. Green means down-regulation significantly. (C) In the part of BP, CC and MF, them were associated with covalent chromatin modification, chromatin, and chromatin binding, respectively. (D) KEGG enrichment analysis indicated that cell cycle, cellular senescence, and hepatocellular carcinoma were the most frequent enrichment for these TFs. (E) The PPI network also found extensive interactions between differentially expressed MRGs and key TFs. (p<0.05 and log|FC|>1). |
Construction and Validation of MRGs Signature
To construct signatures associated with MRGs, 32 MRGs were inputted to least absolute shrinkage and selection operator (LASSO) regression. Then, the seven hub MRGs (DHDH, ENO1, G6PD, LPCAT1, PDE6D, PIGU, PPAT) were inputted to the LASSO regression to construct a prognostic signature, which divided HCC patients into two groups, and the two groups had discrete clinical outcomes by the seven hub MRGs (Figure 4A). The prognostic model was as follows:
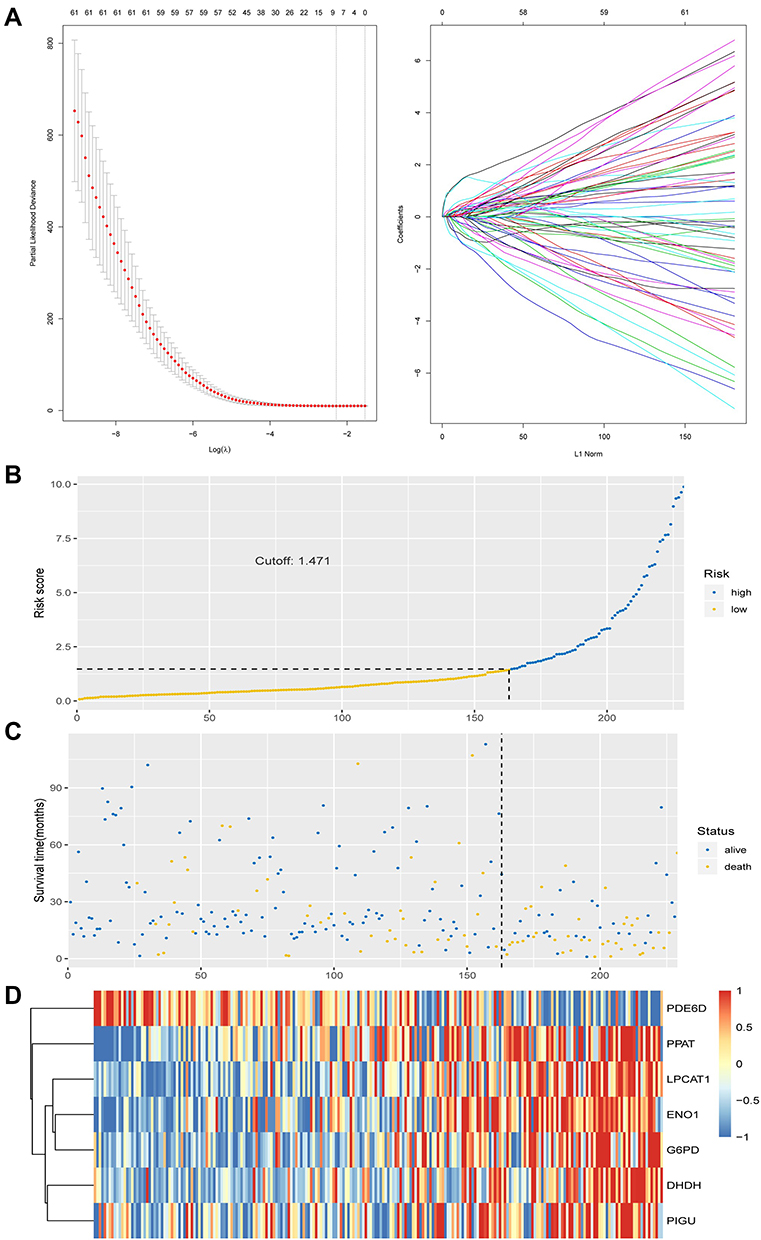 |
Figure 4 Construction and validation of MRGs signature. (A) Construction of prognostic signatures based on LASSO regression analysis. (B) Risk score analysis of the seven-gene signature of HCC. Risk score of gene signature. (C) Duration of cases. (D) Low and high score groups for the seven genes. |
[Y=DHDH*0.658+ ENO1*0.052 + G6PD*0.043 + LPCAT1*0.147 + PDE6D*(−0.154) + PIGU*0.040 + PPAT* 0.604].
Based on the optimal cut-off point of 1.471, the risk score of these HCC patients can be divided into low- and high-risk groups (Figure 4B). The survival score and survival status of HCC patients is visualized by Figure 5A and B. The high expression of DHDH, ENO1, G6PD, LPCAT1, PIGU and PPAT, and the low expression of PDE6D were found in HCC patients with higher risk scores (Figure 4D). Nevertheless, survival time and rates decreased with increased risk scores (Figure 4B and C).
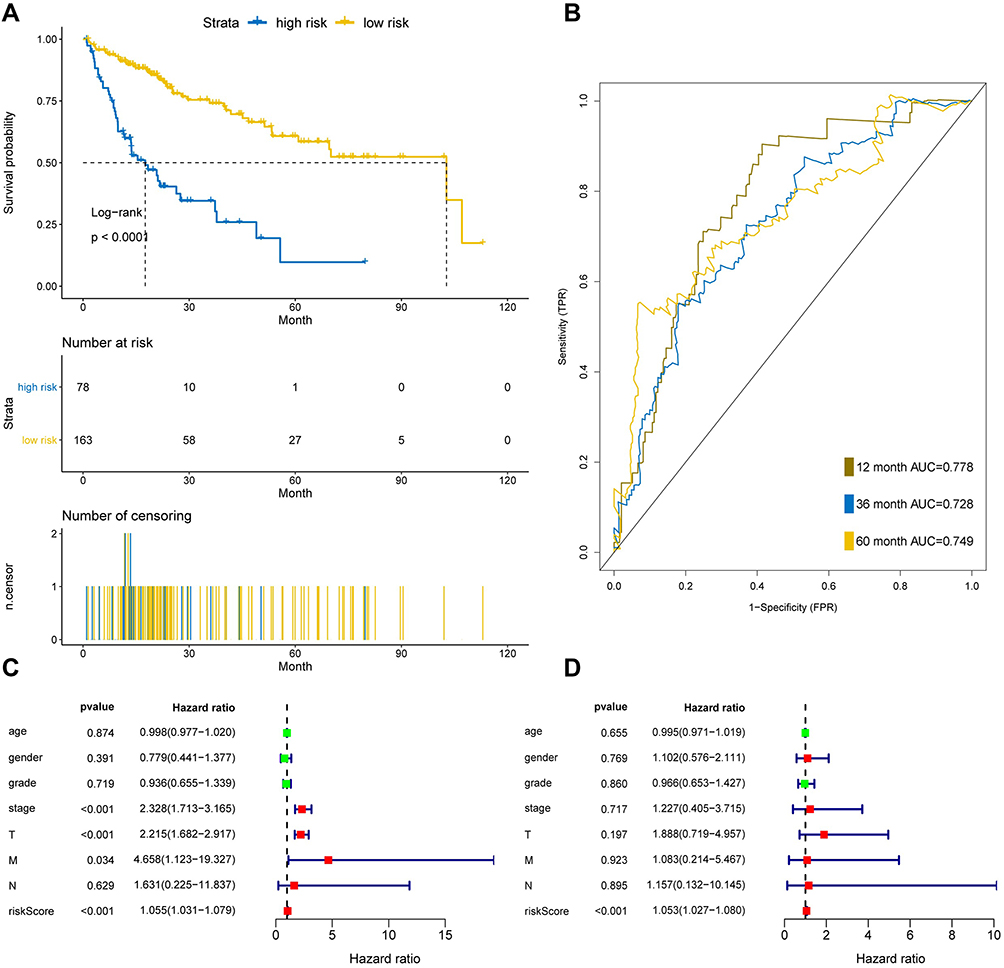 |
Figure 5 Seven-MRGs signature in HCC patients based on TCGA in training set. (A) Survival curve of low risk and high risk groups classified by seven-MRGs signature. (B) The area under curve of ROC of low risk and high risk groups by seven-MRGs signature based on TCGA. (C) Univariate Cox regression model was used to analyze the prognostic effects of seven-MRGs signatures and common prognostic factors. (D) The prognostic effect of seven-MRGs signature and used common prognostic factors by multivariate Cox regression model. |
The application of ROC curve and KM plot were utilized to evaluate the role of this prognostic model in predicting the prognosis of HCC patients. In this dataset, the overall survival (OS) of the high-risk group is higher than that of the low-risk group, which has significant differences according to statistical analysis (P<0.05) (Figure 5A). Furthermore, the area under curve of the receiver operating characteristic (ROC) of 12, 36 and 60 months was 0.778, 0.728 and 0.749, respectively (Figure 5B). Moreover, univariate and multivariate Cox regression analysis was used to further evaluate the performance of our model in patients with HCC by using other common prognostic factors. In univariate Cox regression model, tumor stage, T and seven-gene signature could be utilized as independent prognostic factor for survival (Figure 5C). In multivariate Cox regression, only the risk score had prognostic effects (Figure 5D).
Validation of the Prognostic Marker of the Seven-mRNA Signature in HCC
To verify the prognostic effect of the prognostic model on HCC, we used a test set of HCC patients in TCGA to measure the prognostic effect of the model. The results indicated that the test set of HCC patients were classified into high-risk and low-risk groups by risk score and median cut-off point (Figure 6A). The survival time of the high-risk group was significantly lower than that of the low-risk group (Figure 6B). The area under curve of the ROC of 12, 36 and 60 months was 0.796, 0.744 and 0.675, respectively (Figure 6C). Taken together, these results of test set were consistent with those of the training set, indicating that the seven-mRNA signature could anticipate the prognosis of HCC (between Figures 5 and 6).
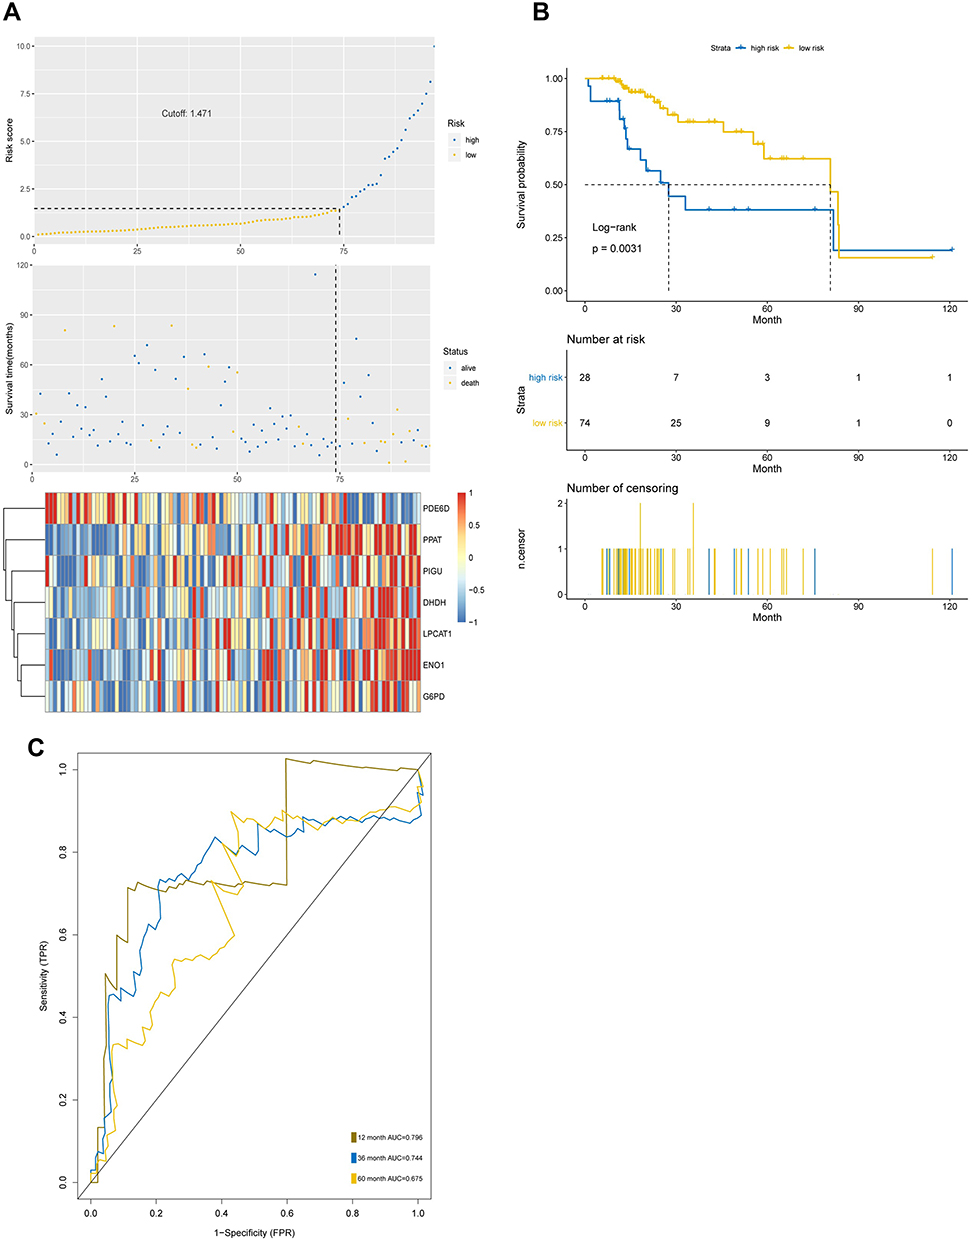 |
Figure 6 The prognostic capability of the seven-MRGs signature in test set. (A) Risk score analysis of the seven-gene signature of HCC in test set. (B) Survival curve of low risk and high risk groups classified by seven-MRGs signature in test set. (C) The area under curve of ROC of low risk and high risk groups by seven-MRGs signature based on TCGA in test set. |
GSEA Analysis of MRGs Signature
In order to investigate the potential mechanism of seven-gene signature in prognosis, we utilized GSEA enrichment analysis. In GO terms, GSEA using the gene sets indicated the enrichment in categories like monocarboxylic acid catabolic process, organic acid catabolic process, and positive regulation of cell cycle-phase transition (Figure 7A). In KEGG terms, GSEA analysis suggested the enrichment in categories, including cell cycle, complement and coagulation cascades, and fatty acid metabolism (Figure 7B).
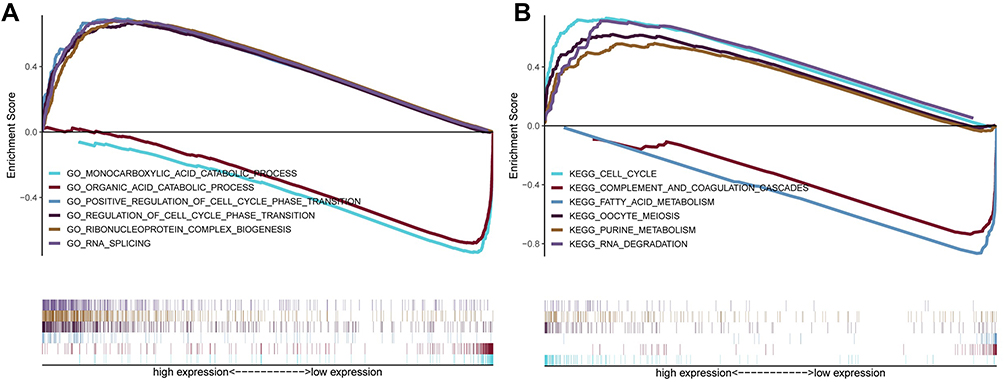 |
Figure 7 GSEA analysis for the seven MRGs. (A) In GO terms, GSEA indicated that monocarboxylic acid catabolic process, organic acid catabolic process, and positive regulation of cell cycle phase transition were most significantly enriched. (B) In KEGG terms, GSEA suggested the enrichment in cell cycle, complement and coagulation cascades, and fatty acid metabolism. |
Verification of the Drug Sensitivity of Hub MRGs
GSCALite (http://bioinfo.life.hust.edu.cn/web/GSCALite/) is a cancer genome analysis platform based on web.19 We utilized the database to make the drug sensitivity analysis of seven hub MRGs, offering help for drug choice for these hub MRGs targeted treatments. Therefore, we found that the drug sensitivity of the two hub MRGs (PPAT and G6PD) were obviously associated with multiple chemotherapy drugs by utilizing the GSCALite database, and the results are exhibited in Figure 8A and B, offering help for drug treatment by targeting hub MRGs. Furthermore, we also found that the pathophysiological function of G6PD was enriched in apoptosis and cell cycle by pathway analysis based on GSCALite (Figure 8C).
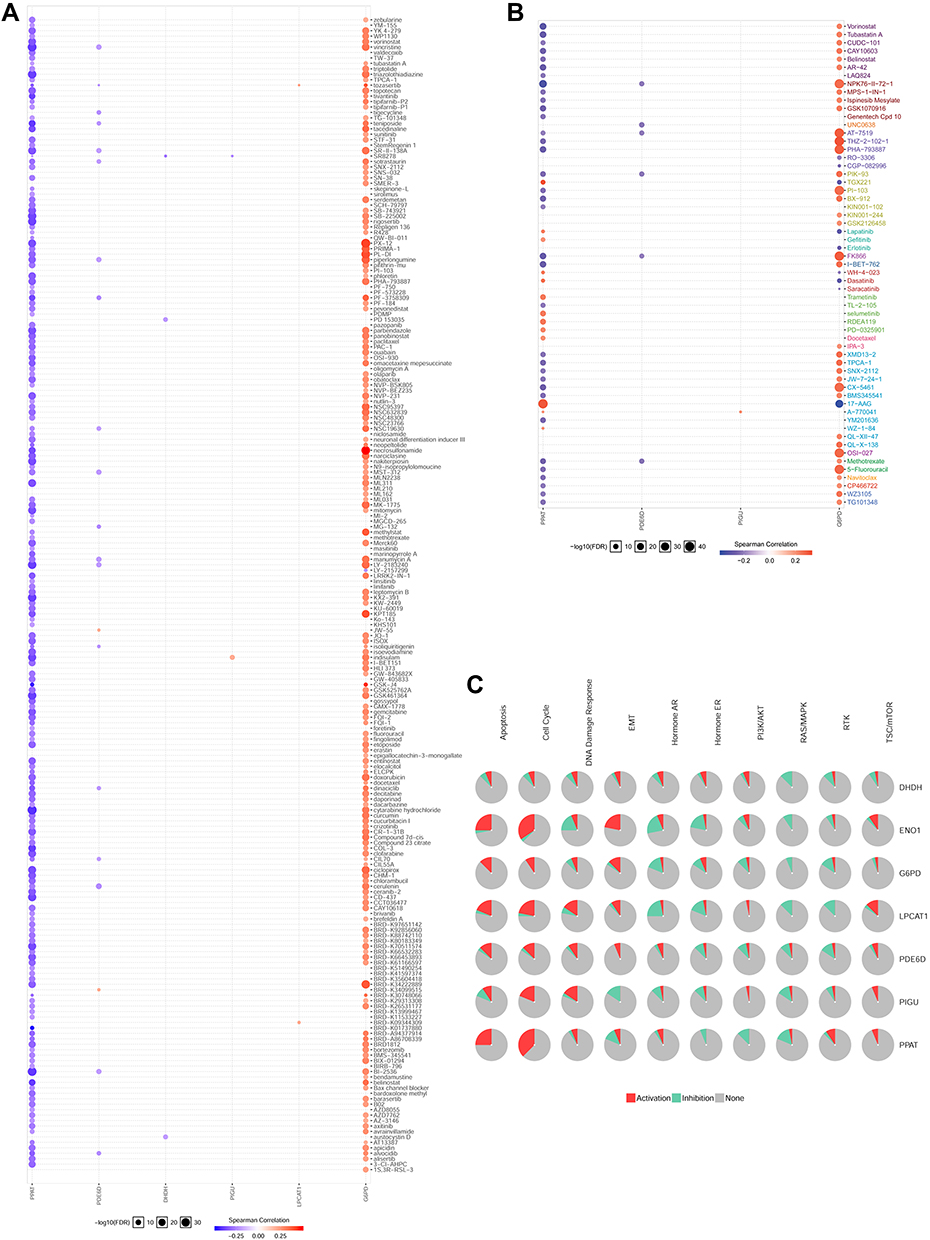 |
Figure 8 Drug sensitivity analysis. (A) The CTRP drug sensitivity was analyzed in GSCALite database for these seven genes. The CTRP drug sensitivity analysis indicated that G6PD and PPAT were significant target genes for multiple anti-cancer drugs, such as zebularine, YM-155, vorinostat, masitinib and etc. (B) The GDSC drug sensitivity analysis indicated that G6PD and PPAT were significant target genes for other important drugs, including vorinostat, ispinesib mesylate, lapatinib, 5−fluorouracil, and etc. (C) The seven genes (DHDH, ENO1, G6PD, LPCAT1, PDE6D, PIGU and PPAT) were analyzed in the GSCALite database for signaling pathway enrichment. G6PD was enriched in apoptosis and cell cycle. |
The Expression and Function of G6PD in HCC
To further confirm the expression level of G6PD in HCC, we detected the level of G6PD by IHC. As expected from the above results, the expression of G6PD is enhanced in cancer tissues of 10 patients with HCC compared to para-carcinoma tissues (Figure 9A). Moreover, we found that the high expression of G6PD was found to be related to poor prognosis (Figure 9B) and some clinical parameters (Table 1). The results indicated that G6PD might promote the development and progression of HCC. Subsequently, we used shRNAs to inhibit the G6PD expression in the HCC cell line HepG2. Plate clone formation and MTT assay indicated that G6PD knockdown could inhibit the proliferation ability of HepG2 cells (Figure 9C and D). These results indicated that G6PD might promote the proliferation of HCC.
 |
Table 1 The Correlation Between G6PD Expression and Clinicopathological Parameters in Liver Cancer |
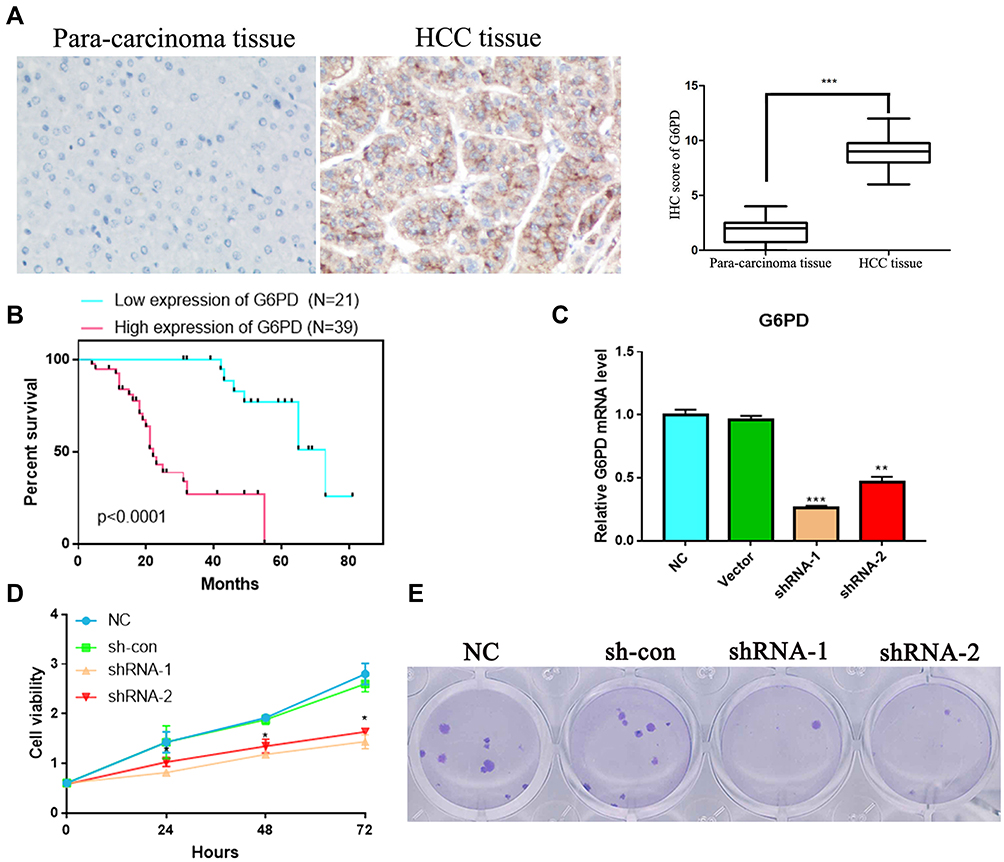 |
Figure 9 G6PD was over-expressed and has correlated with prognosis in HCC patients. (A) Immunohistochemical staining of G6PD expression in HCC and para-carcinoma tissue. G6PD showed strong cytoplasm expression in HCC. (B) The survival analysis of G6PD in HCC patients. (C) HepG2 cell was transfected with empty vector, G6PD shRNA-1 or G6PD shRNA-2, and the level of G6PD is confirmed by qPCR. (D) The MTT analysis. (E) Plate clone formation analysis. *P < 0.05, **P < 0.01 and ***P < 0.001 represents significant differences compared with the control. |
Discussion
Along with the rapid development of high-throughput technologies, DNA chips and second-generation sequencing technologies have generated massive amounts of data, and researchers need to use bioinformatics analyses to process this useful information.23 Bioinformatics is an interdisciplinary subject that comprehensively combines computer science and life science to integrate computer science, statistics, biological science and other theories that can be used to calculate and analyse the potential significance of extensive biological data.24 An increasing number of bioinformatics platforms and analysis softwares have been developed. Both genomic information and functional integration data are available, which can significantly improve the extraction and analysis of biological data. Data sharing based on platforms also effectively reduces experimental costs and time.
Changes in cancer metabolic processes, such as glucose metabolism and amino acid metabolism, are characteristic of cancer.25 Understanding the characteristics of metabolomics can better explain the pathophysiological changes of HCC and provide great potential for the development of new HCC treatment methods.26 For instance, several metabolic pathways (bile acid biosynthesis, tryptophan metabolism, urea cycle metabolism, and citric acid cycle) were significantly changed in the HCC group.27 The results of a previous study indicated that glycolysis and amino acid metabolism were closely associated with the development and progression of HCC by multiomics analyses.28,29 Moreover, abnormal lipid metabolism has also been found in HCC patients.30
In this study, we studied MRG and TF changes in HCC patients using bioinformatics. After identifying seven MRGs in the TCGA data sets capable of identifying key clinicopathological features of HCC, we established risk signatures of MRGs by LASSO regression analysis. We identified the seven-gene prognostic model of HCC by using the following formula to calculate the prognostic score: [Y=DHDH*0.658+ ENO1*0.052 + G6PD*0.043 + LPCAT1*0.147 + PDE6D*(−0.154)+ PIGU*0.040 + PPAT* 0.604]. According to our risk signature, patients in the high-risk group tended to have poorer prognosis and had significantly higher expression of DHDH, ENO1, G6PD, LPCAT1, PIGU, and PPAT, but lower expression of PDE6D.
The model signature genes ENO1, G6PD, LPCAT1, PIGU, and PDE6D have been found to be involved in the development and progression of HCC. ENO1 (α-enolase), a key enzyme of glycolysis, can promote the conversion of 2-phosphoglycerate to phosphoenolpyruvate 1, which can enhance the proliferation of HCC cells.31 Furthermore, previous studies have shown that ENO1 expression is upregulated in HCC tissues and is related to tumour differentiation and progression.32 G6PD (glucose-6-phosphate dehydrogenase) is the first enzyme and the rate-limiting enzyme of the pentose phosphate pathway.33 The expression of G6PD in HCC patient tumours and HCC cell lines is increased, which can promote migration and invasion by facilitating epithelial–mesenchymal transition (EMT).34 LPCAT1 (lysophosphatidylcholine acyltransferase 1) can acylate the unsaturated acyl group to maintain the integrity of the cell membrane,35 which can increase cell proliferation, migration and invasion in HCC.36 PIGU (phosphatidylinositol glycan anchor biosynthesis class U) plays a carcinogenic role by enhancing GPI-T activity and anchor-binding substrates, including urokinase plasminogen activator surface receptors,37 which are related to poor prognosis in HCC, and nomogram-based risk scores that combine the PIGU level with the standard TNM tend to be more powerful for predicting prognosis.38 Finally, Peter Dietrich and his colleagues found that PDE6D (rod-specific photoreceptor cGMP phosphodiesterase) might affect different cytoplasmic and nuclear pathways in HCC and other types of cancer. PDE6D could promote proliferation, migration, invasion and sorafenib resistance in HCC cells; thus, PDE6D might be a new potential therapeutic and diagnostic target for addressing HCC progression and chemotherapy resistance.
To investigate the potential molecular mechanisms by which gene signatures influence prognosis, GSEA was utilized. The results showed that the gene expression changes in the prognostic model mainly affected monocarboxylic acid catabolic process, organic acid catabolic process, and positive regulation of cell cycle-phase transition, providing clues for further research. Of the KEGG terms identified by GSEA, the cell cycle was the most affected pathophysiological pathway. In summary, these seven hub signature genes might influence the cell cycle and mediate HCC progression through multiple metabolic pathways. Furthermore, the drug sensitivity analysis based on GSCALite indicated that G6PD might be involved in the resistance of HCC to multiple chemotherapy drugs as a result of changes in apoptosis and the cell cycle.
Moreover, we found that G6PD was increased significantly in HCC tissues compared to para-carcinoma tissues. The ectopic expression of G6PD was related to poor prognosis in HCC patients, which indicated that G6PD might be a prognostic marker for HCC patients. We also inhibited G6PD expression in HepG2 cell lines and found that G6PD knockdown could significantly repress the proliferation ability of the cells. This result is consistent with the findings of Chen et al.39 However, the relationship between HCC progression and G6PD expression has not been confirmed, and our correlation analysis between IHC staining and clinicopathological parameters might provide some clues for further research. Taken together, our results suggest that MRGs, especially G6PD, might play a role in the development and progression of HCC.
Conclusion
We used HCC metabolomics and TF data to identify the differentially expressed MRGs. We constructed a seven-gene signature and verified that this signature could predict the prognosis of patients with HCC. Furthermore, we measured the expression of G6PD, which plays a key role in the seven-gene signature, and analysed its correlation with patient clinical parameters. Further study of these MRGs will provide new insights into the potential relationship between metabolic disorders and HCC progression.
Data Sharing Statement
The data used to support the findings of this study are available from the corresponding author upon request.
Ethics Approval and Consent to Participate
The collection and use of tissues followed the procedures according to the ethical standards as formulated in the Helsinki Declaration. Written informed consent was obtained from each patient, which was approved by the research ethics committee of the University of South China.
Consent for Publication
Written informed consent for publication was obtained from all participants.
Acknowledgments
The authors would like to thank the DAVID, GTEX and TCGA databases for the availability of the data.
Author Contributions
All authors made a significant contribution to the work reported, whether that is in the conception, study design, execution, acquisition of data, analysis and interpretation, or in all these areas; took part in drafting, revising or critically reviewing the article; gave final approval of the version to be published; have agreed on the journal to which the article has been submitted; and agree to be accountable for all aspects of the work.
Funding
This study is supported by Hengyang City 2018 guidance Project (S2018F9031021273).
Disclosure
The authors report no conflicts of interest in this work.
References
1. Bray F, Ferlay J, Soerjomataram I, Siegel RL, Torre LA, Jemal A. Global cancer statistics 2018: GLOBOCAN estimates of incidence and mortality worldwide for 36 cancers in 185 countries. CA Cancer J Clin. 2018;68(6):394–424. doi:10.3322/caac.21492
2. Akinyemiju T, Abera S, Ahmed M, et al. The Burden of Primary Liver Cancer and Underlying Etiologies From 1990 to 2015 at the Global, Regional, and National Level: results From the Global Burden of Disease Study 2015. JAMA Oncol. 2017;3(12):1683–1691. doi:10.1001/jamaoncol.2017.3055
3. Li YK, Zou J, Ye DM, et al. Human p21-activated kinase 5 (PAK5) expression and potential mechanisms in relevant cancers: basic and clinical perspectives for molecular cancer therapeutics. Life Sci. 2020;241:117113. doi:10.1016/j.lfs.2019.117113
4. Hollebecque A, Malka D, Ferté C, Ducreux M, Boige V. Systemic treatment of advanced hepatocellular carcinoma: from disillusions to new horizons. Eur J Cancer. 2015;51(3):327–339. doi:10.1016/j.ejca.2014.12.005
5. Braicu C, Burz C, Berindan-Neagoe I, et al. Hepatocellular Carcinoma: tumorigenesis and Prediction Markers. Gastroenterology Res. 2009;2(4):191–199. doi:10.4021/gr2009.07.1304
6. Nakagawa H, Umemura A, Taniguchi K, et al. ER stress cooperates with hypernutrition to trigger TNF-dependent spontaneous HCC development. Cancer Cell. 2014;26(3):331–343. doi:10.1016/j.ccr.2014.07.001
7. Park EJ, Lee JH, Yu GY, et al. Dietary and genetic obesity promote liver inflammation and tumorigenesis by enhancing IL-6 and TNF expression. Cell. 2010;140(2):197–208. doi:10.1016/j.cell.2009.12.052
8. Nakagawa H. How endoplasmic reticulum stress contributes to obesity-driven hepatic tumorigenesis. Hepat Oncol. 2015;2(3):209–211. doi:10.2217/hep.15.11
9. Yoshimoto S, Loo TM, Atarashi K, et al. Obesity-induced gut microbial metabolite promotes liver cancer through senescence secretome. Nature. 2013;499(7456):97–101. doi:10.1038/nature12347
10. Arano T, Nakagawa H, Tateishi R, et al. Serum level of adiponectin and the risk of liver cancer development in chronic hepatitis C patients. Int J Cancer. 2011;129(9):2226–2235. doi:10.1002/ijc.25861
11. Shalapour S, Lin XJ, Bastian IN, et al. Inflammation-induced IgA+ cells dismantle anti-liver cancer immunity. Nature. 2017;551(7680):340–345. doi:10.1038/nature24302
12. Anstee QM, Reeves HL, Kotsiliti E, Govaere O, Heikenwalder M. From NASH to HCC: current concepts and future challenges. Nat Rev Gastroenterol Hepatol. 2019;16(7):411–428. doi:10.1038/s41575-019-0145-7
13. Ward PS, Thompson CB. Metabolic reprogramming: a cancer hallmark even Warburg did not anticipate. Cancer Cell. 2012;21(3):297–308. doi:10.1016/j.ccr.2012.02.014
14. Vander Heiden MG, Cantley LC, Thompson CB. Understanding the Warburg effect: the metabolic requirements of cell proliferation. Science. 2009;324(5930):1029–1033. doi:10.1126/science.1160809
15. Budhu A, Roessler S, Zhao X, et al. Integrated metabolite and gene expression profiles identify lipid biomarkers associated with progression of hepatocellular carcinoma and patient outcomes. Gastroenterology. 2013;144(5):1066–1075.e1. doi:10.1053/j.gastro.2013.01.054
16. Tian Y, Yang B, Qiu W, et al. ER-residential Nogo-B accelerates NAFLD-associated HCC mediated by metabolic reprogramming of oxLDL lipophagy. Nat Commun. 2019;10(1):3391. doi:10.1038/s41467-019-11274-x
17. Zhang Q, He Y, Luo N, et al. Landscape and Dynamics of Single Immune Cells in Hepatocellular Carcinoma. Cell. 2019;179(4):829–845.e20. doi:10.1016/j.cell.2019.10.003
18. Lin P, Guo YN, Shi L, et al. Development of a prognostic index based on an immunogenomic landscape analysis of papillary thyroid cancer. Aging (Albany NY). 2019;11(2):480–500. doi:10.18632/aging.101754
19. Liu C-J, Hu -F-F, Xia M-X, Han L, Zhang Q, Guo A-Y. GSCALite: a web server for gene set cancer analysis. Bioinformatics. 2018;34(21):3771–3772. doi:10.1093/bioinformatics/bty411
20. Su B, Su J, Zeng Y, et al. Diallyl disulfide suppresses epithelial-mesenchymal transition, invasion and proliferation by downregulation of LIMK1 in gastric cancer. Oncotarget. 2016;7(9):10498–10512. doi:10.18632/oncotarget.7252
21. Geng X, Geng Z, Li H, Zhang Y, Li J, Chang H. Over-expression of TFB2M facilitates cell growth and metastasis via activating ROS-Akt-NF-κB signalling in hepatocellular carcinoma. Liver Int. 2020;40(7):1756–1769. doi:10.1111/liv.14440
22. Makarona K, Caputo VS, Costa JR, et al. Transcriptional and epigenetic basis for restoration of G6PD enzymatic activity in human G6PD-deficient cells. Blood. 2014;124(1):134–141. doi:10.1182/blood-2014-02-553792
23. Wang M, Wang L, Wu S, Zhou D, Wang X. Identification of Key Genes and Prognostic Value Analysis in Hepatocellular Carcinoma by Integrated Bioinformatics Analysis. Int J Genomics. 2019;2019:3518378. doi:10.1155/2019/3518378
24. Do Valle ÍF, Menichetti G, Simonetti G, et al. Network integration of multi-tumour omics data suggests novel targeting strategies. Nat Commun. 2018;9(1):4514. doi:10.1038/s41467-018-06992-7
25. Kroemer G, Pouyssegur J. Tumor cell metabolism: cancer’s Achilles’ heel. Cancer Cell. 2008;13(6):472–482. doi:10.1016/j.ccr.2008.05.005
26. Huang Q, Tan Y, Yin P, et al. Metabolic characterization of hepatocellular carcinoma using nontargeted tissue metabolomics. Cancer Res. 2013;73(16):4992–5002. doi:10.1158/0008-5472.Can-13-0308
27. Liang Q, Liu H, Wang C, Li B. Phenotypic Characterization Analysis of Human Hepatocarcinoma by Urine Metabolomics Approach. Sci Rep. 2016;6:19763. doi:10.1038/srep19763
28. Xie Q, Fan F, Wei W, et al. Multi-omics analyses reveal metabolic alterations regulated by hepatitis B virus core protein in hepatocellular carcinoma cells. Sci Rep. 2017;7:41089. doi:10.1038/srep41089
29. Jiang H, Liu J, Qin XJ, et al. Gas chromatography-time of flight/mass spectrometry-based metabolomics of changes in the urinary metabolic profile in osteoarthritic rats. Exp Ther Med. 2018;15(3):2777–2785. doi:10.3892/etm.2018.5788
30. Fages A, Duarte-Salles T, Stepien M, et al. Metabolomic profiles of hepatocellular carcinoma in a European prospective cohort. BMC Med. 2015;13:242. doi:10.1186/s12916-015-0462-9
31. Hamaguchi T, Iizuka N, Tsunedomi R, et al. Glycolysis module activated by hypoxia-inducible factor 1 alpha is related to the aggressive phenotype of hepatocellular carcinoma. Int J Oncol. 2008;33(4):725–731.
32. Takashima M, Kuramitsu Y, Yokoyama Y, et al. Overexpression of alpha enolase in hepatitis C virus-related hepatocellular carcinoma: association with tumor progression as determined by proteomic analysis. Proteomics. 2005;5(6):1686–1692. doi:10.1002/pmic.200401022
33. Stanton RC. Glucose-6-phosphate dehydrogenase, NADPH, and cell survival. IUBMB Life. 2012;64(5):362–369. doi:10.1002/iub.1017
34. Lu M, Lu L, Dong Q, et al. Elevated G6PD expression contributes to migration and invasion of hepatocellular carcinoma cells by inducing epithelial-mesenchymal transition. Acta Biochim Biophys Sin (Shanghai). 2018;50(4):370–380. doi:10.1093/abbs/gmy009
35. Agarwal AK, Sukumaran S, Bartz R, Barnes RI, Garg A. Functional characterization of human 1-acylglycerol-3-phosphate-O-acyltransferase isoform 9: cloning, tissue distribution, gene structure, and enzymatic activity. J Endocrinol. 2007;193(3):445–457. doi:10.1677/joe-07-0027
36. Morita Y, Sakaguchi T, Ikegami K, et al. Lysophosphatidylcholine acyltransferase 1 altered phospholipid composition and regulated hepatoma progression. J Hepatol. 2013;59(2):292–299. doi:10.1016/j.jhep.2013.02.030
37. Guo Z, Linn JF, Wu G, et al. CDC91L1 (PIG-U) is a newly discovered oncogene in human bladder cancer. Nat Med. 2004;10(4):374–381. doi:10.1038/nm1010
38. Cao J, Wang P, Chen J, He X. PIGU overexpression adds value to TNM staging in the prognostic stratification of patients with hepatocellular carcinoma. Hum Pathol. 2019;83:90–99. doi:10.1016/j.humpath.2018.08.013
39. Chen Q, Li F, Gao Y, Xu G, Liang L, Xu J. Identification of Energy Metabolism Genes for the Prediction of Survival in Hepatocellular Carcinoma. Front Oncol. 2020;10:1210. doi:10.3389/fonc.2020.01210
 © 2021 The Author(s). This work is published and licensed by Dove Medical Press Limited. The full terms of this license are available at https://www.dovepress.com/terms.php and incorporate the Creative Commons Attribution - Non Commercial (unported, v3.0) License.
By accessing the work you hereby accept the Terms. Non-commercial uses of the work are permitted without any further permission from Dove Medical Press Limited, provided the work is properly attributed. For permission for commercial use of this work, please see paragraphs 4.2 and 5 of our Terms.
© 2021 The Author(s). This work is published and licensed by Dove Medical Press Limited. The full terms of this license are available at https://www.dovepress.com/terms.php and incorporate the Creative Commons Attribution - Non Commercial (unported, v3.0) License.
By accessing the work you hereby accept the Terms. Non-commercial uses of the work are permitted without any further permission from Dove Medical Press Limited, provided the work is properly attributed. For permission for commercial use of this work, please see paragraphs 4.2 and 5 of our Terms.