")
Back to Journals » International Journal of General Medicine » Volume 14
Identification of a Five-Gene Prognostic Signature Related to B Cells Infiltration in Pancreatic Adenocarcinoma
Authors Tang S, Huang X, Jiang H, Qin S
Received 21 June 2021
Accepted for publication 16 August 2021
Published 30 August 2021 Volume 2021:14 Pages 5051—5068
DOI https://doi.org/10.2147/IJGM.S324432
Checked for plagiarism Yes
Review by Single anonymous peer review
Peer reviewer comments 2
Editor who approved publication: Dr Scott Fraser
Shaomei Tang,1 Xiaoliang Huang,2 Haixing Jiang,1 Shanyu Qin1
1Department of Gastroenterology, The First Affiliated Hospital of Guangxi Medical University, Nanning, People’s Republic of China; 2Department of Gastrointestinal Surgery, Guangxi Medical University Cancer Hospital, Nanning, People’s Republic of China
Correspondence: Shanyu Qin
Department of Gastroenterology, The First Affiliated Hospital of Guangxi Medical University, Nanning, People’s Republic of China
Email [email protected]
Background: Pancreatic adenocarcinoma (PAAD) is an extremely malignant cancer. Immunotherapy is a promising avenue to increase the survival time of patients with PAAD.
Methods: RNA sequencing and clinical data for PAAD were downloaded from the TCGA database. The ssGSEA method and weighted gene co-expression network analysis were used to calculate the relative abundance of tumor-infiltrating immune cells and identify the related modules. Least absolute shrinkage and selection operator (LASSO) and Cox regression analyses were used to construct a prognostic model. MCPcounter and EPIC were also used to assess immune cell components using gene expression profiles.
Results: The B cells closely related module was identified, and five genes, including ARID5A, CLEC2B, MICAL1, MZB1, and RAPGEF1, were ultimately selected to establish a prognostic signature to calculate the risk scores of PAAD patients. Kaplan–Meier curves showed worse survival in the high-risk patients (p < 0.05), and the area under the receiver operating characteristic (ROC) curves of risk score for 1-year and 3-year survival were 0.78 and 0.80, respectively, based on the training set. Similar results were verified using the validated and combined sets. Interestingly, the low-risk group presented significantly elevated immune and stromal scores, proportion of B cells, and associations between these five genes and B cells were identified using multiple methods including ssGSEA, MCPcounter, and EPIC.
Conclusion: This is the first attempt to study a B cells-related prognostic signature, which is instrumental in the exploration of novel prognostic biomarkers in PAAD.
Keywords: B cells, prognostic signature, WGCNA, ssGSEA, pancreatic adenocarcinoma
Background
Pancreatic adenocarcinoma (PAAD), a challenging disease worldwide, is expected to become the second leading cause of cancer death in the United States in the next 20 to 30 years.1 The overall 5-year survival rate is approximately 9%, and most patients have unresectable or metastatic conditions.2 Over the past decade, immunotherapy gradually become a novel and promising treatment for cancers; however, only a minor fraction of patients presents modestly prolonged survival.3 Under these circumstances, there is a desperate need to search for new diagnostic and therapeutic targets for PAAD patients, especially in terms of high potential immunotherapies.
Malignant tumors represent a highly heterogeneous and complex disease. The surrounding environment of tumor cells is termed the tumor microenvironment (TME), which consists of cancer cells, cancer-associated fibroblasts, stromal cells, immune cells, as well as extracellular molecules and inflammatory mediators.4,5 All subsets of immune cells can be observed in cancer tissues; however, differences exist in density, functionality, and organization between different tumors6. Among these immune cells, tumor-infiltrating B cells play crucial and controversial roles in the onset and progression of human cancers.7 Recent studies demonstrate that the infiltration of B cells or the existence of B cells associated genes is predominantly related to increasing survival rate in colorectal,8 breast9 and lung cancers,10 however, there is no meaningful association with gastric carcinoma.11 The anti-tumor effects of B cells are attributed to antibody secretion, Th1- aggrandizing cytokine production and formation of tertiary lymphoid structures (TLS).7 Discordant with other cancers, a study on PAAD identified that accumulation of the B cell subset in KRAS-driven PAAD mice tissues is conducive to cancer cell proliferations via IL-35-mediated stimulation.12 In the above studies, we wondered what roles B cells play in PAAD.
With the rapid development of high-throughput sequencing technology and bioinformatics analysis methods, numerous algorithms and tools have been applied to identify prognostic or therapeutic biomarkers.13 Weighted gene co-expression network analysis (WGCNA) is one of the most frequently used biological approaches that can discern co-expressed genes associated with a sample trait according to similarity in expression profiles among samples, which is beneficial for obtaining modules or core gene signatures related to characteristics.13 The immune-associated signatures of 28 immune cell subsets were downloaded from TISIDB, a tumor and immune system interaction database.14 Thereafter, the gene set variation analysis (GSVA) package was applied to calculate the degree of immune cell infiltration based on gene expression profiles.15 These methods have been employed to estimate the relative abundance of immune cells in various cancers, such as hepatocellular carcinoma16 and cutaneous melanoma.17
In this context, we first calculated the relative abundance of 28 immune cell subsets using the GSVA package according to the PAAD gene expression profiles. Then, WGCNA was implemented to identify the vital modules and key genes related to B cells. A five-gene prognostic model related to B cells was identified and verified using Cox regression and the least absolute shrinkage and selection operator (LASSO) model. The survival analysis of these five genes was further assessed. This is the first study to explore a prognostic model associated with B cells in PAAD.
Materials and Methods
Sample Datasets
The RNA sequencing and clinical data of PAAD were downloaded from the TCGA database. Generally speaking, patients died within 30 days possibly owing to nonneoplastic factors such as hemorrhage or severe infection or other complicating diseases. The data included 172 samples that have complete information or overall survival time of more than 30 days and was defined as a combined set. These samples from the combined set were stochastically and fairly divided into two sets: training and validation sets (Table S1). Training set was applied to identify prognostic biomarkers and signature, and validation and combined sets were used for verifying the reliability of results. Fragments Per Kilobase per Million (FPKM) was used for normalizing gene expression values. All data are publicly available.
Estimation of Tumor-Infiltrating Immune Cells
Gene signatures of twenty-eight tumor-infiltrating immune cells were downloaded from TISIDB database14 and R package “GSVA” that employing single sample Gene Set Enrichment Analysis (ssGSEA) algorithm was used to calculate the specific infiltration ratio of immune cells in each sample.15 These 28 immune cells included as following:18 Activated CD8+ T cell, Central memory CD8 T cell, Effector memory CD8+ T cell, Activated CD4+ T cell, Central memory CD4+ T cell, Effector memory CD4+ T cell, T follicular helper cell, Gamma delta T cell, Type 1 T helper cell, Type 17 T helper cell, Type 2 T helper cell, Regulatory T cell, Activated B cell, Immature B cell, Memory B cell, Natural killer cell, CD56bright natural killer cell, CD56dim natural killer cell, Myeloid derived suppressor cell, Natural killer T cell, Activated dendritic cell, Plasmacytoid dendritic cell, Immature dendritic cell, Macrophage, Eosinophil, Mast cell, Monocyte, neutrophils.
Construction of Gene Co-Expressed Network
Expression values of genes with the top 25% variance were inputted to construct a co-expressed network using R package “WGCNA”.19 Concrete procedures: Firstly, gene expression values were imported into the R project, Pearson’s correlation coefficient of genes encoded the strength of network connection; Secondly, to keep optimal mean connectivity between genes, the power value (soft thresholding) β was set to 6 (scale free R2 = 0.9); Thirdly, the adjacency matrix was transformed into the topological overlap matrix (TOM), “hclust” algorithm was applied for creating gene hierarchical clusters according to TOM dissimilarity; Fourthly, genes with strong corrections were clustered into the same module, surprisingly, WGCNA algorithm not only takes the relation between two genes into account, but also pays attention to whole associations between imported genes; Finally, hierarchical cluster of weight coefficient matrix and dynamic tree cut were also utilized for identifying modules.
Construction of Module-Trait Relationships
The module-trait relations were estimated using module eigengenes (MEs) and phenotypes (28 immune cells). Gene significance (GS) was calculated as mediated p value of association between gene expression levels and phenotypes. The module membership (MM) was defined as the relationship between expression profile and module eigengene.20 In this study, we selected a module that is green module with the highest correlation coefficient to B cells.
Functional Annotation for Genes in the Selected Module
In view of the above results, genes in the green module were chosen to perform functional annotation using a web tool “Metascape” (http://metascape.org).21 The top 20 enriched pathways or Gene Ontology (GO) terms were delineated as a bar graph. And pathways or GO terms with a similarity of more than 0.3 were linked by edges and drawn as a network graph.
Construction of the Prognostic Model
Genes in the green module (also called as B cells related module in this study) were extracted and subjected to the univariate Cox regression analysis using R package “survival”. Based on a cut-off value of p < 0.05 that was considered as a statistical significance, only 18 genes were selected into LASSO regression analysis using R package “glmnet”. Then, resulting nine genes were implemented multivariate Cox regression analysis. Following that, five genes and corresponding regression coefficients were obtained and risk scores of each sample were calculated based on the formula: Risk score = sum of each gene’s (regression coefficient × gene expression value). Patients were divided into high- or low-risk groups on account of the median value of risk scores; then, Kaplan–Meier methods and Log rank test were used to perform survival analysis of the two groups. The R package “survivalROC” was used to carry out time-dependent receiver operating characteristic (ROC) curves analysis. The comparison of independent prognostic value between risk score and clinical features was performed by univariate and multivariate Cox regression analysis.
Gene Set Enrichment Analysis (GSEA)
GSEA, a mighty analytical tool, is instrumental to distinguish enriched pathways of two different biological states.22 Using R packages “clusterProfiler” and “enrichplot”, enriched pathways from high- or low-risk groups were obtained.
Assessment of Tumor Microenvironment Component and Infiltration of Immune Cells in PAAD Tissues
Stromal and immune cells are the major cell components of tumor tissues and have a vital function on perturbing tumor signals. Estimation of Stromal and Immune cells in Malignant Tumours using Expression data (ESTIMATE) is an eminent algorithm that can calculate the fraction of stromal and immune cells based on the gene expression profile, which is achieved by using R package “estimate”.23 Estimate the Proportion of Immune and Cancer cells (EPIC) is an open-source web application that is applied for estimating the infiltration ratio of eight type cells included B cells, CD4+ T cells, CD8+ T cells, Endothelial, Macrophages, NK cells, cancer-associated fibroblasts (CAFs) and other cells.24 Similarly, Microenvironment Cell Populations-counter (MCP-counter)25 is another method that aims to compute the absolute abundance of various cell populations included eight immune and two stromal cell types: T cells, CD8 T cells, Cytotoxic lymphocytes, NK cells, B lineage, Monocytic lineage, Myeloid dendritic cells, Neutrophils, Endothelial cells, Fibroblasts. This way is unlike to EPIC algorithm that is employed to descript the relative proportions of multiple cell populations. All these methods were used to observe and verify the relevance between these five genes from the prognostic model and B cells.
Statistical Analysis
Continuous variables such as comparison of gene expressions between normal and PAAD tissues were analyzed by Student t test. Categorical variables such as the comparison between risk groups and tissues grade were analyzed by Chi-squared test. Pearson correlations analysis was conducted in the exploration of correlation between infiltration of immune cells and prognostic biomarkers. All data were analyzed and plotted by GraphPad Prism 8 (GraphPad Software Inc, La Jolla, CA) and R 3.6.1 (http://www.r-project.org/). A p value less than 0.05 was considered statistically significant.
Results
The Relative Abundance of Tumor-Infiltrating Immune Cells in PAAD
The analytical process is depicted in Figure 1. Gene signatures of 28 immune cell subsets were obtained from TISIDB, and the abundance ratio of these immune cells was calculated (Table S2). Correlations between immune cell subsets were analyzed and delineated in Figure 2. Strong relevance between activated B cells and immature B cells was presented, and the two B cells were moderately related to memory B cells, respectively.
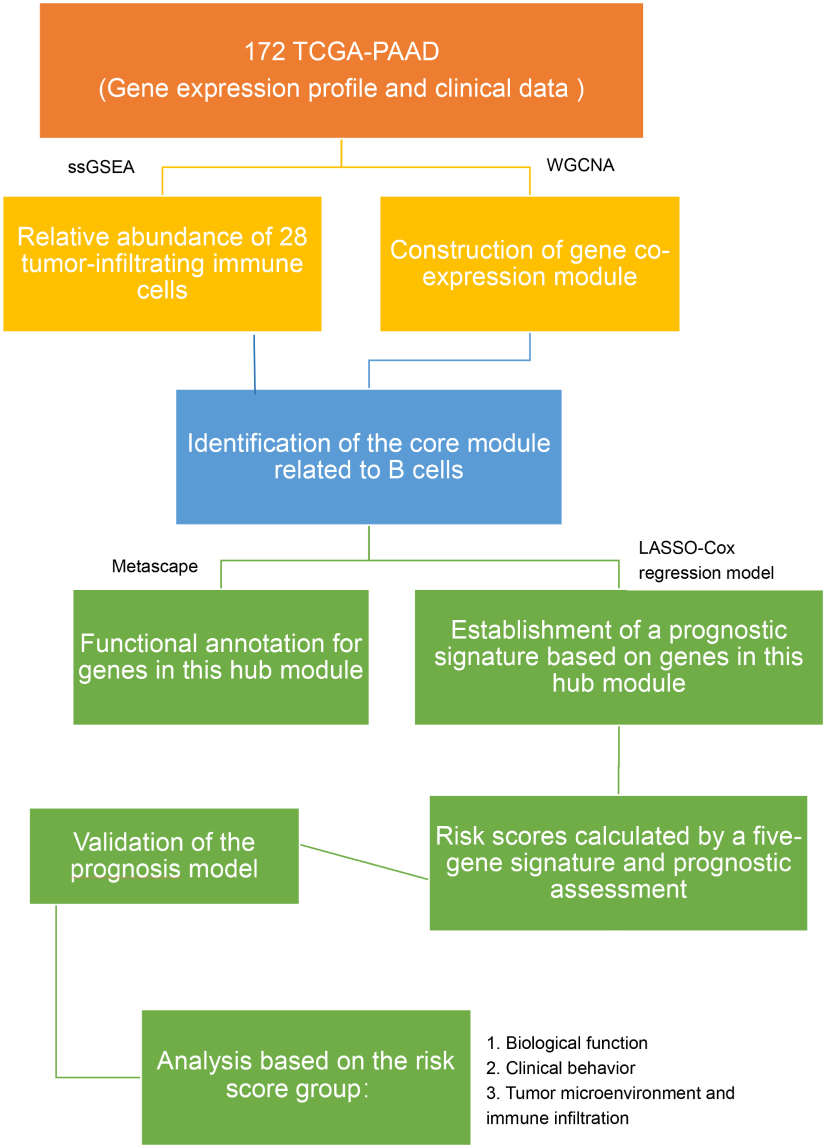 |
Figure 1 The workflow of the present study. |
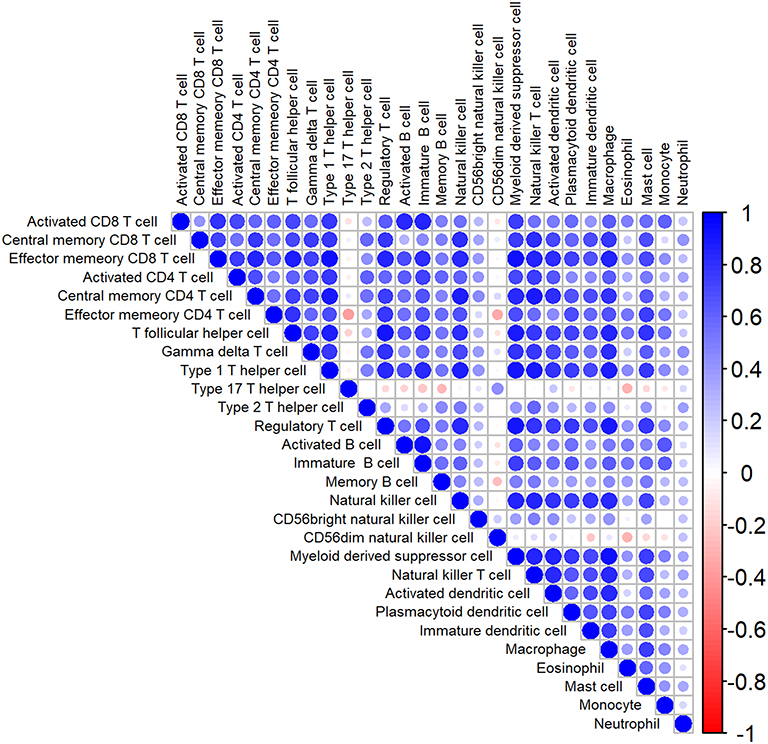 |
Figure 2 The heatmap of correlation among immune cells. Blue: positive correlation; red: negative correlation; size of circle: the stronger the correlation, the larger the circle and deeper colors. |
Identification of B Cells Related Modules and Functional Annotation
Gene expression profiles from 172 PAAD samples were used to construct co-expressed modules by R package “WGCNA”. The power of β = 6 (scale free R2 = 0.9) was picked as the soft-thresholding parameter to define scale-free topology (Figure 3A). Eight modules were generated by hierarchical clustering with dynamic hybrid cutting (Figure 3B), and turquoise module had the most genes (1137 genes) and least genes (163 genes) in black module (Table S3). Module traits were estimated by calculating correlations between module eigengene and immune cells. As shown in Figure 3C, green module was closely associated with multiple immune cell subsets. Among these subsets, immature B cells and activated B cells had the highest relevance with green module (R2 = 0.91, p= 1e-65; R2 = 0.83, p= 1e-44). Also, memory B cells are significantly related to green module (R2 = 0.56, p= 1e-15). Scatterplots of Gene Significance in B cell subsets vs Module Membership in green module were plotted, respectively (Figure 3D–F), which further identified this green module as B cells related and core module. Thus, in this work, we focused on genes in green module. Three hundred and sixty-six genes in this module were extracted and performed functional annotation by a web tool “Metascape”. Delightedly, top 20 enrichment terms were all immune-associated terms, such as Cytokine-mediated Signaling Pathway, Adaptive Immune System and Lymphocyte Activation (Figure 4).
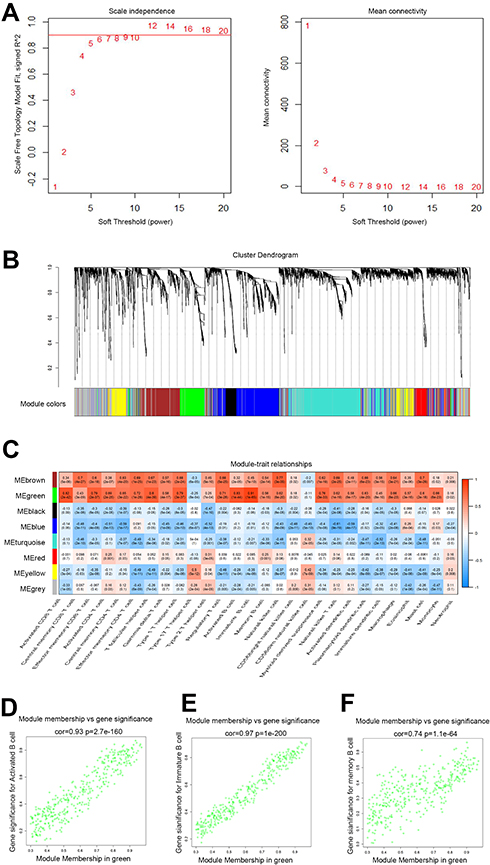 |
Figure 3 Identification of B cells closely related module. (A) Analysis of the scale-free fit index and mean connectivity for various soft-thresholding powers. The appropriate scale-free topology can be obtained at the soft-thresholding power of 6; (B) genes are grouped into divergent modules by hierarchical clustering. Different colors represented different modules and each color-marked module included a group of highly connected genes. A total of eight modules were identified; (C) heatmap of connection between module eigengenes and immune cell subsets; (D–F) scatterplots of Module Membership (MM) in the green module and Gene Significance (GS) for Activated B cells (D), immature B cells (E) and Memory B cells (F). |
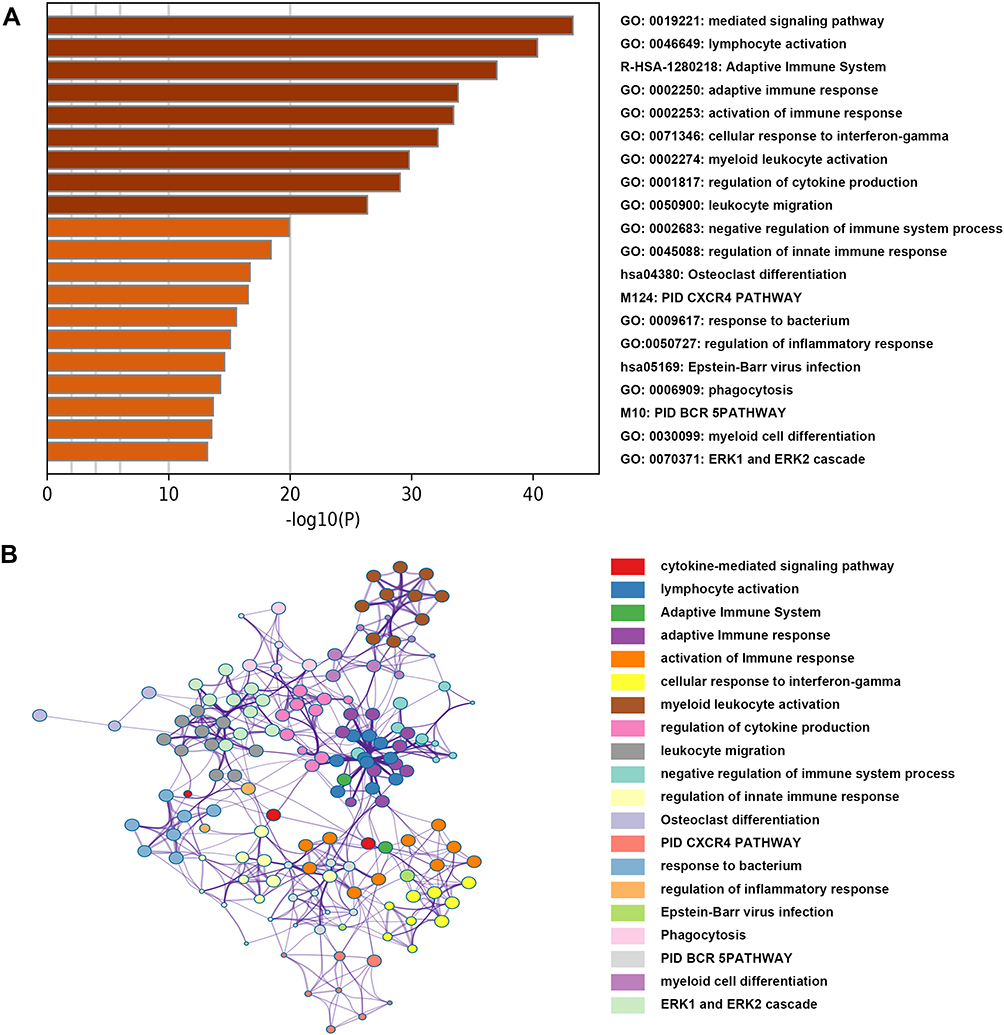 |
Figure 4 Functional annotation for genes in the green module. (A) The bar chart showed the top twenty enriched terms; (B) the network diagram was constructed with enriched terms as nodes and similarities as edges. Each color of nodes represented a various term. |
Derivation of Prognostic Genes in B Cells Related Module and Establishment of a Five-Gene Signature Risk Score Model
The expression values of 366 genes in green module were extracted and carried out using univariate Cox proportional hazard regression analysis in training set (Figure 5A). Then, screening eighteen genes with statistical significance (p < 0.05) were input in least absolute shrinkage and selection operator (LASSO) regression (Figure 5B and C) and resulting nine genes were analyzed utilizing multivariate Cox regression analysis. Ultimately, the prognostic model was identified and consisted of five genes (Table 1): AT-Rich Interaction Domain 5A (ARID5A), C-Type Lectin Domain Family 2 Member B (CLEC2B), Microtubule Associated Monooxygenase, Calponin And LIM Domain Containing 1 (MICAL1), Marginal Zone B and B1 Cell Specific Protein (MZB1), Rap Guanine Nucleotide Exchange Factor 1 (RAPGEF1). All genes except for CLEC2B were regarded as protective factors according to HR value <1. The specific calculation formula of risk score was as following: Risk score = (−0.502) * ARID5A expression level + 1.226 * CLEC2B expression level + (−0.419) * MICAL1 expression level + (−0.309) * MZB1 expression level + (−0.757) * RAPGEF1 expression level.
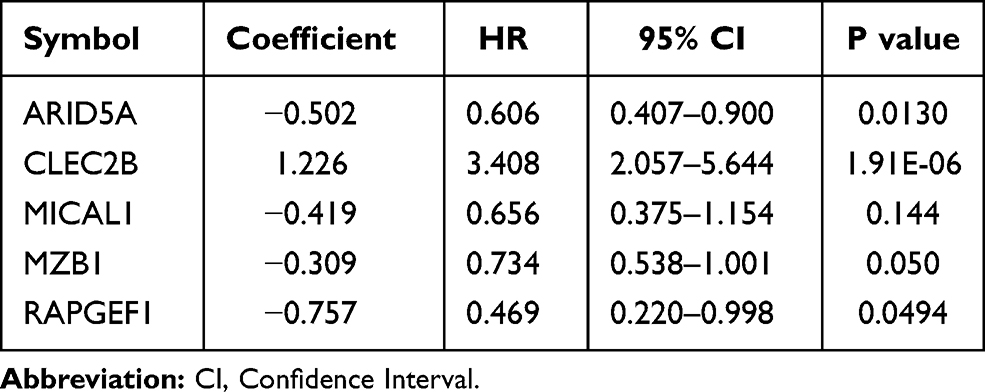 |
Table 1 Five Genes Identified from Cox Regression Analysis in the Training Set |
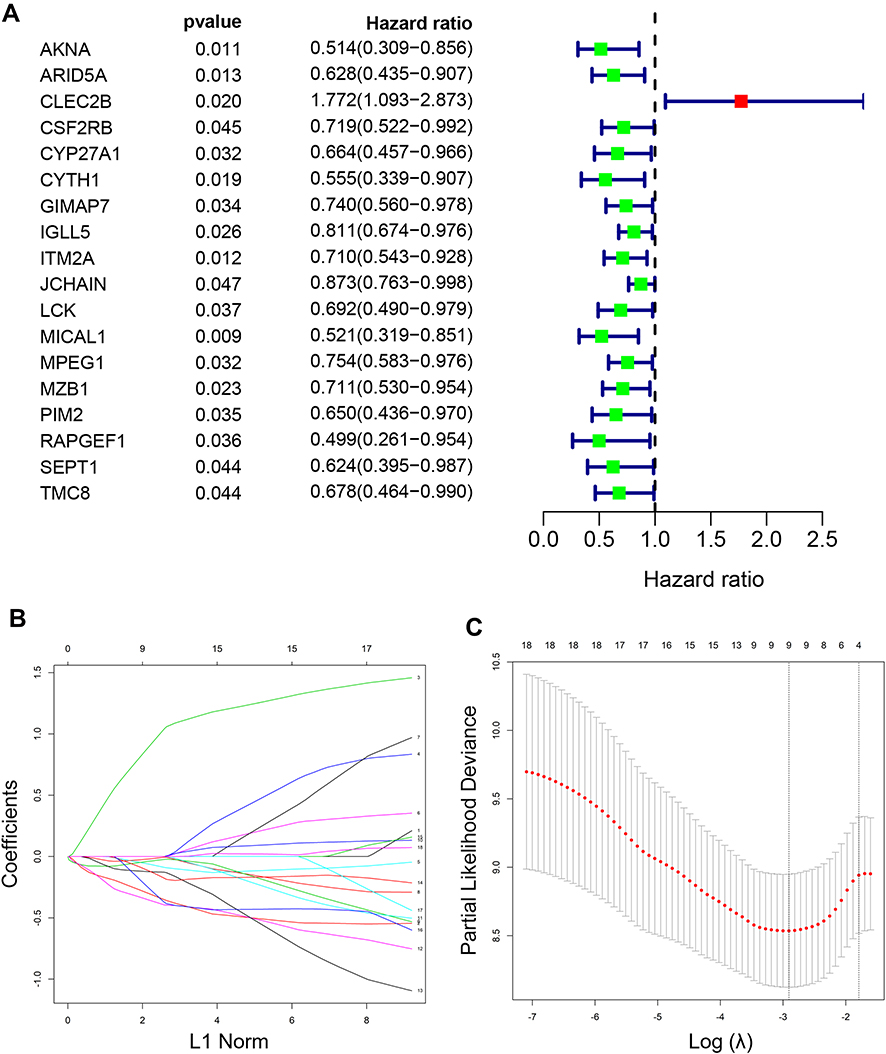 |
Figure 5 Establishment of a five-gene prognostic signature in the training set. (A) Forest plot for visualizing the HRs of 18 genes with statistical significance after univariate COX analysis (p<0.05). Green: protective association; Red: risk factors; (B) LASSO coefficient profiles of the 18 genes; (C) the partial likelihood deviance plot showed the minimum value corresponds to the covariate used for multivariate Cox analysis. Abbreviation: LASSO, leas absolute shrinkage and selection operator. |
Prognostic Assessment by the Five-Gene Signature in PAAD and Validation of This Model
According to the calculation formula from the five-gene signature, risk scores of each patient in the training set were acquired, and these patients were divided into two groups with high or low risk on the basis of median cutoff value of risk scores. Figure 6A delineates the distribution of risk scores, survival time and five gene expression values for each patient. And K-M plot showed that patients with high-risk scores had an abysmal survival rate compared with low-risk group (Figure 6B). Further, ROC curves were employed to evaluate the sensitive and specificity of survival prediction in view of this five-gene signature. Strikingly, the area under the curve (AUC) of risk scores was 0.783 for one-year survival and 0.797 for three-year survival; however, the AUC of another clinical features including age, gender, stage, grade, alcohol, diabetes and chronic pancreatitis exposure histories were all less than 0.6 for one-year or three-year survivals (Figure 6C and D). Additionally, univariate and multivariate Cox regression analysis were also used to assess the performance of this five-gene prognostic model and other familiar prognostic effectors. To our amazement, only this risk score model could be considered as an independent prognostic factor (p < 0.05) (Figure S1, Figure 6E). Subsequently, risk scores with the five-gene signature were calculated in validated and combined sets. Higher risk scores had a dismal prognostic and the AUC of one-year and three-year survival were all more than 0.6 in validated and combined sets (Figure 7), which was coincident with consequences in the training set.
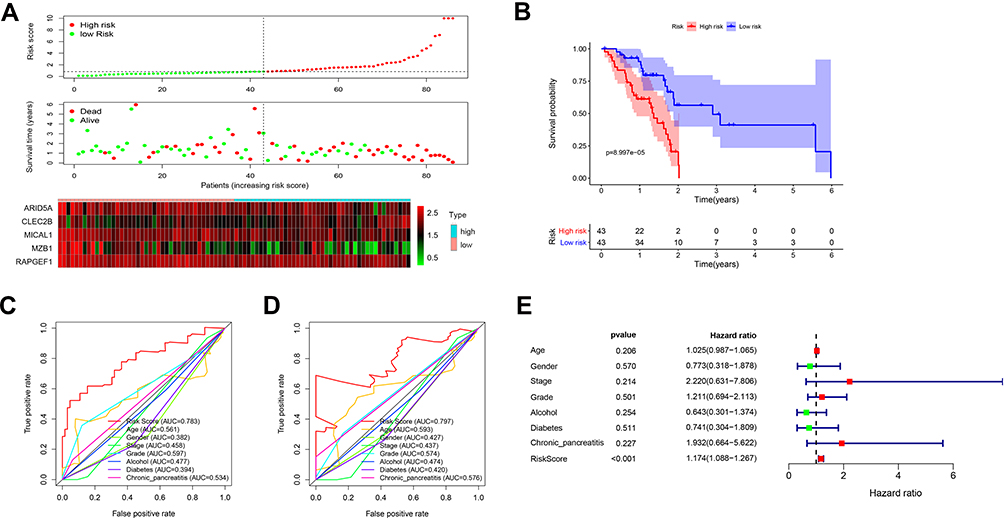 |
Figure 6 The five-gene signature predicts overall survival in PAAD. (A) The distribution of risk score, survival time and status, and expressions of these five genes; (B) Kaplan-Meier survival curves of high- and low-risk groups based on the five-gene signature; (C and D) the one-year (C) and three-year (D) ROC curves for survival prediction; (E) forest plot for visualizing independent prognostic effect analyses between the five-gene signature and commonly used prognostic factors utilizing multivariate Cox regression model. Abbreviation: ROC: receiver operating characteristic. |
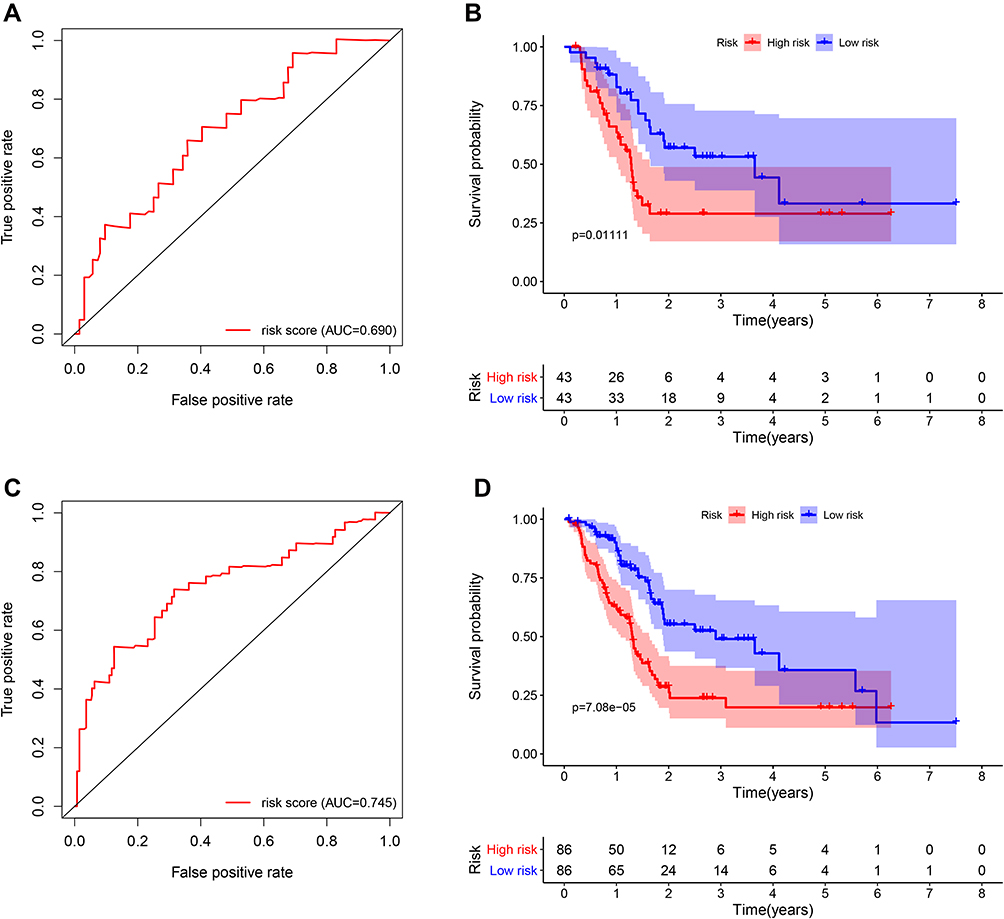 |
Figure 7 Survival and ROC curves for the five-gene signature in the validation and combined sets. (A and C) ROC curves for survival prediction based on the five-gene signature in the validation (A) and combined sets (C); (B and D) Kaplan–Meier plots for survival times in the validation (B) and combined sets (D). Abbreviation: ROC, receiver operating characteristic. |
Biological Functions and Clinical Behaviors of the Prognostic Model Based on the Five-Gene Signature in PAAD
Risk scores of each sample in the combined set were obtained and patients were divided into high-risk group and low-risk group in accordance with the median risk score. As shown in Figure 8, low-risk group was mainly enriched to immune-related pathways such as cytokine-cytokine receptor interaction, chemokine signaling pathway, primary immunodeficiency. Next, tumor purity and infiltrating levels of stromal or immune cells were predicted. Results presented that the scores of stromal and immune were significantly elevated in low-risk group than high-risk group (Figure 9A–D). Moreover, an evidently aggrandized proportions of Activated B cells and Immature B cells were observed in low-risk group (Figure 9F and G). Conversely, tumor purity was markedly reduced in the low-risk group (Figure 9E). Afterwards, relationships between risk scores and clinical characteristics were investigated, and the outcome displayed that only gender and grade had statistical significances with this risk model (Table 2). Patients with male or high grade (G3-G4) emerged obviously higher risk scores (Figure 10).
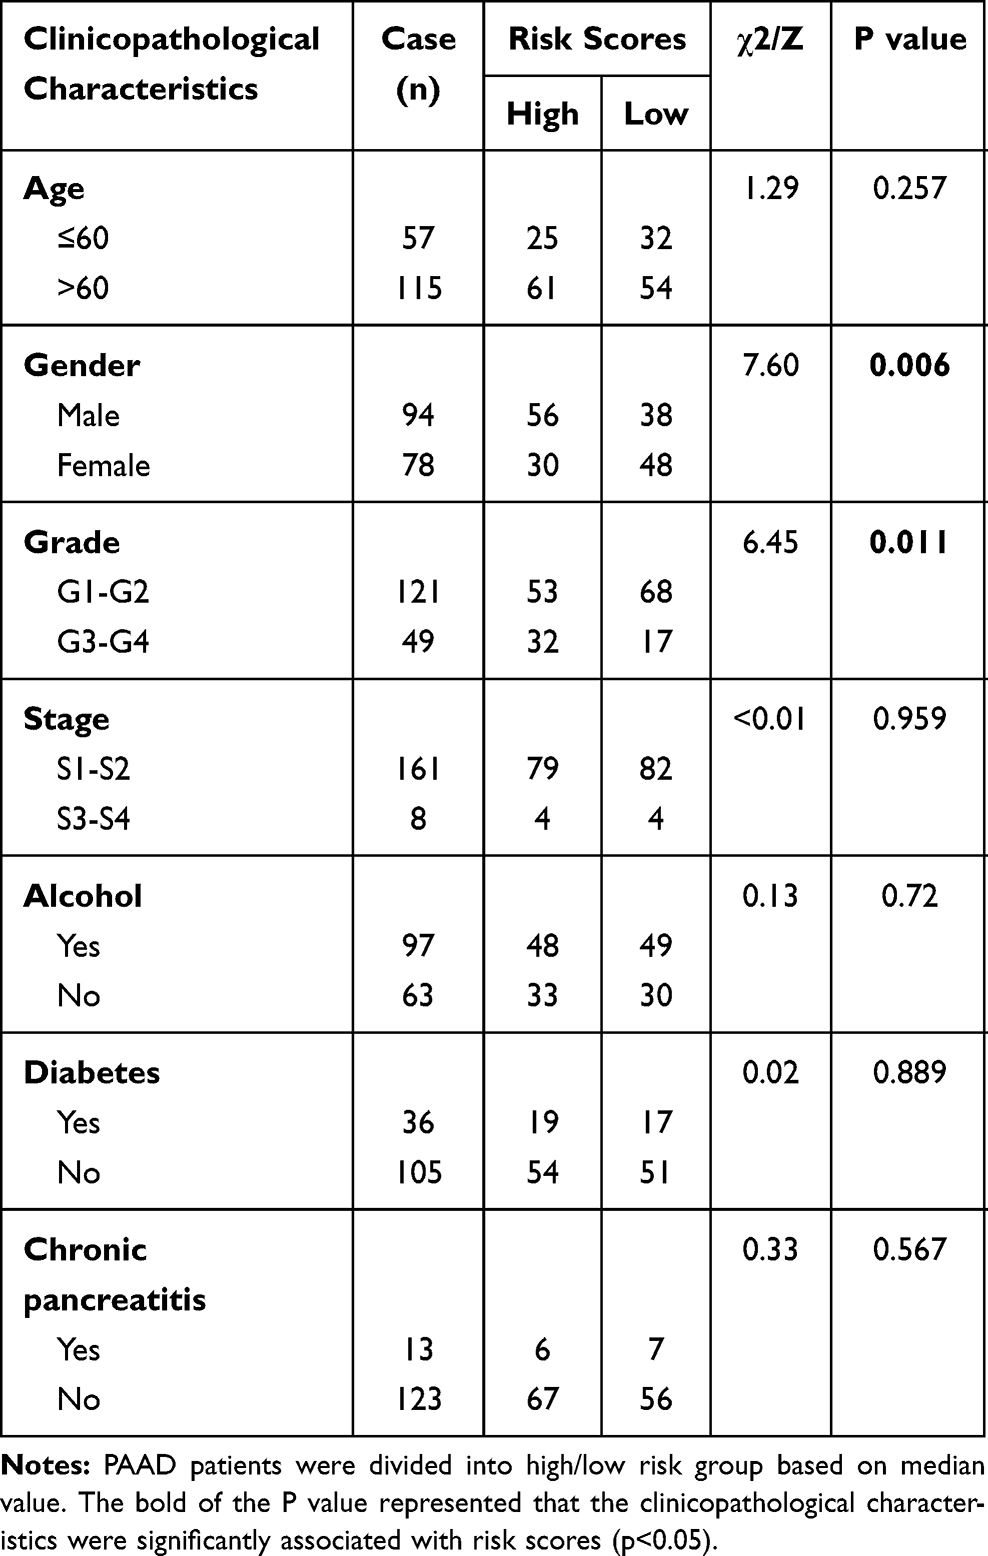 |
Table 2 Correlation Between Risk Scores and Clinicopathological Characteristics in PAAD Patients |
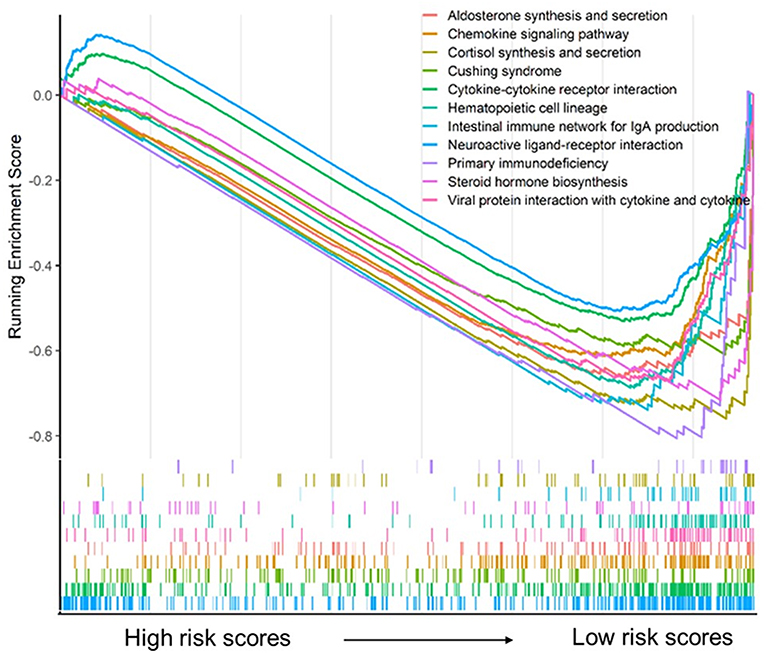 |
Figure 8 Gene set enrichment analysis for the five-gene signature. |
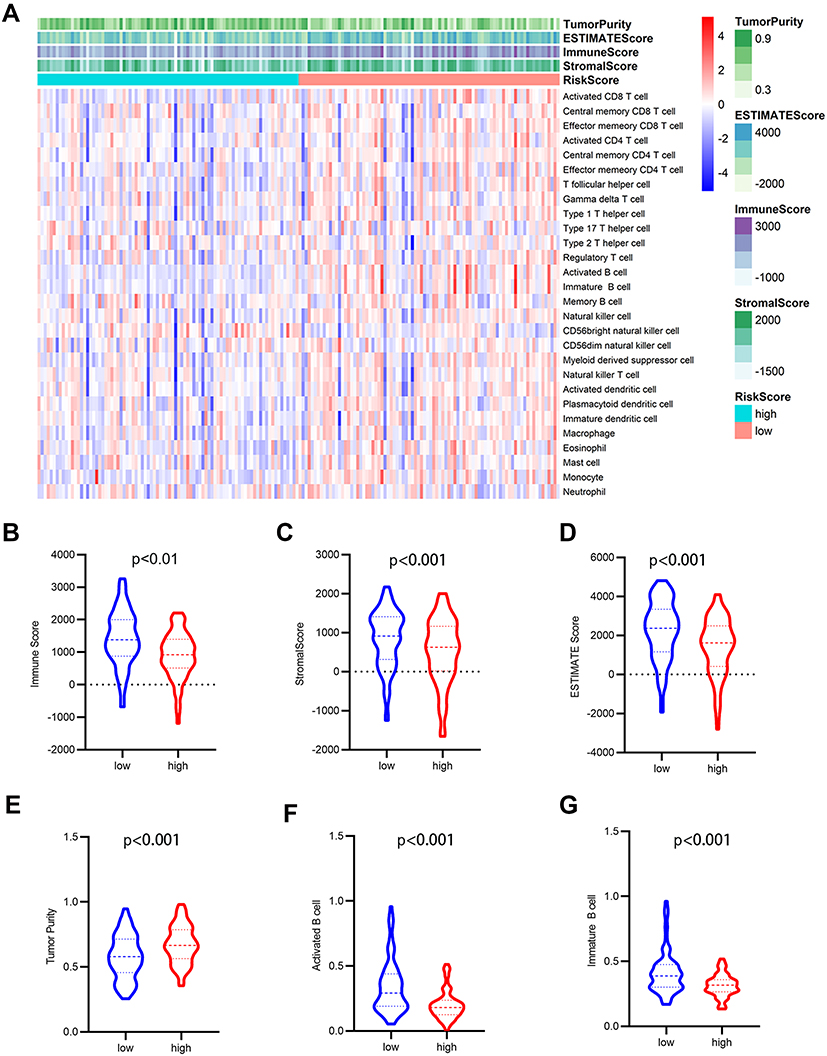 |
Figure 9 Analysis of tumor microenvironment for the five-gene signature. (A) The heatmap depicted the immune and stromal scores, tumor purity, also relative abundance of 28 immune cell subsets using ssGSEA and ESTIMATE method. (B–G) violin plots showed comparison between high- and low- risk group in the Immune scores (B), stromal scores (C), ESTIMATE scores (D), tumor purity (E), activated B cells (F), immature B cells (G). |
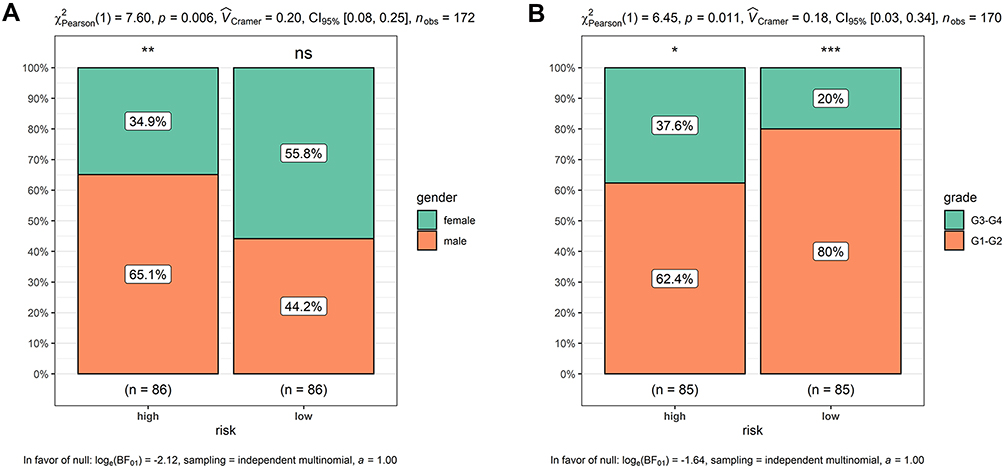 |
Figure 10 Higher risk scores in the male or high-grade patients. (A) Male patients had apparently higher risk scores; (B) high-grade patients presented obviously higher risk scores. *p < 0.05, **p < 0.01, ***p < 0.001. Abbreviation: ns, no significance. |
Immune Infiltration and Survival Analysis of the Five Selected Prognostic Genes
Previous consequences in this work revealed that the five-gene signature was closely pertaining to immunological molecules and cells and acted as a pivotal role for prognostic assessment. Thus, we further explored the relationship between each gene of this signature and immune infiltrating cells and survival. Clearly, these five genes were affinitive with B cells based on TISIDB database, especially ARID5A, MZB1 and RAPGEF1 (Figure 11A). Additionally, we also applied other algorithms and tools including MCPcounter and EPIC to further corroborate the predominant association between these five genes and B cells (Figure 11B–K). Finally, expression levels and survival curves of the five genes are depicted in Figure 12. Expressions of ARID5A and MICAL1 were both apparently diminished in tumor tissues compared with adjacent normal tissues, and functioned as suppressor genes in line with K-M plots (Figure 12A, C and Figure 12F, H).
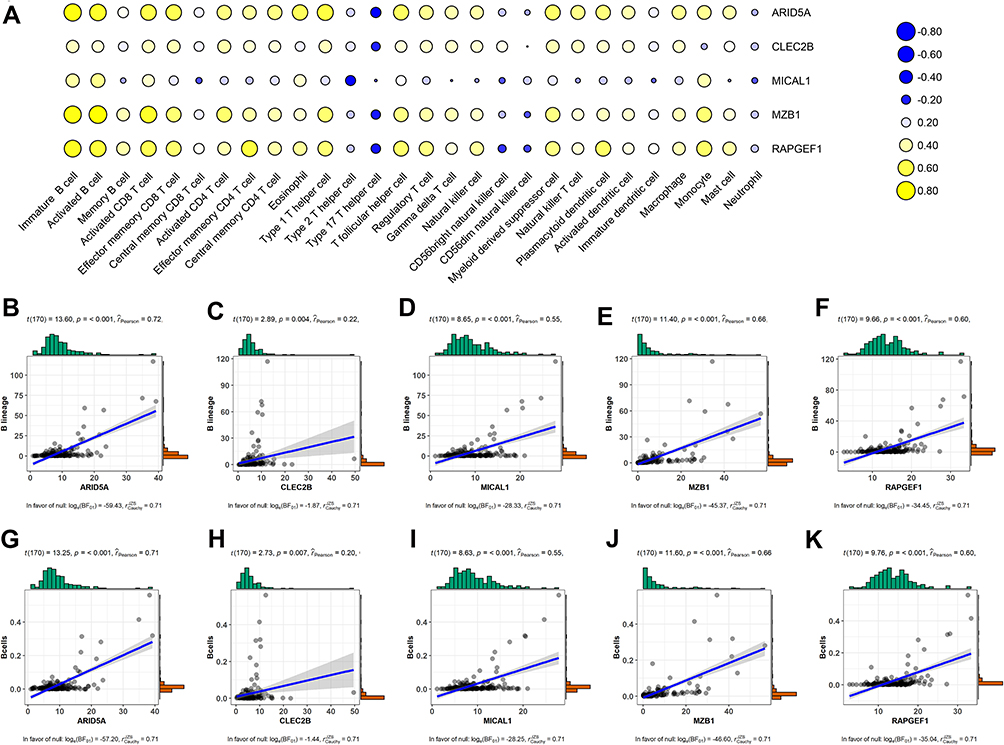 |
Figure 11 Association between the five genes in the prognostic signature and immune cell subsets based on different databases. (A) Heatmap of correlation between the five genes and twenty-eight immune cells from the TISIDB database. Blue: Positive correlation; Yellow: negative correlation; Size circle: the stronger the correlation, the larger the circle. (B–F) relevance between expressions of these five genes and B cells using MCPcounter. (G–K) relevance between expressions of these five genes and B cells using EPIC. Abbreviations: TME, tumor microenvironment; MCPcounter, Microenvironment Cell Populations-counter; EPIC, Estimate the Proportion of Immune and Cancer cells. |
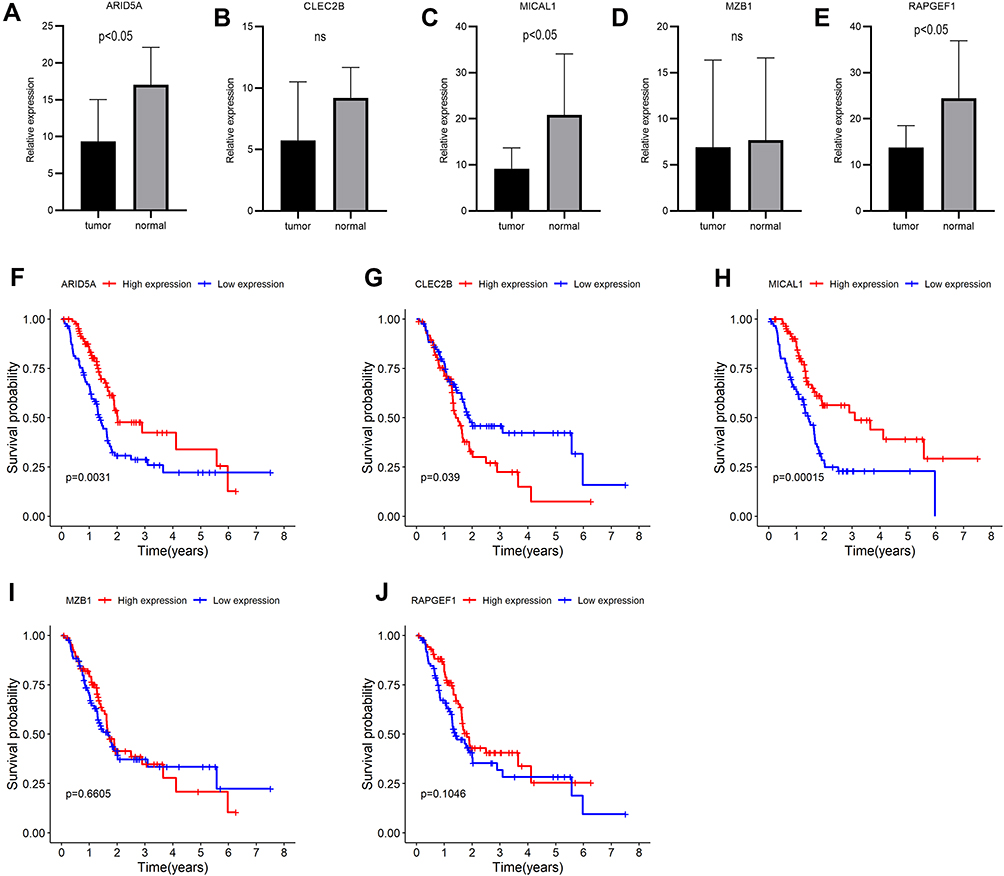 |
Figure 12 Expressions and survival curves of the five genes of the prognostic signature in PAAD. (A–E) Expressions of the five genes in PAAD and adjacent-normal tissues: (A) ARID5A, (B) CLEC2B, (C) MICAL1, (D) MZB, (E) RAPGEF1; (F–J) Survival analysis of the five genes: (F) ARID5A, (G) CLEC2B, (H) MICAL1, (I) MZB1, (J) RAPGEF1. |
Discussion
It is well known that resection is the only cure for PAAD; nevertheless, the prognosis for this minor fraction of patients diagnosed with locally resectable tumors is still abysmal, with 20% to 25% survival in the 5 years following operation.1 Furthermore, chemotherapies, targeted therapies, or immunotherapies have inconspicuous effects for advanced patients, which are presumably due to the unique characteristics of PAAD, including a low-moderate mutational burden and lower immunogenic potential, as well as physical dense fibrotic stroma that impedes the delivery of medicine and immune cell infiltration.26–28 Immune checkpoints such as CTLA4, PD1, and PD-L1 were the first to enter clinical fields, initially applied for metastatic melanoma29 with amazing effects, and are now gradually used for other cancers such as kidney, bladder, lung, head and neck cancers.30–33 However, the use of CTLA4 antibodies alone in patients with advanced or metastatic PAAD does not prolong survival.34 Similarly, the consequences of clinical trials on the application of anti-PD1 agents in patients with advanced PAAD are also disillusionary.35 Notwithstanding this, immunotherapies are regarded to be the most active fields in cancer studies nowadays.36 Thus, it is desperately needed to step outside the present therapeutic paradigm and explore novel immune-related biomarkers and targets. In this study, we focused on B cells' associated genes and identified a five-gene signature related to B cells for predicting prognosis of patients with PAAD.
As reported, B cells in the TME are active and can produce immunostimulatory factors that promote an anti-tumor immune response in PAAD.37 The infiltration of B cells in different tumor tissues has favorable prognostic effects on patients.7 A plausible explanation for the beneficial effect of B cell infiltration in TME may be related to antibody production, antigen presentation functions, and optimal induction of CD4+ and CD8+ T cells, which attenuate tumor invasion and metastasis.38,39 Another possibility may be that the existence of B cells first reflects the whole immunity of patients, and those who can elicit an immune response may choose to be in a better overall condition.10 However, Yuliya et al reports that IL-35 producing B cells can accelerate the development of pancreatic neoplasia. The pro-tumorigenic effects of B cells may be developed by promoting chronic inflammation in tumor surroundings and an immunosuppressive microenvironment.12 In addition, studies have demonstrated that B cells could alternatively boost macrophage activation and alleviate T cell mediated anti-tumor response.40,41 In short, roles of B cells in the TME remain unclear. In this study, we first obtained the immune cell components of each sample in the TME using gene expression profiles. WGCNA was then applied to construct gene co-expressed modules associated with immune cell subsets. Among these modules, the green module had the strongest relevance to B cells (Figure 3). Additionally, genes in this module were extracted to perform functional annotation, and the resulting pathways were closely related to the immune response or cytokines.
There is accumulating evidence that molecular predictors could have great potential in promoting clinical decision making.42,43 For example, a 21-gene signature for predicting breast cancer patient prognosis has been conducted in clinical work.44 In the past decade, studies have revealed that signatures can predict the prognosis of PAAD patients, such as a four-gene prognostic model, a five-miRNA signature, or a three-lncRNA signature. Nevertheless, these molecules in the prognostic models were all based on differentially expressed analysis between PAAD tumors and normal tissues, and heterogeneity existed among divergent patients, which may cause negligence of other genes involved in tumorigenesis. Hence, we utilized gene expression values in the green module and patients’ clinical information, especially survival time and state, to build a five-gene signature using the LASSO-Cox regression model in the training set for prognostic risk assessment. Using the computing formula of this five-gene signature, the risk scores for each patient were identified, and patients were then stratified based on the median risk score. Patients with high-risk scores had an awful survival rate, and this five-gene signature had satisfactory sensitivity and specificity for predicting the prognosis of PAAD patients (AUC > 0.75). Compared with other clinical indicators, only this five-gene signature could function as an independent predictor (Figure 6E). Intriguingly, this prognostic model was confirmed in the validated and combined sets (Figure 7).
To further explore the potential molecular mechanism underlying the prognostic effects of the five-gene signature, GSEA analysis was performed according to the stratification of risk scores. Attractively, the low-risk score group was mainly enriched in immune-related pathways such as chemokine signaling pathway, cytokine-cytokine receptor interaction, and primary immunodeficiency (Figure 8). Using the ESTIMATE algorithm and ssGSEA method, the infiltrating degree of immune and stromal cells was apparently elevated in the low-risk score group, while tumor purity was significantly reduced (Figure 9). The TME is a complex environment surrounding tumor cells that embodies various immune cells, stroma, and assorted molecules, and so on.45 It not only regulates tumor proliferation and metastasis, but also has a considerable influence on treatment outcome.46 The immune system plays a pivotal role in countering tumor development and metastasis in multiple cancers, including PAAD.47 Adile et al demonstrated that high infiltration of CD8+ CD3+ lymphocytes increased the survival time of patients with resected PAAD. Conversely, FoxP3+ Tregs function as immunosuppressants, and their high infiltration in the TME indicates an inferior prognosis.48 Notably, NK cells and CD8+ T cells directly lead to apoptosis of tumor cells by mediating perforin and granzyme, which consequently prevents tumorigenesis and development.49 Nevertheless, B cells play controversial roles in the onset of cancers.7 In this study, further exploration for the association between B cells and risk scores was performed, and the resulting activated B cells and immature B cells were both markedly ascending in low-risk score group. To some extent, these results hinted at the possible anti-tumor effects of B cells in PAAD.
Based on the above findings, we hypothesized that the five-gene signature from the B cells-related module had a favorably predicted prognosis value. This signature included ARID5A, CLEC2B, MICAL1, MZB1, and RAPGEF1. Interestingly, we observed that these five genes were indeed significantly relevant to B cells (Figure 11), and analogous results were discovered using divergent algorithms and databases (Figure 11). Additionally, ARID5A, MICAL1, and RAPGEF1 showed an obvious decline in PAAD tumor tissues compared to adjacent normal tissues; moreover, high expression of ARID5A and MICAL1 resulted in a longer survival time. Several studies have emphasized the immunological function of AT-rich interactive domain-containing protein 5a (ARID5A), an RNA-binding protein (RBP).50 The synthesis and degradation of ARID5A is regulated by Toll-like receptor 4 (TLR4)-induced NF-kB and MAPK pathways.51 Upon inflammation, ARID5A can translocate from the nucleus to the cytoplasm, which aims to stabilize inflammatory mRNA transcripts, such as IL-6, Stat3, Ox40 and T-bet.52–55 As reported, ARID5A can bind to the 3ʹ-untranslated region of IL-6, advancing the production of IL-6 and protecting IL-6 from degradation.52 Another study found that ARID5A has a direct effect for the differentiation of naïve CD4+ T cells to inflammatory CD4+ T cells, especially Th 17 cells, via selective stabilization of Stat3.52 However, studies on the association between ARID5A and B cells and their functions in cancers remain rare. CLEC2B, a member of the C-type lectin domain family 2, first called activation-induced C-type lectin (AICL), has been identified as a protein encoded by the natural killer (NK) gene complex proximal CD69, and has a high expression level during lymphocyte activation. Recent studies have revealed that members of the CLEC-2 family actively participate in inflammation, immune response, and cell adhesion. Gao et al reported that CLEC2B acts as one of the genes in a 6-gene signature to predict the survival of melanoma patients. MICAL1, a multidomain flavoprotein monooxygenase, has been well documented to have a favorable effect on breast cancer cell proliferation by enhancing the expression of CDK4 and cyclin D through ROS-sensitive PI3K-AKT pathways.56 In addition, research has shown an interaction between MICAL1 and NEDD9 in promoting gastric cancer cell invasion and metastasis upon hypoxia.57 During the differentiation of B cells into plasma cells, Marginal zone B- and B1-cell-specific protein (MZB1) can influence the secretion of IgM.58 Multiple studies have illustrated that MZB1 acts as an inhibitor of the onset of various cancers.59–61 RAPGEF1, also known as C3G, an exchange factor for Rap1 and Ras family, presents considerable and controversial functions in the proliferation, invasion, and apoptosis of cancer cells. It acts as an oncogene in small cell lung carcinomas62 and has a protective function against squamous cervical carcinogenesis.63 In brief, although some studies have reported the association between these five genes and the occurrence of cancers, the concrete mechanisms of action of these genes, as well as their relationship with B cells in the onset of PAAD, remain to be further explored.
This study has some limitations. Larger specimen size, including clinical parameters and gene expression profiles of patients, were supposed to be used for data processing as well as final results. In addition, it would be more convincing if cell and animal experiments were conducted to verify the roles of B cells in the occurrence of PAAD and the relevance between these five genes and B cells along with cancer. Lastly, the five-gene signature related to B cells to predict prognosis of patients with PAAD needs to further explore their molecular mechanisms and clinical applications of this signature.
Conclusion
This is the first attempt to focus on B cell related genes in the TME of PAAD utilizing WGCNA and ssGSEA algorithms along with TCGA and TISIDB databases. Findings from the present work established and verified B cells related five-gene signature for assessing the survival time of patients, also initially exploring the possibly involved pathways of this five-gene signature in the occurrence and development of PAAD. Our work provided a novel point to study prognostic biomarkers and targeted agents of PAAD.
Data Sharing Statement
The datasets analyzed during the current study are available in the TCGA database (https://portal.gdc.cancer.gov/repository) and TISIDB database (http://cis.hku.hk/TISIDB/).
Acknowledgments
We are very grateful to TCGA, TISIDB databases for freely providing PAAD data. We also thank Editage (www.editage.com) for English language editing.
Funding
This work was supported by National Natural Science Foundation of China (No. 81960439 and No. 81960119).
Disclosure
The authors report no conflicts of interest for this work.
References
1. Mizrahi JD, Surana R, Valle JW, Shroff RT. Pancreatic cancer. Lancet. 2020;395(10242):2008–2020. doi:10.1016/S0140-6736(20)30974-0
2. Siegel RL, Miller KD, Jemal A. Cancer statistics, 2019. CA Cancer J Clin. 2019;69(1):7–34.
3. Ye C, Zheng L, Yuan CH. [Pancreatic ductal adenocarcinoma immune microenvironment and immunotherapy prospects]. Zhonghua Wai Ke Za Zhi. 2019;57(1):10–15. Chinese.
4. Chen DS, Mellman I. Oncology meets immunology: the cancer-immunity cycle. Immunity. 2013;39(1):1–10. doi:10.1016/j.immuni.2013.07.012
5. Hanahan D, Coussens LM. Accessories to the crime: functions of cells recruited to the tumor microenvironment. Cancer Cell. 2012;21(3):309–322. doi:10.1016/j.ccr.2012.02.022
6. Fridman WH, Remark R, Goc J, et al. The immune microenvironment: a major player in human cancers. Int Arch Allergy Immunol. 2014;164(1):13–26.
7. Silina K, Rulle U, Kalnina Z, Line A. Manipulation of tumour-infiltrating B cells and tertiary lymphoid structures: a novel anti-cancer treatment avenue? Cancer Immunol Immunotherapy. 2014;63(7):643–662. doi:10.1007/s00262-014-1544-9
8. Richards CH, Flegg KM, Roxburgh CS, et al. The relationships between cellular components of the peritumoural inflammatory response, clinicopathological characteristics and survival in patients with primary operable colorectal cancer. Br J Cancer. 2012;106(12):2010–2015. doi:10.1038/bjc.2012.211
9. Chen Z, Gerhold-Ay A, Gebhard S, et al. Immunoglobulin kappa C predicts overall survival in node-negative breast cancer. PLoS One. 2012;7(9):e44741. doi:10.1371/journal.pone.0044741
10. Pelletier MP, Edwardes MD, Michel RP, Halwani F, Morin JE. Prognostic markers in resectable non-small cell lung cancer: a multivariate analysis. Can J Surg. 2001;44(3):180–188.
11. Dong J, Li J, Liu SM, et al. CD33(+)/p-STAT1(+) double-positive cell as a prognostic factor for stage IIIa gastric cancer. Med Oncol. 2013;30(1):442. doi:10.1007/s12032-012-0442-2
12. Yuliya PG, Das S, Handler JS, et al. IL35-producing B cells promote the development of pancreatic neoplasia. Cancer Discov. 2016;6(3):247–255. doi:10.1158/2159-8290.CD-15-0843
13. Lin T, Gu J, Qu K, et al. A new risk score based on twelve hepatocellular carcinoma-specific gene expression can predict the patients’ prognosis. Aging. 2018;10(9):2480–2497. doi:10.18632/aging.101563
14. Ru B, Wong CN, Tong Y, et al. TISIDB: an integrated repository portal for tumor-immune system interactions. Bioinformatics. 2019;35(20):4200–4202. doi:10.1093/bioinformatics/btz210
15. Hanzelmann S, Castelo R, Guinney J. GSVA: gene set variation analysis for microarray and RNA-seq data. BMC Bioinform. 2013;14:7. doi:10.1186/1471-2105-14-7
16. Zhang YP, Bao ZW, Wu JB, et al. Cancer-testis gene expression in hepatocellular carcinoma: identification of prognostic markers and potential targets for immunotherapy. Technol Cancer Res Treat. 2020;19:1533033820944274. doi:10.1177/1533033820944274
17. Huang B, Han W, Sheng ZF, Shen GL. Identification of immune-related biomarkers associated with tumorigenesis and prognosis in cutaneous melanoma patients. Cancer Cell Int. 2020;20:195. doi:10.1186/s12935-020-01271-2
18. Charoentong P, Finotello F, Angelova M, et al. Pan-cancer immunogenomic analyses reveal genotype-immunophenotype relationships and predictors of response to checkpoint blockade. Cell Rep. 2017;18(1):248–262. doi:10.1016/j.celrep.2016.12.019
19. Langfelder P, Horvath S. WGCNA: an R package for weighted correlation network analysis. BMC Bioinform. 2008;9:559. doi:10.1186/1471-2105-9-559
20. Shi K, Bing ZT, Cao GQ, et al. Identify the signature genes for diagnose of uveal melanoma by weight gene co-expression network analysis. Int J Ophthalmol. 2015;8(2):269–274.
21. Zhou Y, Zhou B, Pache L, et al. Metascape provides a biologist-oriented resource for the analysis of systems-level datasets. Nat Commun. 2019;10(1):1523. doi:10.1038/s41467-019-09234-6
22. Subramanian A, Tamayo P, Mootha VK, et al. Gene set enrichment analysis: a knowledge-based approach for interpreting genome-wide expression profiles. Proc Natl Acad Sci U S A. 2005;102(43):15545–15550. doi:10.1073/pnas.0506580102
23. Yoshihara K, Shahmoradgoli M, Martinez E, et al. Inferring tumour purity and stromal and immune cell admixture from expression data. Nat Commun. 2013;4:2612. doi:10.1038/ncomms3612
24. Racle J, de Jonge K, Baumgaertner P, Speiser DE, Gfeller D. Simultaneous enumeration of cancer and immune cell types from bulk tumor gene expression data. eLife. 2017;1:6.
25. Becht E, Giraldo NA, Lacroix L, et al. Estimating the population abundance of tissue-infiltrating immune and stromal cell populations using gene expression. Genome Biol. 2016;17(1):218. doi:10.1186/s13059-016-1070-5
26. Alexandrov LB, Nik-Zainal S, Wedge DC, et al. Signatures of mutational processes in human cancer. Nature. 2013;500(7463):415–421. doi:10.1038/nature12477
27. Dreyer SB, Chang DK, Bailey P, Biankin AV. Pancreatic cancer genomes: implications for clinical management and therapeutic development. Clin Cancer Res. 2017;23(7):1638–1646. doi:10.1158/1078-0432.CCR-16-2411
28. Feig C, Jones JO, Kraman M, et al. Targeting CXCL12 from FAP-expressing carcinoma-associated fibroblasts synergizes with anti-PD-L1 immunotherapy in pancreatic cancer. Proc Natl Acad Sci U S A. 2013;110(50):20212–20217. doi:10.1073/pnas.1320318110
29. Wolchok JD, Chiarion-Sileni V, Gonzalez R, et al. Overall survival with combined nivolumab and ipilimumab in advanced melanoma. N Engl J Med. 2017;377(14):1345–1356. doi:10.1056/NEJMoa1709684
30. Herbst RS, Baas P, Kim DW, et al. Pembrolizumab versus docetaxel for previously treated, PD-L1-positive, advanced non-small-cell lung cancer (KEYNOTE-010): a randomised controlled trial. Lancet. 2016;387(10027):1540–1550. doi:10.1016/S0140-6736(15)01281-7
31. Jacob LA, Chaudhuri T, Lakshmaiah KC, et al. Current status of systemic therapy for recurrent and/or metastatic squamous cell carcinoma of the head and neck. Indian J Cancer. 2016;53(4):471–477. doi:10.4103/0019-509X.204786
32. Osanto S. Cabozantinib in the treatment of advanced renal cell carcinoma in adults following prior vascular endothelial growth factor targeted therapy: clinical trial evidence and experience. Ther Adv Urol. 2018;10(3):109–123. doi:10.1177/1756287217748867
33. Balar AV, Castellano D, O’Donnell PH, et al. First-line pembrolizumab in cisplatin-ineligible patients with locally advanced and unresectable or metastatic urothelial cancer (KEYNOTE-052): a multicentre, single-arm, Phase 2 study. Lancet Oncol. 2017;18(11):1483–1492. doi:10.1016/S1470-2045(17)30616-2
34. Royal RE, Levy C, Turner K, et al. Phase 2 trial of single agent Ipilimumab (anti-CTLA-4) for locally advanced or metastatic pancreatic adenocarcinoma. J Immunotherapy. 2010;33(8):828–833. doi:10.1097/CJI.0b013e3181eec14c
35. Skelton RA, Javed A, Zheng L, He J. Overcoming the resistance of pancreatic cancer to immune checkpoint inhibitors. J Surg Oncol. 2017;116(1):55–62. doi:10.1002/jso.24642
36. Li KY, Yuan JL, Trafton D, et al. Pancreatic ductal adenocarcinoma immune microenvironment and immunotherapy prospects. Chronic Dis Translational Med. 2020;6(1):6–17. doi:10.1016/j.cdtm.2020.01.002
37. Spear S, Candido JB, McDermott JR, et al. Discrepancies in the tumor microenvironment of spontaneous and orthotopic murine models of pancreatic cancer uncover a new immunostimulatory phenotype for B cells. Front Immunol. 2019;10:542. doi:10.3389/fimmu.2019.00542
38. DiLillo DJ, Yanaba K, Tedder TF. B cells are required for optimal CD4+ and CD8+ T cell tumor immunity: therapeutic B cell depletion enhances B16 melanoma growth in mice. J Immunol. 2010;184(7):4006–4016. doi:10.4049/jimmunol.0903009
39. Nielsen JS, Sahota RA, Milne K, et al. CD20+ tumor-infiltrating lymphocytes have an atypical CD27- memory phenotype and together with CD8+ T cells promote favorable prognosis in ovarian cancer. Clin Cancer Res. 2012;18(12):3281–3292. doi:10.1158/1078-0432.CCR-12-0234
40. Andreu P, Johansson M, Affara NI, et al. FcRgamma activation regulates inflammation-associated squamous carcinogenesis. Cancer Cell. 2010;17(2):121–134. doi:10.1016/j.ccr.2009.12.019
41. Shah S, Divekar AA, Hilchey SP, et al. Increased rejection of primary tumors in mice lacking B cells: inhibition of anti-tumor CTL and TH1 cytokine responses by B cells. Int j Cancer. 2005;117(4):574–586. doi:10.1002/ijc.21177
42. Rini B, Goddard A, Knezevic D, et al. A 16-gene assay to predict recurrence after surgery in localised renal cell carcinoma: development and validation studies. Lancet Oncol. 2015;16(6):676–685. doi:10.1016/S1470-2045(15)70167-1
43. Kratz JR, He J, Van Den Eeden SK, et al. A practical molecular assay to predict survival in resected non-squamous, non-small-cell lung cancer: development and international validation studies. Lancet. 2012;379(9818):823–832. doi:10.1016/S0140-6736(11)61941-7
44. Sparano JA, Gray RJ, Makower DF, et al. Prospective validation of a 21-gene expression assay in breast cancer. N Engl J Med. 2015;373(21):2005–2014. doi:10.1056/NEJMoa1510764
45. Wu T, Dai Y. Tumor microenvironment and therapeutic response. Cancer Lett. 2017;387:61–68. doi:10.1016/j.canlet.2016.01.043
46. Quail DF, Joyce JA. Microenvironmental regulation of tumor progression and metastasis. Nat Med. 2013;19(11):1423–1437. doi:10.1038/nm.3394
47. Aroldi F, Zaniboni A. Immunotherapy for pancreatic cancer: present and future. Immunotherapy. 2017;9(7):607–616. doi:10.2217/imt-2016-0142
48. Orhan A, Vogelsang RP, Andersen MB, et al. The prognostic value of tumour-infiltrating lymphocytes in pancreatic cancer: a systematic review and meta-analysis. Eur J Cancer. 2020;132:71–84. doi:10.1016/j.ejca.2020.03.013
49. Hui L, Chen Y. Tumor microenvironment: sanctuary of the devil. Cancer Lett. 2015;368(1):7–13. doi:10.1016/j.canlet.2015.07.039
50. Nyati KK, Zaman MM, Sharma P, Kishimoto T. Arid5a, an RNA-binding protein in immune regulation: RNA stability, inflammation, and autoimmunity. Trends Immunol. 2020;41(3):255–268. doi:10.1016/j.it.2020.01.004
51. Nyati KK, Masuda K, Zaman MM, et al. TLR4-induced NF-kappaB and MAPK signaling regulate the IL-6 mRNA stabilizing protein Arid5a. Nucleic Acids Res. 2017;45(5):2687–2703. doi:10.1093/nar/gkx064
52. Masuda K, Ripley B, Nishimura R, et al. Arid5a controls IL-6 mRNA stability, which contributes to elevation of IL-6 level in vivo. Proc Natl Acad Sci U S A. 2013;110(23):9409–9414. doi:10.1073/pnas.1307419110
53. Masuda K, Ripley B, Nyati KK, et al. Arid5a regulates naive CD4+ T cell fate through selective stabilization of Stat3 mRNA. J Exp Med. 2016;213(4):605–619. doi:10.1084/jem.20151289
54. Hanieh H, Masuda K, Metwally H, et al. Arid5a stabilizes OX40 mRNA in murine CD4(+) T cells by recognizing a stem-loop structure in its 3ʹUTR. Eur J Immunol. 2018;48(4):593–604. doi:10.1002/eji.201747109
55. Zaman MM, Masuda K, Nyati KK, et al. Arid5a exacerbates IFN-gamma-mediated septic shock by stabilizing T-bet mRNA. Proce National Acad Sci United States Am. 2016;113(41):11543–11548. doi:10.1073/pnas.1613307113
56. Deng W, Wang Y, Zhao S, et al. MICAL1 facilitates breast cancer cell proliferation via ROS-sensitive ERK/cyclin D pathway. J Cell Mol Med. 2018;22(6):3108–3118. doi:10.1111/jcmm.13588
57. Zhao S, Min P, Liu L, et al. NEDD9 facilitates hypoxia-induced gastric cancer cell migration via MICAL1 related Rac1 activation. Front Pharmacol. 2019;10:291.
58. Flach H, Rosenbaum M, Duchniewicz M, et al. Mzb1 protein regulates calcium homeostasis, antibody secretion, and integrin activation in innate-like B cells. Immunity. 2010;33(5):723–735. doi:10.1016/j.immuni.2010.11.013
59. Wu W, Yang Z, Long F, et al. COL1A1 and MZB1 as the hub genes influenced the proliferation, invasion, migration and apoptosis of rectum adenocarcinoma cells by weighted correlation network analysis. Bioorg Chem. 2020;95:103457. doi:10.1016/j.bioorg.2019.103457
60. Kanda M, Tanaka C, Kobayashi D, et al. Epigenetic suppression of the immunoregulator MZB1 is associated with the malignant phenotype of gastric cancer. Int j Cancer. 2016;139(10):2290–2298. doi:10.1002/ijc.30286
61. Niemira M, Collin F, Szalkowska A, et al. Molecular signature of subtypes of non-small-cell lung cancer by large-scale transcriptional profiling: identification of key modules and genes by weighted gene co-expression network analysis (WGCNA). Cancers. 2019;12(1). doi:10.3390/cancers12010037.
62. Hirata T, Nagai H, Koizumi K, et al. Amplification, up-regulation and over-expression of C3G (CRK SH3 domain-binding guanine nucleotide-releasing factor) in non-small cell lung cancers. J Hum Genet. 2004;49(6):290–295. doi:10.1007/s10038-004-0148-1
63. Okino K, Nagai H, Nakayama H, et al. Inactivation of Crk SH3 domain-binding guanine nucleotide-releasing factor (C3G) in cervical squamous cell carcinoma. Int j Gynecol Cancer. 2006;16(2):763–771. doi:10.1111/j.1525-1438.2006.00352.x
 © 2021 The Author(s). This work is published and licensed by Dove Medical Press Limited. The full terms of this license are available at https://www.dovepress.com/terms.php and incorporate the Creative Commons Attribution - Non Commercial (unported, v3.0) License.
By accessing the work you hereby accept the Terms. Non-commercial uses of the work are permitted without any further permission from Dove Medical Press Limited, provided the work is properly attributed. For permission for commercial use of this work, please see paragraphs 4.2 and 5 of our Terms.
© 2021 The Author(s). This work is published and licensed by Dove Medical Press Limited. The full terms of this license are available at https://www.dovepress.com/terms.php and incorporate the Creative Commons Attribution - Non Commercial (unported, v3.0) License.
By accessing the work you hereby accept the Terms. Non-commercial uses of the work are permitted without any further permission from Dove Medical Press Limited, provided the work is properly attributed. For permission for commercial use of this work, please see paragraphs 4.2 and 5 of our Terms.