")
Back to Journals » International Journal of General Medicine » Volume 14
Identification and Validation of Pyroptosis-Related lncRNA Signature and Its Correlation with Immune Landscape in Soft Tissue Sarcomas
Authors Lin Z, Xu Y, Zhang X, Wan J, Zheng T, Chen H, Chen S, Liu T
Received 24 August 2021
Accepted for publication 4 November 2021
Published 16 November 2021 Volume 2021:14 Pages 8263—8279
DOI https://doi.org/10.2147/IJGM.S335073
Checked for plagiarism Yes
Review by Single anonymous peer review
Peer reviewer comments 2
Editor who approved publication: Dr Scott Fraser
Zhengjun Lin,1,2 Yiting Xu,2 Xianghong Zhang,1 Jia Wan,1 Tao Zheng,1 Hongxuan Chen,1 Shijie Chen,3 Tang Liu1
1Department of Orthopedics, The Second Xiangya Hospital of Central South University, Changsha, 410011, Hunan, People’s Republic of China; 2Xiangya School of Medicine, Central South University, Changsha, 410013, Hunan, People’s Republic of China; 3Department of Orthopedics, The Third Xiangya Hospital of Central South University, Changsha, 410013, Hunan, People’s Republic of China
Correspondence: Shijie Chen
Department of Orthopedics, The Third Xiangya Hospital of Central South University, Changsha, 410006, Hunan, People’s Republic of China
Tel +86-73185292111
Email [email protected]
Tang Liu
Department of Orthopedics, The Second Xiangya Hospital of Central South University, Changsha, 410011, Hunan, People’s Republic of China
Tel +86-73185292111
Email [email protected]
Background: Pyroptosis is critically associated with cancer initiation and progression, which can be modulated by diverse long noncoding RNAs (lncRNAs). However, the roles of pyroptosis-related lncRNAs in soft tissue sarcomas (STS) are still largely unknown.
Methods: Our study included a total of 259 STS patients extracted from The Cancer Genome Atlas Sarcoma (TCGA-SARC) dataset. Gene expression data fragments per kilobase of transcript per million mapped reads (FPKM) values were downloaded from The Cancer Genome Atlas (TCGA) and Genotype-Tissue Expression (GTEx) for the investigation of the expression pattern of pyroptosis-related lncRNAs. Unsupervised clustering based on pyroptosis-related lncRNAs was performed, and the associations of pyroptosis-related lncRNAs with clinical outcomes and immune microenvironment were investigated. Two risk signatures for overall survival (OS) and disease-free survival (DFS) were constructed and validated in independent cohorts.
Results: A total of 166 pyroptosis-related lncRNAs were identified in STS. Patients were clustered into two subgroups by unsupervised clustering, and cluster 2 had better prognoses, higher immune scores, higher abundance of immune cells, and higher expression of some immune checkpoints. OS- and DFS-risk signatures based on 10 and 13 pyroptosis-related lncRNAs, respectively, with favorable discrimination were constructed and validated. High-risk patients had favorable prognoses, and receiver operating characteristic (ROC) curves showed that both risk signatures could function as excellent predictors for prognoses of STS patients. Besides, the OS-risk signature could also excellently predict the immune landscape of STS.
Conclusion: In conclusion, our study revealed the clinical significance and critical roles of pyroptosis-related lncRNAs in STS, and constructed novel risk signatures based on pyroptosis-related lncRNAs that could effectively predict clinical outcomes and immune microenvironment in STS.
Keywords: pyroptosis, immune microenvironment, prognostic signature, soft tissue sarcomas
Introduction
Soft tissue sarcomas (STS) are a class of heterogeneous and rare malignancies that originate from mesenchymal tissues.1 Although STS account for only 1% of human malignant tumors, they consist of more than 70 histological types.1 Despite progresses in surgery and chemotherapy for STS patients in past decades, the 5-year survival rate of patients with advanced STS is only approximately 27%.2,3 Besides, about 50% patients with STS eventually develop metastases, which has become an obstacle for the treatment of STS.1,4 Therefore, developing effective biomarkers and novel therapeutic targets for STS patients are urgently needed.
Pyroptosis is an inflammatory form of cell death, which is typically characterized by the release of inflammasomes and cell swelling and lysis.5–7 Multiple lines of evidence have indicated that pyroptosis plays critical roles in cancer initiation and development, and multiple pyroptosis-related molecules, such as gasdermin proteins, inflammatory vesicles, and proinflammatory cytokines, can modulate cellular proliferation, invasion and metastasis in human malignancies.8–10 For instance, NLRP3, which is downregulated in hepatocellular carcinoma tissues, is connected with clinicopathological parameters of hepatocellular carcinoma patients, indicative of the role of NLRP3 inflammasome in hepatocellular carcinoma progression. Furthermore, it has been found that 17β-estradiol could promote pyroptosis by stimulating NLRP3 inflammasome in hepatocellular carcinoma, thus inhibiting tumor growth.11 Moreover, pyroptosis plays an important role in modulating tumor immune microenvironment. Using single-cell RNA sequencing, it has been found that pyroptosis-inducible therapy can increase the abundance of CD4+ T cells, CD8+ T cells and natural killer cells (NK cells), while inhibiting the infiltration of monocyte and neutrophil in breast 4 T1 tumors. Moreover, breast 4 T1 tumor cells pyroptosis can stimulate the polarization of macrophage M1.12 Induction of pyroptotic tumor cells death by various therapeutic strategies and combination of pyroptosis-based therapy with immunotherapy have provided novel insights into cancer treatment.13 However, the regulatory mechanisms controlling pyroptosis in human cancers are still inconclusive and remain to be investigated.
Long noncoding RNAs (lncRNAs) are a group of ncRNAs longer than 200 nt in length without protein-coding potential.14 LncRNAs have been found to modulate various cellular functions in physiology and pathology.15–17 Growing evidence has demonstrated that lncRNAs are intimately correlated with cancer initiation and progression via modulating diverse molecules, such as microRNAs (miRNAs), DNAs and proteins.18–20 Notably, several lncRNAs have been characterized as critical modulators of pyroptosis in human malignancies. For instance, lncRNA-XIST has been found to inhibit pyroptosis through upregulating SOD expression via sponging miR-335 in non-small cell lung cancer.21 Similarly, lncSNHG7 could inhibit NLRP3-induced pyroptosis by sponging miR-34a to induce SIRT1 in liver cancer.22 However, there were few studies regarding the comprehensive roles of pyroptosis-related lncRNAs in cancer development, and functions and mechanisms of lncRNAs in modulating pyroptosis in STS remain largely unknown. Thus, understanding the regulatory mechanisms of pyroptosis-related lncRNAs in STS progression is of great significance for developing novel therapeutic targets and biomarkers for STS patients.
Herein, based on GDC TCGA-SARC dataset, we identified prognostic pyroptosis-related lncRNAs in STS, and then conducted consensus clustering based on prognostic pyroptosis-related lncRNAs to explore the correlations of pyroptosis-related lncRNAs with the prognosis and immune landscape. Finally, we constructed two pyroptosis-related lncRNA-based risk signatures for OS and DFS of STS patients. Our study comprehensively investigated the prognostic value of pyroptosis-related lncRNAs and their roles in tumor immune microenvironment in STS, thus shedding light on the promising roles of pyroptosis-related lncRNAs as novel prognostic biomarkers and efficient therapeutic targets for STS patients.
Materials and Methods
Data Acquisition
The transcriptome profiling data (FPKM values) of TCGA-SARC cohort and the GTEx cohort from TCGA (https://portal.gdc.cancer.gov/) and the UCSC Xena browser (https://xenabrowser.net/) were downloaded and normalized.23 A total of 450 normal and 263 tumor samples were included from both TCGA-SARC and GTEx databases. The clinical data of STS patients were also obtained from the UCSC database. The clinical features of STS patients involved in this study are listed in Table 1.
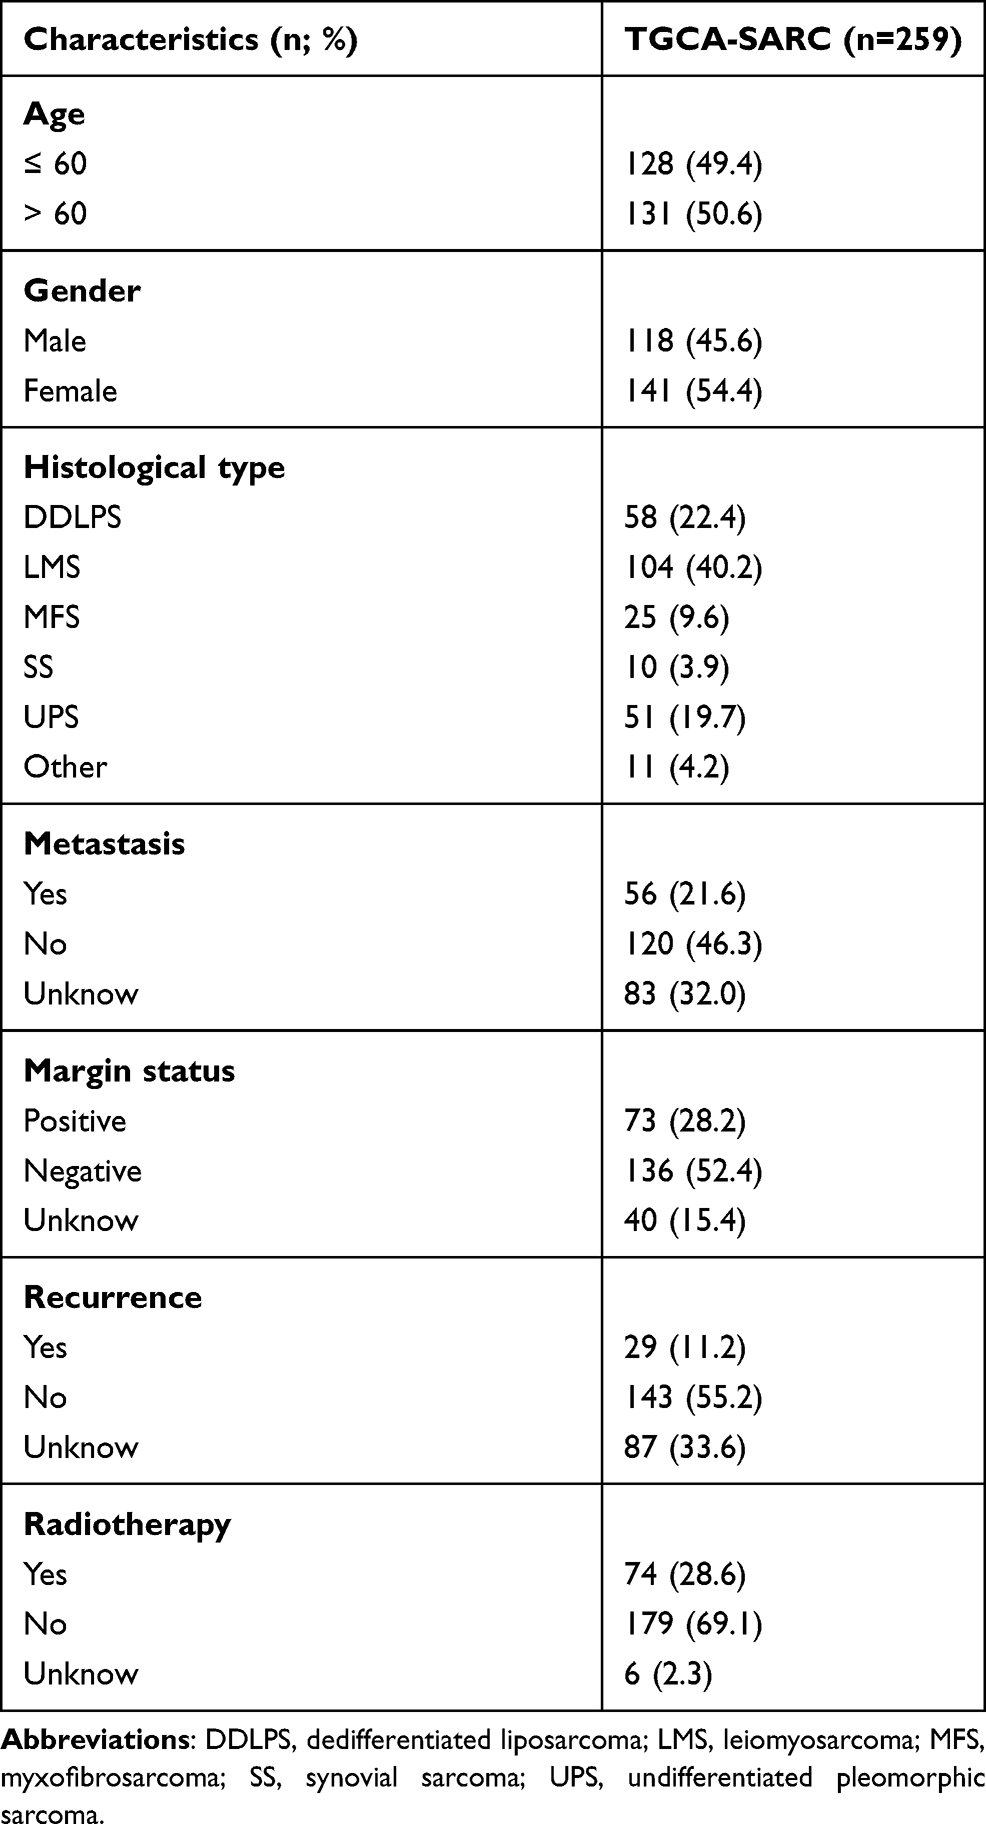 |
Table 1 Clinical Characteristics of STS Patients in the Study |
Identification of Pyroptosis-Related lncRNAs
Based on previous publications, a total of 33 pyroptosis-related genes were selected for the following analysis (Table S1).24–27 Besides, 14,081 lncRNAs from the TCGA and the GTEx datasets were annotated by Genome Reference Consortium Human Build 38 (GRCh38) lncRNAs annotation data from the GENCODE website. Afterwards, Pearson correlation analysis was performed between pyroptosis-related genes and lncRNAs in STS samples. The lncRNAs with correlation |coefficients|>0.4 and p<0.001 were considered as pyroptosis-related lncRNAs.
Consensus Clustering
By using the “ConsensusClusterPlus” R package,28 all 259 STS patients were categorized into different clusters by the expression of prognostic pyroptosis-related lncRNAs. The optimal k value of clusters was confirmed by a combination of CDF and consensus matrices.
Assessment of Immune Microenvironment
The immune, stroma and ESTIMATE scores were calculated utilizing Estimation of Stromal and Immune cells in Malignant Tumor tissues using Expression data (ESTIMATE) analysis by utilizing R package “estimate”.29 CIBERSORT was adopted to investigate the infiltration of 22 subtypes of immune cells.30 Furthermore, the relationship between the infiltration of immune cells and the risk score was investigated via Spearman correlation analysis. Wilcoxon rank-sum test or the Kruskal–Wallis test was utilized to evaluate the differences on the expression of immune checkpoints, immune scores, and the infiltration of immune cells between subgroups.
Construction and Validation of Risk Signature
To comprehensively illustrate the prognostic significance of pyroptosis-related lncRNAs in STS, STS patients with follow-up data, including 259 patients with overall survival (OS) data, and 231 patients with disease-free survival (DFS) data, were included for the construction of prognostic signatures. All patients with STS were randomly categorized into a training set and a validation set, respectively, at a 1:1 ratio in R. To construct predictive OS-related and DFS-related risk signatures in clinical settings, univariate Cox regression analysis was utilized to confirm the prognostic pyroptosis-related lncRNAs. We then adopted a LASSO analysis with p=0.05 and 10-fold cross validation to select prognosis-specific pyroptosis-related lncRNAs for two OS-related and DFS-related risk signatures. The following formula was applied to calculate the risk scores of all patients using the derived coefficients: 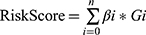 (βi is the coefficient of gene i; Gi is the expression value of gene; n is the number of genes included in the risk model). Next, all patients were separated into high- and low-risk subgroups according to the median value of risk scores in the training cohort.
Function Enrichment Analysis
To investigate the molecular heterogeneity between the high-risk group and the low-risk group, differential expression analyses were conducted between high and low-risk groups using the R package “limma”. Differential expressed genes (DEGs) were confirmed by log2-fold change (log2 FC) and false discovery rate (FDR) based on thresholds of |log2FC|>1 and FDR < 0.05. Next, Gene Ontology (GO) terms and Kyoto Encyclopedia of Genes and Genomes (KEGG) pathway enrichment analyses were conducted to explore the potential biological functions and signaling pathways of DEGs by utilizing R packages “clusterProfiler”, “enrichplot”, and “ggplot2”.
Statistical Analysis
R programming language 4.0.2 was employed to conduct all statistical analysis. Kaplan–Meier survival curves and log-rank analysis were applied to assess the differences in survival time between subgroups. Besides, we applied time-dependent ROC curve analysis via “survivalROC” R package to evaluate the predictive performance of the risk model. The independent prognostic value of the risk signature was confirmed by univariate and multivariate Cox regression. Subgroups based on different clinical were investigated for comprehensive assessment of the stability of risk signature. The differences between subgroups were explored by utilizing Student’s t-test and Wilcoxon signed-rank test. P<0.05 indicated statistically significant for all analyses.
Results
Identification of Prognostic Pyroptosis-Related lncRNAs in STS
The flowchart of our investigation is shown in Figure 1. First, a total of 14,081 lncRNAs were extracted from both TCGA-SARC and the GTEx datasets for the following analysis. Next, the expression profiles of these 33 pyroptosis-related genes were evaluated, and Pearson correlation analysis was performed to select pyroptosis-related lncRNAs. A lncRNA that was related to one or more pyroptosis-related genes (|coefficient| > 0.4 and p < 0.001) was regarded as pyroptosis-related lncRNAs. As a consequence, a total of 166 pyroptosis-related lncRNAs were identified (Table S2). The correlation network between 166 lncRNAs and 20 pyroptosis-related genes is shown in Figure 2A. Furthermore, we conducted univariate Cox regression to screen pyroptosis-related lncRNAs that were remarkably connected with OS in STS. In consequence, 24 pyroptosis-related lncRNAs were closely connected with OS of patients with STS. The forest plot shows the hazard ratio (HR) with 95% confidence interval (CI) of these 24 pyroptosis-related lncRNAs (Figure 2B). Besides, differences on the expression levels of 24 prognostic pyroptosis-related lncRNAs between 263 STS and 450 normal samples were investigated. As a result, the expression levels of 10 prognostic pyroptosis-related lncRNAs were notably higher, whereas the expression levels of 14 prognostic pyroptosis-related lncRNAs were significantly lower in tumor samples in comparison with normal soft tissue samples (p<0.05) (Figure 2C and D).
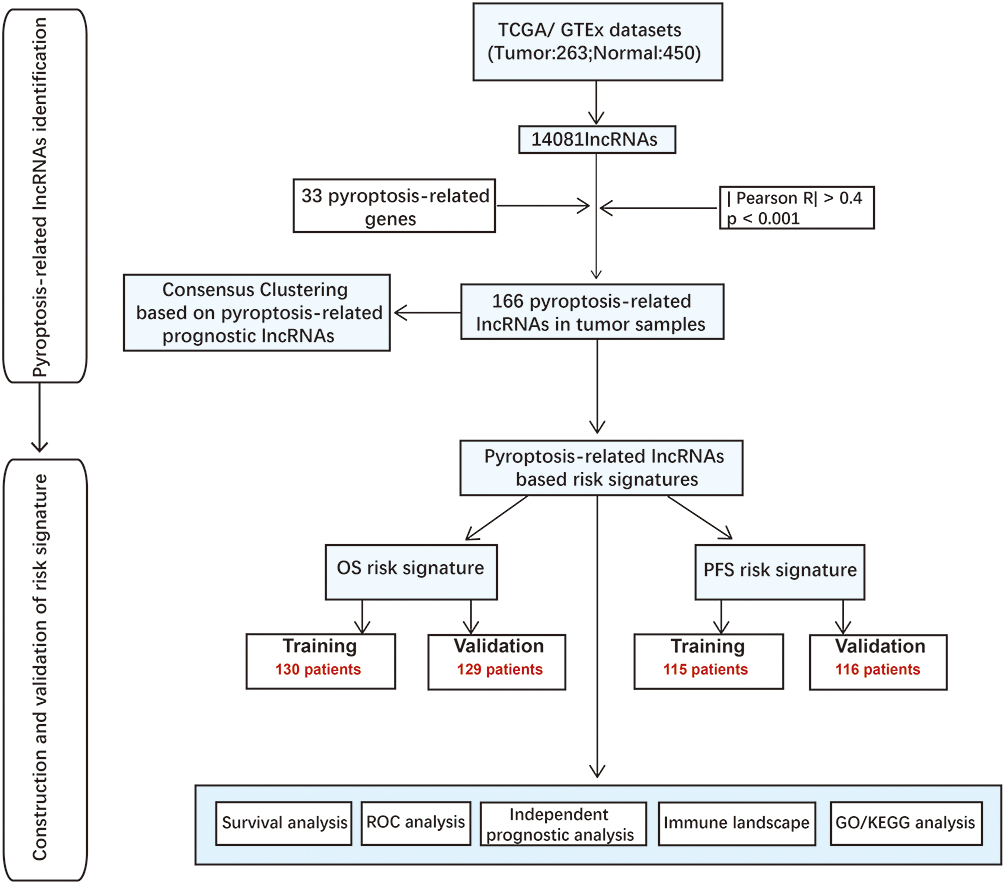 |
Figure 1 Flow chart of this study. |
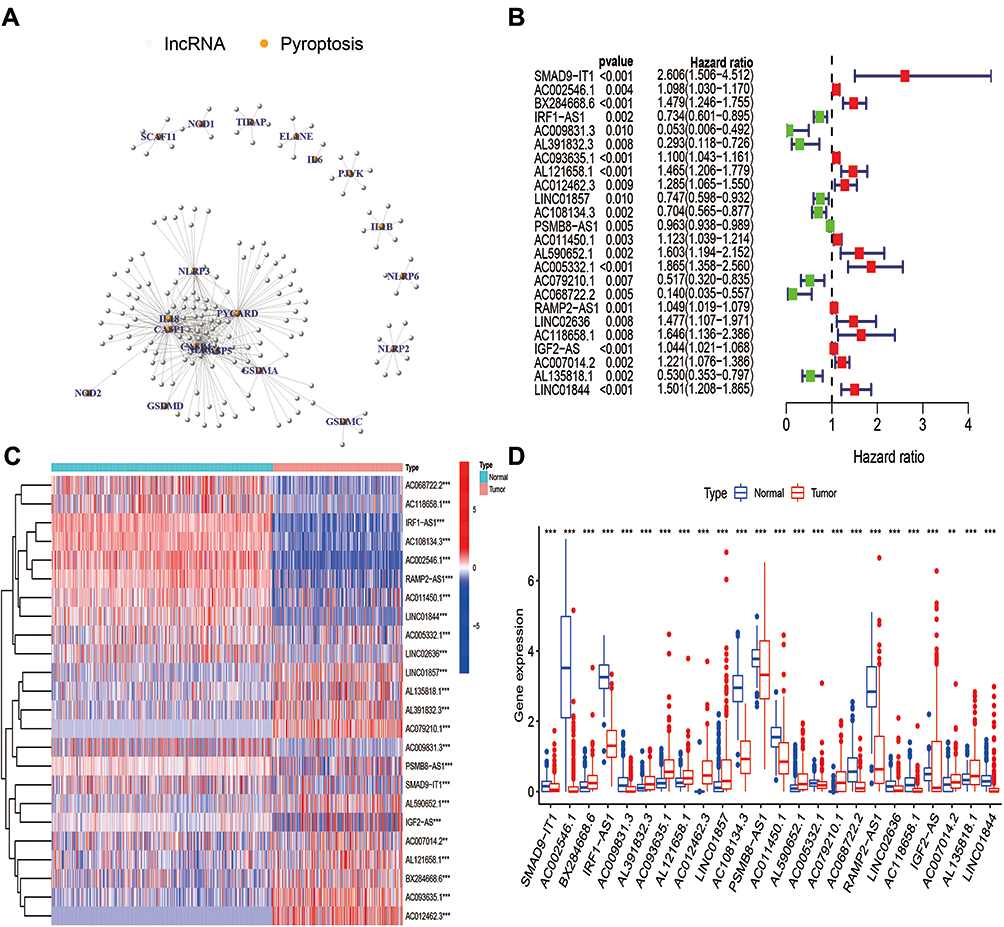 |
Figure 2 Identification of m6A-related lncRNAs in STS. (A) The network of 166 pyroptosis-related lncRNAs and 20 pyroptosis-related genes. (B) The forest plot of 24 prognostic pyroptosis-related lncRNAs. (C) The heatmap of 24 prognostic pyroptosis-related lncRNAs in both tumor and normal samples. (D) The box plot of 24 prognostic pyroptosis-related lncRNAs in both tumor and normal samples. |
Pyroptosis-Related lncRNAs Correlated with Prognosis and Immune Landscape in STS by Consensus Clustering
According to the selected prognostic pyroptosis-related lncRNAs, we employed unsupervised clustering methods to categorize patients into different clusters. The elbow method in combination with the gap statistic validated the optimal number of clusters (Figure S1). Subsequently, the 259 STS patients were classified into two clusters: cluster 1 (n=73) and cluster 2 (n=186) (Figure 3A). Subsequently, we performed survival analysis to discover whether the prognosis of patients between clusters displayed significant differences. The results showed that patients in cluster 1 showed markedly shorter survival time compared with patients in cluster 2 (p=0.009) (Figure 3B).
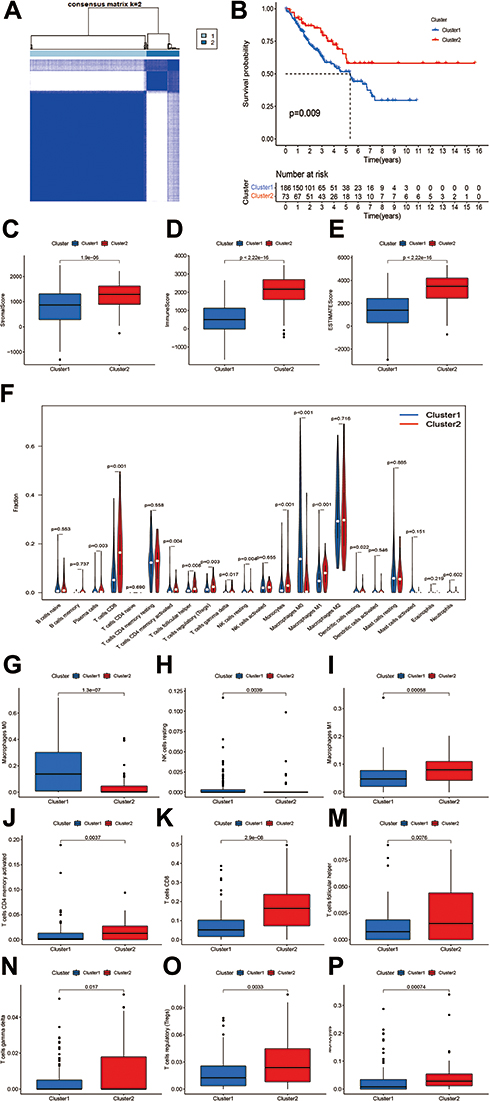 |
Figure 3 Consensus Clustering based on prognostic pyroptosis-related lncRNAs in STS. (A) Consensus clustering matrix for k = 2. (B) Kaplan–Meier analysis of patients in cluster 1 and cluster 2 subgroups. (C–E) Immune, stroma and ESTIMATE scores in cluster 1 and cluster 2 subgroups. (F) The abundance of 22 immune cell types in cluster 1 and cluster 2 subgroups. (G–P) The significantly different abundance of macrophages M0, NK cells resting, macrophages M1, activated CD4+ memory T cells, CD8+ T cells, follicular helper T cells, gamma delta T cells, regulatory T cells and monocytes between clusters. |
To clarify the correlation between pyroptosis-related lncRNAs and immune landscape of STS, we further analyzed the differences in immune landscape between clusters. The results of ESTIMATE analysis showed that stromal (p<0.0001), immune (p<0.001), and ESTIMATE (p<0.0001) scores were all notably higher in cluster 2 compared with cluster 1 (Figure 3C–E). Next, we explored the infiltration of immune cells into two clusters. The abundance of 22 infiltrating immune cells in two clusters is shown in Figure 3F. In cluster 1, the proportions of macrophages M0 (p<0.001) and NK cells resting (p=0.0039) were remarkably higher, while cluster 2 had higher proportions of macrophages M1 (p<0.001), activated CD4+ memory T cells (p=0.0037), CD8+ T cells (p<0.001), follicular helper T cells (p=0.0076), gamma delta T cells (p=0.017), regulatory T cells (p=0.0033) and monocytes (p<0.001) (Figure 3G–P). Meanwhile, we analyzed the differences on the expression of several immune checkpoints between clusters. A significant increase in the expression of PD-L1, IDO1, LAG3, TIGIT, CD96 and CD26 was observed in cluster 2 (Figure 4A–F). Furthermore, linear relation was observed between several pyroptosis-related lncRNAs and immune checkpoints (Figure 4G–L). As a result, several pyroptosis-related lncRNAs, such as IRF1-AS1 and PSMB8-AS1, were positively correlated with the expression of these immune checkpoints. In summary, these outcomes suggested that pyroptosis-related lncRNAs had a close relationship with the immune microenvironment in STS.
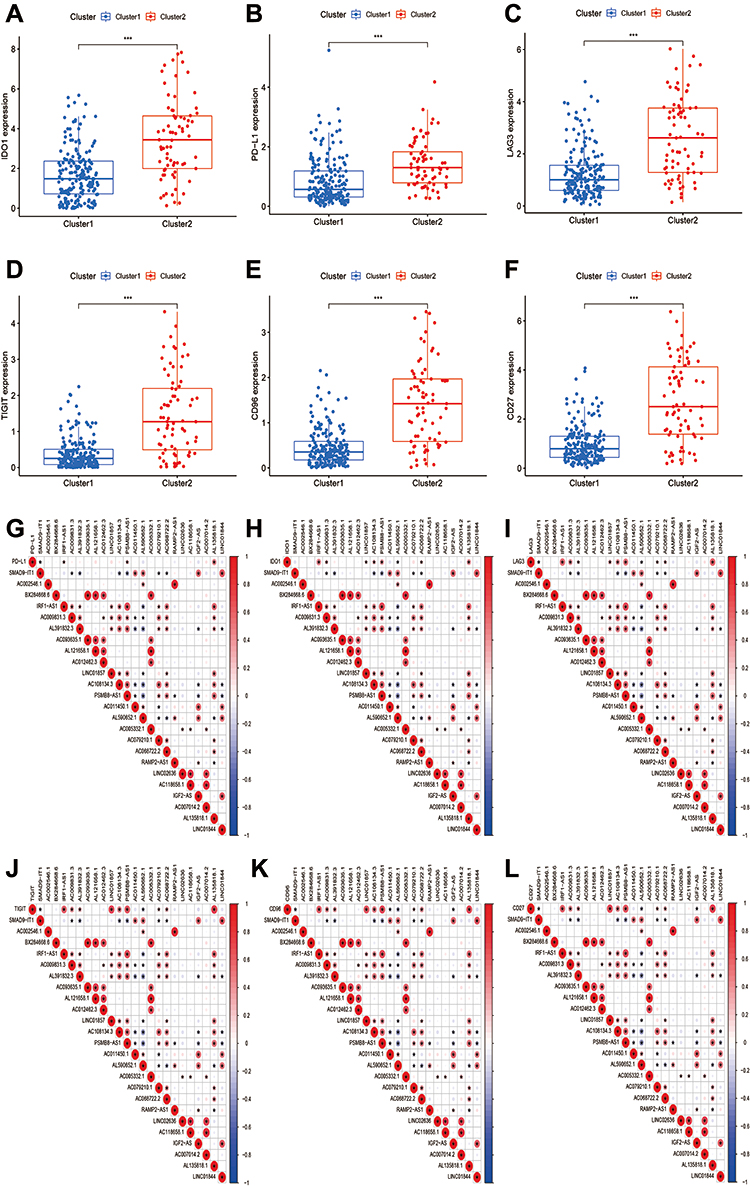 |
Figure 4 Pyroptosis-related lncRNAs were correlated with the expression of immune checkpoints. (A–C) The expression of immune checkpoints (A) IDO1, (B) PD-L1, (C) LAG3, (D) TIGIT, (E) CD96, (F) CD27 was significantly higher in cluster 2. (G–L) Co-expression analysis of immune checkpoints and 24 prognostic pyroptosis-related lncRNAs. |
Construction and Validation of Two Risk Signatures Based on Pyroptosis-Related lncRNAs
OS-related and DFS-related pyroptosis-related lncRNAs were screened out by univariate Cox regression analysis, and then LASSO regression analysis was utilized to confirm 10 pyroptosis-related lncRNAs and 13 pyroptosis-related lncRNAs for the construction of OS- and DFS-risk signatures, respectively (Figures 5A, B, 6A and B). Furthermore, risk scores of all STS patients were calculated by combining the expression level of pyroptosis-related lncRNAs with the coefficient, and all patients were categorized into high- and low-risk subgroups by the median value of risk scores. According to the risk plot, high-risk patients presented shorter survival time and lower survival rate in both OS and DFS risk signatures (Figures 5C, D, 6C and D). In addition, the heatmap clearly presented the differential expression patterns of 10 OS-related pyroptosis-related lncRNAs and between the high-risk and low-risk subgroups (Figures 5E and 6E). In terms of survival probability, high-risk scores were related with worse OS (p<0.001) and DFS (p<0.001) than those with lower risk, as shown in the Kaplan–Meier survival curves (Figures 5F and 6F). To evaluate the predictive performance of the OS-risk signature, we employed the time-dependent ROC curve and observed excellent outcomes. The 1-/3-/5-year area under ROC curve (AUC) of the OS risk model was 0.767, 0.749 and 0.758, respectively (Figure 5G). As for the DFS risk signature, the 1-/3-/5-year AUC was 0.779, 0.789 and 0.820, respectively (Figure 6G). Moreover, we investigated the predictive capability of two risk signatures for the prognosis of patients with STS. Univariate Cox regression analysis revealed the close relationship of the OS risk signature with the prognosis of STS patients (HR=2.438, 95% CI=1.590–3.737; p<0.001) and the DFS risk signature (HR=2.438, 95% CI=1.590–3.737; p<0.001), and multivariate Cox regression analysis indicated the capability of the OS risk signature (HR=2.658, 95% CI=1.558–4.529; p<0.001) and the DFS risk signature (HR=2.656, 95% CI=1.558–4.529; p<0.001) to function as a prognostic predictor independently (Figures 5H–I and 6H–I).
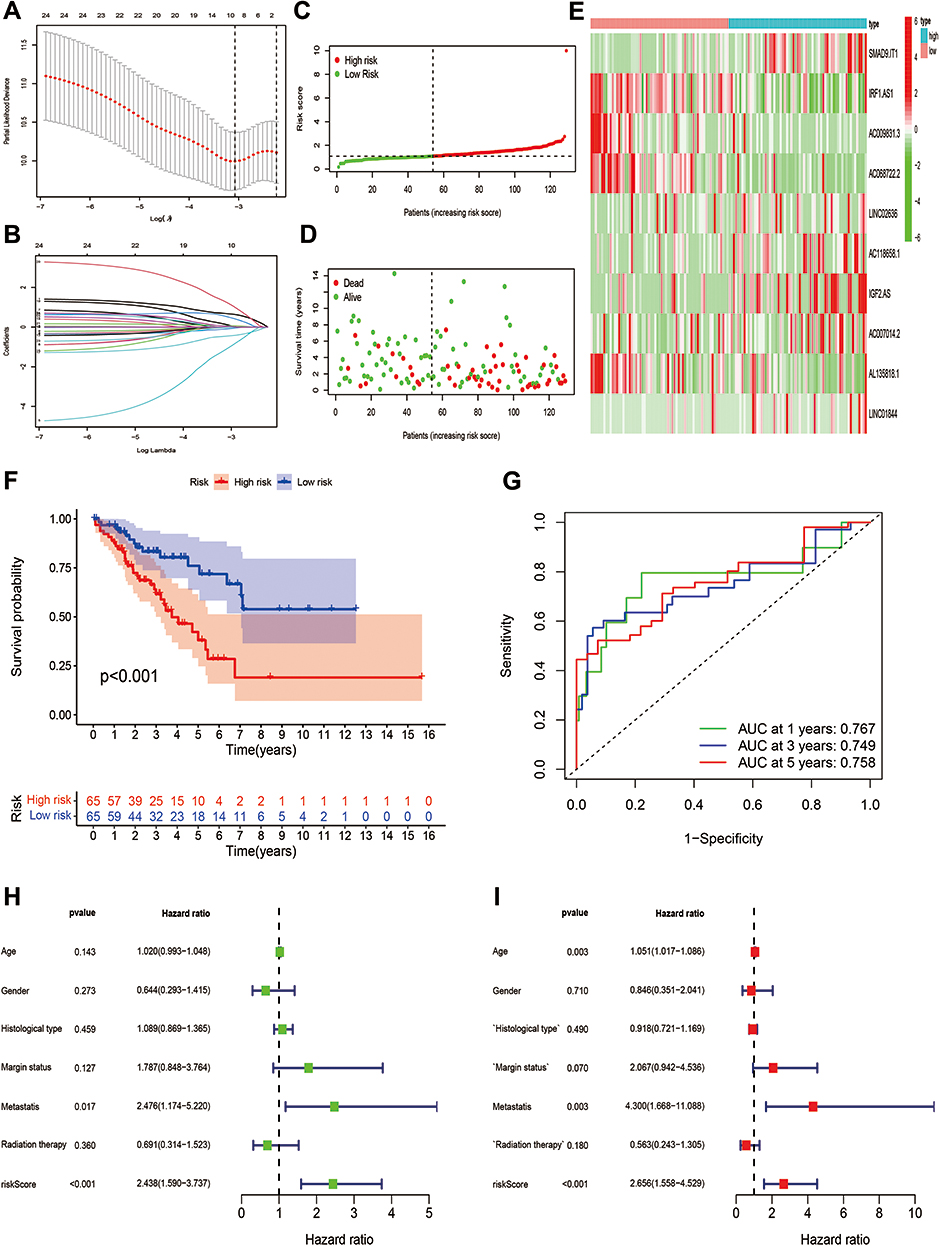 |
Figure 5 Establishment of a 10 pyroptosis-related lncRNAs-based OS signature. (A and B) LASSO analysis with minimal lambda value. (C and D) Risk score and survival status of each patient in the training cohort. (E) Heatmap of 10 pyroptosis-related lncRNAs in the training cohort. (F) Kaplan–Meier analysis of patients in the high risk and low risk groups in the training cohort. (G) Time-dependent ROC analysis of risk score in predicting prognoses. (H and I) Univariate and multivariate Cox analyses of the risk score and clinical variables in the training cohort. |
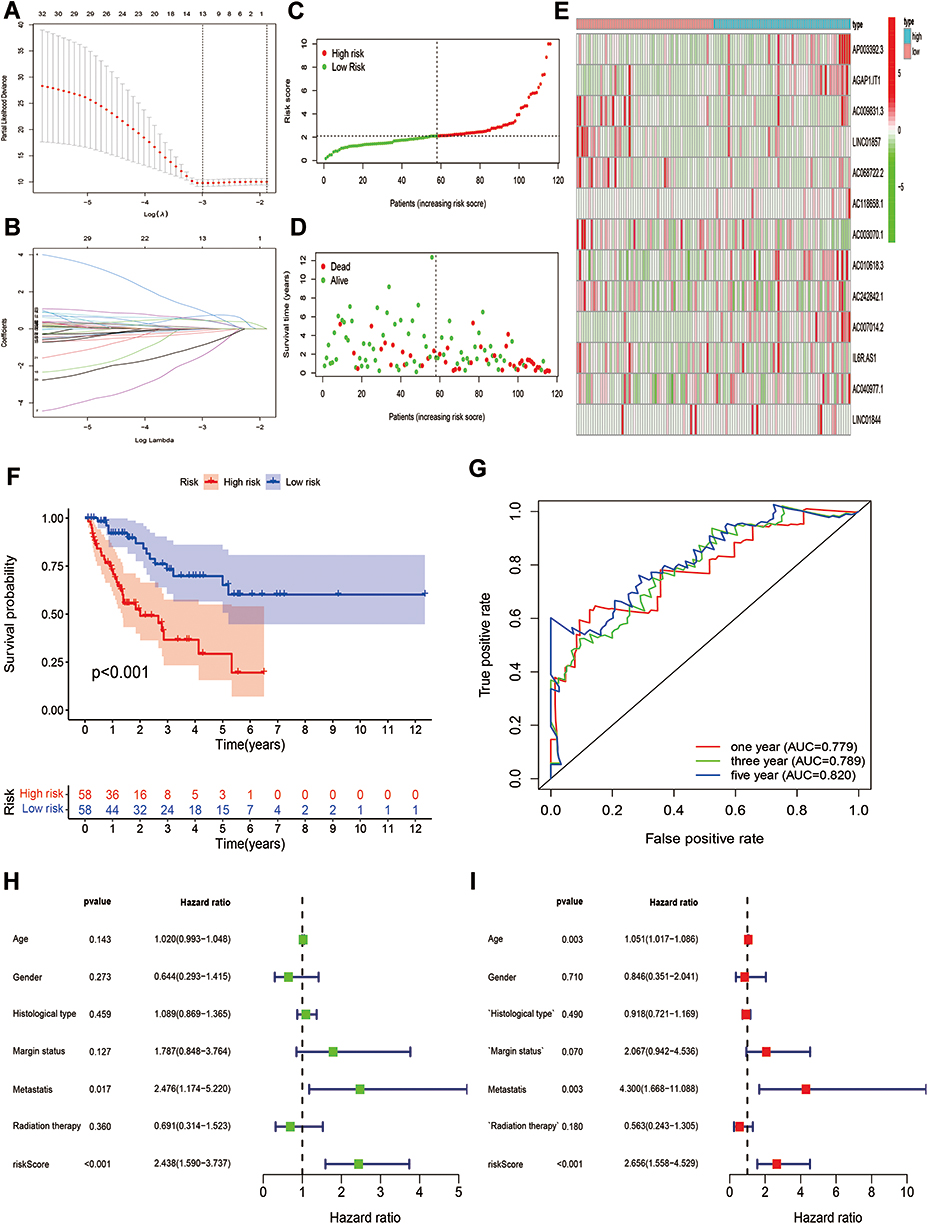 |
Figure 6 Establishment of a 13 pyroptosis-related lncRNAs-based DFS signature. (A and B) LASSO analysis with minimal lambda value. (C and D) Risk score and survival status of each patient in the training cohort. (E) Heatmap of 13 pyroptosis-related lncRNAs in the training cohort. (F) Kaplan–Meier analysis of patients in the high risk and low risk groups in the training cohort. (G) Time-dependent ROC analysis of risk score in predicting prognoses. (H and I) Univariate and multivariate Cox analyses of the risk score and clinical variables in the training cohort. |
To strengthen the credibility of prognostic prediction, the independent validation cohort was utilized to assess the predictive performance of the OS- and DFS-risk signatures. The same analysis method as previously described were applied to the validation cohort. Risk score and survival plots showed that high-risk patients presented worse clinical outcomes in both signatures (Figure 7A, B, F and G). The differential expression patterns of pyroptosis-related lncRNAs between subgroups were also observed in two risk signatures (Figure 7C and H). Kaplan–Meier test revealed that low-risk patients experienced a longer survival time in comparison with high-risk patients in both risk signatures (Figure 7D and I). The AUC value for OS at 1-, 3-, and 5-year was 0.719, 0.697 and 0.763, respectively (Figure 7E), and the 1-/3-/5-year AUC for DFS was 0.745, 0.733, 0.787, respectively (Figure 7J), verifying the high sensitivity and specificity of the two risk signatures for survival prediction. Furthermore, univariate and multivariate Cox regression analyses validated the two signatures could function as independent biomarkers for the prognosis of STS, respectively (Figure 7K and L). In general, these results were all in good concordance with the training cohort, indicating the robustness of the two signatures as prognostic predictors.
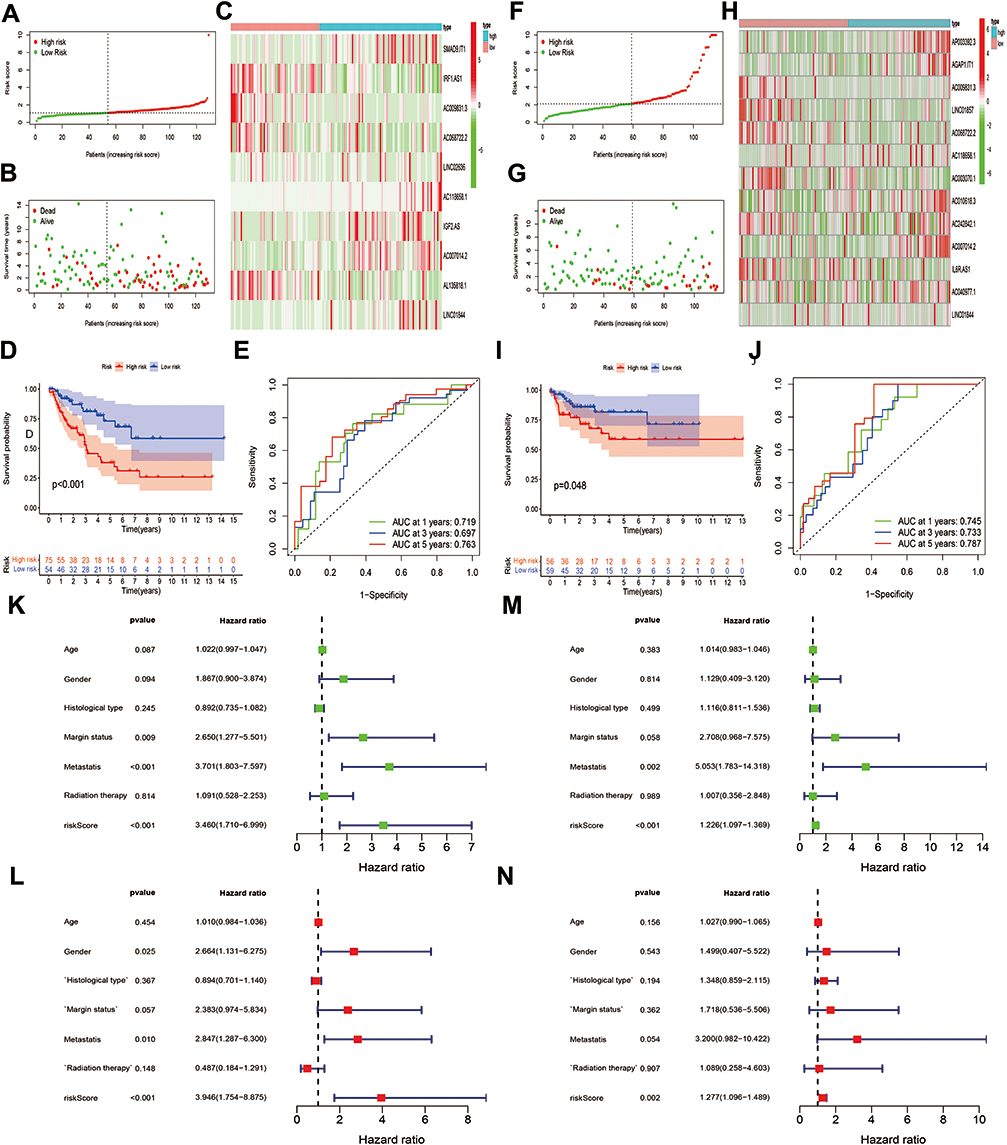 |
Figure 7 Validation of OS and DFS signatures. (A and B) Risk score and survival status of each patient in the OS signature. (C) Heatmap of 10 pyroptosis-related lncRNAs in the OS signature. (D) Kaplan–Meier analysis of patients in the high risk and low risk groups in the OS signature. (E) Time-dependent ROC analysis of risk score in predicting prognoses in the OS signature. (F and G) Risk score and survival status of each patient in the DFS signature. (H) Heatmap of 10 pyroptosis-related lncRNAs in the DFS signature. (I) Kaplan–Meier analysis of patients in the high risk and low risk groups in the DFS signature. (J) Time-dependent ROC analysis of risk score in predicting prognoses in the DFS signature. (K and L) Univariate and multivariate Cox analyses of the risk score and clinical variables in the in the OS signature. (M and N) Univariate and multivariate Cox analyses of the risk score and clinical variables in the in the DFS signature. |
Risk Signature Correlated with Immune Microenvironment
To verify the roles of pyroptosis-related lncRNAs in tumor immune microenvironment in STS, we further employed the OS signature to analyze the relationship between the risk score and the immune landscape in STS. The correlations between the risk score and the expression level of immune checkpoints in STS are shown in Figure 8. The results revealed that patients in low-risk group showed higher expression levels of some immune checkpoints, including PD-L1 (p<0.001), IDO1 (p<0.001), LAG3 (p<0.001), TIGHT (p<0.001), CD96 (p<0.001) and CD27 (p<0.001) (Figure 8A–F). The risk score also showed significant correlations with the infiltration of immune cells, which was negatively correlated with macrophages M1 (R=−0.34, p<0.0001), monocyte (R=−0.18, p=0.019), CD8+ T cells (R=−0.46, p<0.001), T cells follicular helper (R=−0.25, p<0.001) and T cells regulating (R=−0.21, p=0.0056), except for macrophages M0 (R=0.3, p<0.0001) and NK cells resting (R=0.27, p<0.001) (Figure 8G–M). In general, pyroptosis-related lncRNAs were remarkably connected with the immune microenvironment in STS, and pyroptosis-related lncRNAs might influence the prognosis of STS patients via modulation of immune landscape.
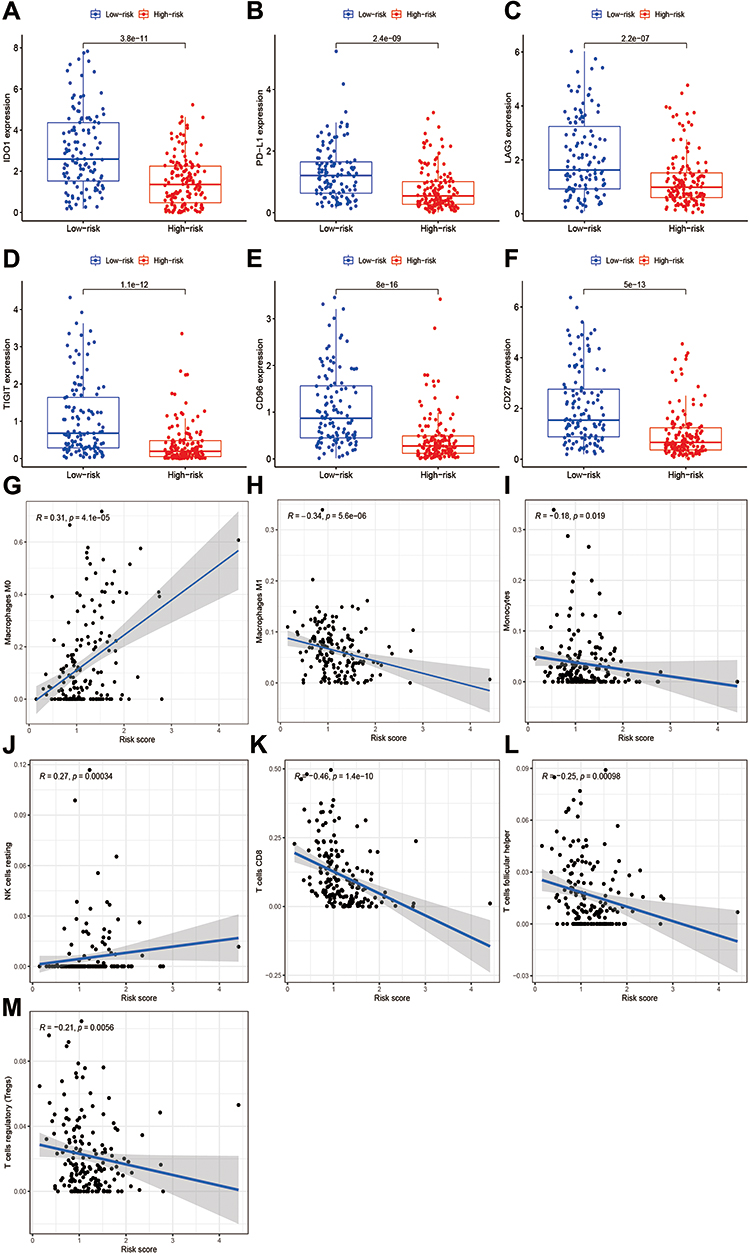 |
Figure 8 The correlations between the risk score and immune microenvironment in STS. (A–F) The correlations between the risk signature and the expression of immune checkpoint. (A) IDO1, (B) PD-L1, (C) LAG3, (D) TIGIT, (E) CD96, and (F) CD27. (G–M) The correlations between the risk score and immune cells infiltration. |
GO Enrichment and KEGG Pathway Analysis
To further explore the potential biological processes and pathways resulting in the molecular heterogeneity between the high- and low-risk groups, differential analysis was conducted to confirm 77 DEGs between the high- and low-risk groups in the OS risk signature (Table S3). GO analysis suggested that DEGs were mainly involved in lymphocyte mediated immunity, immunoglobulin complex and antigen binding in biological process, cellular component, and molecular function, respectively (Figure 9A and B). KEGG pathway analysis showed that DEGs were mainly enriched in hematopoietic cell lineage, primary immunodeficiency and T cell receptor signaling pathway (Figure 9C and D). In addition, these DEGs were also found to be highly enriched in several immune-related biological processes and pathways, such as PD-L1 expression and PD-L1 checkpoint pathway in cancer, Th1 and Th2 cell differentiation, and humoral immune response. These findings revealed that the pyroptosis-related risk model had significant immune-related functions and processes, and pyroptosis-related lncRNAs might play an important role in STS progression via modulating immune-related pathways.
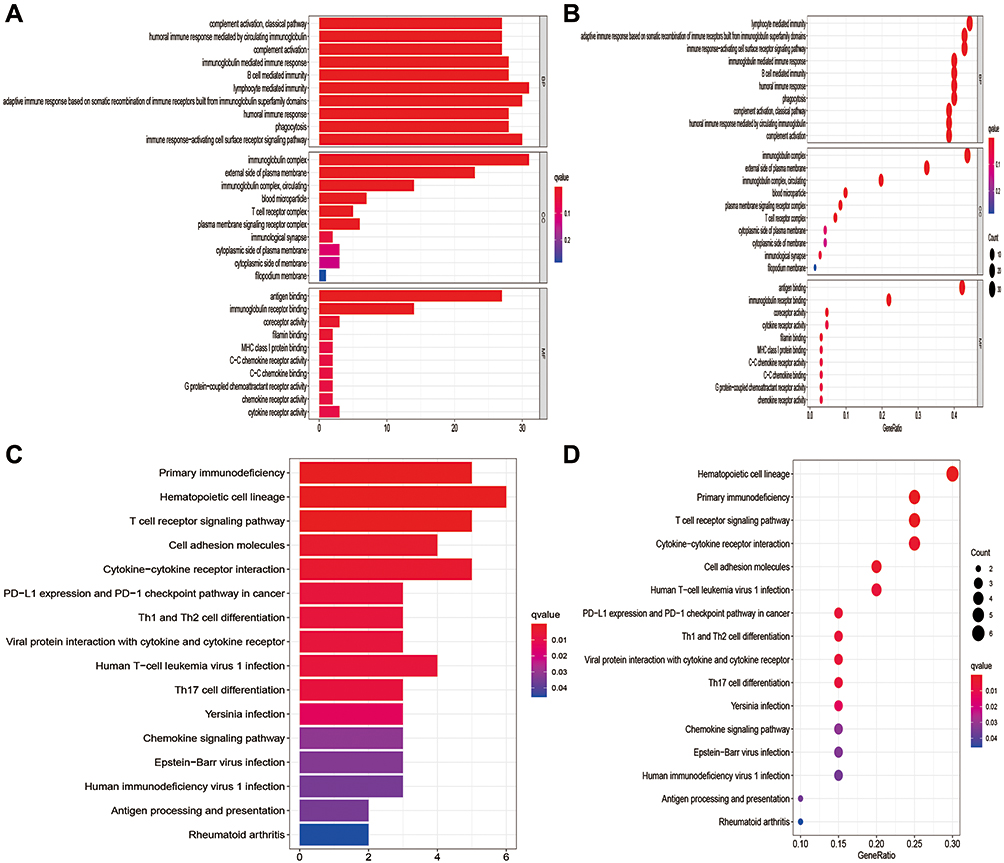 |
Figure 9 Results of GO and KEGG analyses. (A and B) GO analysis of DEGs between the high- and low-risk groups. (C and D) KEGG pathway analysis of DEGs between the high- and low-risk groups. |
Discussion
In the present study, we comprehensively investigated the roles of pyroptosis-related lncRNAs in STS. First, we identified pyroptosis-related lncRNAs that had prognostic value in STS patients, and then defined 2 clusters by the expression pattern of prognostic pyroptosis-related lncRNAs in STS patients. Next, the differences in prognosis and immune landscape between clusters were investigated. Furthermore, we constructed and validated an OS risk model based on 10 pyroptosis-related lncRNAs, and a DFS risk model based on 13 pyroptosis-related lncRNAs for STS patients. To the best of our knowledge, this is the first study to explore the functions of pyroptosis-related lncRNAs and construct risk signatures based on pyroptosis-related lncRNAs in STS.
A total of 259 STS patients were extracted from GDC TCGA-SARC, and 166 pyroptosis-related lncRNAs were confirmed from STS. Then, we confirmed that 24 pyroptosis-related lncRNAs that could function as prognostic biomarkers in STS, and consensus clustering according to the expression of prognostic pyroptosis-related lncRNAs was conducted to divide STS patients into two clusters. The survival analysis showed that patients in cluster 2 presented favorable prognoses, and higher immune, stromal and ESTIMATE scores. There were also significant differences in the infiltration of immune cells and the expression of immune checkpoints between clusters. We revealed that cluster 2 had a higher abundance of several infiltrating immune cell types, including macrophage M1, CD4+ memory activated T cell, CD8+ T cell, T cell follicular helper, T cell gamma delta, T cell regulatory and monocyte, whereas a lower abundance of macrophage M0 and NK cell resting. Additionally, the expression levels of IDO1, PD-L1, LAG3, TIGIT, CD96 and CD27 were significantly higher in cluster 2.
Among these prognostic pyroptosis-related lncRNAs in STS, several lncRNAs have been reported to play crucial roles in cancer initiation and development. For instance, IGF2-AS, which is upregulated in gastric adenocarcinoma tissues, has been found to promote gastric adenocarcinoma cell proliferation and migration by inducing SHOX2 via sponging miR-503.31 Via sponging miR-4500 to upregulate BACH1 expression, TRG-AS1 could promote cellular proliferation, migration and epithelial–mesenchymal transition (EMT) in hepatocellular carcinoma.32 In tongue squamous cell carcinoma, TRG-AS1 can promote YAP1 activity via sponging miR-543, thus promoting cell proliferation, invasion and migration, while inhibiting cell apoptosis.33 LINC01857, which is upregulated in glioma tissues, has been confirmed to have a significant relationship with worse prognoses of patients with glioma. Mechanistically, LINC01857 could function as a sponge of miR-1281 to stimulate TRIM65, and promote glioma cell migration and invasion.34 However, the biological functions and underlying mechanisms of most pyroptosis-related lncRNAs in modulating STS development have not been comprehensively investigated.
To further verify the clinical significance of pyroptosis-related lncRNAs in STS, we constructed an OS-risk based on 10 and a DFS-risk signatures based on 13 pyroptosis-related lncRNAs, and then successfully validated the two risk signatures in the independent cohort. The differences in OS and DFS status between high- and low-risk STS patients were significant in the two cohorts. In addition, the two risk signatures were both relevant to prognoses of STS patients, and the 5-year AUCs of the two risk signatures were all higher than 0.75, indicating the satisfactory performance in predicting the prognosis of STS patients. The results of univariate and multivariate Cox analyses identified that both risk signatures can be employed independently for predicting the prognosis of patients with STS.
There is increasing evidence that pyroptosis is critically involved in modulating tumor immune microenvironments, and has effective anti-tumor immunity functions.12,35,36 BRAF and MEK inhibitors could induce GSDME-dependent pyroptosis to modulate tumor immune microenvironment, and BRAF and MEK inhibitors resistant melanoma cells displayed the loss of GSDME cleavage and pyroptosis, thus highlighting the role of GSDME-dependent pyroptosis in anti-tumor immune response.37 In addition, very recent works have indicated that tumor cells induce the recruitment of tumor-suppressed immune cells via the induction of pyroptosis. It has been found that CD8+ T cells and NK cells can reciprocally stimulate tumor cells pyroptosis through granzyme B (an enzyme that can cleave GSDME) in the pyroptosis-induced tumor microenvironment, thus constructing a positive feedback loop between tumor cells and immune microenvironment.12,38 Moreover, pyroptosis has been found to be correlated with the efficacy of immunotherapy in cancer treatment. It has been found that chimeric antigen receptor (CAR) T cells can induce the cellular caspase 3/GSDME-dependent pyroptosis by releasing granzyme B. Subsequently, pyroptosis-released factors can stimulate caspase 1, which can contribute to the clearage of GSDMD in macrophages, resulting in cytokine release syndrome (CRS).39
To validate the regulatory functions of pyroptosis-related lncRNAs in modulating tumor immune microenvironment in STS, we further explored the relation between OS-risk signature and tumor immune microenvironment in STS. We found that there was a negative correlation between the risk score and the expression level of several immune checkpoints, including IDO1, PD-L1, LAG3, TIGIT, CD96 and CD27. Previous studies have reported that IDO1 and PD-L1 overexpression was correlated with better prognosis in UPS. Also, it has been found that LAG3 is a favorable prognostic immune biomarker in high-grade STS patients.40 These studies are all consistent with the results of our research findings. Therefore, our risk signature exhibits great potential in predicting the expression of immune checkpoints for STS patients, thus facilitating the prediction of immunotherapy efficacy for STS patients. However, due to multiple histological subtypes and rarity of STS compared with other cancer types, current studies investigating immune checkpoints in STS are based on few histological subtypes and small clinical samples. In addition, confirming the expression pattern of diverse immune checkpoints in STS is still difficult, as well as the significant relationship of immune checkpoints with clinical outcomes for STS patients, and there have been several studies reporting controversial results. For instance, a recent study has indicated that PD-L1 could function as a worse prognostic biomarker in UPS. Similarly, a previous meta-analysis found that there were negative correlations between PD-L1 expression and prognosis in STS.41 Future studies are warranted to elucidate the expression pattern and clinical significance of specific immune checkpoint in STS based on larger cohorts.
Besides, we revealed that there was a significant relationship between the risk score and the abundance of multiple immune cell types in STS. There is a positive relationship between the risk score and the abundance of macrophage M0, and NK cell resting, whereas there is a negative relationship between the risk score and the abundance of macrophage M1, monocyte, CD8+ T cell, T cell follicular helper, and T cell regulatory. Multiple lines of evidence have indicated that infiltrating immune cells significantly correlate with prognoses in patients with STS. For instance, CD8+ T cells in tumor immune microenvironment play critical roles in tumor control and anti-tumor immunity, and high infiltration of CD8+ T cells is significantly correlated with favorable prognosis in various cancers, including STS.42,43 Previous studies have found that macrophage M1 has positive effects on prognosis, whereas macrophage M0 has opposite effects on STS.43,44 These studies confirmed the results of our research, indicating the positive or negative effects of pyroptosis-related lncRNAs on the prognosis of patients with STS via modulating the infiltration of immune cells.
Several limitations should be addressed in our study. First of all, our investigation was performed based on the TCGA-SARC dataset instead of our own data. Second, the functions and regulatory mechanisms of pyroptosis-related lncRNAs controlling STS immune microenvironment are not explored in experiments. Third, the exact functions of pyroptosis-related lncRNAs of specific STS histological type have not been investigated in this study. Finally, the risk signature based on pyroptosis-related lncRNAs should be verified in larger clinical samples before it is incorporated into clinical applications. Therefore, future studies are warranted for illustrating the detailed mechanisms by which pyroptosis-related lncRNAs modulate STS progression and immune microenvironment, and we will collect clinical samples for further verification, which will be time-consuming.
Conclusion
In summary, we comprehensively investigated the functions and clinicopathological significance of pyroptosis-related lncRNAs in STS, and constructed two novel risk signatures for OS and DFS of STS patients. The pyroptosis-related lncRNAs-based risk signature could effectively predict the prognosis, and tumor immune landscape in STS, thus highlighting the promising roles of pyroptosis-related lncRNAs as novel biomarkers and effective therapeutic targets for STS patients. Future studies are required to investigate the underlying mechanisms of pyroptosis-related lncRNAs in mediating STS progression and immune microenvironment.
Abbreviations
lncRNAs, long noncoding RNAs; STS, soft tissue sarcomas; TCGA-SARC, The Cancer Genome Atlas Sarcoma; TCGA, The Cancer Genome Atlas; GTEx, Genotype-Tissue Expression; OS, overall survival; DFS, disease-free survival; ROC, receiver operating characteristic; miRNAs, microRNAs; DEGs, differential expressed genes; log2 FC, log2-fold change; FDR, false discovery rate; GO, Gene Ontology; KEGG, Kyoto Encyclopedia of Genes and Genomes; AUC, area under ROC curve; HR, hazard ratio; CI, confidence interval; EMT, epithelial–mesenchymal transition; CAR, chimeric antigen receptor; CRS, cytokine release syndrome.
Data Sharing Statement
The datasets generated and analyzed during the current study are available in the TCGA (https://portal.gdc.cancer.gov/), and GTEx (https://gtexportal.org/).
Ethical Statement
The data from TCGA and GTEx are shared and available to the public, and there are no ethical concerns.
Ethics Approval and Informed Consent
Our data are from TCGA and GTEx databases. Both are public research databases. Since informed patient consent in TCGA and GTEx databases is not required, it is considered that ethical approval is not needed. Considering that all data used in the study are from public databases, Institutional Ethics Committee of Second Xiangya Hospital of Central South University have exempted this study from approval.
Acknowledgments
We acknowledge TCGA and GTEx databases for providing their platforms and contributors for uploading their meaningful datasets.
Funding
This study was supported by grants from the National Natural Science Foundation of China (Grant No. 81871783 and 82072441).
Disclosure
The authors declare that they have no competing interests.
References
1. Bourcier K, Le Cesne A, Tselikas L, et al. Basic knowledge in soft tissue sarcoma. Cardiovasc Intervent Radiol. 2019;42:1255–1261. doi:10.1007/s00270-019-02259-w
2. Bessen T, Caughey GE, Shakib S, et al. A population-based study of soft tissue sarcoma incidence and survival in Australia: an analysis of 26,970 cases. Cancer Epidemiol. 2019;63:101590. doi:10.1016/j.canep.2019.101590
3. Kim HS, Nam CM, Jang SY, et al. Characteristics and treatment patterns of patients with advanced soft tissue sarcoma in Korea. Cancer Res Treat. 2019;51:1380–1391. doi:10.4143/crt.2018.476
4. Ratan R, Patel SR. Chemotherapy for soft tissue sarcoma. Cancer. 2016;122:2952–2960. doi:10.1002/cncr.30191
5. Frank D, Vince JE. Pyroptosis versus necroptosis: similarities, differences, and crosstalk. Cell Death Differ. 2019;26:99–114. doi:10.1038/s41418-018-0212-6
6. Ruan J, Wang S, Wang J. Mechanism and regulation of pyroptosis-mediated in cancer cell death. Chem Biol Interact. 2020;323:109052. doi:10.1016/j.cbi.2020.109052
7. Shi J, Gao W, Shao F. Pyroptosis: gasdermin-mediated programmed necrotic cell death. Trends Biochem Sci. 2017;42:245–254. doi:10.1016/j.tibs.2016.10.004
8. Zhou CB, Fang JY. The role of pyroptosis in gastrointestinal cancer and immune responses to intestinal microbial infection. Biochim Biophys Acta Rev Cancer. 2019;1872:1–10. doi:10.1016/j.bbcan.2019.05.001
9. Hu L, Chen M, Chen X, et al. Chemotherapy-induced pyroptosis is mediated by BAK/BAX-caspase-3-GSDME pathway and inhibited by 2-bromopalmitate. Cell Death Dis. 2020;11:281. doi:10.1038/s41419-020-2476-2
10. Zhang CC, Li CG, Wang YF, et al. Chemotherapeutic paclitaxel and cisplatin differentially induce pyroptosis in A549 lung cancer cells via caspase-3/GSDME activation. Apoptosis. 2019;24:312–325. doi:10.1007/s10495-019-01515-1
11. Wei Q, Zhu R, Zhu J, Zhao R, Li M. E2-induced activation of the NLRP3 inflammasome triggers pyroptosis and inhibits autophagy in HCC cells. Oncol Res. 2019;27:827–834. doi:10.3727/096504018X15462920753012
12. Wang Q, Wang Y, Ding J, et al. A bioorthogonal system reveals antitumour immune function of pyroptosis. Nature. 2020;579:421–426. doi:10.1038/s41586-020-2079-1
13. Tan Y, Chen Q, Li X, et al. Pyroptosis: a new paradigm of cell death for fighting against cancer. J Exp Clin Cancer Res. 2021;40:153. doi:10.1186/s13046-021-01959-x
14. St Laurent G, Wahlestedt C, Kapranov P. The landscape of long noncoding RNA classification. Trends Genet. 2015;31:239–251. doi:10.1016/j.tig.2015.03.007
15. Bhan A, Soleimani M, Mandal SS. Long noncoding RNA and cancer: a new paradigm. Cancer Res. 2017;77:3965–3981. doi:10.1158/0008-5472.CAN-16-2634
16. Ma Y, Zhang J, Wen L, Lin A. Membrane-lipid associated lncRNA: a new regulator in cancer signaling. Cancer Lett. 2018;419:27–29. doi:10.1016/j.canlet.2018.01.008
17. Robinson EK, Covarrubias S, Carpenter S. The how and why of lncRNA function: an innate immune perspective. Biochim Biophys Acta Gene Regul Mech. 2020;1863:194419.
18. Ma F, Liu X, Zhou S, et al. Long non-coding RNA FGF13-AS1 inhibits glycolysis and stemness properties of breast cancer cells through FGF13-AS1/IGF2BPs/Myc feedback loop. Cancer Lett. 2019;450:63–75. doi:10.1016/j.canlet.2019.02.008
19. Peng W, Zhang C, Peng J, et al. Lnc-FAM84B-4 acts as an oncogenic lncRNA by interacting with protein hnRNPK to restrain MAPK phosphatases-DUSP1 expression. Cancer Lett. 2020;494:94–106. doi:10.1016/j.canlet.2020.08.036
20. Xin X, Wu M, Meng Q, et al. Long noncoding RNA HULC accelerates liver cancer by inhibiting PTEN via autophagy cooperation to miR15a. Mol Cancer. 2018;17:94. doi:10.1186/s12943-018-0843-8
21. Liu J, Yao L, Zhang M, Jiang J, Yang M, Wang Y. Downregulation of LncRNA-XIST inhibited development of non-small cell lung cancer by activating miR-335/SOD2/ROS signal pathway mediated pyroptotic cell death. Aging. 2019;11:7830–7846. doi:10.18632/aging.102291
22. Chen Z, He M, Chen J, Li C, Zhang Q. Long non-coding RNA SNHG7 inhibits NLRP3-dependent pyroptosis by targeting the miR-34a/SIRT1 axis in liver cancer. Oncol Lett. 2020;20:893–901. doi:10.3892/ol.2020.11635
23. Goldman M, Craft B, Swatloski T, et al. The UCSC cancer genomics browser: update 2015. Nucleic Acids Res. 2015;43:D812–817. doi:10.1093/nar/gku1073
24. Karki R, Kanneganti TD. Diverging inflammasome signals in tumorigenesis and potential targeting. Nat Rev Cancer. 2019;19:197–214. doi:10.1038/s41568-019-0123-y
25. Wang B, Yin Q. AIM2 inflammasome activation and regulation: a structural perspective. J Struct Biol. 2017;200:279–282. doi:10.1016/j.jsb.2017.08.001
26. Xia X, Wang X, Cheng Z, et al. The role of pyroptosis in cancer: pro-cancer or pro-”host”? Cell Death Dis. 2019;10:650. doi:10.1038/s41419-019-1883-8
27. Ye Y, Dai Q, Qi H. A novel defined pyroptosis-related gene signature for predicting the prognosis of ovarian cancer. Cell Death Discov. 2021;7:71. doi:10.1038/s41420-021-00451-x
28. Wilkerson MD, Hayes DN. ConsensusClusterPlus: a class discovery tool with confidence assessments and item tracking. Bioinformatics. 2010;26:1572–1573. doi:10.1093/bioinformatics/btq170
29. Yoshihara K, Shahmoradgoli M, Martinez E, et al. Inferring tumour purity and stromal and immune cell admixture from expression data. Nat Commun. 2013;4:2612. doi:10.1038/ncomms3612
30. Chen B, Khodadoust MS, Liu CL, Newman AM, Alizadeh AA. Profiling tumor infiltrating immune cells with CIBERSORT. Methods Mol Biol. 2018;1711:243–259.
31. Huang J, Chen YX, Zhang B. IGF2-AS affects the prognosis and metastasis of gastric adenocarcinoma via acting as a ceRNA of miR-503 to regulate SHOX2. Gastric Cancer. 2020;23:23–38. doi:10.1007/s10120-019-00976-2
32. Sun X, Qian Y, Wang X, et al. LncRNA TRG-AS1 stimulates hepatocellular carcinoma progression by sponging miR-4500 to modulate BACH1. Cancer Cell Int. 2020;20:367. doi:10.1186/s12935-020-01440-3
33. He S, Wang X, Zhang J, Zhou F, Li L, Han X. TRG-AS1 is a potent driver of oncogenicity of tongue squamous cell carcinoma through microRNA-543/Yes-associated protein 1 axis regulation. Cell Cycle. 2020;19:1969–1982. doi:10.1080/15384101.2020.1786622
34. Hu G, Liu N, Wang H, Wang Y, Guo Z. LncRNA LINC01857 promotes growth, migration, and invasion of glioma by modulating miR-1281/TRIM65 axis. J Cell Physiol. 2019;234:22009–22016. doi:10.1002/jcp.28763
35. Man SM, Karki R, Kanneganti TD. Molecular mechanisms and functions of pyroptosis, inflammatory caspases and inflammasomes in infectious diseases. Immunol Rev. 2017;277:61–75. doi:10.1111/imr.12534
36. Tang R, Xu J, Zhang B, et al. Ferroptosis, necroptosis, and pyroptosis in anticancer immunity. J Hematol Oncol. 2020;13:110. doi:10.1186/s13045-020-00946-7
37. Erkes DA, Cai W, Sanchez IM, et al. Mutant BRAF and MEK inhibitors regulate the tumor immune microenvironment via pyroptosis. Cancer Discov. 2020;10:254–269. doi:10.1158/2159-8290.CD-19-0672
38. Zhang Z, Zhang Y, Xia S, et al. Gasdermin E suppresses tumour growth by activating anti-tumour immunity. Nature. 2020;579:415–420. doi:10.1038/s41586-020-2071-9
39. Davila ML, Riviere I, Wang X, et al. Efficacy and toxicity management of 19–28z CAR T cell therapy in B cell acute lymphoblastic leukemia. Sci Transl Med. 2014;6:224ra225. doi:10.1126/scitranslmed.3008226
40. Bae JY, Choi KU, Kim A, et al. Evaluation of immune-biomarker expression in high-grade soft-tissue sarcoma: HLA-DQA1 expression as a prognostic marker. Exp Ther Med. 2020;20:107. doi:10.3892/etm.2020.9225
41. Zheng C, You W, Wan P, et al. Clinicopathological and prognostic significance of PD-L1 expression in sarcoma: a systematic review and meta-analysis. Medicine. 2018;97:e11004. doi:10.1097/MD.0000000000011004
42. Nowicki TS, Akiyama R, Huang RR, et al. Infiltration of CD8 T cells and expression of PD-1 and PD-L1 in synovial sarcoma. Cancer Immunol Res. 2017;5:118–126. doi:10.1158/2326-6066.CIR-16-0148
43. Zhu N, Hou J. Assessing immune infiltration and the tumor microenvironment for the diagnosis and prognosis of sarcoma. Cancer Cell Int. 2020;20:577. doi:10.1186/s12935-020-01672-3
44. Fan J, Qin X, He R, Ma J, Wei Q. Gene expression profiles for an immunoscore model in bone and soft tissue sarcoma. Aging. 2021;13:13708–13725. doi:10.18632/aging.202956
 © 2021 The Author(s). This work is published and licensed by Dove Medical Press Limited. The full terms of this license are available at https://www.dovepress.com/terms.php and incorporate the Creative Commons Attribution - Non Commercial (unported, v3.0) License.
By accessing the work you hereby accept the Terms. Non-commercial uses of the work are permitted without any further permission from Dove Medical Press Limited, provided the work is properly attributed. For permission for commercial use of this work, please see paragraphs 4.2 and 5 of our Terms.
© 2021 The Author(s). This work is published and licensed by Dove Medical Press Limited. The full terms of this license are available at https://www.dovepress.com/terms.php and incorporate the Creative Commons Attribution - Non Commercial (unported, v3.0) License.
By accessing the work you hereby accept the Terms. Non-commercial uses of the work are permitted without any further permission from Dove Medical Press Limited, provided the work is properly attributed. For permission for commercial use of this work, please see paragraphs 4.2 and 5 of our Terms.