")
Back to Journals » OncoTargets and Therapy » Volume 10
Identification and validation of potential prognostic gene biomarkers for predicting survival in patients with acute myeloid leukemia
Authors Huang R , Liao XW , Li Q
Received 29 July 2017
Accepted for publication 4 October 2017
Published 2 November 2017 Volume 2017:10 Pages 5243—5254
DOI https://doi.org/10.2147/OTT.S147717
Checked for plagiarism Yes
Review by Single anonymous peer review
Peer reviewer comments 4
Editor who approved publication: Dr Ingrid Espinoza
Rui Huang,1,* Xiwen Liao,2,* Qiaochuan Li1
1Department of Hematology, 2Department of Hepatobiliary Surgery, The First Affiliated Hospital of Guangxi Medical University, Nanning, Guangxi, People’s Republic of China
*These authors contributed equally to this work
Background: Molecular analysis is a promising source of clinically useful prognostic biomarkers. The aim of this investigation was to identify prognostic biomarkers for patients with acute myeloid leukemia (AML) by using the gene expression profile dataset from public database.
Methods: The gene expression profile dataset and corresponding overall survival (OS) information of three cohorts of AML patients from GSE12417 and The Cancer Genome Atlas AML project (TCGA-LAML) were included in the present study. Prognostic gene screening was performed by using a survival package, whereas time-dependent receiver operating characteristic (ROC) curve analysis was performed using the survivalROC package.
Results: In the three cohorts, 11 genes were identified that were significantly associated with AML OS. A linear prognostic model of the 11 genes was constructed and weighted by regression coefficient (β) from the multivariate Cox regression analyses of GSE12417 HG-U133A cohort to divide patients into high- and low-risk groups. GSE12417 HG-U133 plus 2.0 and TCGA-LAML were validation cohorts. Patients assigned to the high-risk group exhibited poor OS compared to patients in the low-risk group. The 11-gene signature is a prognostic marker of AML and demonstrates good performance for predicting 1-, 3-, and 5-year OS as evaluated by survivalROC in the three cohorts.
Conclusion: Our study has identified an mRNA signature including 11 genes, which may serve as a potential prognostic marker of AML.
Keywords: acute myeloid leukemia, prognosis, biomarker, GEO, TCGA
Introduction
Acute myeloid leukemia (AML), a heterogeneous clonal disorder of hemopoietic progenitor cells, is the most common myeloid leukemia with a poor prognosis. The 5-year overall survival (OS) of AML is <50%, and for patients older than 60 years, OS is <20%.1,2 Numerous factors that affect the prognosis of AML have been identified, including age, the number of white blood cells in peripheral blood, lactic dehydrogenase levels before chemotherapy, and cytogenetic changes.3,4 The treatment strategy of AML can be individualized according to cytogenetic characteristics, thus prolonging the patient’s remission and survival.2,4 Genetic defects are considered the most important factors in determining the effect of chemotherapy and outcome.2,5 Prognostic factors of AML can be divided into patient- and disease-associated factors. Molecular genetic lesions, a disease-associated factor, have become an active research area for the investigation of prognostic and predictive markers.4 Gene expression profiling in AML has already been proven to be valuable in the diagnosis of different cytogenetic subtypes, discovering novel AML subclasses, and prognostic prediction.6 Molecular analysis is a promising source of clinically useful prognostic biomarkers. The aim of this investigation was to identify prognostic biomarkers for patients with AML by using a gene expression profile dataset from the public database and constructing a gene signature for AML prognostic prediction.
Methods
Data source and preprocessing
The discovery and validation gene mRNA expression profile datasets were obtained from Gene Expression Omnibus (https://www.ncbi.nlm.nih.gov/geo/) and The Cancer Genome Atlas (TCGA; https://tcga-data.nci.nih.gov/), so, this article does not contain any studies with human participants or animals performed by any of the authors of the present study. The inclusion criteria of cohorts were as follows: 1) whole genome mRNA expression profile dataset, 2) sample of tissue was bone marrow, and 3) the patient’s survival information can be available. By searching the public expression profile database, we found that only the AML patients of the GSE12417 (https://www.ncbi.nlm.nih.gov/geo/query/acc.cgi?acc=GSE12417) and TCGA AML project (TCGA-LAML) cohorts were suitable for the requirements of this study.7,8 The bone marrow expression profile dataset of AML patients with complete survival data available was included in the present study. The raw dataset of RNA sequencing was normalized by the DESeq package in the R platform, whereas the expression chip dataset was normalized by the limma package.9,10 For multiple probe sets, the average value corresponding to the same gene was regarded as the gene’s expression value.11 The gene expression level of the TCGA-LAML cohort was log2-transformed for further analysis.
Identification of prognostic gene markers
Survival analyses were conducted on patients with normalized mRNA expression and OS profiles. Patients were divided into low- and high-expression groups according to the gene’s median expression value. Univariate Cox proportional hazards regression analysis was applied to estimate survival in the study sample by using a survival package in the R platform, and the low expression group was set as the reference group. A cutoff P-value of 0.05 was considered statistically significant and used to identify prognostic gene markers.
Construction and validation of the prognostic gene signature
The intersection of the three cohorts’ prognostic gene markers was used to construct the survival predictive model. These prognostic gene markers from the GSE12417 HG-U133A cohort were fitted in a multivariate Cox regression model with OS as a dependent variable to measure the relative contributions for survival prediction. A prognosis risk score was established on the basis of a linear combination of these gene expression levels multiplied by a regression coefficient (β) derived from the multivariate Cox proportional hazards regression model of each gene with the following formula: risk score = expression of gene1 × β1gene1 + expression of gene2 × β2gene2 + … expression of genen × βngenen.11,12 Then, another two independent cohorts of AML patients from GSE12417 HG-U133 plus 2.0 and TCGA-LAML were used for the prognostic signature validation. The AML patients were divided into low- and high-risk groups according to the median value of the prognostic risk score. The time-dependent receiver operating characteristic (ROC) curve analysis was performed using the survivalROC package in the R platform to evaluate the predictive accuracy of the prognostic signature for time-dependent cancer death.13
Statistical analysis
Univariate Cox proportional hazards regression model was used for calculating the clinical outcome between different gene expression groups. Hazard ratio (HR) and 95% confidence interval (CI) were calculated from the univariate Cox proportional hazards regression model. A survival curve was carried out using the Kaplan–Meier method with the log-rank test. A value of P<0.05 was considered statistically significant. All the statistical analyses were conducted with SPSS Version 20.0 (IBM Corporation, Armonk, NY, USA) and R 3.3.0.
Results
Study population
By performed the inclusion criteria, GSE12417 HG-U133A, GSE12417 HG-U133 plus 2.0 chip, and TCGA-LAML cohorts were included into the present study. In order to ensure consistency in the patients enrolled, we excluded two AML patients with peripheral blood expression profile datasets from the GSE12417 HG-U133A cohort and five from the GSE12417 HG-U133 plus 2.0 chip cohort. One myelodysplastic syndrome patient was excluded from the GSE12417 HG-U133A cohort and one was excluded from the GSE12417 HG-U133 plus 2.0 cohort. A total of 160 patients from the GSE12417 HG-U133A cohort and 79 patients from the GSE12417 HG-U133 plus 2.0 cohort were included in the current study. In addition, we excluded 11 patients without clinical data from the TCGA-LAML cohort and, then, a total of 140 AML patients were used for further analysis. All of these three cohorts were whole-genome mRNA expression profile dataset, and the sample of tissue was bone marrow. In addition, the OS time information of AML can be used for survival analysis.
Prognostic gene marker screening
Genome-wide survival analysis was performed by the survival package in the R platform, and low gene expression was set as the reference group. The HR and 95% CI were used to assess the risk of death in the high-expression group relative to the low-expression group and were calculated by the univariate Cox proportional hazards regression model. A total of 1,259 genes were identified as prognostic gene markers in the GSE12417 HG-U133A cohort; of these, there were 562 genes with a HR of <1 and 697 genes with a HR of >1 (Table S1). We also identified 1,234 genes as prognostic gene markers in the GSE12417 HG-U133 plus 2.0 and 5,238 genes in the TCGA-LAML cohort. Among these genes, there were 728 genes with a HR of <1 and 506 genes with a HR of >1 in the GSE12417 HG-U133 plus 2.0 cohort (Table S2), whereas there were 2,886 genes with a HR of <1 and 2,352 genes with a HR of >1 in the TCGA-LAML cohort (Table S3).
Prognostic gene signature construction and validation
The intersection of the three cohorts’ prognostic gene markers included the following 11 genes (Table 1 and Figure 1): acyl-CoA synthetase family member 2 (ACSF2), C-X-C motif chemokine receptor 6 (CXCR6), family with sequence similarity 124 member B (FAM124B), FRY like transcription coactivator (FRYL), glycophorin A (GYPA), hemoglobin subunit gamma 1 (HBG1), mago homolog, exon junction complex core component (MAGOH), malate dehydrogenase 2 (MDH2), solute carrier family 2 member 5 (SLC2A5), succinate-CoA ligase alpha subunit (SUCLG1), and transmembrane channel like 5 (TMC5). Among these 11 genes, five genes were identified as protective prognostic genes (HR <1; CXCR6, FRYL, GYPA, HBG1, and TMC5; Table 1 and Figure 1A), whereas the remaining six genes were identified as risky prognostic genes (HR >1; ACSF2, FAM124B, MAGOH, MDH2, SLC2A5, and SUCLG1; Table 1 and Figure 1B). Survival curves for these genes in the three cohorts are shown in Figures 2A–K, 3A–K, and 4A–K. The predictive model was identified in the GSE12417 HG-U133A cohort with the following formula: risk score = expression of ACSF2 × (0.438) + expression of CXCR6 × (−0.077) + expression of FAM124B × (0.295) + expression of FRYL × (−0.391) + expression of GYPA × (−0.289) + expression of HBG1 × (−0.072) + expression of MAGOH × (0.387) + expression of MDH2 × (−0.106) + expression of SLC2A5 × (0.329) + expression of SUCLG1 × (0.221) + expression of TMC5 × (−0.35). The risk score for each patient was calculated according to the aforementioned formula, and then, the median value of the risk score was used as a cutoff to create a high- or low-risk group. The risk score result of the GSE12417 HG-U133A cohort is shown in Figure 5A. Survival analysis demonstrated that patients with a high-risk score had an increased risk of death compared to the low-risk group (log-rank P=0.0004, HR =2.03, 95% CI =1.359–3.032, Figure 5B). The prognostic signature in the GSE12417 HG-U133A cohort showed a good performance in the prediction of clinical outcome, as the area under the ROC curve (AUC) was 0.729, 0.722, and 0.703 for 1-, 3-, and 5-year survivals (Figure 5C), respectively.
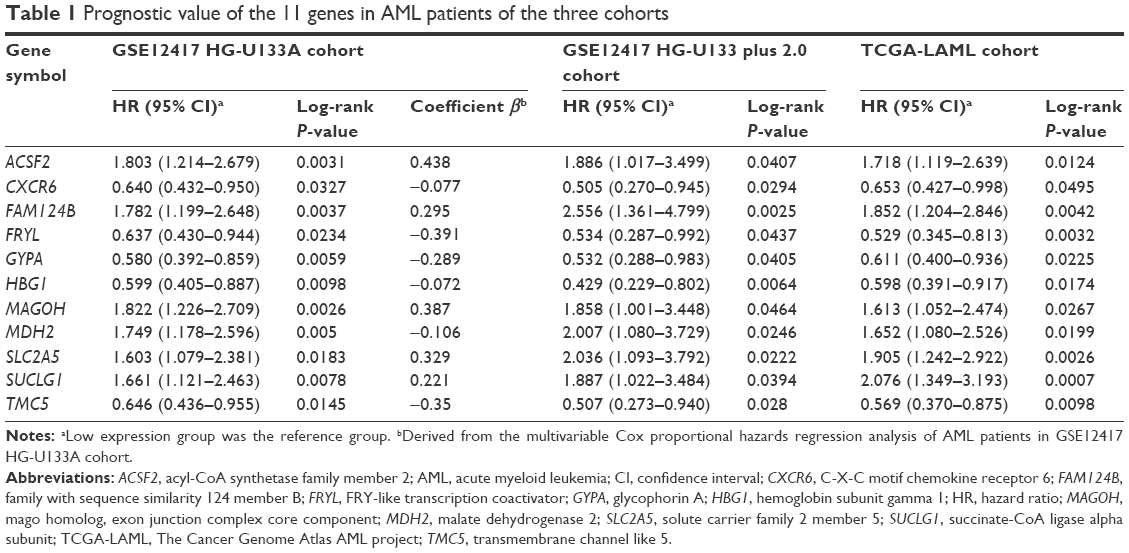 | Table 1 Prognostic value of the 11 genes in AML patients of the three cohorts |
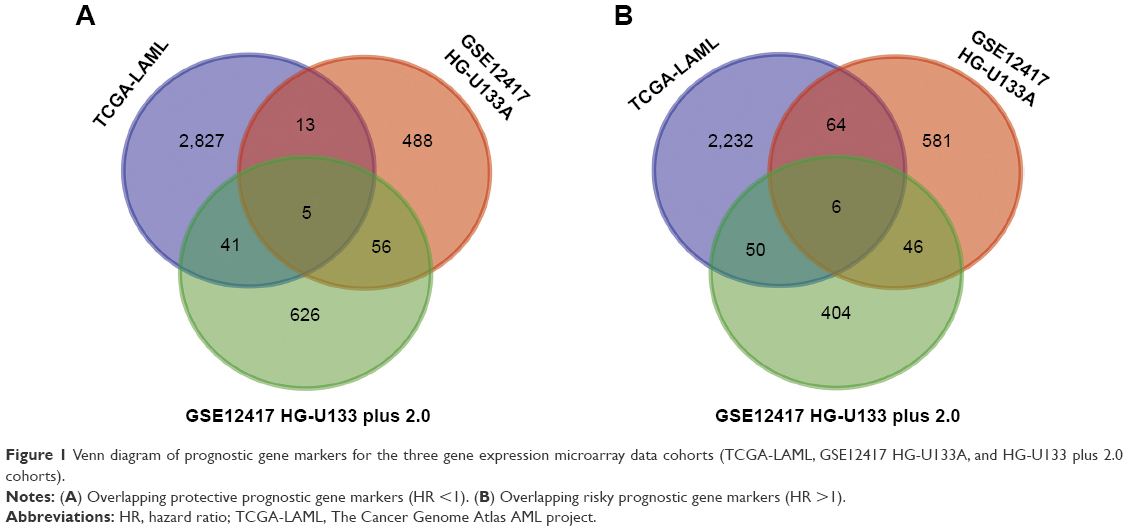 | Figure 1 Venn diagram of prognostic gene markers for the three gene expression microarray data cohorts (TCGA-LAML, GSE12417 HG-U133A, and HG-U133 plus 2.0 cohorts). |
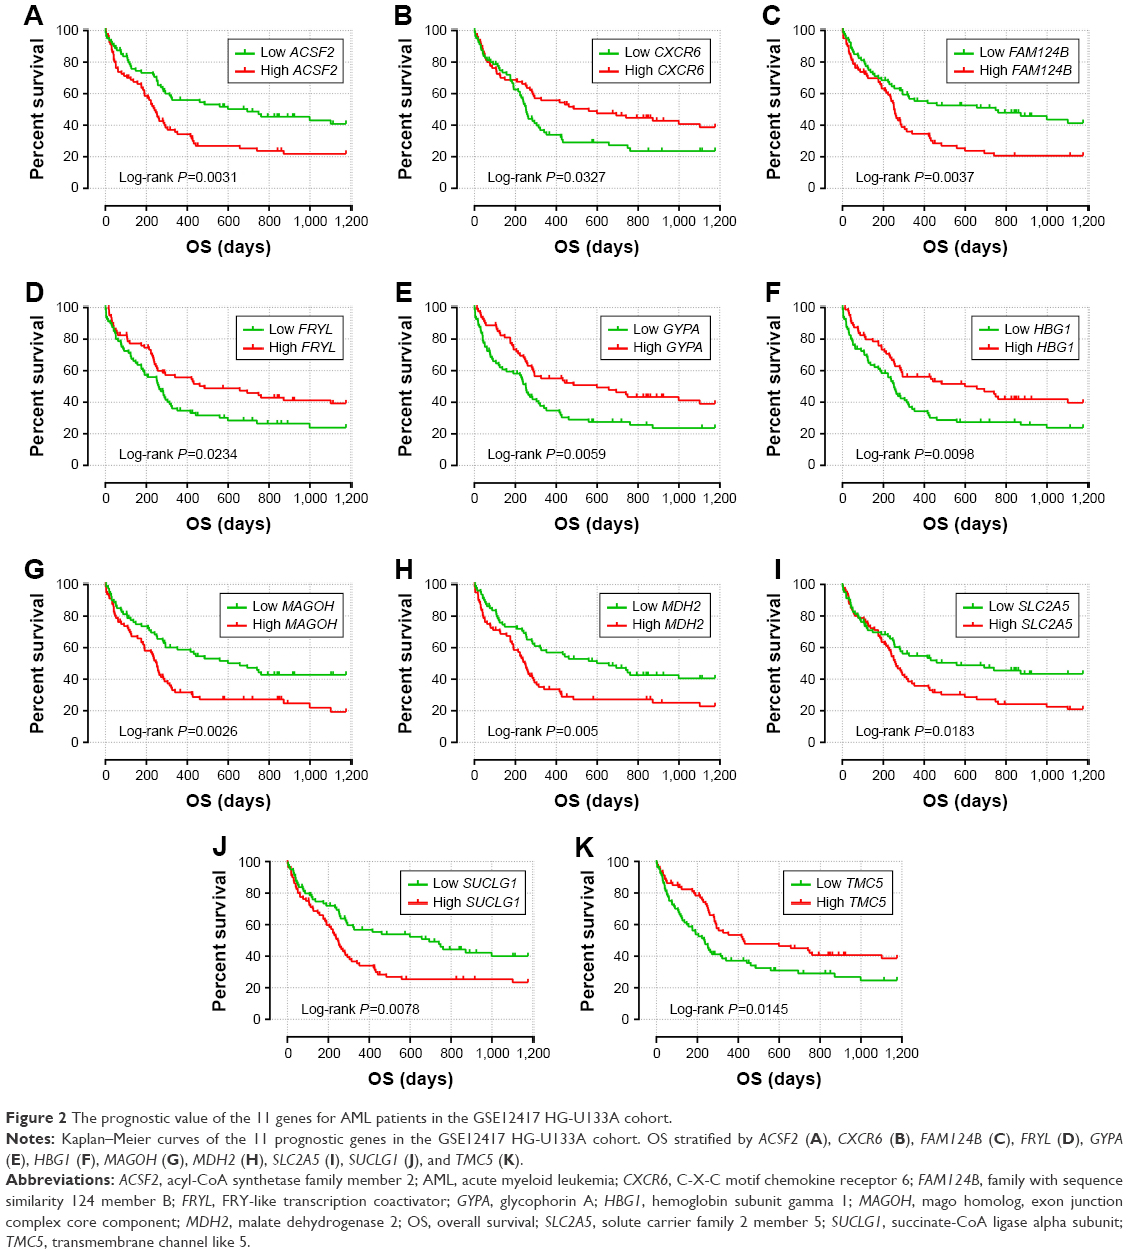 | Figure 2 The prognostic value of the 11 genes for AML patients in the GSE12417 HG-U133A cohort. |
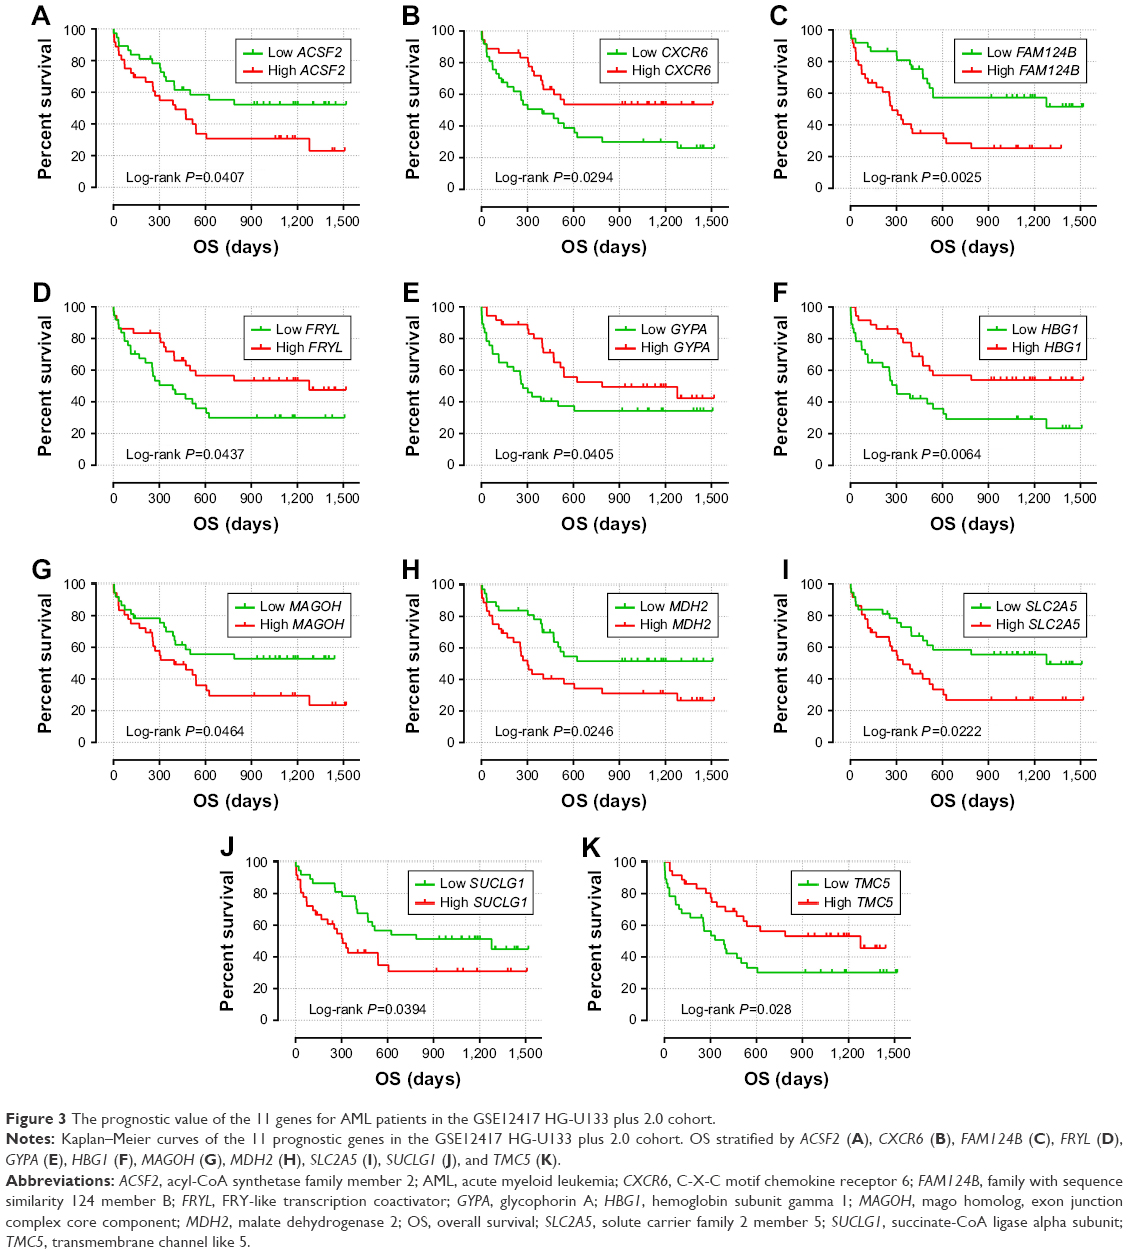 | Figure 3 The prognostic value of the 11 genes for AML patients in the GSE12417 HG-U133 plus 2.0 cohort. |
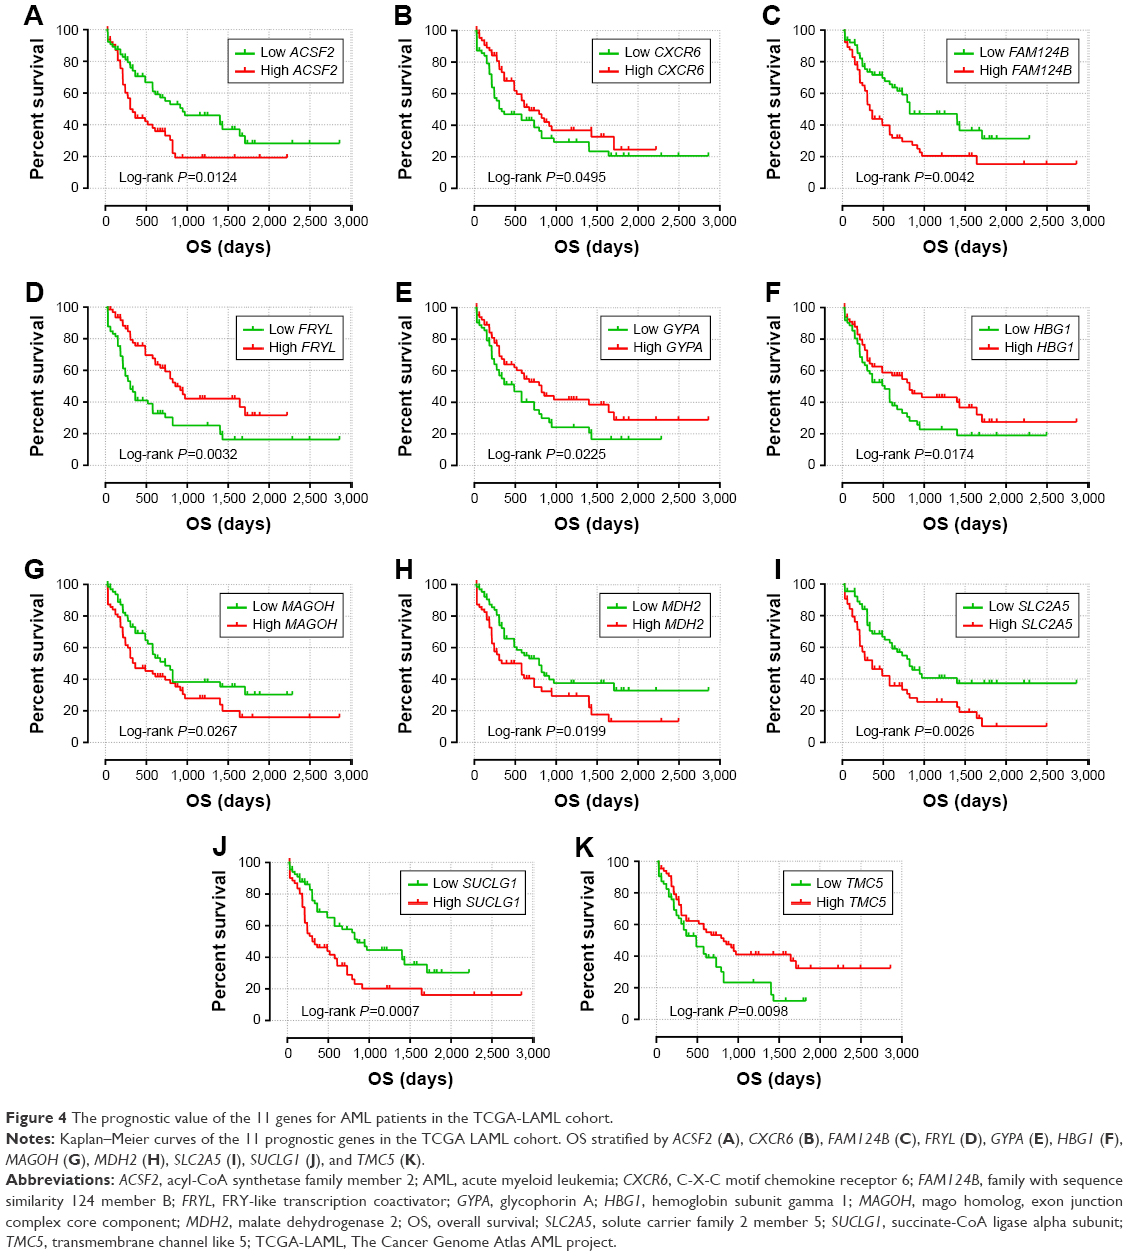 | Figure 4 The prognostic value of the 11 genes for AML patients in the TCGA-LAML cohort. |
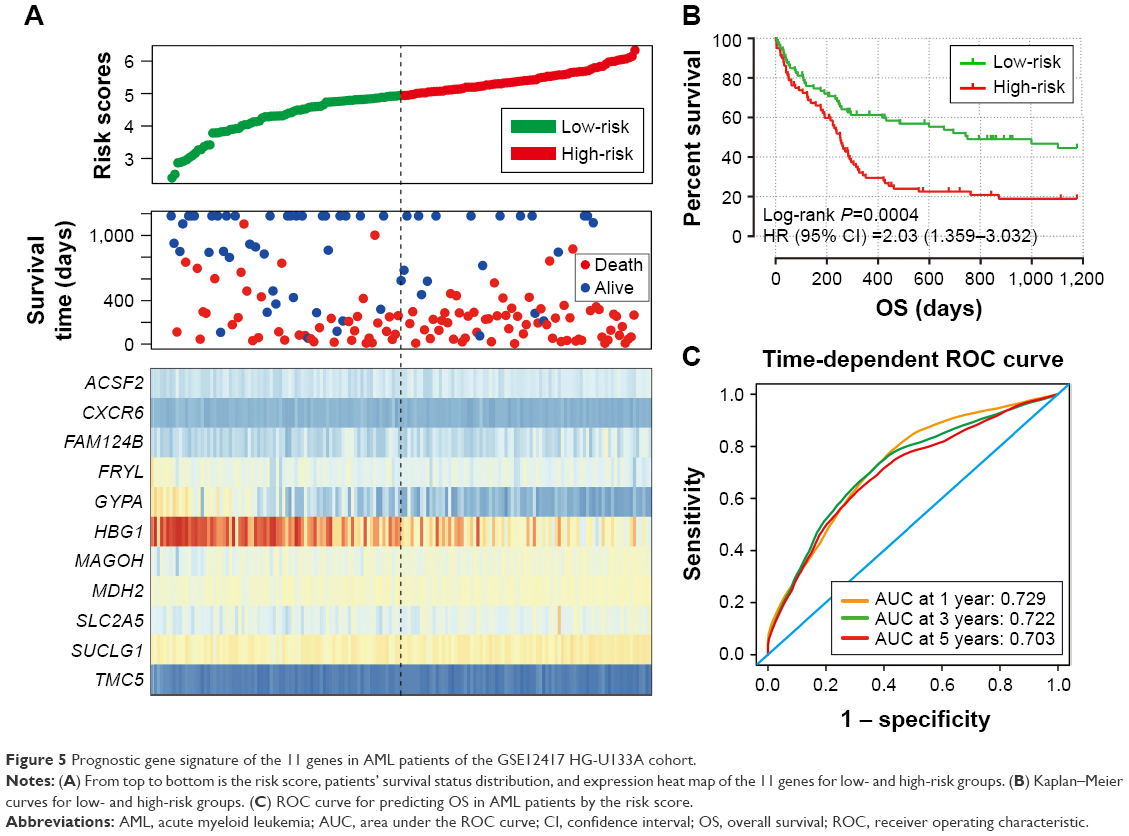 | Figure 5 Prognostic gene signature of the 11 genes in AML patients of the GSE12417 HG-U133A cohort. |
To evaluate the power of the prognostic risk score model for patients’ survival prediction, the prognostic signature and cutoff point derived from the GSE12417 HG-U133A cohort were applied to the AML patients in the GSE12417 HG-U133 plus 2.0 and TCGA-LAML cohorts as an independent validation. The results of these two cohorts are shown in Figures 6A–C and 7A–C, respectively. The prognostic signature in the GSE12417 HG-U133 plus 2.0 cohort (log-rank P=0.0019, HR =2.59, 95% CI =1.389–4.828, Figure 6B) and TCGA-LAML cohort (log-rank P<0.0001, HR =2.448, 95% CI =1.579–3.795, Figure 7B) also shows a good performance in survival prediction; the result of the Kaplan–Meier analysis showed a significant difference in patients’ OS between the high-risk and low-risk groups. The predictive accuracy of this prognostic model in the GSE12417 HG-U133 plus 2.0 cohort reported that the AUC of the ROC curve was 0.782, 0.697, and 0.662 for 1-, 3-, and 5-year survivals (Figure 6C), respectively. The AUC of the ROC curve for the TCGA-LAML cohort was 0.666, 0.713, and 0.707 for 1-, 3-, and 5-year survivals (Figure 7C), respectively. The expression level distribution of the 11 genes in the low- and high-risk groups of the three cohorts is presented in Figure 8A–C.
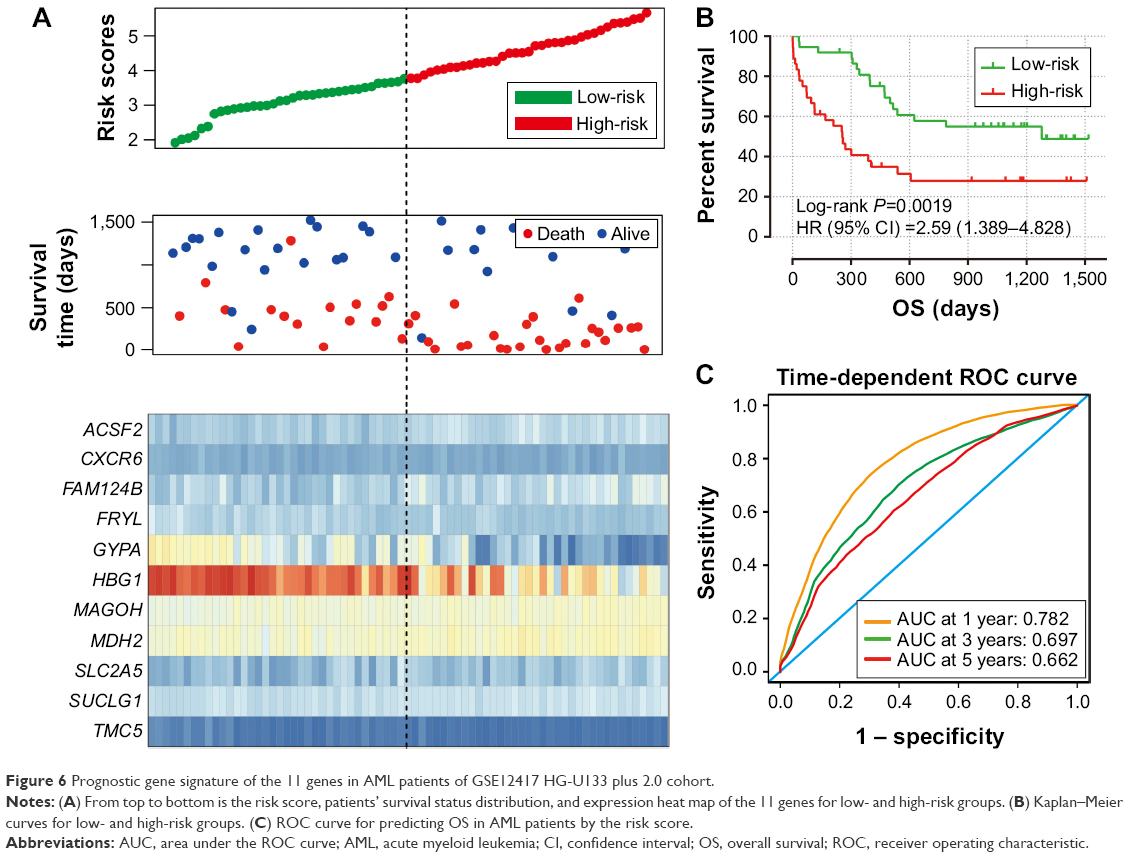 | Figure 6 Prognostic gene signature of the 11 genes in AML patients of GSE12417 HG-U133 plus 2.0 cohort. |
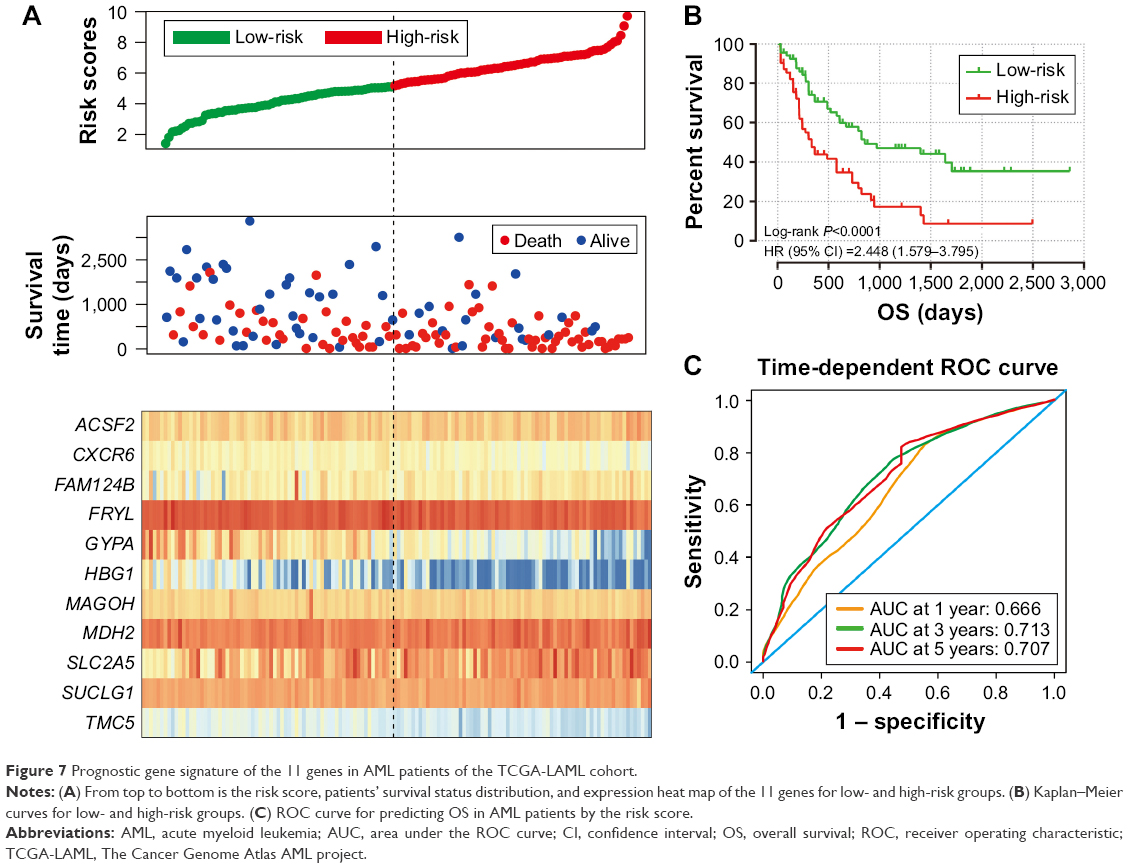 | Figure 7 Prognostic gene signature of the 11 genes in AML patients of the TCGA-LAML cohort. |
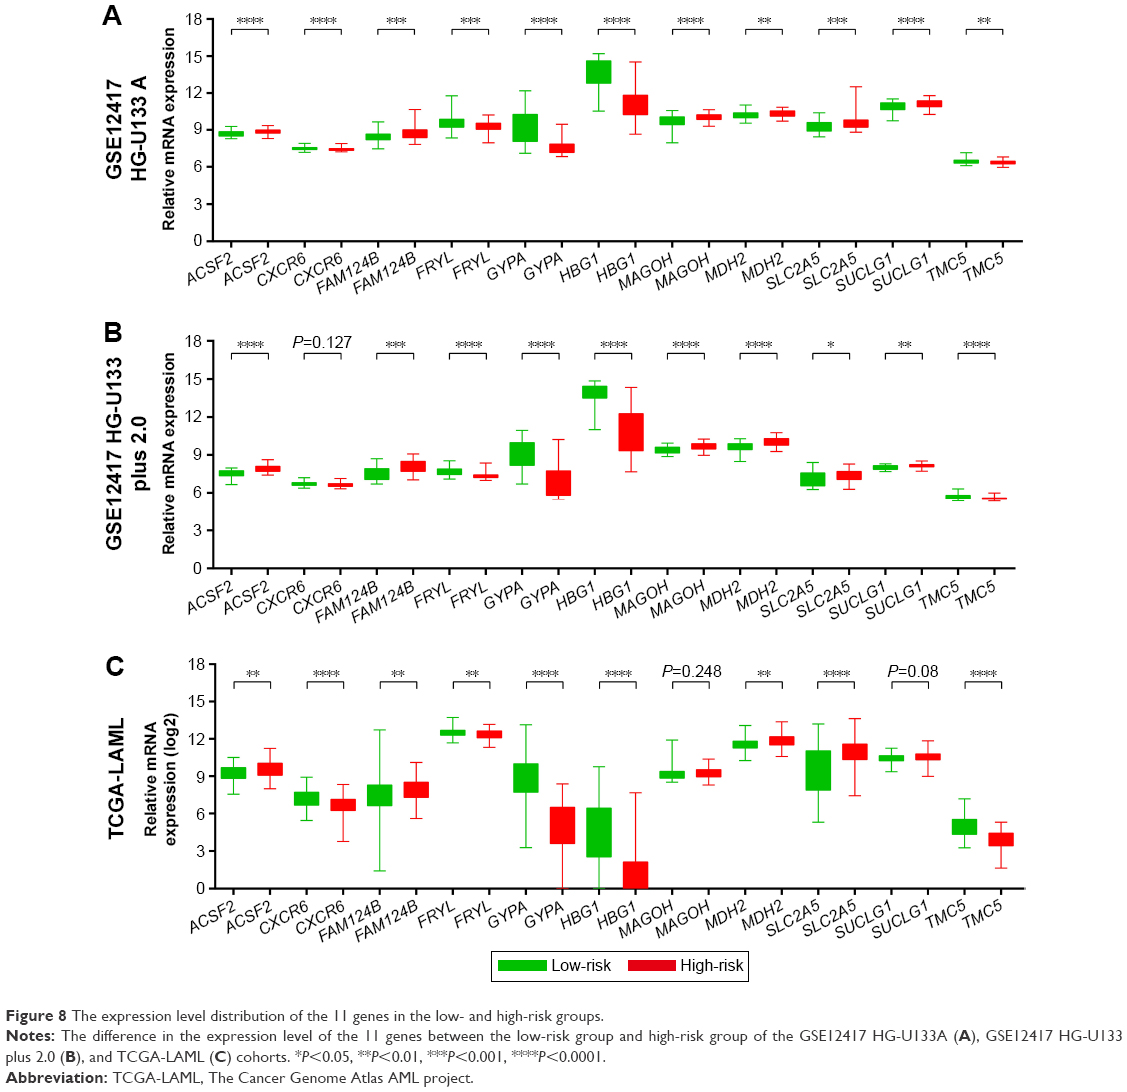 | Figure 8 The expression level distribution of the 11 genes in the low- and high-risk groups. |
Discussion
Whole genome molecular analysis is a promising source of clinically useful prognostic biomarkers in AML. The prognosis of AML is partly driven by genetic factors, and a combination of multiple genes contributes to the improvement of prognostic predictive accuracy. In the present study, we extract the AML gene expression profile dataset and corresponding survival information from GSE12417 and TCGA for whole genome survival analysis. We identified 11 genes associated with AML prognosis and constructed and validated a prognostic signature composed of the 11 genes. An assessment by time-dependent ROC curve analysis demonstrated that the prognostic signature of the 11 genes showed a good performance for predicting 1-, 3-, and 5-year OS of AML patients in the three cohorts.
The prognostic value of the five protective genes (CXCR6, FRYL, GYPA, HBG1, and TMC5) expressed in AML has not been identified in previous studies. CXCR6, one of the protective prognostic genes, is involved in signaling by a G-protein-coupled receptor and peptide ligand-binding receptor pathways, and GO annotations related to this gene include G-protein-coupled receptor activity and C-X-C chemokine receptor activity. The blockade of CXCR6 expression represses cell proliferation and invasion of hepatocellular carcinoma (HCC) cells,14,15 gastric cancer cells,16 and prostate cancer.17 CXCR6 is overexpressed in many cancer cells and significantly increased in HCC tumor tissue,14 prostate cancer,17–19 gastric cancer,20 epithelial ovarian carcinoma,21 and non-small-cell lung cancer22 compared to nontumor tissues. Previous studies also demonstrate that CXCR6 expression is involved in the metastasis of various types of cancer,18,21 and high CXCR6 expression significantly increased the risk of death in patients with prostate cancer,19 gastric cancer,20 and Ewing’s sarcoma.23 In contrast with these results, in the current study, high CXCR6 expression shows a decreased risk of death in patients with AML. Therefore, our results still need to be validated in future studies.
A study by Hayette et al24 indicated that FRYL fragment fused to mixed lineage leukemia (MLL) may contribute to the oncogenic activation of MLL, whereas Robinson et al25 reported that MLL-FRYL increases cell proliferation without an obvious effect on differentiation. A case report also showed that t(4;11)(p12;q23) with MLL and FRYL involvement represents a new recurring 11q23 translocation in therapy-related AML.26 Another protective prognostic gene, GYPA, is the most abundant erythrocyte surface sialoglycoprotein and bears the antigenic determinant for the MNS blood group and has high expression in normal human bone marrow (GenAtlas: http://www.genatlas.org/).27 The CC genotype of GYPA-rs2202507 confers a protective effect in lung cancer genetic susceptibility.28 However, any function of HBG1 and TMC5, the remaining two protective genes, involved in cancer or leukemia has seldom been reported. HBG1 is normally expressed in bone marrow and is involved in fetal hemoglobin constitution, as well as being related to thalassemia.29,30 A study by Kurima et al31 through the genomic sequence analysis of TMC genes demonstrated that TMC5 may play a role in hearing loss and autosomal dominant medullary cystic kidney disease 2. Our study is the first to report the expression of these genes in AML prognosis. Further studies are necessary to validate our findings.
The prognostic value of the six risk-related prognostic genes (ACSF2, FAM124B, MAGOH, MDH2, SLC2A5, and SUCLG1) also has not been identified in patients with AML. Work by Zhao et al32 through an RWCFusion method demonstrated that MED1–ACSF2 could be a potential driver gene fusion of breast cancer. A co-immunoprecipitation study by Batsukh et al33 identified that FAM124B may serve as a potential interaction partner of CHD7 and CHD8 and may be involved in the pathogenesis of CHARGE syndrome and neurodevelopmental disorders. Studies by Zhao et al34,35 observed that rapidly proliferating cells show a higher MAGOH mRNA expression level than these in normal tissues and concluded that mRNA expression of MAGOH correlated with cell cycle progression, cell proliferation, and germ plasm assembly in a NIH3T3 cell line. MDH2 encodes a Krebs cycle enzyme, mitochondrial malate dehydrogenase (MDH), which is important in the conversion of malate to oxaloacetate and to keep the proper functioning of the Krebs cycle. Disruption of the Krebs cycle is a hallmark of cancer. Recently, a whole-exome sequencing study on multiple malignant paragangliomas tumor tissue identified that MDH2 was associated with paraganglioma development and susceptibility.36 Previous studies also indicated that MDH2 was involved in prostate and uterine cancer chemotherapy resistance.37,38 There was a marked upregulation of MDH2 expression in prostate tumor tissue, and knockdown of MDH2 in prostate cancer cell lines significantly inhibited cell proliferation and increased the sensitivity of docetaxel.37 A study by Liu et al37 also observed that overexpression of MDH2 significantly increased the risk of prostate cancer recurrence after receiving neoadjuvant chemotherapy. Similarly, our data also observed that high expression of MDH2 significantly increased the risk of death in AML patients.
The protein encoded by SLC2A5 is a transporter of fructose uptake in the small intestine and is a key gene in the fatty acid synthase pathway. Research by Medina et al39 has investigated the role of SLC2A5 in renal cell carcinomas (RCC) and observed that the expression of SLC2A5 was significantly higher in tumor tissue and correlated with an advanced stage. Their findings suggest that either increased usage of fructose or the presence of high SLC2A5 expression may lead to malignant RCC progression.39 Different from in RCC, expression of SLC2A5 can be detected by immunocytochemistry in benign prostate tissue and high-grade intraepithelial neoplasia but not in prostate cancer tissue. In addition, the intensity of SLC2A5 immunostaining was negatively correlated with the malignant transformation of prostate cancer.40
SUCLG1 encodes the alpha subunit of the heterodimeric enzyme succinate coenzyme A ligase, and its mutation is associated with methylmalonic aciduria, as well as leading to the poor survival of these patients.41–43 The prognostic value of SUCLG1 in cancer or leukemia has not been reported in previous studies.
There were some limitations to our study that need to be recognized. The major limitation involves the lack of available information regarding chemotherapy and other prognostic factors of AML, so, the prognostic genes of AML were based on an univariate survival analysis instead of the multivariate analysis. Such information is required to further study the interaction between this mRNA signature and other AML prognosis risk factors. Second, the information of complete remission and relapse-free survival time was not available in the public database, so, we only analysed the association between gene expression level and AML OS. Third, due to the small sample size of GSE12417 HG-U133 plus 2.0 cohort, many genes that were significant in the TCGA-LAML and GSE12417 HG-U133A cohort did not reach statistical significance in the GSE12417 HG-U133 plus 2.0 cohort, which may have resulted in filtering out some potential prognostic genes.
Despite these limitations, our findings provide insight into these genes in AML clinical outcomes and may have clinical utility for prognosis prediction and target treatment strategies.
Conclusion
By analyzing the genome-wide mRNA expression profiles in a large cohort from GSE12417 and TCGA-LAML, we succeeded in identifying and validating an 11-gene signature for prognosis prediction in patients with AML, which may serve as a potential prognostic biomarker. This prognostic model demonstrated a good performance in predicting 1-, 3-, and 5-year survivals. Due to the limitations in the current study, our findings require further confirmation with independent larger cohorts in future studies.
Acknowledgments
This work was supported in part by the National Natural Science Foundation of China (No. 81160075), Natural Science Foundation of Guangxi (No. 0728124), and Self-raised Scientific Research Fund of the Ministry of Health of Guangxi Province (Z2014035). The authors thank the contributors of The Cancer Genome Atlas and GSE12417 for their contribution to share their dataset on open access. In addition, we would like to acknowledge the helpful comments on this article received from our reviewers.
Disclosure
The authors report no conflicts of interest in this work.
References
Meyer SC, Levine RL. Translational implications of somatic genomics in acute myeloid leukaemia. Lancet Oncol. 2014;15(9):e382–e394. | ||
Estey E, Dohner H. Acute myeloid leukaemia. Lancet. 2006;368(9550):1894–1907. | ||
Papaemmanuil E, Gerstung M, Bullinger L, et al. Genomic classification and prognosis in acute myeloid leukemia. N Engl J Med. 2016;374(23):2209–2221. | ||
Dohner H, Weisdorf DJ, Bloomfield CD. Acute myeloid leukemia. N Engl J Med. 2015;373(12):1136–1152. | ||
Ferrara F, Schiffer CA. Acute myeloid leukaemia in adults. Lancet. 2013;381(9865):484–495. | ||
Bullinger L, Valk PJ. Gene expression profiling in acute myeloid leukemia. J Clin Oncol. 2005;23(26):6296–6305. | ||
Metzeler KH, Hummel M, Bloomfield CD, et al. An 86-probe-set gene-expression signature predicts survival in cytogenetically normal acute myeloid leukemia. Blood. 2008;112(10):4193–4201. | ||
Cancer Genome Atlas Research Network, Ley TJ, Miller C, et al. Genomic and epigenomic landscapes of adult de novo acute myeloid leukemia. N Engl J Med. 2013;368(22):2059–2074. | ||
Anders S, Huber W. Differential expression analysis for sequence count data. Genome Biol. 2010;11(10):R106. | ||
Ritchie ME, Phipson B, Wu D, et al. Limma powers differential expression analyses for RNA-sequencing and microarray studies. Nucleic Acids Res. 2015;43(7):e47. | ||
Zhou M, Zhao H, Wang Z, et al. Identification and validation of potential prognostic lncRNA biomarkers for predicting survival in patients with multiple myeloma. J Exp Clin Cancer Res. 2015;34:102. | ||
Zhou X, Huang Z, Xu L, et al. A panel of 13-miRNA signature as a potential biomarker for predicting survival in pancreatic cancer. Oncotarget. 2016;7(43):69616–69624. | ||
Heagerty PJ, Zheng Y. Survival model predictive accuracy and ROC curves. Biometrics. 2005;61(1):92–105. | ||
Xu JM, Weng MZ, Song FB, et al. Blockade of the CXCR6 signaling inhibits growth and invasion of hepatocellular carcinoma cells through inhibition of the VEGF expression. Int J Immunopathol Pharmacol. 2014;27(4):553–561. | ||
Sun JJ, Chen GY, Xie ZT. MicroRNA-361-5p inhibits cancer cell growth by targeting CXCR6 in hepatocellular carcinoma. Cell Physiol Biochem. 2016;38(2):777–785. | ||
Takiguchi G, Nishita M, Kurita K, Kakeji Y, Minami Y. Wnt5a-Ror2 signaling in mesenchymal stem cells promotes proliferation of gastric cancer cells by activating CXCL16-CXCR6 axis. Cancer Sci. 2016;107(3):290–297. | ||
Wang J, Lu Y, Wang J, Koch AE, Zhang J, Taichman RS. CXCR6 induces prostate cancer progression by the AKT/mammalian target of rapamycin signaling pathway. Cancer Res. 2008;68(24):10367–10376. | ||
Ha HK, Lee W, Park HJ, Lee SD, Lee JZ, Chung MK. Clinical significance of CXCL16/CXCR6 expression in patients with prostate cancer. Mol Med Rep. 2011;4(3):419–424. | ||
Richardsen E, Ness N, Melbo-Jorgensen C, et al. The prognostic significance of CXCL16 and its receptor C-X-C chemokine receptor 6 in prostate cancer. Am J Pathol. 2015;185(10):2722–2730. | ||
Li Y, Fu LX, Zhu WL, Shi H, Chen LJ, Ye B. Blockade of CXCR6 reduces invasive potential of gastric cancer cells through inhibition of AKT signaling. Int J Immunopathol Pharmacol. 2015;28(2):194–200. | ||
Guo L, Cui ZM, Zhang J, Huang Y. Chemokine axes CXCL12/CXCR4 and CXCL16/CXCR6 correlate with lymph node metastasis in epithelial ovarian carcinoma. Chin J Cancer. 2011;30(5):336–343. | ||
Mir H, Singh R, Kloecker GH, Lillard JW Jr, Singh S. CXCR6 expression in non-small cell lung carcinoma supports metastatic process via modulating metalloproteinases. Oncotarget. 2015;6(12):9985–9998. | ||
Na KY, Kim HS, Jung WW, et al. CXCL16 and CXCR6 in Ewing sarcoma family tumor. Hum Pathol. 2014;45(4):753–760. | ||
Hayette S, Cornillet-Lefebvre P, Tigaud I, et al. AF4p12, a human homologue to the furry gene of Drosophila, as a novel MLL fusion partner. Cancer Res. 2005;65(15):6521–6525. | ||
Robinson BW, Cheung NK, Kolaris CP, et al. Prospective tracing of MLL-FRYL clone with low MEIS1 expression from emergence during neuroblastoma treatment to diagnosis of myelodysplastic syndrome. Blood. 2008;111(7):3802–3812. | ||
Sait SN, Claydon MA, Conroy JM, Nowak NJ, Barcos M, Baer MR. Translocation (4;11)(p12;q23) with rearrangement of FRYL and MLL in therapy-related acute myeloid leukemia. Cancer Genet Cytogenet. 2007;177(2):143–146. | ||
Furthmayr H. Glycophorins A, B, and C: a family of sialoglycoproteins. Isolation and preliminary characterization of trypsin derived peptides. J Supramol Struct. 1978;9(1):79–95. | ||
Young RP, Whittington CF, Hopkins RJ, et al. Chromosome 4q31 locus in COPD is also associated with lung cancer. Eur Respir J. 2010;36(6):1375–1382. | ||
Kutlar F, Ameri A, Patel NH, et al. Two new gamma chain variants: Hb F-Augusta GA [(G)gamma59(E3)Lys--> Arg; HBG2: c.179A > G] and Hb F-Port Royal-II [(A)gamma125(H3)Glu--> Ala; HBG1: c.377A > C]. Hemoglobin. 2014;38(5):376–380. | ||
Shooter C, Rooks H, Thein SL, Clark B. Next generation sequencing identifies a novel rearrangement in the HBB cluster permitting to-the-base characterization. Hum Mutat. 2015;36(1):142–150. | ||
Kurima K, Yang Y, Sorber K, Griffith AJ. Characterization of the transmembrane channel-like (TMC) gene family: functional clues from hearing loss and epidermodysplasia verruciformis. Genomics. 2003;82(3):300–308. | ||
Zhao J, Li X, Yao Q, et al. RWCFusion: identifying phenotype-specific cancer driver gene fusions based on fusion pair random walk scoring method. Oncotarget. 2016;7(38):61054–61068. | ||
Batsukh T, Schulz Y, Wolf S, et al. Identification and characterization of FAM124B as a novel component of a CHD7 and CHD8 containing complex. PLoS One. 2012;7(12):e52640. | ||
Zhao XF, Colaizzo-Anas T, Nowak NJ, Shows TB, Elliott RW, Aplan PD. The mammalian homologue of mago nashi encodes a serum-inducible protein. Genomics. 1998;47(2):319–322. | ||
Zhao XF, Nowak NJ, Shows TB, Aplan PD. MAGOH interacts with a novel RNA-binding protein. Genomics. 2000;63(1):145–148. | ||
Cascon A, Comino-Mendez I, Curras-Freixes M, et al. Whole-exome sequencing identifies MDH2 as a new familial paraganglioma gene. J Natl Cancer Inst. 2015;107(5):djv053. | ||
Liu Q, Harvey CT, Geng H, et al. Malate dehydrogenase 2 confers docetaxel resistance via regulations of JNK signaling and oxidative metabolism. Prostate. 2013;73(10):1028–1037. | ||
Lo YW, Lin ST, Chang SJ, et al. Mitochondrial proteomics with siRNA knockdown to reveal ACAT1 and MDH2 in the development of doxorubicin-resistant uterine cancer. J Cell Mol Med. 2015;19(4):744–759. | ||
Medina Villaamil V, Aparicio Gallego G, Valbuena Rubira L, et al. Fructose transporter GLUT5 expression in clear renal cell carcinoma. Oncol Rep. 2011;25(2):315–323. | ||
Reinicke K, Sotomayor P, Cisterna P, Delgado C, Nualart F, Godoy A. Cellular distribution of Glut-1 and Glut-5 in benign and malignant human prostate tissue. J Cell Biochem. 2012;113(2):553–562. | ||
Carrozzo R, Verrigni D, Rasmussen M, et al. Succinate-CoA ligase deficiency due to mutations in SUCLA2 and SUCLG1: phenotype and genotype correlations in 71 patients. J Inherit Metab Dis. 2016;39(2):243–252. | ||
Liu Y, Li X, Wang Q, Ding Y, Song J, Yang Y. Five novel SUCLG1 mutations in three Chinese patients with succinate-CoA ligase deficiency noticed by mild methylmalonic aciduria. Brain Dev. 2016;38(1):61–67. | ||
Ostergaard E, Schwartz M, Batbayli M, et al. A novel missense mutation in SUCLG1 associated with mitochondrial DNA depletion, encephalomyopathic form, with methylmalonic aciduria. Eur J Pediatr. 2010;169(2):201–205. |
 © 2017 The Author(s). This work is published and licensed by Dove Medical Press Limited. The full terms of this license are available at https://www.dovepress.com/terms.php and incorporate the Creative Commons Attribution - Non Commercial (unported, v3.0) License.
By accessing the work you hereby accept the Terms. Non-commercial uses of the work are permitted without any further permission from Dove Medical Press Limited, provided the work is properly attributed. For permission for commercial use of this work, please see paragraphs 4.2 and 5 of our Terms.
© 2017 The Author(s). This work is published and licensed by Dove Medical Press Limited. The full terms of this license are available at https://www.dovepress.com/terms.php and incorporate the Creative Commons Attribution - Non Commercial (unported, v3.0) License.
By accessing the work you hereby accept the Terms. Non-commercial uses of the work are permitted without any further permission from Dove Medical Press Limited, provided the work is properly attributed. For permission for commercial use of this work, please see paragraphs 4.2 and 5 of our Terms.