")
Back to Journals » International Journal of General Medicine » Volume 15
Identification and Validation of Novel Diagnostic Biomarkers for Keloid Based on GEO Database
Authors Nurzati Y , Zhu Z, Xu H, Zhang Y
Received 30 September 2021
Accepted for publication 15 December 2021
Published 26 January 2022 Volume 2022:15 Pages 897—912
DOI https://doi.org/10.2147/IJGM.S337951
Checked for plagiarism Yes
Review by Single anonymous peer review
Peer reviewer comments 2
Editor who approved publication: Dr Scott Fraser
Yeletai Nurzati, Zhu Zhu, Heng Xu, Yixin Zhang
Department of Plastic and Reconstructive Surgery, Shanghai Ninth People’s Hospital, Shanghai JiaoTong University School of Medicine, Shanghai, 201100, People’s Republic of China
Correspondence: Heng Xu; Yixin Zhang Email [email protected]; [email protected]
Introduction: Keloid is a pathological scar type, which invades normal surrounding tissue without self-limiting to cause pain, itching, cosmetic disfigurement, etc. Knowledge of the molecular mechanisms underlying keloid remains unclear. This dilemma leads to no biomarker available for diagnosis. Thus, to seek accurate diagnosis, biomarkers are necessary for keloid diagnosis to help control its incidence.
Methods: Gene Expression Omnibus (GEO) database was used to select differentially expressed miRNAs (DE-miRNAs) in GSE113620. miRTarBase miRNA–target tools were used to predict the interactions between miRNAs and their target mRNAs. Target mRNAs that were differentially expressed in keloid were selected by analyzing differentially expressed genes (DEGs) in GSE44270 and GSE92566. PPI network analysis, gene enrichment analysis, cell-specific and tissue-specific expression analyses of DE-target mRNAs were conducted. RT-PCR analysis was conducted to validate our results.
Results: Three novel miRNAs (miR-30b-5p, miR-212-3p, miR-149-5p) and five target mRNAs (SIX1, CCNA2, CCNB1, FOXM1, RUNX2) were identified as potential biomarkers for keloid patients. Additionally, the potential functions of those miRNAs-mRNAs pathways were analyzed.
Discussion: These findings of keloid-related miRNAs, mRNAs, and miRNA–mRNAs regulatory networks may provide insights into the underlying pathogenesis of keloid and serve as potential biomarkers for keloid diagnosis.
Keywords: diagnostic biomarkers, miRNA–mRNA network, keloids, differentially expressed genes
Introduction
Keloid is excessive fibrosis of the skin that extends beyond the area of injury and does not regress.1 Keloid can occur in the joints and mouth after several years of severe injury, including burns, chemical injury, wound, and surgical incision.2 Keloids on the joints affect the quality of life, physical, mental, and social health.3 Knowledge of the molecular mechanisms underlying keloid remains unclear. This dilemma leads to no biomarker available for diagnosis, and, therefore, result in the diagnosis of keloid in clinical practice is highly dependent on the experience of the clinician. Thus, to seek an effective biomarker may offer an alternative to the current clinical pain point.
MicroRNAs (miRNAs) are evolutionarily conserved short (20–23 nucleotides) noncoding RNAs with no protein-coding potential but can negatively or positively regulate genes.4 Previous studies have shown that miRNAs can inhibit gene expression by binding to the 3‘-untranslated regions (UTR) of target mRNAs, thus inhibiting mRNA translation or promoting mRNA degradation.5,6 Several studies have revealed that miRNAs are involved in various biological pathways, such as cell proliferation, apoptosis, cell cycle, differentiation, metabolism, and abnormal expression of miRNAs, which may impair a variety of cell functions, leading to cancer and other diseases.7 Several studies have shown that miRNAs are biomarkers for keloid.8 Therefore, it is important to reveal the biological function of miRNAs in keloids to analyze the mechanism of fibroblasts in keloids effectively. This study aimed to investigate several potential biomarkers for distinguishing keloid patients from non-keloid patients.
Gene Expression Omnibus (GEO) database was used to identify DE-miRNAs and their target mRNAs differentially expressed in keloid and control groups. A DE-miRNA and differentially expressed target mRNAs (DE-target mRNAs) network was then constructed after a comprehensive analysis. Further, protein–protein interaction (PPI) network analyses, functional enrichment analysis, tissue-specific and cell-specific gene expression analysis were performed. Validation analysis was conducted using RT-PCR experiment. Three potential miRNAs and five target mRNAs were identified as significant predictors of keloid. This study may provide novel diagnostic biomarkers for keloid.
Materials and Methods
Data Source and Identification of DE-miRNAs/DE-mRNAs
MicroRNA expression profile data of GSE113620 were obtained from Gene Expression Omnibus (GEO; http://www.ncbi.nlm.nih.gov/geo/) database, which is based on GPL19117 [miRNA-4] Affymetrix Multispecies miRNA-4 Array. RNA-seq detection and miRNA expression data were analyzed in serial skin biopsies from the same site (baseline and 6 weeks post-injury) of keloid-prone (n=8) and healthy matched control individuals (n=6). Differential expression analysis was conducted in four comparison groups: 1) Keloid-prone subjects vs healthy subjects in baseline, 2) Keloid-prone subjects vs healthy subjects 6 weeks after wounding, 3) Keloid-prone subjects in baseline vs keloid-prone subjects 6 weeks after wounding, and 4) Healthy subjects in baseline vs healthy subjects 6 weeks after wounding. The mRNA expression profile data of GSE44270 and GSE92566 were obtained from the GEO database (which are based on GPL6244 and GPL570, respectively) to identify common mRNAs between the target mRNA of DE-miRNA and DEGs in GSE44270 and GSE92566. For GSE44270 analysis, keloid scars were excised from patients undergoing scar excision surgery. Normal skin samples were isolated from patients undergoing elective plastic surgery. This study had six experimental groups, including nine cases of keloid fibroblast (KF), nine cases of keloid keratinocyte (KK), four cases of keloid non-lesional fibroblast (NKF), four cases of keloid non-lesional keratinocyte (NKK), three cases of normal fibroblast (CF) and three cases of normal keratinocyte (CK). For GSE92566 analysis, transcriptional profiling was conducted using Affymetrix HGU133 2.0 plus arrays for three groups, including large chronic keloids (n=3), adjacent non-lesional keloid samples (n=3), and a newly formed keloid lesion. The Affymetrix CEL files and the probe annotation files were obtained from the GEO database. Meanwhile, all the samples were preprocessed with background correction. The Bioconductor package (http://www.bioconductor.org/packages/2.8/bioc/html/affy.html) (R studio Version 1.1.383) was used to select DE-miRNAs. The |log2FC (fold change) |>1 and FDR <0.05 were used as the cut-off criteria for selecting DE-miRNAs. “ggplot” package was used for data visualization.
Identification of Target mRNA of DE-miRNAs
Identifying target mRNAs of miRNAs is a necessary step for analyzing the regulatory mechanism and function of miRNAs. Herein, miTarbase was used to identify the target mRNAs of 61 DE-miRNAs. The DE-miRNAs, with more than five target genes (support type: functional MTI), were selected. Cytoscape software was then used to visualize the regulatory networks of the miRNA–mRNA pairs.9 The common mRNAs between the target mRNAs and the DEGs in GSE44270 and GSE92566 were then identified. An online Venn tool (http://jvenn.toulouse.inra.fr/app/index.html) was used for Venn diagram analysis.10
Protein–Protein Interaction (PPI) Network Analysis
A String database (https://string-db.org/) (a database of known and predicted protein–protein interactions) was used to construct a PPI network to analyze the interactions between target mRNA and peripheral genes. The nodes and lines in the network diagram represent target genes and their interactions, respectively, and the color of the lines represents the strength of the interaction.
Gene Ontology (GO) Annotation and Kyoto Encyclopedia of Genes and Genomes (KEGG) Pathway Enrichment Analyses of the DEGs
The Database for Annotation, Visualization, and Integrated Discovery (DAVID) was used for GO annotation and KEGG pathway enrichment analyses of the selected mRNA cluster. GO annotation analysis included biological processes (BPs), cellular components (CCs), molecular functions (MFs). R studio “ggplot” package was used for data visualization.
Tissue-Specific Gene Expression Analysis
An online resource BioGPS (http://biogps.org, was used to analyze the tissue-specific expression of the target mRNAs. Herein, a gene was defined as highly tissue-specific if the level of tissue-specific expression was 10 times that of the median. The top three tissues with the highest expression levels were recorded if a gene was expressed more than 10 times in multiple tissues.
Bgee is a database that compares gene expression patterns across a wide range of animal species, generated by integrating multiple data types (RNA-SEq, Affymetrix, in situ hybridization, and EST data). It is based entirely on selected healthy wild-type expression data (eg, no knockout, no treatment, no disease) to provide a comparable reference for normal gene expression. Thus, Bgee can detect the expression conditions of any single gene, adapted to any data type and species. Bgee version 14.1 includes 29 animals and is available at https://bgee.org/ and the development pack BgeeDB.
Cell-Specific Gene Expression Analysis
HPA (http://www.proteinatlas.org/) is an online database that can be used to detect the expression of target genes in different cells, tissues and organs. The database is based on RNA sequencing (RNA-seq) analysis and immunohistochemical (IHC) data from previous studies.11 Herein, the HPA database was used to analyze the expression of target mRNAs of DE-miRNAs in multiple single cells of the skin. The single-cell RNA sequencing data in the HPA database were obtained from publicly available whole-genome expression data. The site contains all protein-coding genes in 12 cell-type groups and 192 cell-type clusters.11 It enables the user to study the expression of genes in different single-cell types and their expression in different single-cell types. The genes expressed in each cell type can be explored in interactive UMAP plots and bar charts, with links to corresponding immunohistochemical staining in human tissues.11
Sample Collection and Storage
Patients with keloids and healthy individuals were recruited from the Clinic of Department of Plastic and Reconstructive Surgery, Shanghai Ninth People’s Hospital. Keloids were diagnosed as previously described.12 Scar tissue from keloid patients and normal skin tissue from the inguinal area of healthy individuals were used for validation tests. Each collected sample was labeled and stored in liquid nitrogen until needed. The basic information of keloid patients and healthy donors is described in Table 1.
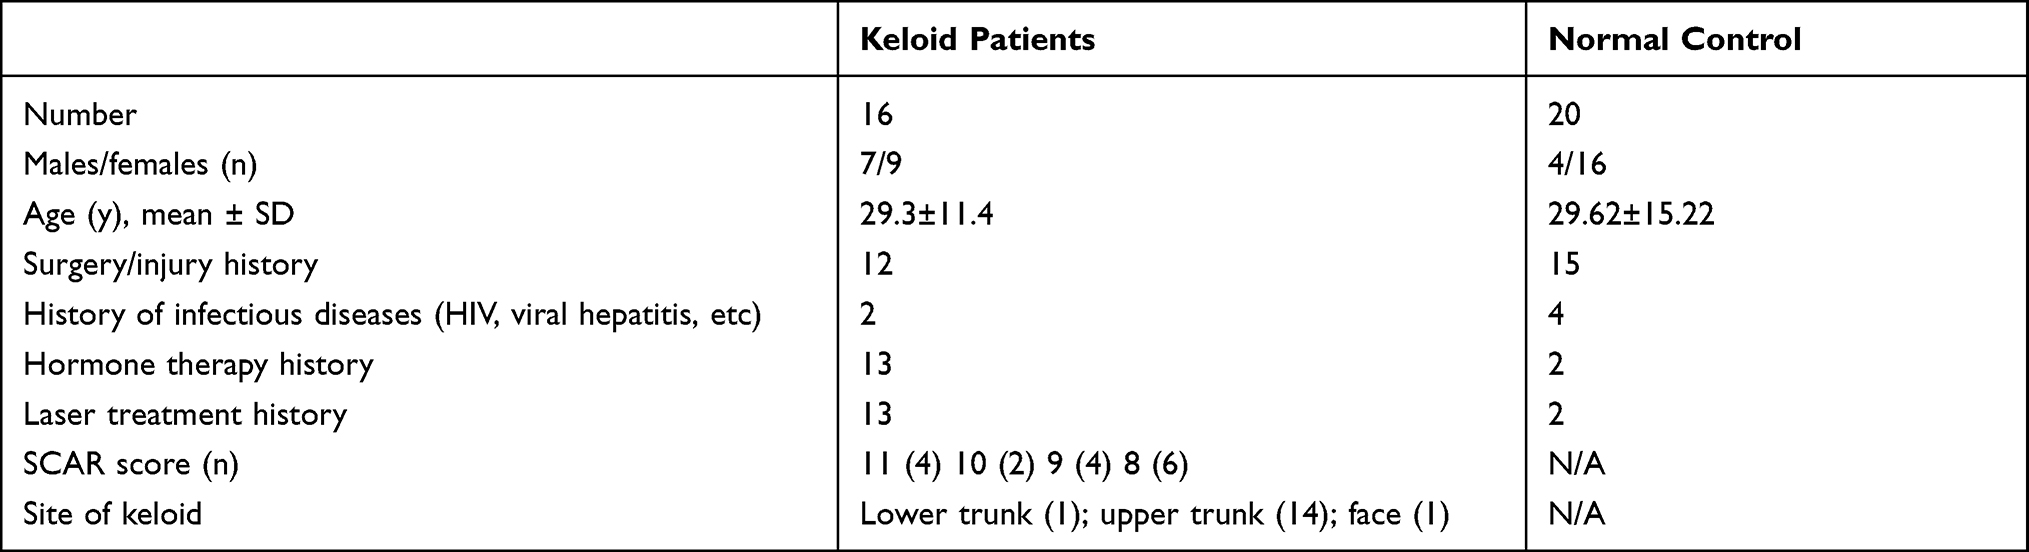 |
Table 1 General Information of Patients |
Total RNA Extraction and Quantitative RT-PCR
Total RNA was isolated from keloid sample and normal skin sample using TRIzol reagent (Invitrogen). Next, cDNA was synthesized using the PrimeScript RT reagent Kit (Takara Bio Company, Shiga, Japan). After reverse transcription of total RNA, quantitative RT-PCR was conducted to determine the expression of MAIT cells using SYBR Premix Ex Taq (TaKaRa, Dalian, China) on a Light Cycler 480 SYBR Green I Master (Roche Diagnostics, Basel, Switzerland). Glyceraldehyde 3-phosphate dehydrogenase (GAPDH) served as the control gene. The 2-ΔΔCt method was used to determine the gene expression levels. Primer sequences are shown in Table 2. All of the experiments were performed three times in triplicate.
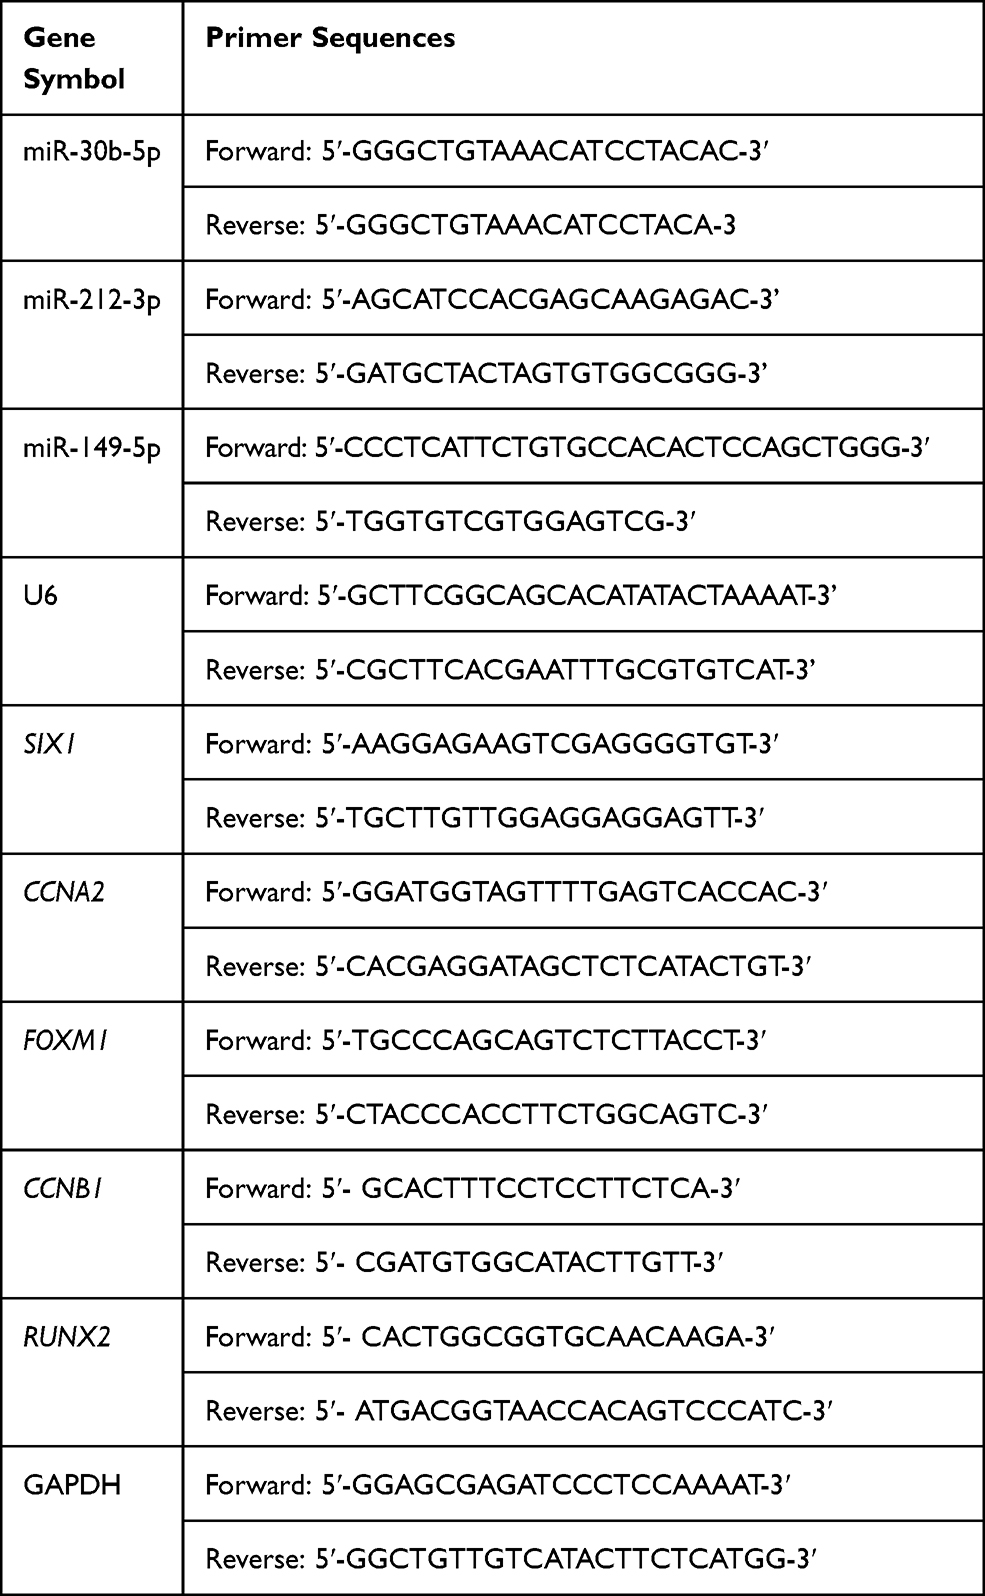 |
Table 2 Information of Primer Sequences Used for RT-PCR |
Statistical Analysis
All the data were analyzed using GRAPHPAD PRISM (version 6, GraphPad, La Jolla, CA, USA). Differences between groups were analyzed using Student’s t-test. The significance was defined at P < 0.001 (***), P < 0.01 (**), and P < 0.05 (*).
Results
Identification of DE-miRNAs
MicroRNA expression profile data of GSE113620 were obtained from the GEO database. A total of 164 DE-miRNAs (91 downregulated and 73 upregulated genes) were found in keloid-prone subjects in baseline vs keloid-prone subjects 42 days after wounding (Figure 1A). A total of 114 DE-miRNAs (38 upregulated and 76 downregulated genes) were found in healthy subjects in baseline vs healthy subjects 42 days after wounding (Figure 1B). Venn diagrams were developed to analyze common genes in different subsets, of which 69 genes were expressed differently only in the keloid-prone subjects in baseline vs keloid-prone subjects 42 days after wounding (Figure 1C). Those 69 DE-miRNAs were selected for subsequent analysis.
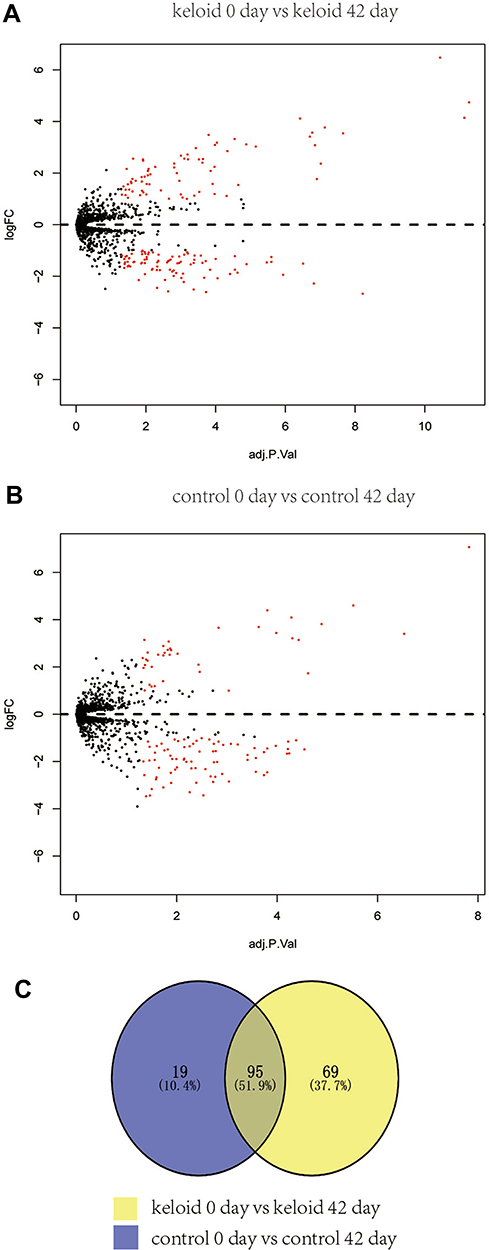 |
Figure 1 (A) Identification of DE-miRNAs. A total of 164 DE-miRNAs, including 91 downregulated and 73 upregulated genes, were found in keloid-prone subjects in baseline vs keloid-prone subjects 6 weeks after wounding. (B) However, 115 DE-miRNAs, including 38 upregulated and 76 downregulated genes, were found in healthy subjects in baseline vs healthy subjects 6 weeks after wounding. (C) Venn diagrams were developed to analyze common genes in different subsets, of which 69 genes were expressed differently only in the Keloid 0-Day vs Keloid 42-Day group. |
Identification of Target mRNAs of DE-miRNAs
The target genes of the above 69 genes were identified in Mirtarbase, the target gene prediction database for miRNAs. Six DE-miRNAs, with more than five target genes (support type: functional MTI), were used to build a network of DE-miRNAs-mRNAs interactions using Cytoscape (Figure 2A). The six DE-miRNAs and their target mRNAs are shown in Table 3 (159 genes are listed, eight target genes overlapped). The 151 target mRNAs were then compared with the DEGs in two microarrays (GSE44270 and GSE92566) to identify the target mRNAs related to keloid. There were six comparison groups in GSE44270 and one in GSE92566 (KK vs NLK, KF vs CF, KK vs CK, KF vs NLF, NLK vs CK, NLF vs CF in GSE44270, and Keloid vs Control in GSE92566). There were no common DEGs in the KF vs NLF group, which is not shown in the figure Finally, among the 151 target mRNAs of DE-miRNAs, we found seven mRNAs that were differentially expressed in keloid by analyzing DEGs in GSE44270 and GSE92566. LIF and SIX1 were identified in KF vs CF; CCNA2, CCNB1, and FOXM1 were identified in KK vs NLK; DPYSL2 was identified in KK vs CK; RUNX2 was identified in Keloid vs Control (GSE92566). The final results were expressed as a Venn diagram (Figure 2B). The PPIs were mapped using the logical data from the STRING database to further assess the correlation between the above seven genes (Figure 2C). The network consisted of seven nodes and five edges, and the average local clustering coefficient was 0.524. The PPI network showed that SIX1, CCNA2, CCNB1, FOXM1, and RUNX2 formed a gene cluster regulated by three DE-miRNAs (Figure 2D). Those five genes were used as DE-target mRNAs in the subsequent analysis.
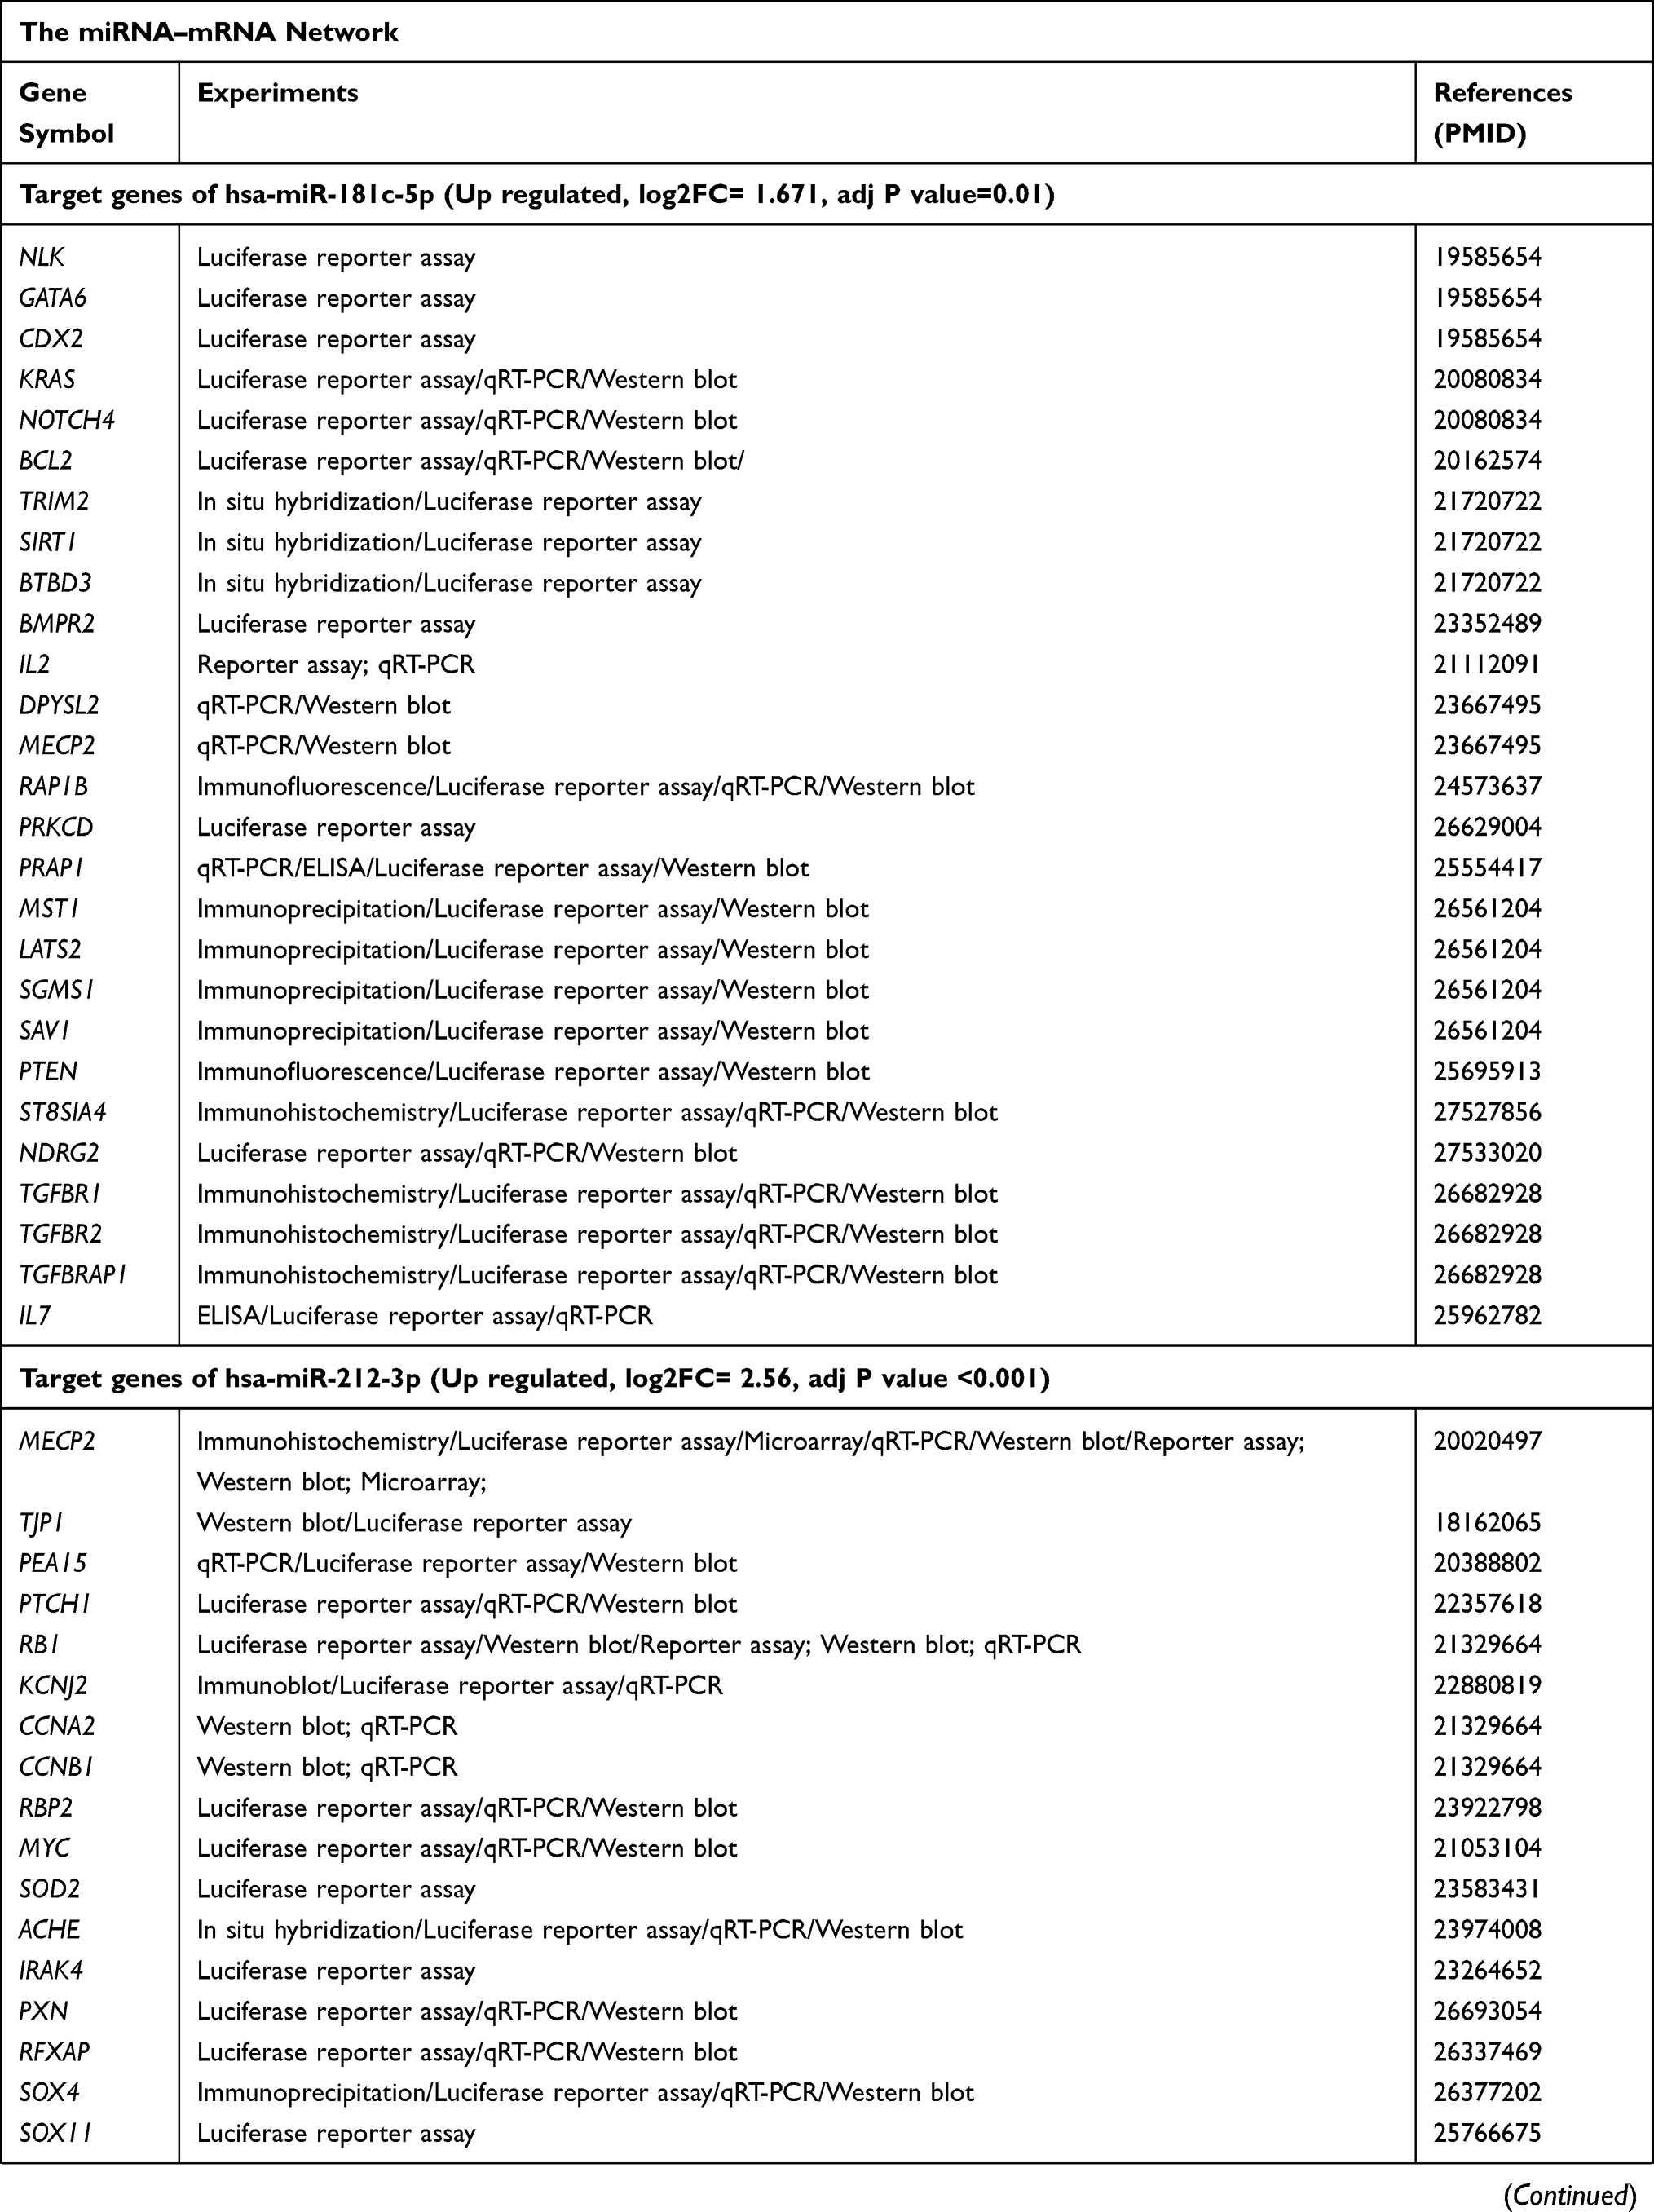 | 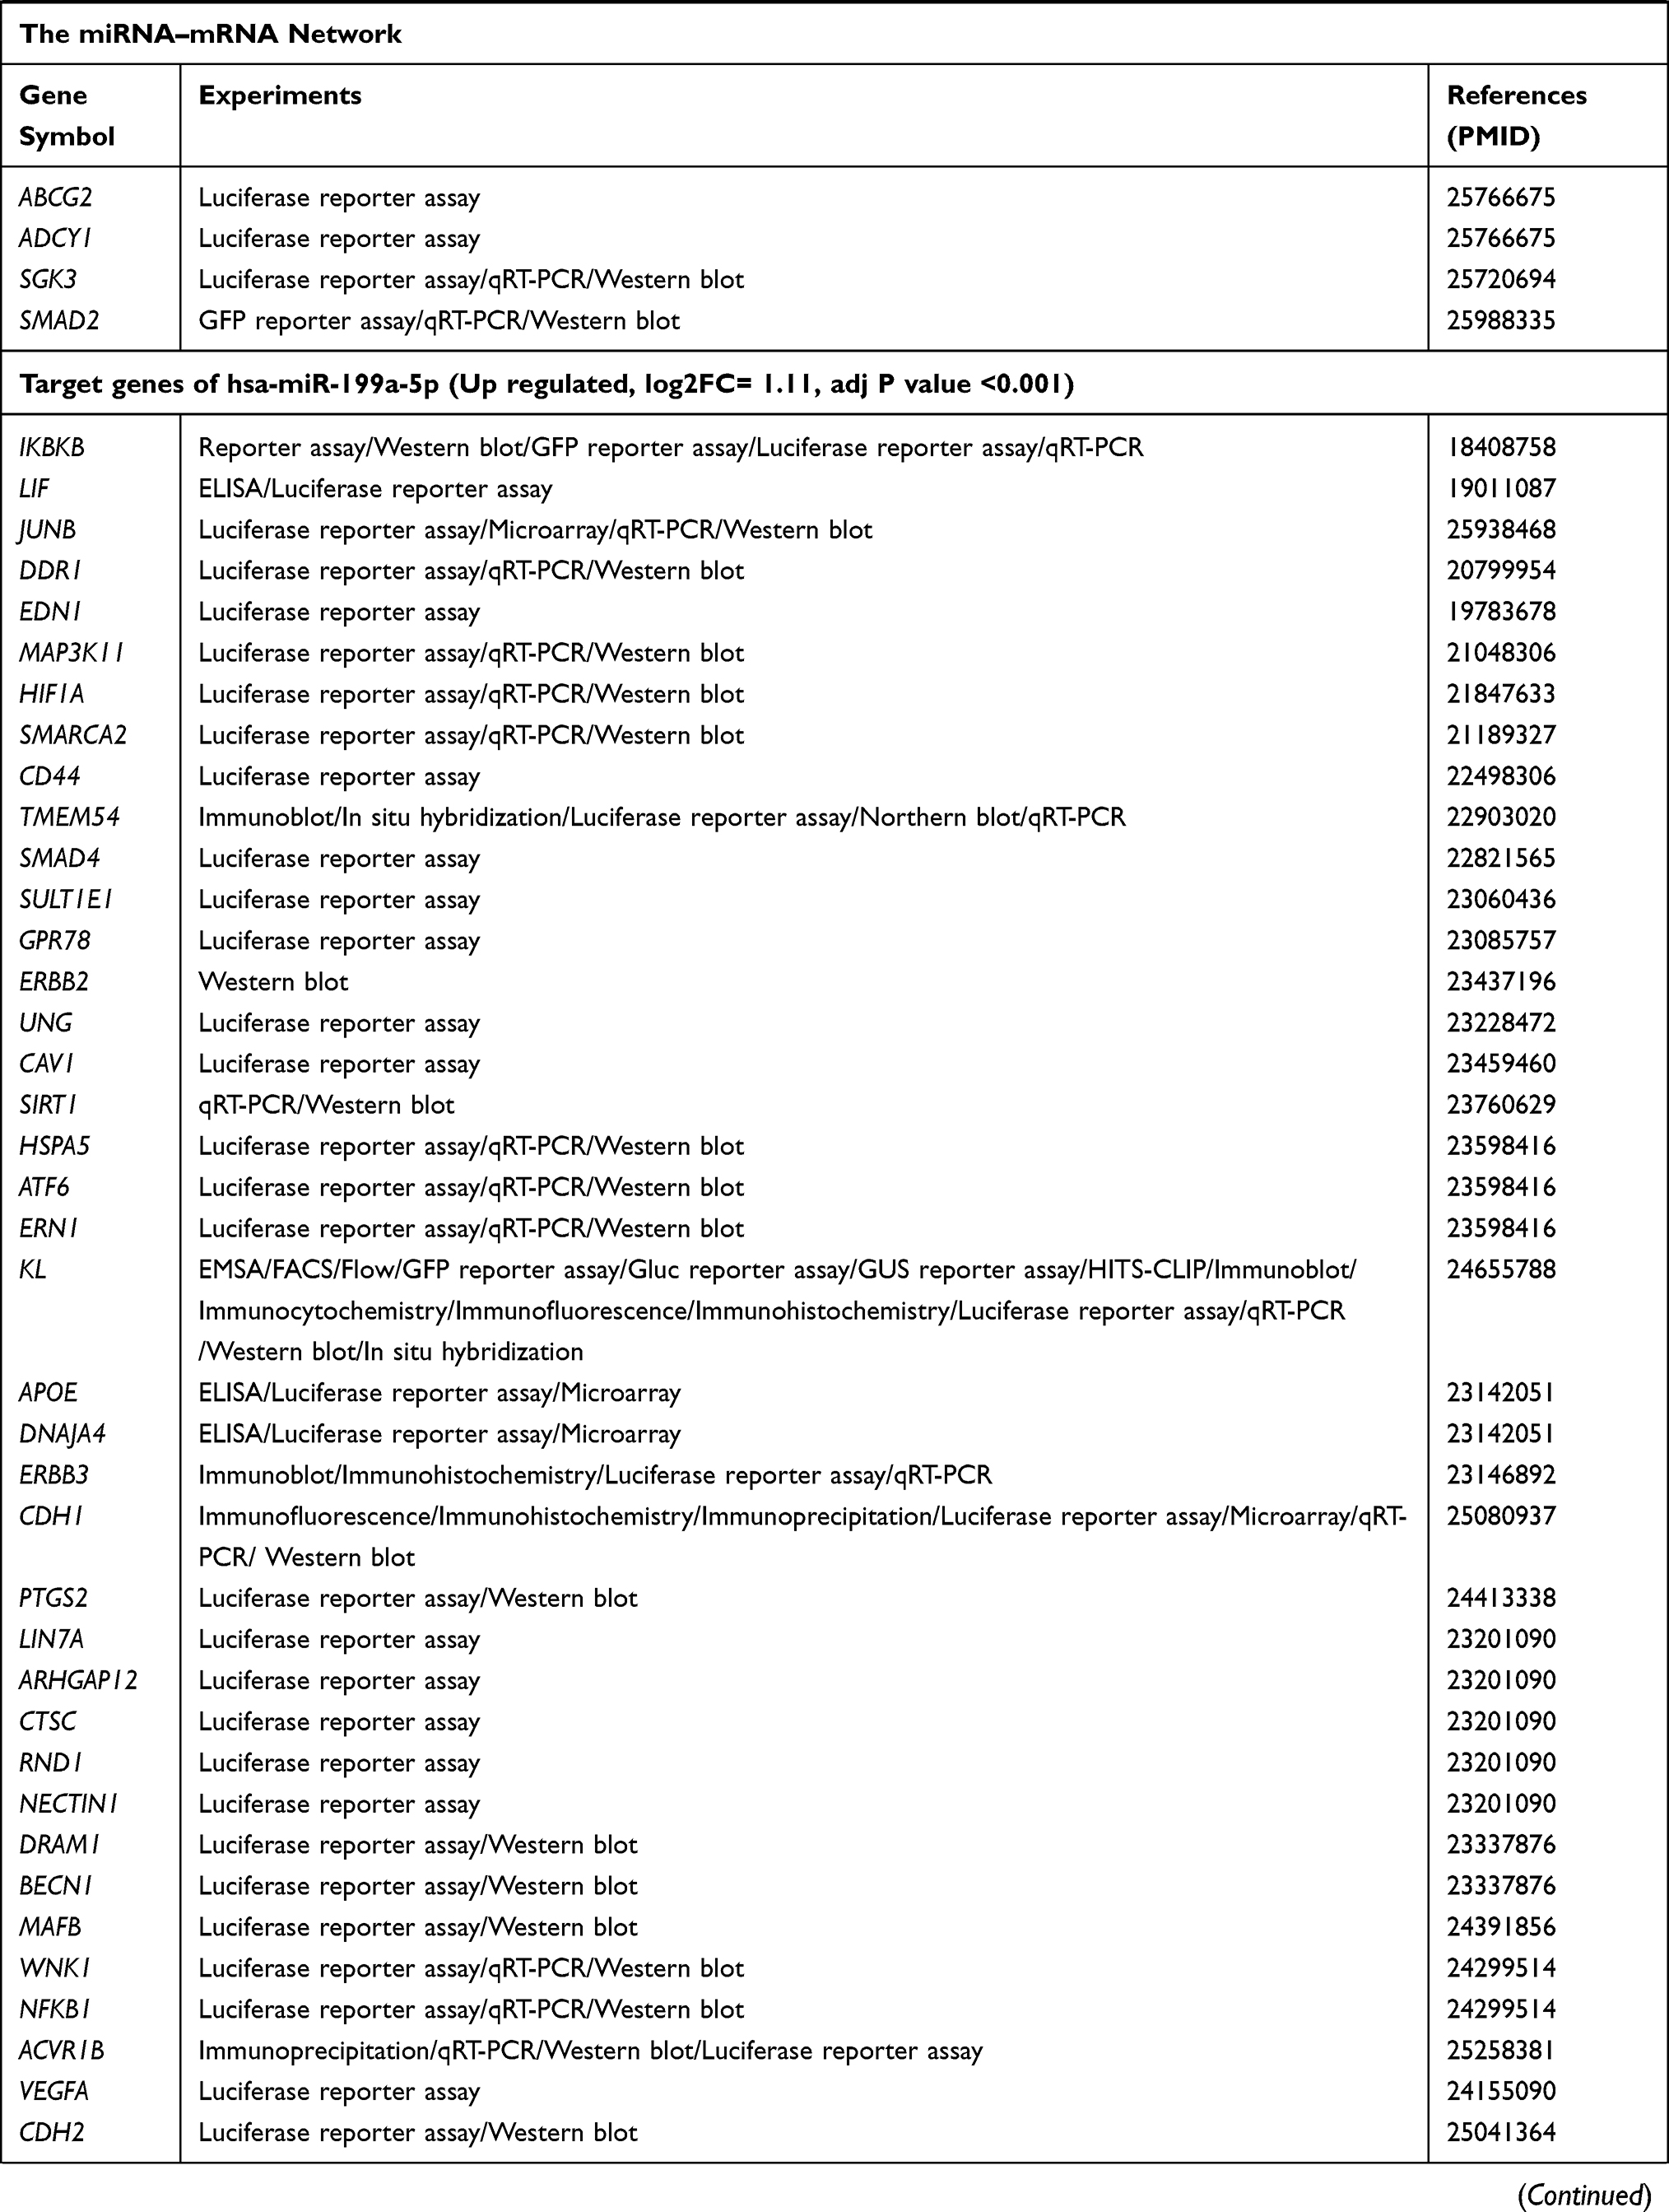 | 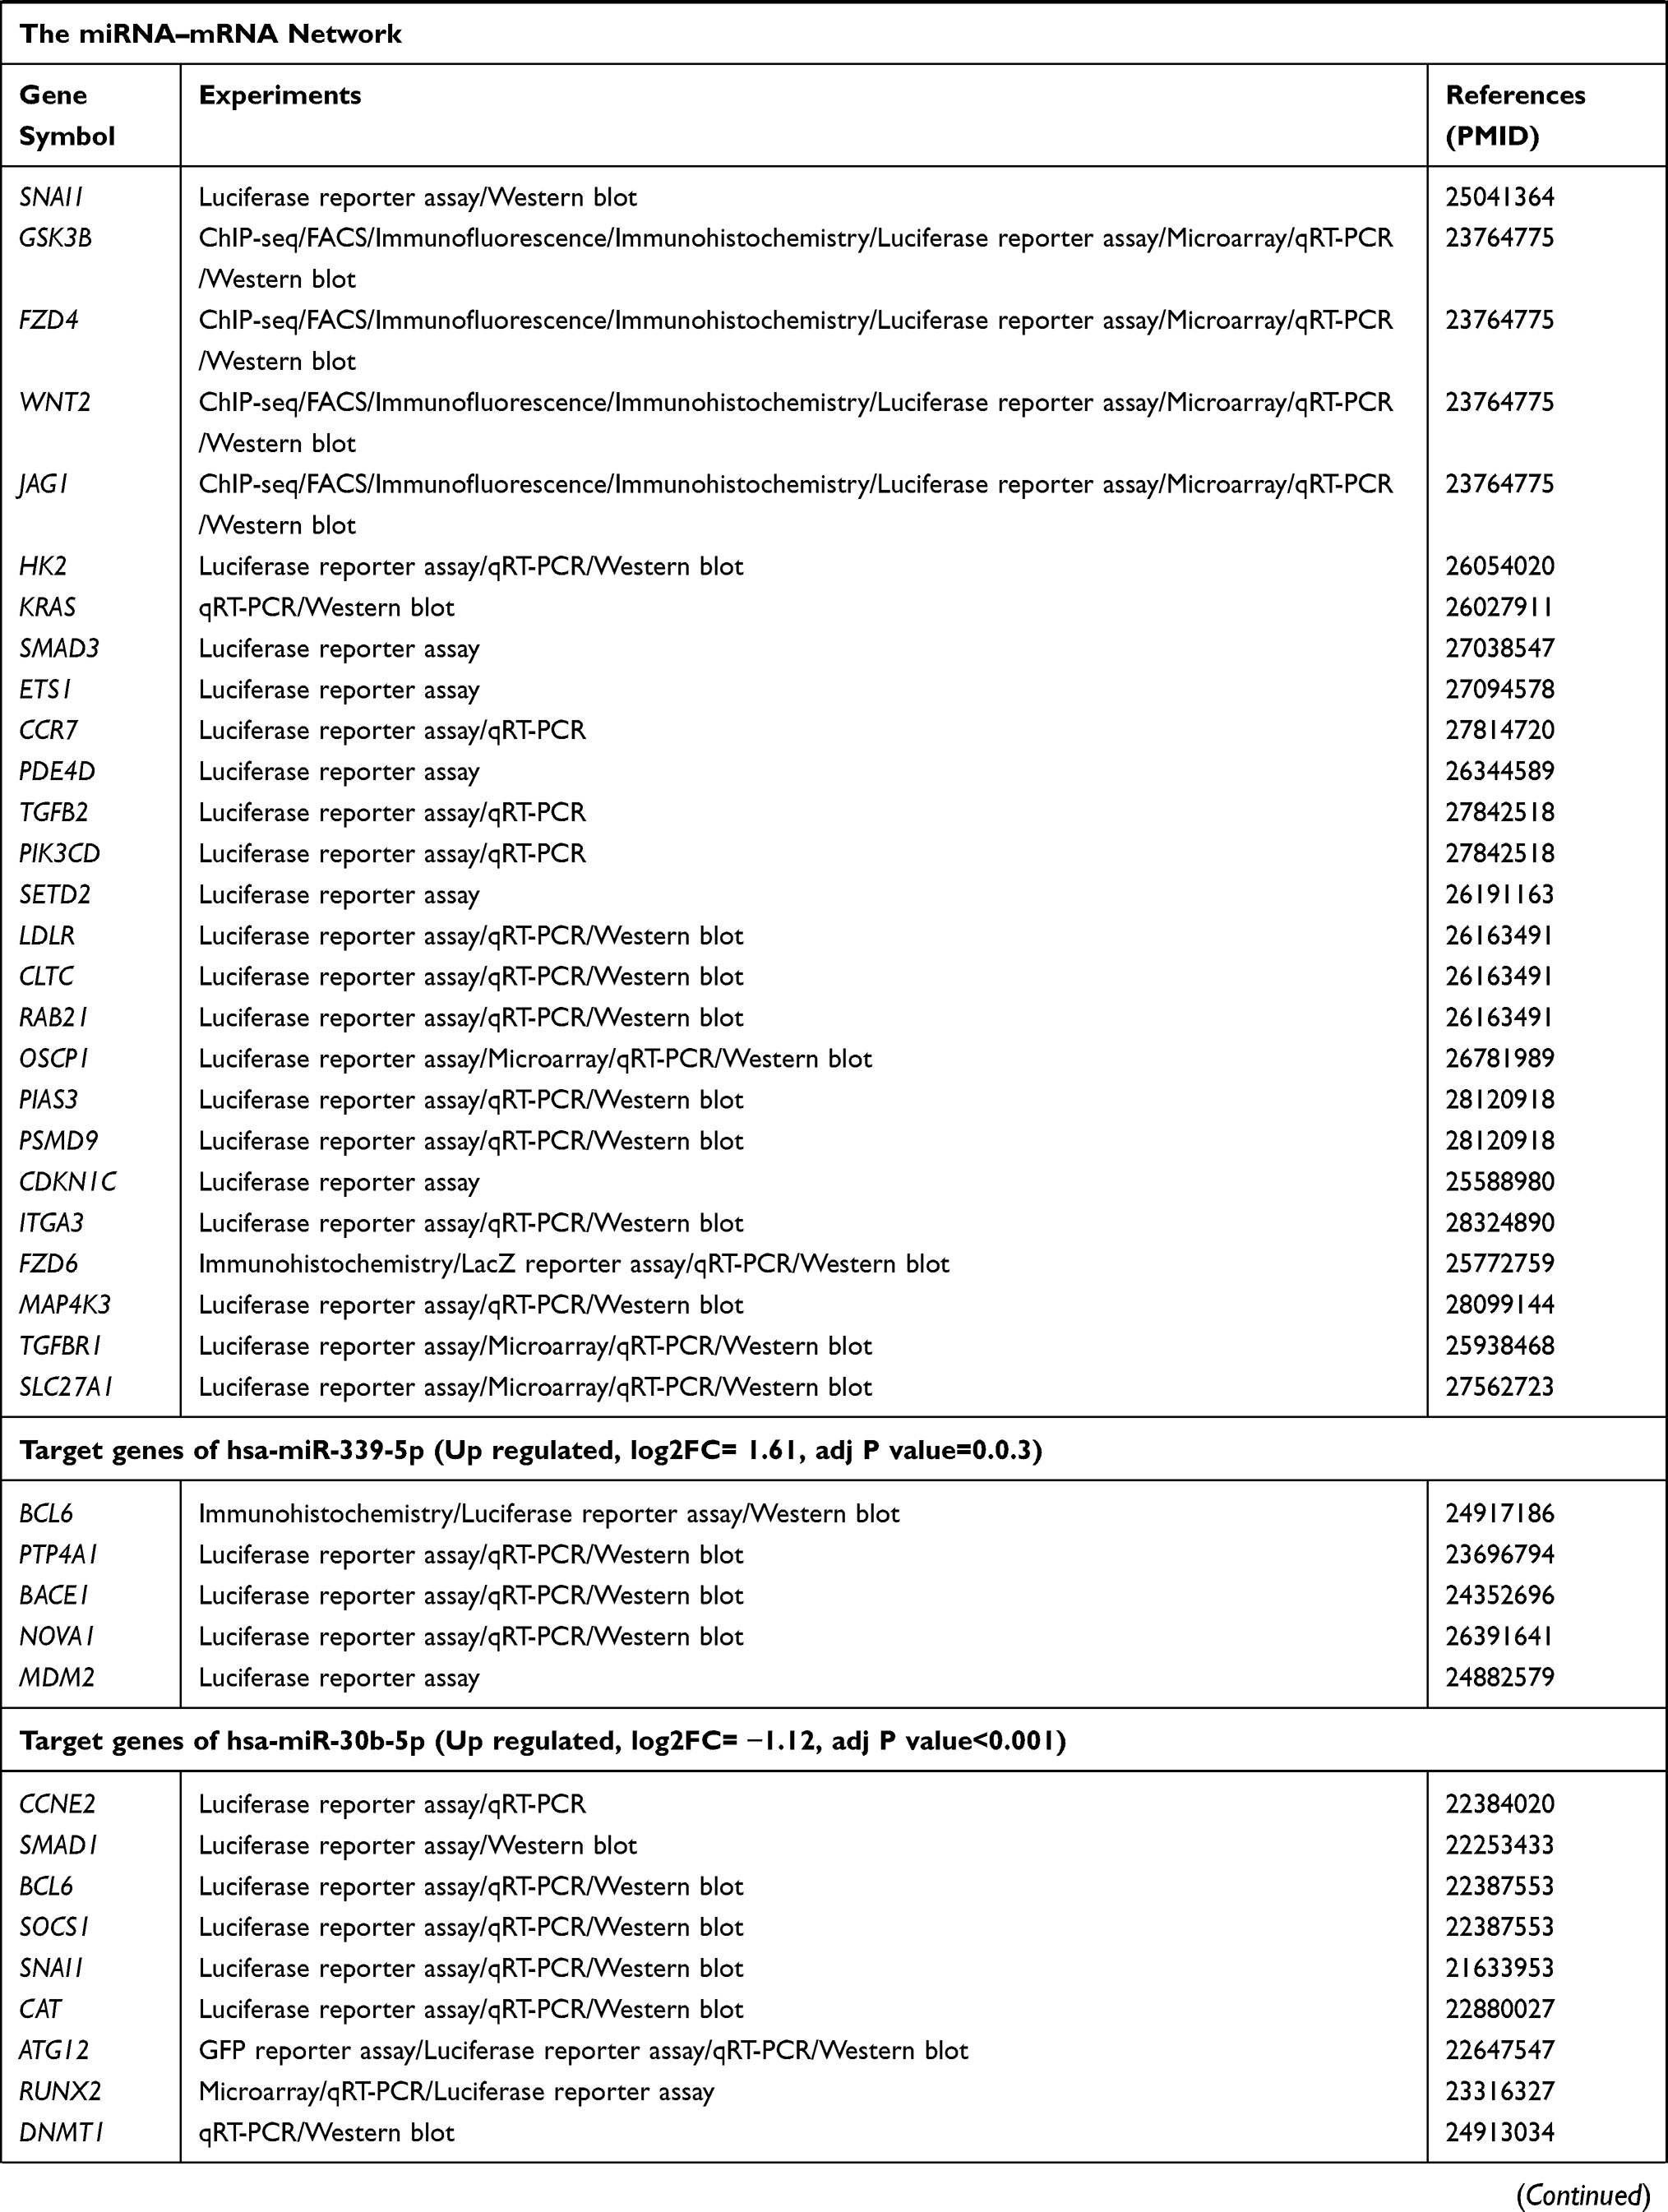 | 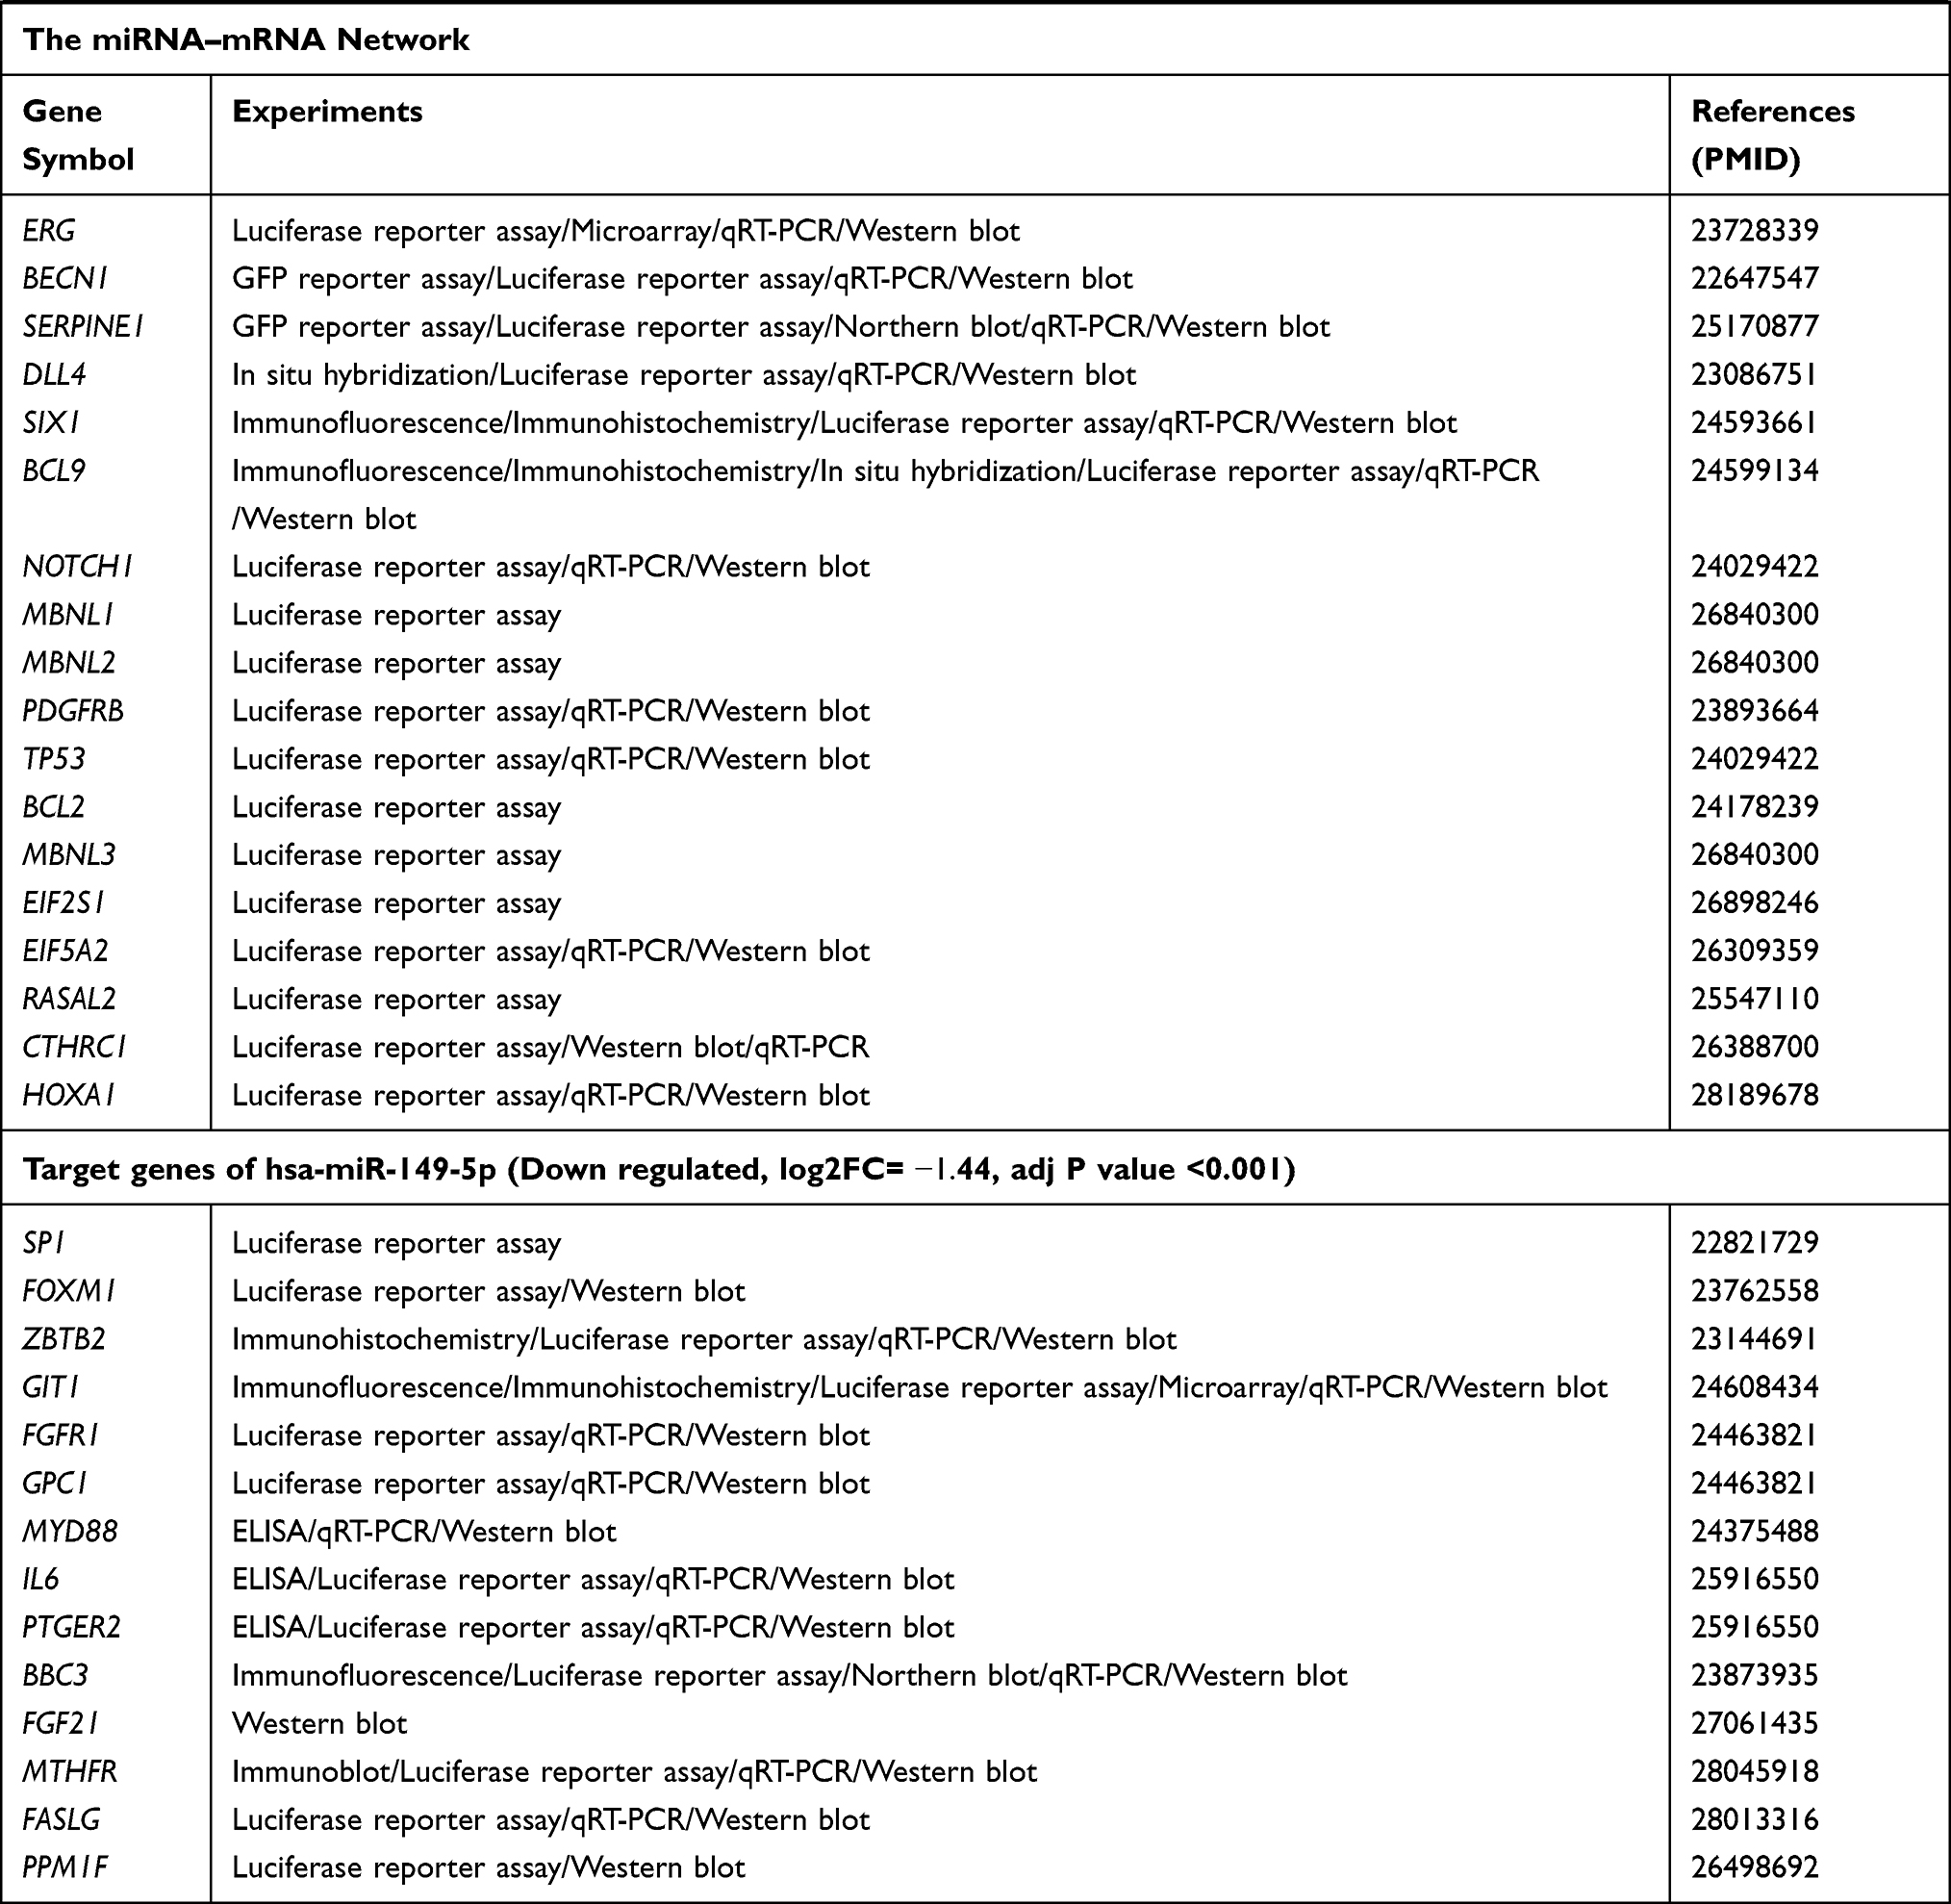 |
Table 3 Target Genes of Identified DE-miRNAs |
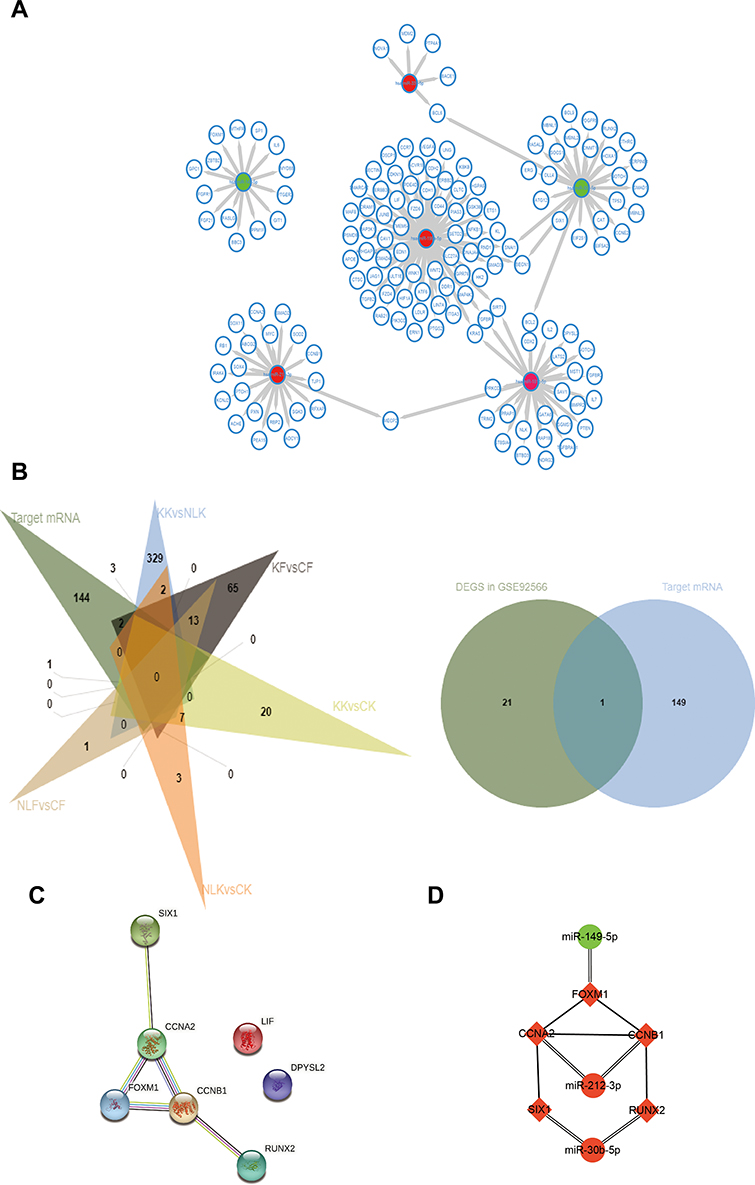 |
Figure 2 (A) MiRNA–target gene interactions. By searching the miRNA target gene prediction database, we found the target genes of DE-miRNAs. The predictions were verified by mirtarbase. Eventually, we selected six DE-miRNAs, whose target genes (support type: functional MTI) are more than five and build the network of miRNA–mRNA interactions using Cytoscape. Red node indicates the expression of gene is increased in keloid, while green indicates the expression of gene is decreased in keloid. (B) After selecting mRNAs of DE-miRNAs, we compared the above target mRNAs with DEGS in GSE44270 and GSE92566, and selected the overlapping mRNAs for future studies. Finally, we selected seven mRNAs that were DEGs in GSE44270 or GSE92566. (C) We plotted the PPI network diagram of the above seven genes to describe the connections among the seven genes. Moreover, LIF and DPYSL2 genes had no association with the other five genes, hence were abandoned in further study. (D) The connection of three DE-miRNAs and five DE-target mRNAs. Red node indicates the expression of gene is increased in keloid compared with control groups, while green node indicates the expression of gene is decreased in keloid compared with control groups. |
Protein Interaction Network Construction
In order to further understand the biological interaction of SIX1, CCNA2, CCNB1, FOXM1, and RUNX2, we constructed an expanded PPI network. The network had 55 nodes, 52 genes, and 951 edges, with an average local clustering coefficient of 0.836 (Figure 3). These 52 genes represent a gene cluster based on SIX1, CCNA2, CCNB1, FOXM1, and RUNX2.
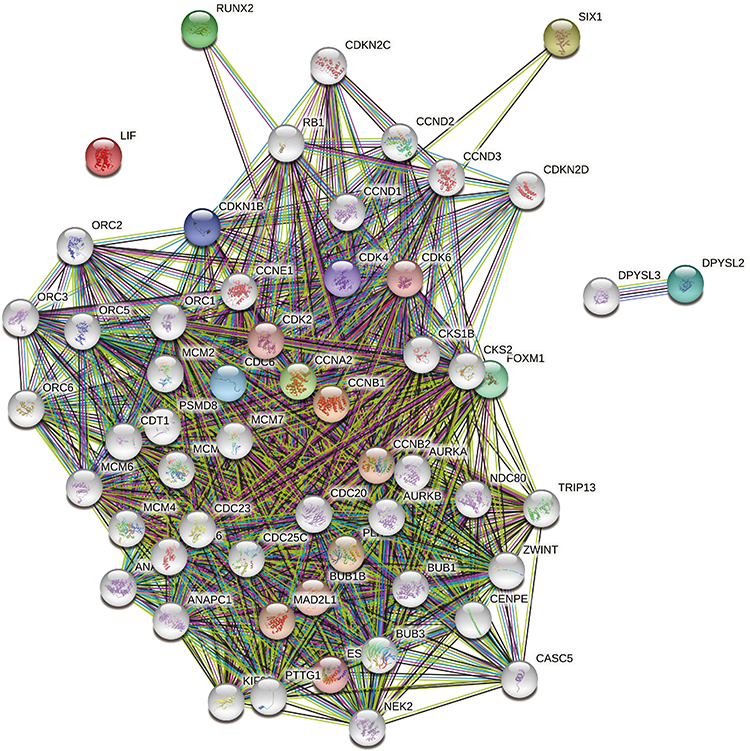 |
Figure 3 A PPI network with 55 nodes, 52 genes, and 951 edges was constructed based on five DE-miRNAs’ target mRNAs (SIX1, CCNA2, CCNB1, FOXM1, and RUNX2). |
Expression Analyses of Target mRNAs of DE-miRNAs
Next, in order to investigate the biological role of this gene cluster in keloids, we performed gene enrichment analysis. DAVID online tool was used for GO annotation and KEGG pathway analyses. The top five items in each enrichment analysis are shown in Figure 4A. For the purpose of validating the expression of those five genes in keloid, we further analyzed the expression of target genes in the single-cell type clusters identified in skin, and the data was visualized by a bar chart (Figure 4B). The single-cell RNA sequencing (scRNAseq) data were obtained from the HPA database. The results showed that the expression level of CCNA2, CCNB1, RUNX2, and FOXM1 was relatively higher in fibroblast c-9 cell cluster (fibroblast mesenchymal cells) than in other cell clusters in the skin. SIX1 expression increased in the fibroblast c-3 cell cluster, which also identified as fibroblast mesenchymal cells. The expression profile of the five genes in a specific tissue or organ system was also identified using BioGPS. The results showed that CCNA2 expression was highest in B lymphoblast, followed by CD34 and CD105+ endothelial cells. Similarly, CCNB1 expression was highest in B lymphoblast, followed by CD71+ early erythroid and CD105+ endothelial cells. FOXM1 expression was highest in Burkitt’s lymphoma, followed by CD71+ early erythroid and B lymphoblast. SIX1 and RUNX2 were not specifically expressed in tissues. Next, we tried to analyzed the expression and existence of these five genes in healthy human tissues and organs through Bgee database. The data were expressed in a bar chart (Figure 4C). We found that compared with normal subcutaneous adipose tissue, except SIX1, the expression difference of other genes in subcutaneous adipose tissue and skin was not obvious. This suggests that the expression differences of CCNA2, CCNB1, RUNX2, and FOXM1 in tissue adjacent to the skin are not obvious in healthy donors. Therefore, we suspect that abnormal expression of CCNA2, CCNB1, RUNX2, and FOXM1 may be associated with keloid formation.
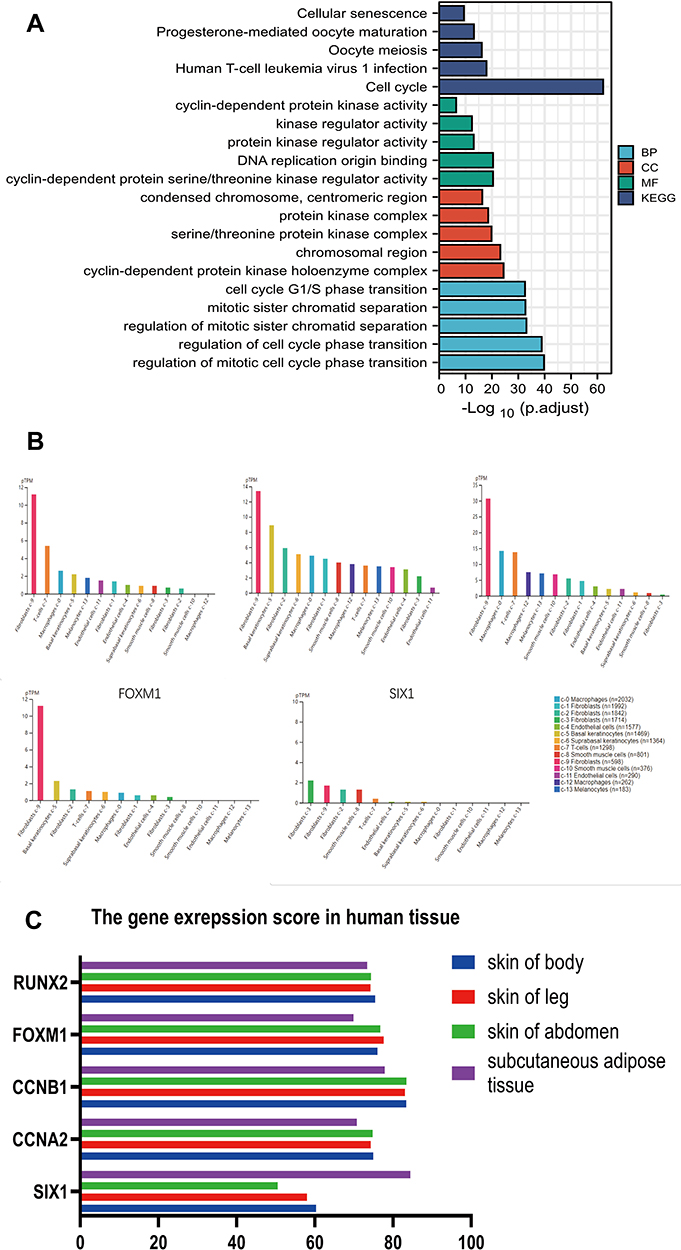 |
Figure 4 (A) The enrichment analysis of the 52 genes mentioned in Figure 3 was analyzed to study the biological function of the gene cluster based on five DE-miRNAs’ target mRNAs. (B) We further analyzed the expression of five target genes in the single-cell-type clusters identified in the skin to analyze the expression of those five mRNAs in different cell types. (C) Expression and existence of these five genes in different healthy human skin tissues was analyzed using Bgee database. |
Validation of the Identified miRNAs/mRNAs
After we screened a gene cluster containing five mRNAs and three miRNAs through the above steps, for further confirmation, the expression level of five genes (SIX1, CCNA2, CCNB1, FOXM1, RUNX2) and three miRNAs (miR-30b-5p, miR-212-3p, miR-149-5p) in keloid tissue and normal skin was analyzed by using RT-PCR. According to our results, we found that the expression of miR-30b-5p, miR-212-3p, CCNB1, RUNX2 and SIX1 in keloid was significantly higher than that in healthy donors, and the expression of miR-149-5p in keloid was significantly lower than that in healthy donors, and the difference was statistically significant (Figure 5).
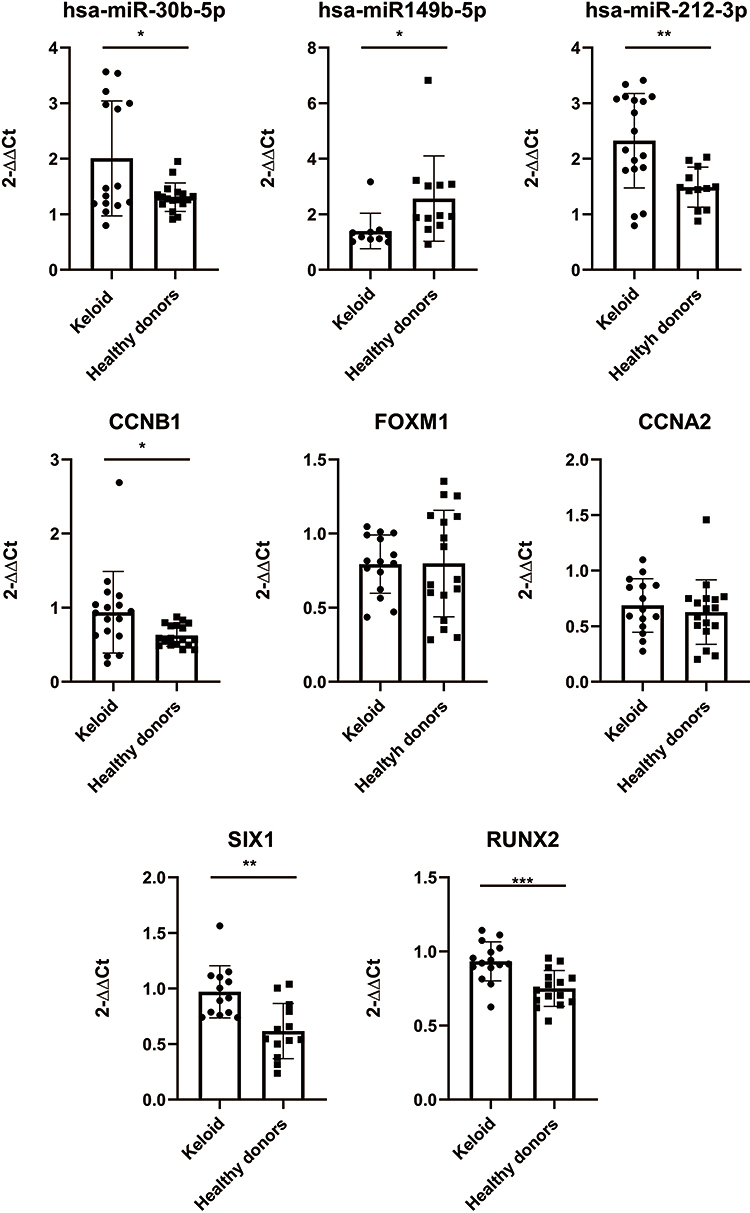 |
Figure 5 The expression of DE-miRNAs and DE-target mRNAs was validated using RT-PCR. The 2-ΔΔCt method was used to determine the gene expression levels. Differences between groups were analyzed using Student’s t-test. The significance was defined at P < 0.001 (***), P < 0.01 (**), and P < 0.05 (*). |
Discussion
Herein, this study aimed to identify biomarkers for keloid and a cluster containing five genes (SIX1, CCNA2 CCNB1, FOXM1, RUNX2) controlled by three miRNAs (miR-30b-5p, miR-212-3p, miR-149-5p) were determined. In this study, we identified a novel pathway, miR-149-5p-FOXM1. miR-149-5p is overexpressed in multiple cancers, such as breast cancer, lung cancer, kidney cancer, and bladder cancer. By regulating il-6/STAT3 pathway, miR-149-5p thus affects the proliferation and metabolism of tumor cells.13–17 However, there has been no research report on the correlation between the expression of miR-149-5p and keloid so far. This is the first study to reveal the association between miR-149-5p and keloid. FOXM1 (Forkhead Box M1) is involved in cell proliferation. FOXM1 protein is phosphorylated in the M phase of the cell cycle, thus regulating the expression of several cell cycle genes, such as cyclin B1 and cyclin D1. Consistent with previous studies, enrichment analysis in this study demonstrated that the PPI network containing FOXM1 is mainly associated with the cell cycle. Previous research showed that FOXM1 knockout inhibits keloid fibroblast activation and extracellular matrix production by affecting the activation of the TGF-β1/Smad pathway.18 Another research also found that FOXM1 promotes keloid progression by participating in the HOXA11-AS-miR-205-5p-FOXM1 pathway.19 Therefore, the novel pathway miR-149-5p-FOXM1 could provide the underlying mechanism of keloid.
Our results indicate that miR-212-3p can promote keloid formation by regulating CCNA2 or CCNB1. miR-212-3p regulates cancer tumorigenesis, differentiation, proliferation, and survival by inhibiting major genes, including SGK3, SOX4, SOX11, SOX5.20–24 There are currently no reports in literature for the function of miR-212-3p on keloid. Unlike miR-212-3p, CCNB1 and CCNB2 alterations may contribute to keloid formation via dysregulation of cell cycle and p53 signaling pathways.25 Furthermore, another research showed that CCNB1 expression might be related to 5-fluorouracil treatment in keloid fibroblasts, suggesting that further study of CCNB1 may lead to new breakthroughs in the treatment of keloids.26 In our study, we not only confirmed the abnormal expression of miR-212-3p and CCNB1 in keloid compared with normal skin but also found that the expression differences of CCNB1 and CCNA2 in normal tissue adjacent to the skin are not obvious in healthy people. Therefore, we suspect that abnormal expression of miR-212-3p and CCNB1 may play a role in keloid formation. Considering strong biological connections between CCNB1, CCNB2, and CCNA2, they may act together to influence the keloid formation via regulating fibroblast cell cycle, and miR-212-3p may act as a key regulatory node in this process.
Our findings suggest that the miR-30b-5p-SIX1/RUNX2 pathway may be associated with keloid. Various studies have shown that miR-30b-5p is associated with tumorigenesis and tumor metastasis.27 Previous studies have illustrated that miR-30b-5p promotes keloid fibroblast proliferation by participating in DLEU2-miR-30a-5p/miR-30b-5p pathway.28 RUNX2 is a member of the RUNX family of transcription factors and encodes a nuclear protein with a Runt DNA-binding domain. Consistent with our study, previous studies have indicated that keloid is related to the expression of RUNX2.29 Specifically, RUNX2 siRNA therapy may reverse pathological keloid phenotypes by inhibiting PI3K/AKT signaling,30 suggesting that RUNX2 is a promising biomarker for keloid therapy. Besides, previous studies have shown that miR-194-3p can directly regulate RUNX2.31 Herein, RUNX2 was associated with miR-30b-5p, providing a new regulatory target for RUNX2 regulation in keloid. The SIXI gene located on chromosome 14 has been associated with limb development, and it encodes a homeobox protein called SIX protein. The autosomal dominant deafness type 23 and branchiootic syndrome type 3 are associated with SIX1. However, no study has comprehensively demonstrated the correlation between SIX1 and keloid. In this study, SIX1 was differentially expressed in KF vs CF, suggesting that SIX1 may promote the formation of the keratinocyte layer of keloid. The abnormal expression of miR-30b-5p, RUNX2 and SIX1 in keloid compared with normal skin was validated. In addition, we found that there was no obvious difference in RUNX2 expression between normal skin tissue and adjacent adipose tissue, suggesting that the differential expression of RUNX2 and SIX1 in keloid may be related to the pathogenesis of keloid, which may be regulated by Mir-30b-5p.
However, this study has several limitations. First, the small number of samples obtained from GSE113620 introduced bias during the analysis of DE-miRNAs. Therefore, more chip data are necessary for statistical analysis to verify the experimental results. Moreover, the functional and molecular mechanisms of genes are complex, and predictions based on bioinformatics alone require cell and animal experiments. Lastly, in the three RNA-seq analysis (GSE113620, GSE44270, GSE92566) we studied, the source of sample was different. In GSE44270, sample were excised from patients undergoing surgery, and then primary cells of skin and scar tissue were cultured for further microarray analysis. However, in GSE113620 and GSE92566, skin and scar tissues were excised and preserved with RNAlater, and subsequently the sample tissue was used for RNA extraction and RNA-seq analysis. We believe that the formation of keloid is closely related to its environment, such as tension and inflammation. Therefore, after the removal of external factors, the gene expression in cultured primary cell may be different from that of tissue sample. That is to say, the results of this study need to be further verified with appropriate sample.
Conclusion
In our study, a PPI network containing 52 genes was constructed based on five target mRNAs of DE-miRNAs. Gene enrichment analysis showed that the biological function of this gene cluster is mainly associated with the cell cycle. Therefore, the three DE-miRNAs may influence keloid proliferation by affecting the gene functional groups centered on CCNA2, CCNB1, SIX1, RUNX2, and FOXM1. This study may provide reliable biomarkers for accurate diagnosis and individualized keloid treatment, and further clinical application.
Data Sharing Statement
All data generated or analyzed during this study are included in this published article.
Ethics Statement
This study was approved by the ethical committee of Shanghai Ninth People’s Hospital and consent was received from the study participants, and that the guidelines outlined in the Declaration of Helsinki were followed. All patients were informed of the purpose of this study and signed informed consent before sample collection.
Patient Consent for Publication
There were no patients enrolled in this study.
Funding
This study was funded by the National Natural Science Foundation of China (No. 81772098, 82002064), Shanghai Sailing Program (No. 20YF1422700), and Shanghai Municipal Education Commission Gaofeng Clinical Medicine Grant Support (No. 20152227). The funders of the study had no role in the design or conduct of the study, the collection, management, analysis, and interpretation of the data, the preparation, review, or approval of the manuscript, and/or decision to submit the manuscript for publication.
Disclosure
The authors declare that they have no competing interests.
References
1. Shin JY, Kim JS. Could 5-fluorouracil or triamcinolone be an effective treatment option for keloid after surgical excision? A meta-analysis. J Oral Maxillofac Surg. 2016;74(5):1055–1060. doi:10.1016/j.joms.2015.10.002
2. Smith JC, Boone BE, Opalenik SR, Williams SM, Russell SB. Gene profiling of keloid fibroblasts shows altered expression in multiple fibrosis-associated pathways. J Invest Dermatol. 2008;128(5):1298–1310. doi:10.1038/sj.jid.5701149
3. Zhong L, Bian L, Lyu J, et al. Identification and integrated analysis of microRNA expression profiles in keloid. J Cosmet Dermatol. 2018;17(5):917–924. doi:10.1111/jocd.12706
4. Pang Q, Wang Y, Xu M, et al. MicroRNA-152-5p inhibits proliferation and migration and promotes apoptosis by regulating expression of Smad3 in human keloid fibroblasts. BMB Rep. 2019;52(3):202–207. doi:10.5483/BMBRep.2019.52.3.278
5. Shi K, Qiu X, Zheng W, Yan D, Peng W. MiR-203 regulates keloid fibroblast proliferation, invasion, and extracellular matrix expression by targeting EGR1 and FGF2. Biomed Pharmacother. 2018;108:1282–1288. doi:10.1016/j.biopha.2018.09.152
6. Nuerzhati Y, Dong R, Song Z, Zheng S. Role of the long non‑coding RNA‑Annexin A2 pseudogene 3/Annexin A2 signaling pathway in biliary atresia‑associated hepatic injury. Int J Mol Med. 2019;43(2):739–748. doi:10.3892/ijmm.2018.4023
7. Tang Z, Ding J, Zhai X, Jing M, Guan Z, Li Y. MicroRNA-21 may be involved in the therapeutic effects of galla chinensis ointment on keloid. J Int Med Res. 2020;48(3):300060520909602. doi:10.1177/0300060520909602
8. Tao J, Cong H, Wang H, et al. MiR-30a-5p inhibits osteosarcoma cell proliferation and migration by targeting FOXD1. Biochem Biophys Res Commun. 2018;503(2):1092–1097. doi:10.1016/j.bbrc.2018.06.121
9. Wang Q, Liu B, Wang Y, Bai B, Yu T, Chu XM. The biomarkers of key miRNAs and target genes associated with acute myocardial infarction. PeerJ. 2020;8:e9129. doi:10.7717/peerj.9129
10. Bardou P, Mariette J, Escudié F, Djemiel C, Klopp C. jvenn: an interactive venn diagram viewer. BMC Bioinform. 2014;15(1):1–7. doi:10.1186/1471-2105-15-293
11. Thul PJ, Lindskog C. The human protein atlas: a spatial map of the human proteome. Protein Sci. 2018;27(1):233–244. doi:10.1002/pro.3307
12. Arno AI, Gauglitz GG, Barret JP, Jeschke MG. Up-to-date approach to manage keloids and hypertrophic scars: a useful guide. Burns. 2014;40(7):1255–1266. doi:10.1016/j.burns.2014.02.011
13. Chen P, Yao Y, Yang N, Gong L, Kong Y, Wu A. Circular RNA circCTNNA1 promotes colorectal cancer progression by sponging miR-149-5p and regulating FOXM1 expression. Cell Death Dis. 2020;11(7):557. doi:10.1038/s41419-020-02757-7
14. Chen S, Chen D, Yang H, Wang X, Wang J, Xu C. Uric acid induced hepatocytes lipid accumulation through regulation of miR-149-5p/FGF21 axis. BMC Gastroenterol. 2020;20(1):39. doi:10.1186/s12876-020-01189-z
15. Xu Z, Tie X, Li N, Yi Z, Shen F, Zhang Y. Circular RNA hsa_circ_0000654 promotes esophageal squamous cell carcinoma progression by regulating the miR-149-5p/IL-6/STAT3 pathway. IUBMB Life. 2020;72(3):426–439. doi:10.1002/iub.2202
16. Ye X, Chen X. miR-149-5p inhibits cell proliferation and invasion through targeting GIT1 in medullary thyroid carcinoma. Oncol Lett. 2019;17(1):372–378. doi:10.3892/ol.2018.9628
17. Zhou Z, Zhang S, Xiong Y. Long noncoding RNA MIAT promotes non-small cell lung cancer progression by sponging miR-149-5p and regulating FOXM1 expression. Cancer Cell Int. 2020;20(1):348. doi:10.1186/s12935-020-01432-3
18. Zhang Y, Cheng C, Wang S, Xu M, Zhang D, Zeng W. Knockdown of FOXM1 inhibits activation of keloid fibroblasts and extracellular matrix production via inhibition of TGF-β1/Smad pathway. Life Sci. 2019;232:116637. doi:10.1016/j.lfs.2019.116637
19. Su X, Ma Y, Wang Q, Gao Y. LncRNA HOXA11-AS aggravates keloid progression by the regulation of HOXA11-AS-miR-205-5p-FOXM1 pathway. J Surg Res. 2021;259:284–295. doi:10.1016/j.jss.2020.09.035
20. Haenisch S, Zhao Y, Chhibber A, et al. SOX11 identified by target gene evaluation of miRNAs differentially expressed in focal and non-focal brain tissue of therapy-resistant epilepsy patients. Neurobiol Dis. 2015;77:127–140. doi:10.1016/j.nbd.2015.02.025
21. Ju C, Zhou R, Sun J, et al. LncRNA SNHG5 promotes the progression of osteosarcoma by sponging the miR-212-3p/SGK3 axis. Cancer Cell Int. 2018;18:141. doi:10.1186/s12935-018-0641-9
22. Liu H, Li C, Shen C, et al. MiR-212-3p inhibits glioblastoma cell proliferation by targeting SGK3. J Neurooncol. 2015;122(3):431–439. doi:10.1007/s11060-015-1736-y
23. Wu Z, Yu B, Jiang L. MiR-212-3p mediates apoptosis and invasion of esophageal squamous cell carcinoma through inhibition of the wnt/β-catenin signaling pathway by targeting SOX4. J Thorac Dis. 2020;12(8):4357–4367. doi:10.21037/jtd-20-2558
24. Liu Y, Zhang XL, Li XF, Tang YC, Zhao X. miR-212-3p reduced proliferation, and promoted apoptosis of fibroblast-like synoviocytes via down-regulating SOX5 in rheumatoid arthritis. Eur Rev Med Pharmacol Sci. 2018;22(2):461–471. doi:10.26355/eurrev_201801_14196
25. Wang H, Quan L, Liang J, et al. Gene expression profiling analysis of keloids with and without hydrocortisone treatment. Exp Ther Med. 2017;14(6):5283–5288. doi:10.3892/etm.2017.5263
26. Huang L, Wong YP, Cai YJ, Lung I, Leung CS, Burd A. Low-dose 5-fluorouracil induces cell cycle G2 arrest and apoptosis in keloid fibroblasts. Br J Dermatol. 2010;163(6):1181–1185. doi:10.1111/j.1365-2133.2010.09939.x
27. Xu J, Lv H, Zhang B, et al. miR-30b-5p acts as a tumor suppressor microRNA in esophageal squamous cell carcinoma. J Thorac Dis. 2019;11(7):3015–3029. doi:10.21037/jtd.2019.07.50
28. Deng Y, Xu Y, Xu S, et al. Secondary data mining of GEO database for long non-coding RNA and competing endogenous RNA network in keloid-prone individuals. Aging (Albany NY). 2020;12(24):25076–25089. doi:10.18632/aging.104054
29. Fuentes-Duculan J, Bonifacio KM, Suárez-Fariñas M, et al. Aberrant connective tissue differentiation towards cartilage and bone underlies human keloids in African Americans. Exp Dermatol. 2017;26(8):721–727. doi:10.1111/exd.13271
30. Lv W, Wu M, Ren Y, et al. Treatment of keloids through runx2 siRNA‑induced inhibition of the PI3K/AKT signaling pathway. Mol Med Rep. 2021;23(1):1
31. Xu Z, Guo B, Chang P, Hui Q, Li W, Tao K. The differential expression of miRNAs and a Preliminary Study on the Mechanism of miR-194-3p in Keloids. Biomed Res Int. 2019;2019:8214923. doi:10.1155/2019/8214923
 © 2022 The Author(s). This work is published and licensed by Dove Medical Press Limited. The full terms of this license are available at https://www.dovepress.com/terms.php and incorporate the Creative Commons Attribution - Non Commercial (unported, v3.0) License.
By accessing the work you hereby accept the Terms. Non-commercial uses of the work are permitted without any further permission from Dove Medical Press Limited, provided the work is properly attributed. For permission for commercial use of this work, please see paragraphs 4.2 and 5 of our Terms.
© 2022 The Author(s). This work is published and licensed by Dove Medical Press Limited. The full terms of this license are available at https://www.dovepress.com/terms.php and incorporate the Creative Commons Attribution - Non Commercial (unported, v3.0) License.
By accessing the work you hereby accept the Terms. Non-commercial uses of the work are permitted without any further permission from Dove Medical Press Limited, provided the work is properly attributed. For permission for commercial use of this work, please see paragraphs 4.2 and 5 of our Terms.