")
Back to Journals » OncoTargets and Therapy » Volume 13
Identification and Validation of MSX1 as a Key Candidate for Progestin Resistance in Endometrial Cancer
Authors Yang L, Cui Y , Huang T , Sun X , Wang Y
Received 14 July 2020
Accepted for publication 5 October 2020
Published 13 November 2020 Volume 2020:13 Pages 11669—11688
DOI https://doi.org/10.2147/OTT.S271494
Checked for plagiarism Yes
Review by Single anonymous peer review
Peer reviewer comments 3
Editor who approved publication: Dr Federico Perche
Linlin Yang,1– 3 Yunxia Cui,1– 3 Ting Huang,1– 3 Xiao Sun,1– 3 Yudong Wang1– 3
1Department of Gynecologic Oncology, The International Peace Maternity and Child Health Hospital, School of Medicine, Shanghai Jiao Tong University, Shanghai, People’s Republic of China; 2Shanghai Municipal Key Clinical Specialty, Shanghai, People’s Republic of China; 3Shanghai Key Laboratory of Embryo Original Disease, Shanghai, People’s Republic of China
Correspondence: Yudong Wang; Xiao Sun Department of Gynecologic Oncology
The International Peace Maternity and Child Health Hospital, School of Medicine, Shanghai Jiao Tong University, 1961 Huashan Road, Shanghai 200060, People’s Republic of China
Email [email protected]; [email protected]
Purpose: Progestin resistance is a critical obstacle for endometrial conservative therapy. Therefore, studies to acquire a more comprehensive understanding of the mechanisms are urgent. However, the pivotal molecules are still unexplored.
Materials and Methods: We downloaded GSE121367 from the GEO database. The “limma” R language package was applied to identify differentially expressed genes (DEGs). We conducted Gene Set Enrichment Analysis (GSEA) and Gene Set Variation Analysis (GSVA). Protein–protein interaction was constructed by STRING and visualized in Cytoscape. The tumor immune microenvironment was explored by the TISIDB database. Methylation validation and overall survival analysis were conducted by the TCGA database. In addition, the upstream modulators of hub genes were predicted by miRTarBase and Network Analyst databases. The expression levels of candidate genes were validated by quantitative real-time PCR (qRT-PCR), Western blot, and immunohistochemical assay (IHC). Cell growth, clone formation, migration, invasion, and wound healing assays were studied to explore the role of MSX1 in progestin resistance in vitro.
Results: A total of 3,282 DEGs were identified and they were mostly enriched in the cell adhesion pathway. We screened out ten hub genes whose genomic alteration rates were low based on the current endometrial carcinoma sample sets. Has-miR-335-5p, has-miR-124-3p, MAZ, and TFDP1 were the most prominent upstream regulators. The methylation status of CDH1, JAG1, EPCAM, and MSX1 was decreased, corresponding to their high protein expression, which also predicted better overall survival. The homeobox protein of MSX1 showed significant tissue specificity and better prognostic value and its knockdown inhibited epithelial–mesenchymal transitions (EMT) and enhanced progesterone efficacy.
Conclusion: Our study identified that the gene of MSX1 promised to be the specific indicator and therapeutic target for progestin resistance. This would shed new light on the underlying biological mechanism to overcome progestin resistance of endometrial cancer.
Keywords: bioinformatic analysis, in vitro experiments, progestin resistance, MSX1, endometrial carcinoma
Introduction
Endometrial carcinoma (EC), which results from aberrant regeneration in terms of excessive growth of endometrial glands,1 accounts for 4.4% of carcinoma cases among women in 20182 with more than 60,000 cases estimated in the United States in 2019.3 As for endometrial precancerous lesions including atypical hyperplasia or endometrial intraepithelial neoplasia and well-differentiated cancer, hysterectomy would not be a feasible and effective optimal choice for them and conservative treatment to preserve fertility for young patients is becoming significantly essential. While a progestin remedy is commonly applied, approximately 30% of such patients do not respond to the therapy, which causes a poor effect for fertility preservation.4 Up until now, there is no effective solution to detect or predict which group of patients may respond to the progestin treatment.
A more comprehensive exploration of the precise molecular targets of progestin resistance would facilitate further improvements in disease diagnosis and would probe new biomarkers, continuous research, including ours, has been carried out in the last decade to address the problem.5–7 At present, microarray technology and bioinformatics processing are considered to be promising tools for genomic analysis and could be well applied to identify genetic or epigenetic alterations in carcinogenesis and drug resistance, which become a necessary complement to experimental research.8 Considering recent developments in open-access datasets like the Gene Expression Omnibus (GEO) and The Cancer Genome Atlas (TCGA), the exploration of key genes and detection of functional pathways have been implemented in EC.9 The GEO and TCGA database contains thousands of clinical information and gene sequencing data, allowing for well-rounded analysis of various cancers. The gene expression profiling interactive analysis (GEPIA) acts as a web server for gene expression profiling, survival analysis, and correlative analyses on the basis of different tumor characteristics such as grades or stages.10 Epigenetics, which covers fields of aberrant DNA methylation, dysregulated noncoding RNA, and altered post-translational histone modification, refers to heritable changes in gene expression which are not associated with an alteration in DNA sequence but play an essential role in carcinogenesis and resistance detection.11 Aberrant DNA methylation is most widely explored and may become an effective detection indicator.12 Up to now, there was no relevant analysis of bioinformatics focused on progestin resistance of EC and the exploration of methylation marker of resistant genes was needed.
In this research, bioinformatics analysis was applied to reveal the differential expressed genes (DEGs) that lead to progestin resistance based on microarray datasets from GEO databases and screen out significant hub genes. Gene-related microRNAs (miRNAs), transcription factors (TFs), methylation status, and survival analysis, as well as biological functions and pathways were also integrated to explore the mechanisms and potential therapeutic value of these DEGs in resistance by constructing networks. Tumor Immune Estimation Resource (TIMER), Gene Set Enrichment Analysis (GSEA), and Gene Set Variation Analysis (GSVA) were utilized to detect underlying biological mechanisms, and in vitro experiments were utilized to validate the role of MSX1 in the presence of medroxyprogesterone (MPA). Our results may help understand the pathogenesis of progestin resistance. Moreover, it may provide insight regarding the novel treatment for EC.
Materials and Methods
Microarray Data and Data Procession
The Gene Expression Omnibus (GEO) is a public repository for data storage. In the present study, the gene expression profiling data sets (GSE121367) were obtained from the GEO database. It included endometrial cancer cell line Ishikawa, which was purchased commercially from the American Type Culture Collection (Manassas, USA), and IshikawaPR, which was established from the Ishikawa cell as its acquired a medroxyprogesterone acetate (MPA) resistant subline. Normalized data of GSE121367 was downloaded from the GEO database and further processed by the “limma” R language package to identify differentially expressed genes (DEGs) between IshikawaPR and Ishikawa cell lines. A P-value<0.05 and |log fold change (FC)|>2 were set as criteria to screen DEGs. The Cancer Genome Atlas (TCGA) database of EC was used to verify the expression status and survival function of hub genes. Subsequently, Web-based software OmicShare (http://www.omicshare.com/tools) and Heml (http://heml.biocuckoo.org/down.php) were used to draw a volcano plot and heatmap, respectively.
Functional and Pathway Enrichment Analysis
The Database for Annotation, Visualization, and Integrated Discovery (DAVID, http://davidd.ncifcrf.gov/) is an online program offering systematic and integrative functional annotation tools for researchers to explore biological meaning behind a large list of genes.13 In this study, the DAVID database and Metascape (http://metascape.org/) were introduced to perform both Gene ontology (GO) and Kyoto Encyclopedia of Genes and Genomes (KEGG) pathway enrichment analysis of the top 250 DEGs.14 P<0.05 was set as the cut-off criterion.
Data Analysis of Gene Set Enrichment Analysis (GSEA) and Gene Set Variation Analysis (GSVA)
In order to explore biological pathways of different groups, GSEA software (https://www.broadinstitute.org/gsea/index.jsp) was used. The annotated gene sets of c5.all.v7.0.symbols.gmt and h.all.v7.0.symbols.gmt were downloaded from the website and considered as the reference gene sets. The number of permutations was 1,000. Other parameters were set to default. A significant difference at P-value<0.05 was defined as the cutoff criteria. Normalized enrichment score (NES) and false discovery rate (FDR) were applied to determine the statistical differences. The differential results were visualized by Enrichment Map plug-in of Cytoscape.15 Furthermore, the “GSVA” R package was utilized to explore the pathways most associated with hub genes.16 On the basis of the median expression of hub gene, 91 EC samples were divided into two groups (high expression and low expression). P<0.01 was defined as statistically significant.
Protein–Protein Interaction (PPI) Network Construction and Hub Genes Screening
Firstly, an online database Search Tool for the Retrieval of Interacting Genes (STRING, http://stringdb.org) was employed to explore the functional interactions between DEG-encoded proteins and build the PPI network.17 PPI pairs with a combined score ≥0.4 were considered as the threshold value. Subsequently, the PPI network was visualized by Cytoscape software,18 and the degree of connectivity was also analyzed. Then the network relationship file was downloaded and the top 10 hub genes were identified by the analysis tool of its plug-in (degrees ranking of cytoHubba).19
Validation of the Hub Genes in Datasets
Gene Expression Profiling Interactive Analysis (GEPIA, http://gepia.cancer-pku.cn) is a web-based server for Hub genes expression analysis, correlation analysis, and patient survival analysis.10 Survival analyses of hub genes were conducted by log‐rank tests and Kaplan–Meier survival curves were plotted. Then the mutation and DNA copy-number alterations of hub genes were investigated in cBioPortal (https://www.cbioportal.org/), the methylation status of hub genes was validated in Ualcan (http://ualcan.path.uab.edu/), which were based on TCGA analysis. Furthermore, on the basis of the TCGA database, the RNA expression level of hub genes in different carcinoma tissues were detected and the difference in protein levels was displayed by immunohistochemistry (IHC) on the basis of the Human Protein Atlas database (HPA, https://www.proteinatlas.org/).20
Prediction of Relevant MicroRNAs and Transcriptional Factors (TFs) of Hub Genes
For the hub DEGs identified from the PPI network, the related miRNAs were predicted by miRTarBase (http://mirtarbase.mbc.nctu.edu.tw/php/download.php), which is the database aiming to provide hundreds of published experimentally validated miRNA–gene interactions.21 The Network Analyst (https://www.networkanalyst.ca/faces/home.xhtml) is designed to support integrative analysis of gene expression data through statistical, visual, and network-based approaches.22 In this study, Network Analyst was introduced to predict hub TFs. A list of the hub genes were enrolled into the input area and proceeded step by step, finally, the gene-related TFs as well as TFs–gene interactions pairs were presented. Then the results were visualized using the Cytoscape software, and the correlations were also evaluated based on GEPIA. All databases that have been used in this study are listed in Table 1.
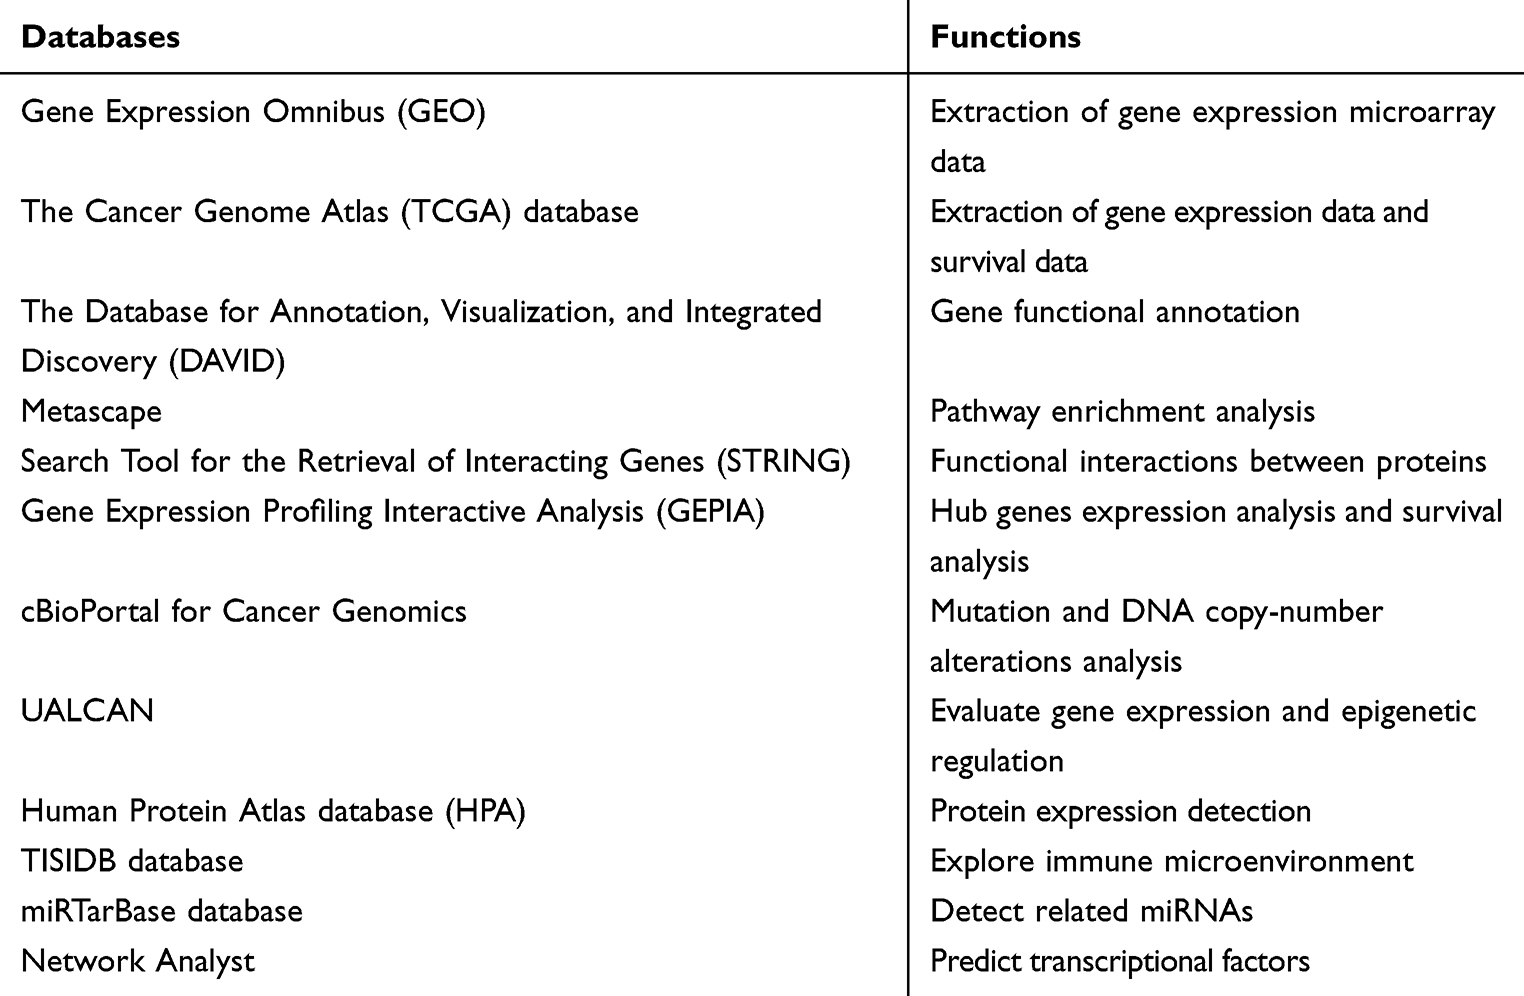 |
Table 1 The Related Databases and Their Functions in This Study |
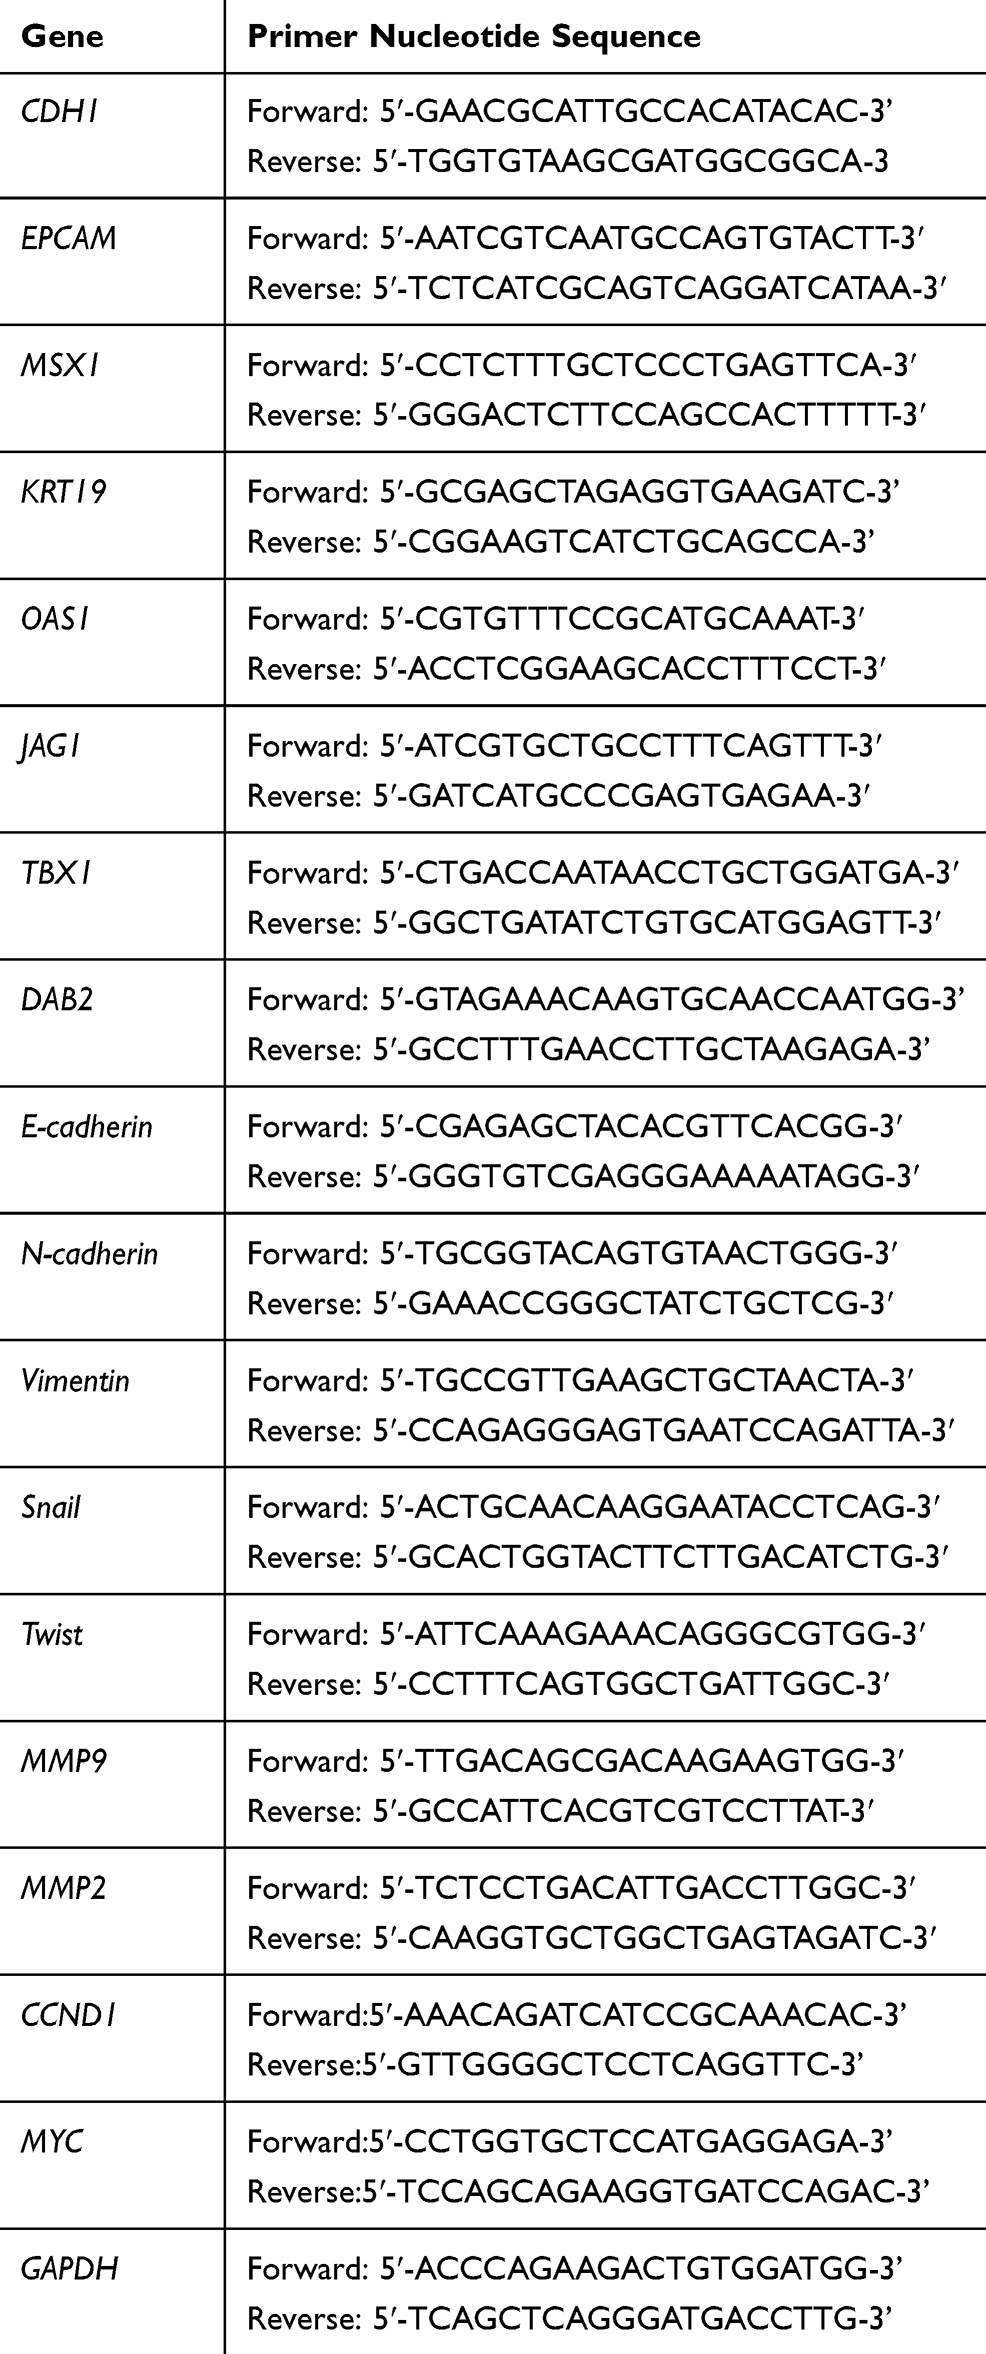 |
Table 2 Sequences of Primers Used for Amplification of Target Genes |
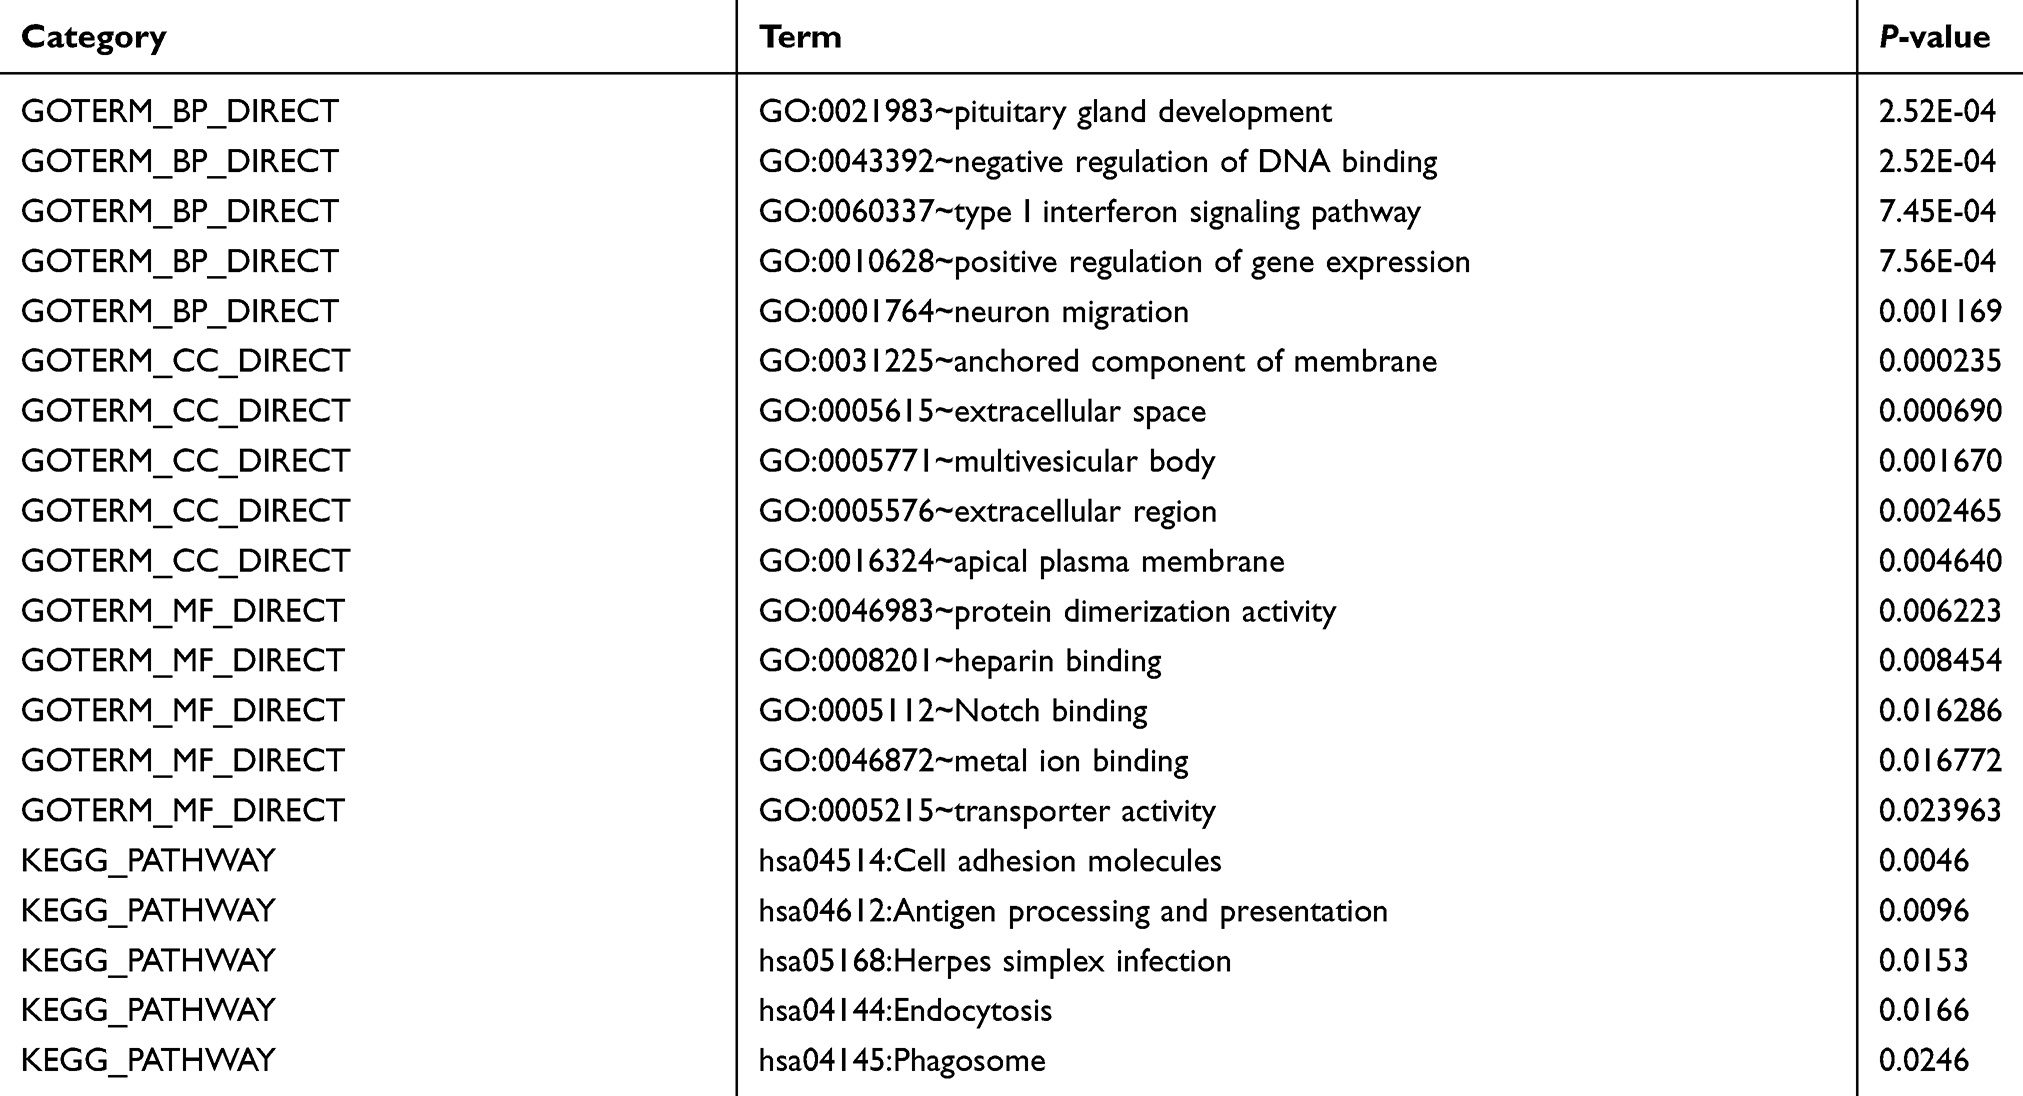 |
Table 3 GO and Pathway Enrichment Analysis of DEGs |
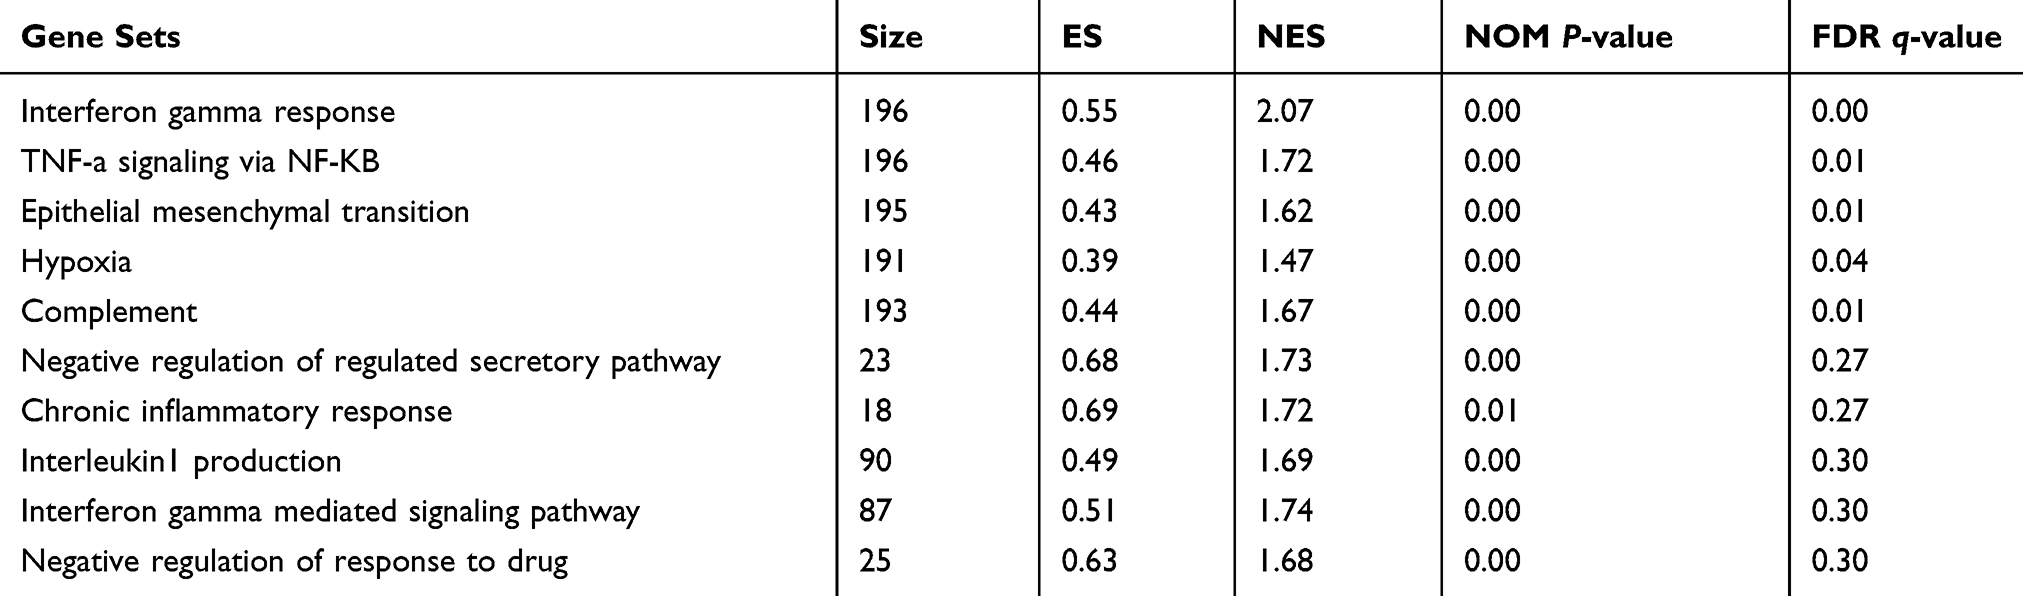 |
Table 4 Upregulated Gene Sets in the IshikawaPR Cell Line |
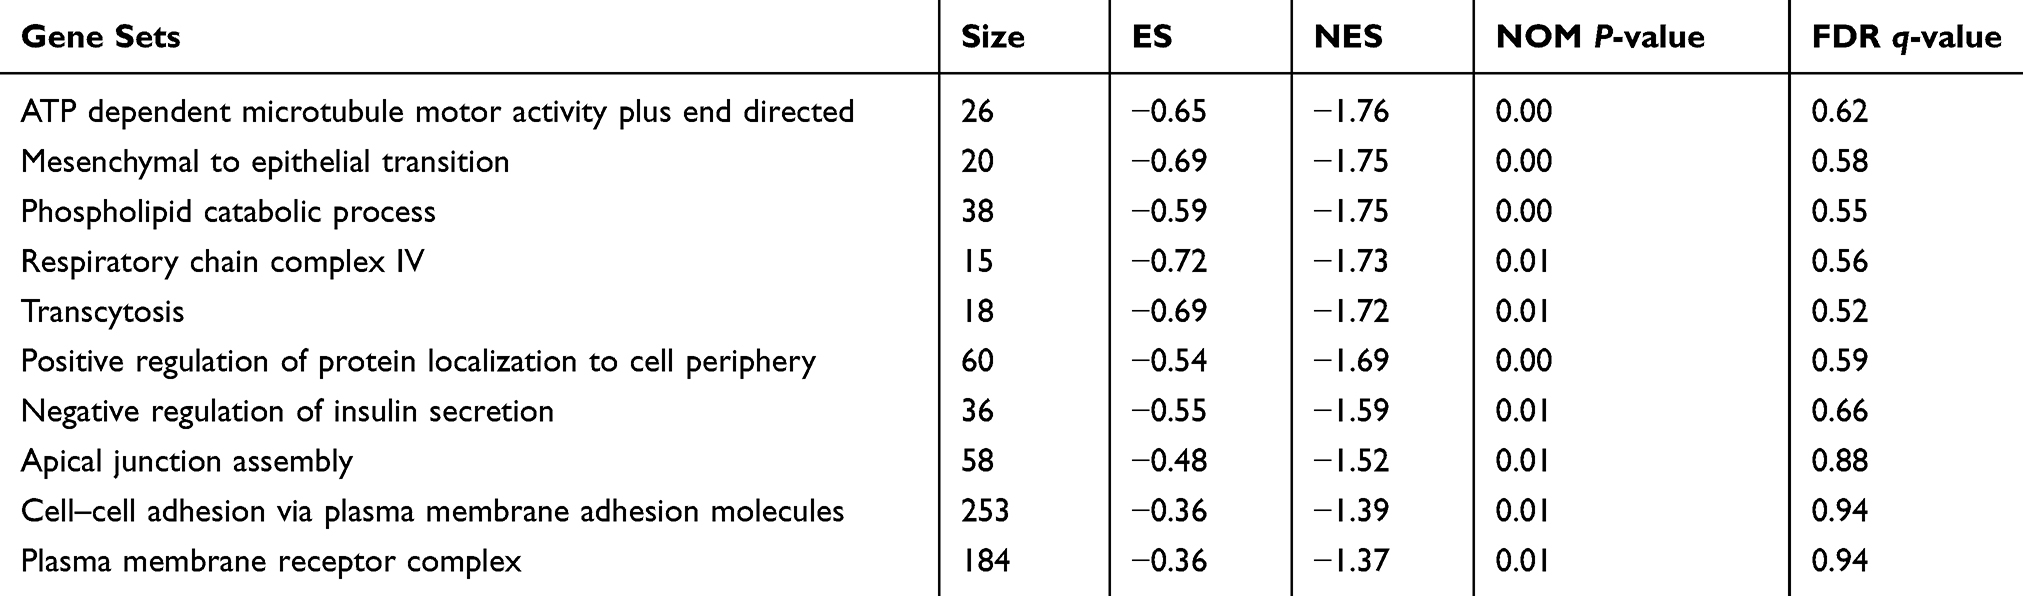 |
Table 5 Upregulated Gene Sets in the Ishikawa Cell Line |
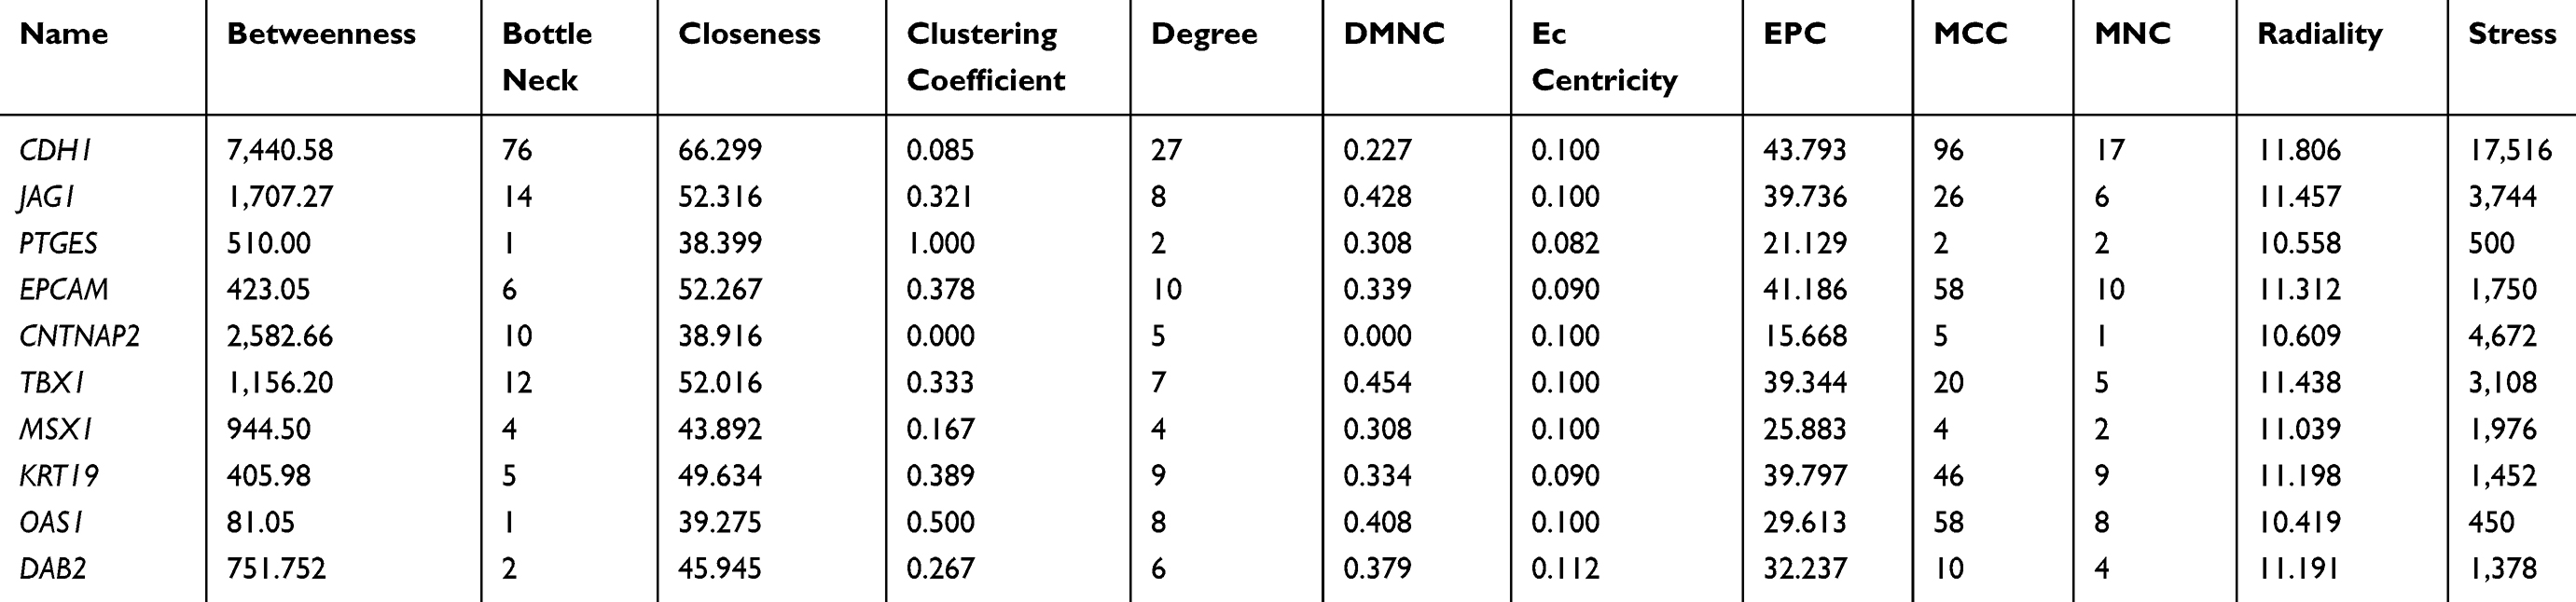 |
Table 6 Identification of Hub Genes by cytoHubba |
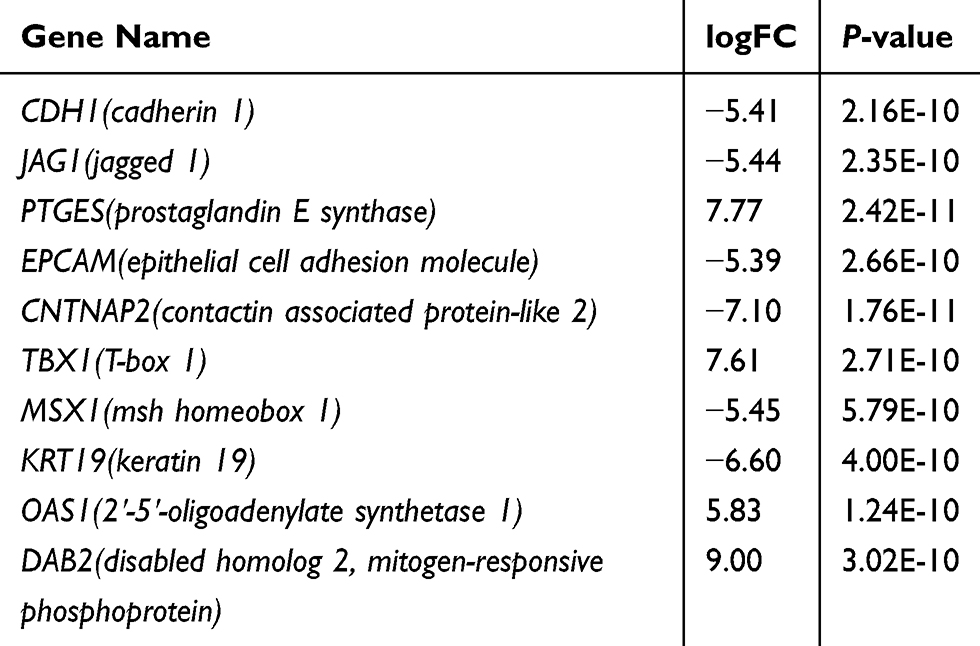 |
Table 7 The Information of Ten Hub Genes |
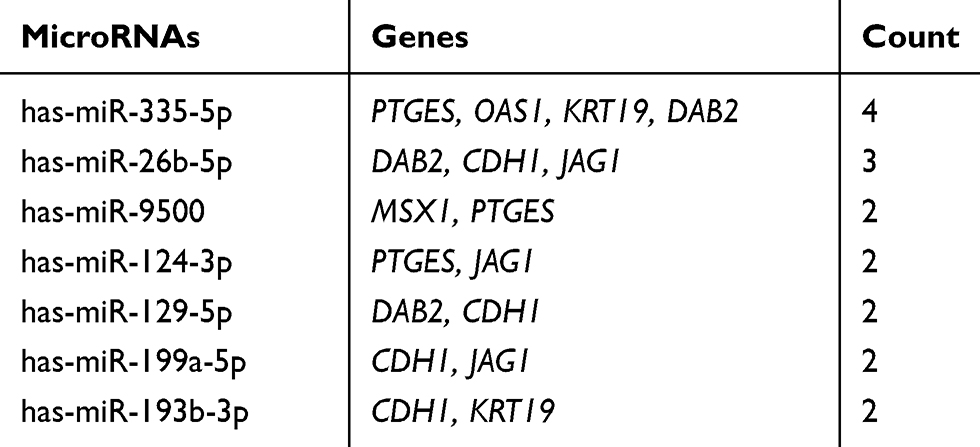 |
Table 8 The Main Related MicroRNAs of Hub Genes |
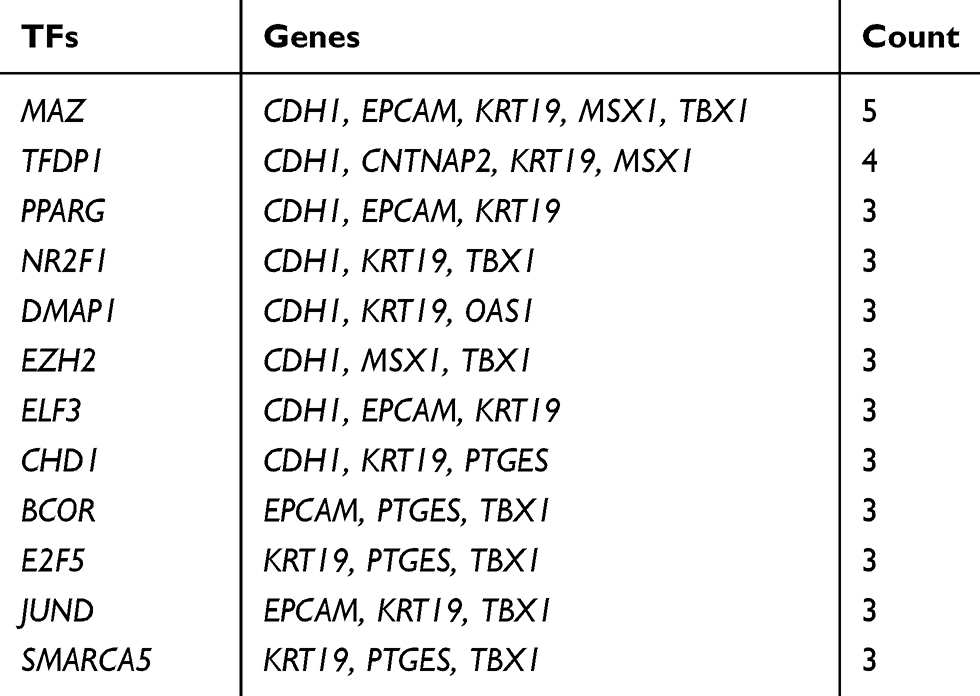 |
Table 9 The Main Related TFs of Hub Genes |
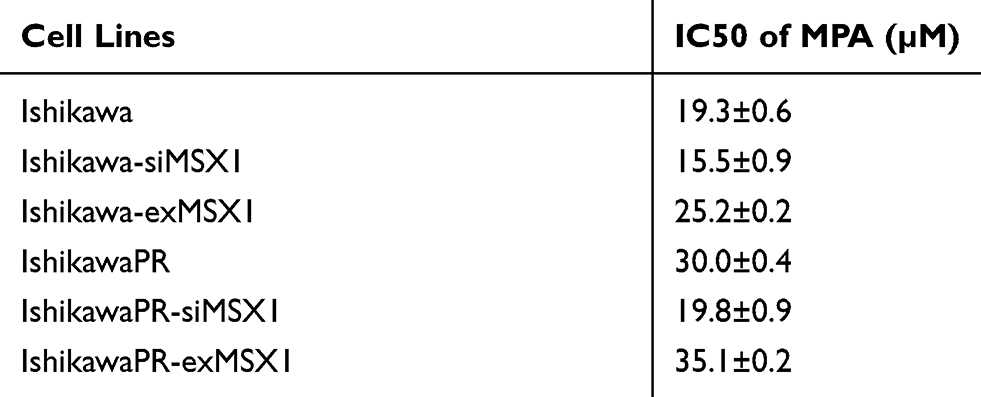 |
Table 10 IC50 Concentrations of MPA in Sensitive and Resistant Cell Lines After MXS1 Overexpression and Silencing |
Cell Culture and Cell Transfection
Human EC cell line Ishikawa and normal endometrial epithelial cells EEC were obtained commercially from the American Type Culture Collection (Manassas, USA) and conserved in our team. IshikawaPR as an acquired medroxyprogesterone acetate (MPA) resistant subline was established from Ishikawa cells.23–27 Briefly, Ishikawa cells were maintained in DMEM/F12 medium with 10% FBS and the synthetic progestin MPA (MedChemExpress, USA) for 10 months. The concentration of MPA was gradually increased by 2.5 µM every 4 weeks until it reached 20 µM. The medium with MPA was changed every 2 days. When the remaining surviving cells grew to a more suitable density but were less than confluent, they were passaged by 0.02% EDTA and 0.25% trypsin resolved in Hank’s balanced salt solution. After being screened for up to 10 months, cells that proliferated in 20 μM MPA were considered to be progestin-resistant Ishikawa cells (IshikawaPR). Subsequently they were kept in 20 μM MPA for further experiments. The plasmid of MSX1 was constructed in Obio Technology (Shanghai, China). A siRNA targeting human MSX1 mRNA was designed by GenePharma Biotechnology (Shanghai, China). The sequences of siMSX1 were 5ʹ-GCAUUUAGAUCUACACUCUTT-3ʹ (sense) and 5ʹ-AGAGUGUAGAUCUAAAUGCTA-3ʹ (anti-sense). The pcDNA3.1-MSX1 and siRNAs (20 μmol/L) were transfected into the sensitive and resistant subline IshikawaPR using Lipofectamine 3000 (Invitrogen, USA), respectively, when cells reached 60–70% confluency. The effect of interference was determined by Western blot and real time PCR analysis.
Western Blot Analysis
Protein extraction and Western blotting were conducted, as previously described.28 Briefly, total protein was resolved by RIPA buffer containing PMSF. Then, after electrophoresis, 50 µg protein was loaded to SDS-polyacrylamide gel and transferred to the membranes, which were incubated overnight with primary antibodies including MSX1 (bs-8512R, Bioss). After being incubated with secondary antibodies, the protein was detected using the chemiluminescence detection system. Each experiment was repeated three times.
Semi-Quantitative Reverse Transcription-PCR (RT-PCR) Analysis
Total RNA from cells was extracted using the TRIzol reagent (Thermo Fisher Scientific, USA). High-capacity cDNA reverse transcription kits (TransGen Biotech Co., China) were used to synthesize cDNA from RNA. Real-time PCR was performed using the SYBR Green PCR kit (Thermo Fisher Scientific) according to the manufacturer’s protocol. The primers used in our study are listed in Table 2.
Immunohistochemical (IHC) Assay
Twelve endometrial cancer and paracancer tissue samples were collected from the International Peace Maternity and Child Health Hospital (IPMCH). The collection complied with the regulations of the Medical School, Shanghai Jiao Tong University, and was in accordance with the declaration of Helsinki. The sections were incubated with a MSX1 antibody overnight followed by a secondary antibody. Then, the images were captured by microscopy (Leica, Germany). The score was determined by both the intensity and the percentage of positive-stained tumor cells.28
Cell Proliferation and Colony Formation Assay
The viability of IshikawaPR cells transfected with siMSX1 or siControl and treated with or without MPA was detected by CCK-8 kit (Beyotime Biotechnology, Shanghai, China). Briefly, after the resistant cells were transfected for 0, 24, 48, and 72 hours, 5×10³ cells/well in cultured medium (90 μL/well) were incubated with CCK-8 (10 μL/well) at 37°C for 2 hours. The OD value was recorded at 450 nm wavelength. Meanwhile, A total 500 transfected cells/well were plated and incubated at 37°C for 2 weeks. After cells were fixed with methanol and stained with 0.25% crystal violet (Beyotime, Shanghai, China), colonies were counted and photographed by using a microscope. All experiments were carried out in triplicate.
In vitro Migration and Invasion Assays
The 24-well chamber with polycarbonate filters (8-µm pore) (Corning, USA) was utilized and 1x10⁵ IshikawaPR cells suspended in 100 µL serum-free medium were seeded into the upper chamber and 500 µL complete medium were added to the lower chamber. After 24 hours, the crystal violet-stained cells were counted at x200 magnification.
Cell Scratch-Wound Assay
After cells reached 90% confluence in 6-well plates, the monolayers were wounded by scratching the well with a 10 µl pipette tip. After washing twice slowly with Phosphate Buffer Saline (PBS), fresh serum-free medium was added into the well. Then, images of the scratch were captured at 0 and 48 hours by phrase-contrast microscope and calculated by using Image J software.
Statistical Analyses
Statistical analyses were performed using GraphPad Prism 7. Statistical analyses between groups were conducted with the Student’s t-test. Data are presented as mean±SD. P-values<0.05 were considered statistically significant.
Results
Identification of Aberrantly Expressed Genes
After data preprocessing and quality evaluation, we obtained the expression matrices from the cell samples in the set GSE121367 and further processed with GEO2R tool. Results showed that a total number of 3,282 common DEGs were screened out from the dataset GSE121367 with 1,819 up-regulated genes (log FC>2) and 1,463 down-regulated genes (log FC<2). The volcano plot was shown in Figure 1A. The red plots represent the up-regulated genes, green plots represent down-regulated genes, and black plots represent genes without differentialexpression based on the cut-off criteria of P-value<0.05 and |log fold change (FC)|>2. The top 250 of DEGs with significant fold change were also drawn with a heatmap (Figure 1B). The red pane shows the high expression level and green pane shows the low expression level.
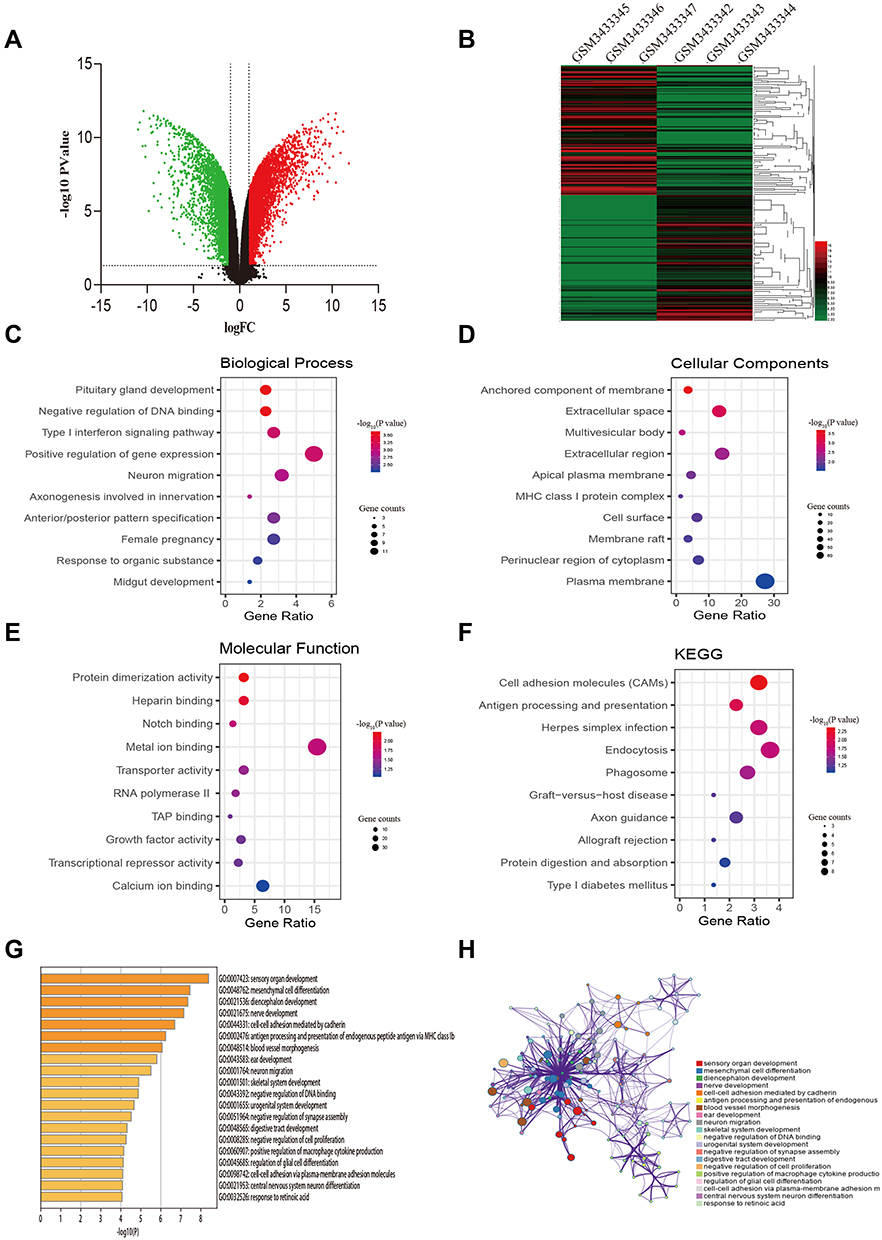 |
Figure 1 Identification of DEGs from the GSE121367 dataset and functional enrichment analysis. (A) Volcano plot of the DEGs. Red dots and green dots represent the upregulated and downregulated genes, respectively; black represents genes with no differential expression based on the threshold of P-value <0.05 and |log FC| >2.0. (B) Heatmap of top 250 DEGs. Gene expression levels were shown by color bar. Red color denotes high level and green color denotes low level. (C) Biological process (BP). (D) Cellular component (CC). (E) Molecular function (MF). (F) KEGG pathways. (G) Boxplot of enriched terms across DEGs, colored by P-values. (H) Network of enriched terms, colored by cluster ID, where nodes that share the same cluster ID are typically close to each other. |
Gene Functional Enrichment Analysis
To illustrate the biological classification of DEGs, GO term enrichment analysis was carried out using DAVID. Three categories of GO terms including biological process (BP), cellular component (CC), and molecular function (MF) results are presented in Figure 1C-E. Results suggested that changes in BP of the top 250 key genes were significantly enriched in “negative regulation of DNA binding”, “type I interferon signaling pathway”, and “neuron migration” (Figure 1C), As for the CC term, these genes showed enrichment in “anchored component of membrane”, “extracellular space”, and “multivesicular body” (Figure 1D). Besides, the MF term indicated enrichment predominantly at “protein dimerization activity”, “Notch binding”, and “transporter activity” (Figure 1E). To further analyze the DEG-enriched pathways, KEGG pathway analysis was subsequently conducted (Table 3). As shown in Figure 1F, it covered the “Cell adhesion molecules pathway” and “Endocytosis pathway”. This functional investigation identified that these DEGs had close associations with changes of DNA binding and the cell adhesion pathway. Furthermore, we also analyzed the pathway of differential genes by the website of Metascape (Figure 1G-H), which revealed that differential genes were enriched in “mesenchymal cell differential”, “cell-cell adhesion mediated by cadherin”, and “negative regulation of DNA binding and cell proliferation”.
Data Processing and Gene Set Enrichment Analysis (GSEA)
Although differential expression of individual genes could play a critical role in mechanistic aspects of cellular regulation, many compounds and genes are regulated complicatedly. For the sake of categorizing such modules of cellular regulation, bioinformatics approaches for “gene set enrichment” (GSEA) statistics have been developed.29 The consequences of GSEA analysis revealed that 428 gene sets were upregulated in the IshikawaPR cell line with a P-value<0.05, among which 145 gene sets were significantly enriched at a nominal P-value<0.01. A total of 116 gene sets were upregulated in the Ishikawa cell line with a P-value<0.05, among which 34 gene sets were significantly enriched at a nominal P-value<0.01. As shown in Table 4, pathways including interferon gamma response, TNF-a signaling via NF-KB, epithelial mesenchymal transition, interleukin1 beta production, and negative regulation of response to drug were significantly enriched in the IshikawaPR cell line (Figure 2B). While in the Ishikawa cell line (Table 5), the consequences showed that pathways about mesenchymal to epithelial transition, negative regulation of insulin secretion, apical junction assembly, and plasma membrane receptor complex compounds were highly enriched (Figure 2C). All the differential results of gene sets were visualized by the Enrichment Map plug-in of Cytoscape (Figure 2A). Altogether, these data suggested that when Ishikawa cells were stimulated and selected by MPA for almost 10 months, the functions of cell signal transduction such as nuclear receptor activity and cytokine biosynthetic process including interferon gamma, interleukin1 production, and epithelial cell polarity were dramatically changed.
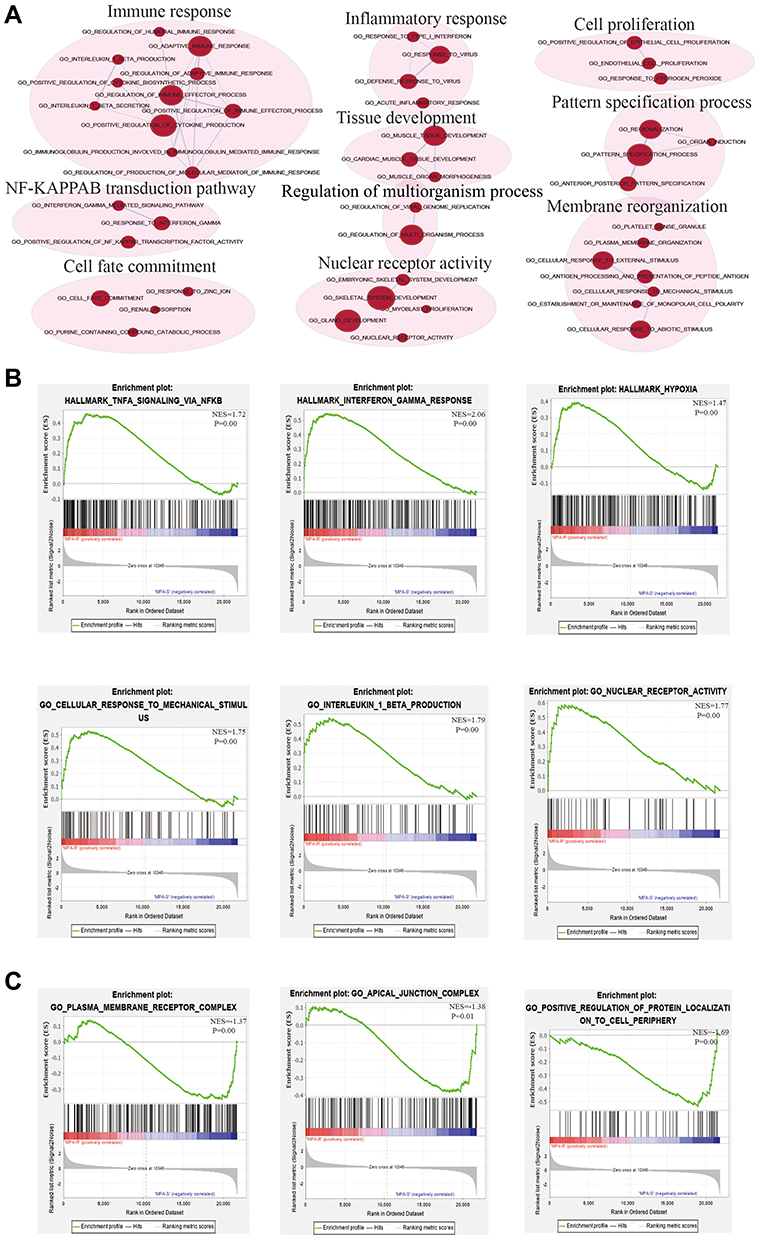 |
Figure 2 The results of GSEA analysis. (A) The pathway network of the group. The red dots represent upregulated pathways. (B) Significantly enriched gene sets in IshikawaPR cell line. (C) Significantly enriched gene sets in Ishikawa cell line. MPA-R represents cell line of IshikawaPR; MPA-S represents cell line of Ishikawa; NES, normalized enrichment score. |
PPI Network Construction of DEGs and Verification of Hub Genes
The top 250 DEGs (P<0.05) of GSE121367 were used to construct a PPI network by the database of STRING and visualized in Cytoscape software (Figure 3A). The red color of a node reflects the upregulated gene and the green means the downregulated gene. The size of the node indicates the connectivity degree and the width of edge displays the combined score. PPI network analysis had been studied by using the threshold value of confidence >0.4 and connectivity degree ≥10. In this network, it contained 159 nodes and 244 edges. The plug-in of cytoHubba in Cytoscape was used to screen hub genes, then a significant submodule was obtained (Figure 3B), from which we chose the hub genes with high scores. Finally, 10 common hub genes (CDH1, JAG1, PTGES, EPCAM, CNTNAP2, TBX1, MSX1, KRT19, OAS1, and DAB2) were identified in the subnetwork (Tables 6 and 7). Next, we observed the mutation and DNA copy number alterations of 10 key genes (Figure 3C). As is shown in the OncoPrint tab, it demonstrated a visual summary of the different alterations of 10 hub genes across all sets of uterine corpus endometrial carcinoma samples based on a query of the 10 genes. Each row represents a gene, and each column represents a tumor sample. Red bars indicate gene amplifications, blue bars are deep deletions, grey bars are no alterations, and green squares are missense mutation. The genomic alteration rates of hub genes were <10% in all enrolled endometrial cancer cases. Furthermore, 10 hub genes were validated in the database TCGA to compare gene expression between endometrial carcinoma samples and normal samples (Figure 3D). The genes of CDH1, EPCAM, MSX1, KRT19, and OAS1 were overexpressed in tumor tissues, while genes including JAG1, TBX1, and DAB2 were downregulated in cancer tissues. There were no differences in the expression of PTGES and CNTNAP2 in cancer and normal samples (results not shown). In addition, we explored the expression profiles of ten hub genes in other cancers by the GEPIA database. As shown in Figure 3E, more than 10 genes were all expressed in other tissues, however, they were significantly expressed in paired endometrial tissues.
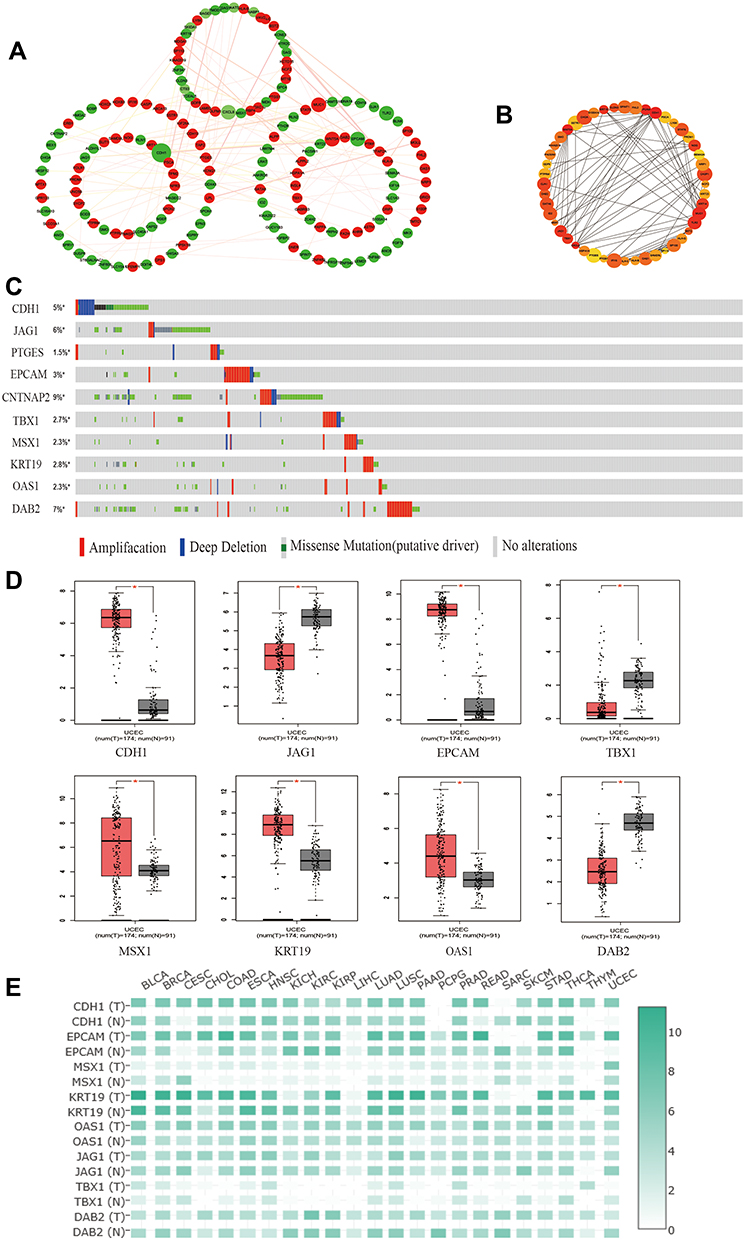 |
Figure 3 Identification and verification of hub genes in datasets. (A) The PPI network of top 250 DEGs. (B) The construction of submodule by the plug-in of CytoHubba in Cytoscape. (C) The OncoPrint tab showed a visual summary of the different alterations of 10 hub genes by the website of cBioPortal. (D) The protein expression of hub genes in GEPIA. *P<0.05 compared with normal endometrial tissues. (E) The expression heatmap of 10 hub genes in human cancers. |
Gene‑Associated MicroRNAs Network Analysis
To explore the potential upstream regulator of hub genes, predicted miRNAs of hub gene were analyzed by the miRTarBase database. Main miRNAs with interactions of more than two genes are listed in Table 8. Moreover, Cytoscape was used to construct the hub gene-relevant miRNAs network (Figure 4A). There were a total of eight genes, 118 miRNAs, and 128 gene-miRNA pairs contained in the network. Some miRNAs were found to play a critical role in regulating essential genes. Has-miR-335-5p was predicted to regulate PTGES, OAS1, KRT19, and DAB2, has-miR-26b-5p may regulate DAB2, CDH1, and JAG1. Furthermore, genes of PTGES and JAG1 were regulated by has-miR-124-3p, whose high expression may be associated with worse survival, suggesting that it may be involved in tumor resistance and may become a prognostic indicator for endometrial cancer.
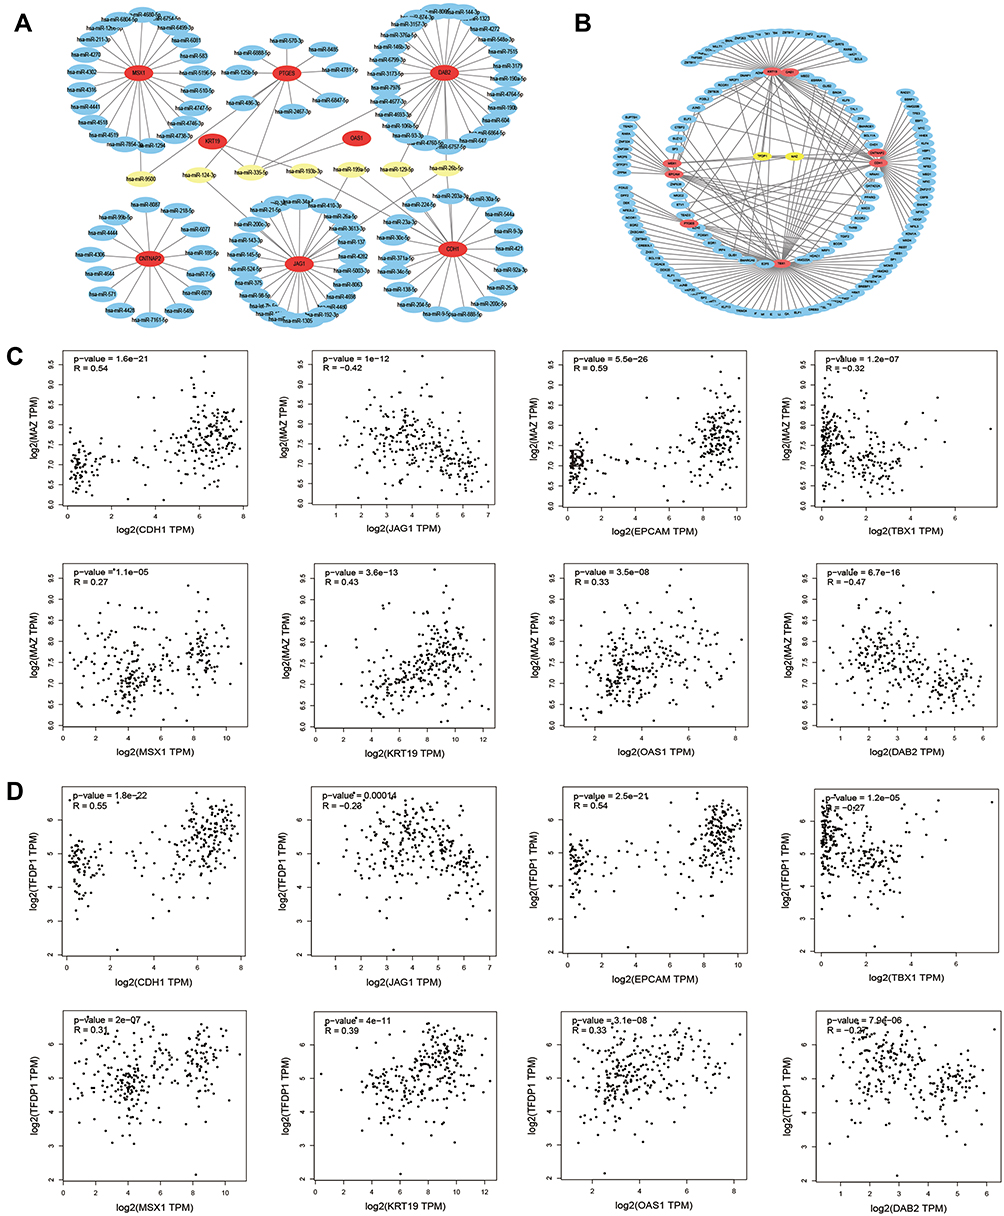 |
Figure 4 Hub gene‑relevant MicroRNAs and Transcriptional Factors network analysis. (A) Hub gene-relevant miRNA network. Red nodes stand for hub genes, blue nodes stand for relevant miRNA, and yellow nodes stands mainly relevant miRNA. (B) Hub gene-transcription factors (TFs) regulatory network. Red nodes represent hub genes, blue nodes represent TFs, and yellow nodes represent major TFs. (C) Correlation analysis between hub genes and MAZ. (D) Correlation analysis between hub genes and TFDP1. |
Core Transcriptional Factors Mediation Network Analysis of Hub Genes
To identify the transcriptional regulation of the hub genes and assess the effect of TFs on the expression of the hub genes, the gene-TFs regulation network was performed by using a Network Analyst network-based service. Totally, 143 TFs were included in the network, constructing 203 gene–TFs interaction pairs (Figure 4B). In this network, MAZ was considered as the key TF to regulate five hub genes: CDH1, EPCAM, KRT19, MSX1, and TBX1. In addition, TFDP1 plays a second important role in regulating CDH1, CNTNAP2, KRT19, and MSX1 (Table 9). Furthermore, we explored the correlation of hub genes and core TFs of MAZ and TFDP1 in endometrial carcinoma using TCGA datasets, respectively. From these results, we found that MAZ and TFDP1 had positive correlations with CDH1, EPCAM, MSX1, KRT19, and OAS1, and had negative correlations with JAG1, TBX1, and DAB2 (Figure 4C-D). Additionally, we found that MAZ was most positively related with EPCAM and negatively related to DAB2. Meanwhile, TFDP1 was positively associated with gene CDH1 and negatively associated with gene JAG1.
Methylation Status and Expression Validation of Hub Genes in HPA
The initiation of cancer resistance was controlled by both genetic and epigenetic events. Epigenetic changes also make an important impact on the occurrence of drug resistance. Therefore, we decided to detect the methylation status of hub genes. As is performed in Figure 5A, the genes of CDH1, JAG1, EPCAM, and MSX1 were aberrantly methylated, which was inconsistent with their protein expression, on the basis of the Ualcan website. In addition, Immunohistochemistry (IHC) staining obtained from the HPA database showed the dysregulation of the expression of hub genes (Figure 5B), among which CDH1, JAG1, EPCAM, and MSX1 were all upregulated in endometrial carcinoma samples and the patient’s age, ID number, and staining status were listed in detail.
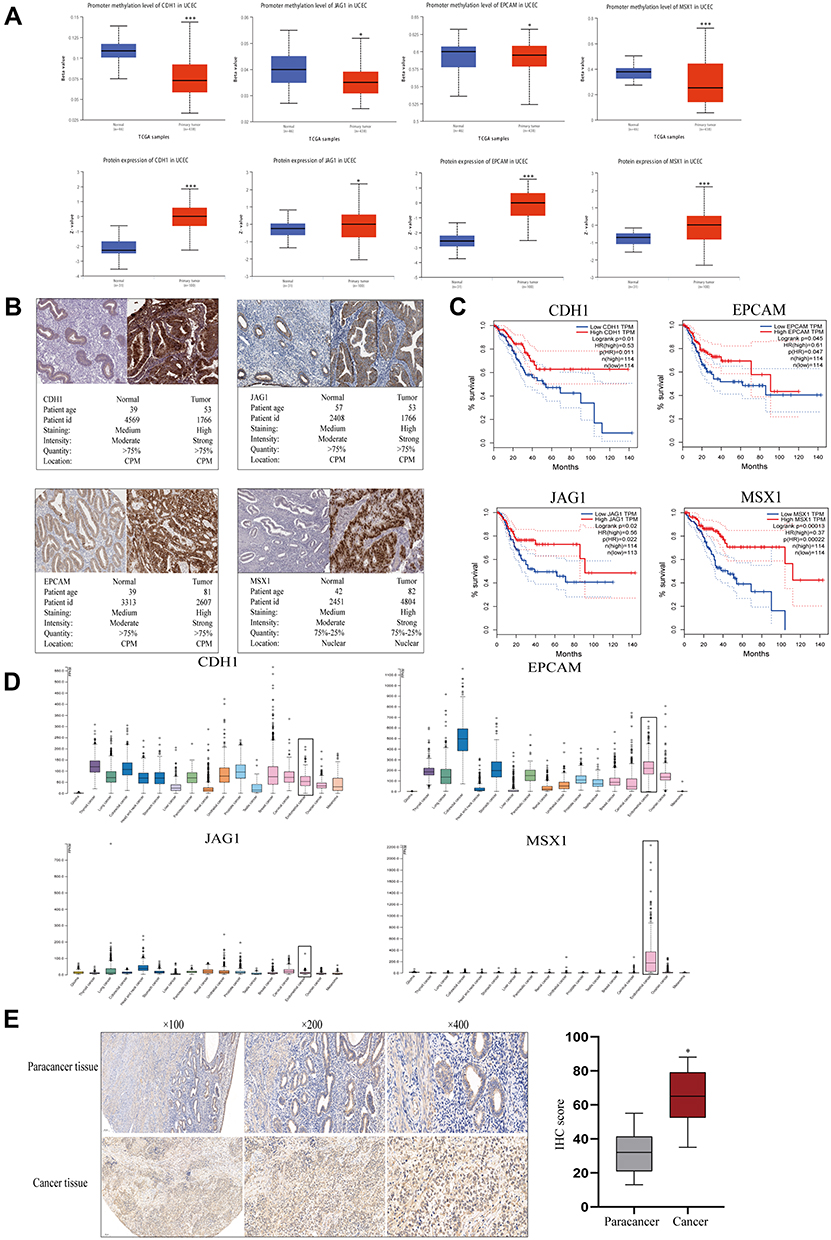 |
Figure 5 Gene methylation status and overall survival evaluation of hub genes. (A) The methylation status and protein expression of hub genes in Ualcan website. (B) The demonstration of Immunohistochemistry (IHC) staining of genes by HPA website. (C) Survival analysis of hub genes in endometrial carcinoma by GEPIA. (D) Basic expression of hub genes in different human cancer organs based on TCGA. (E) MSX1 staining of endometrial cancer and paracancer samples and the results of statistical analysis. *P<0.05 compared with normal endometrial tissues; ***P<0.001 compared with normal tissues. |
Prognostic Value Evaluation and Tissue Specificity Analysis of Hub Genes
Meanwhile, we explored the prognostic values of the four essential genes further, which were obtained in GEPIA and are displayed in Figure 5C. Overall survival for endometrial cancer patients was analyzed in correspondence with the low or high expression of each gene. As is shown, high mRNA expression of CDH1 (P=0.01) was associated with better overall survival for endometrial cancer patients, along with EPCAM (P=0.045), JAG1 (P=0.02), and MSX1 (P=0.001). To further evaluate the expression level of hub genes in different human carcinoma tissues, we explored the HPA website. From Figure 5D, it indicated that the selected four hub genes had various RNA expression levels in different cancer tissues including glioma, thyroid cancer, lung cancer, colorectal cancer, head and neck cancer, stomach cancer, liver cancer, pancreatic cancer, renal cancer, urothelial cancer, prostate cancer, testis cancer, breast cancer, cervical cancer, endometrial cancer, ovarian cancer, and melanoma. Moreover, CDH1 and EPCAM displayed moderate expression levels in carcinoma of the endometrium, while JAG1 had a relatively low level. Nevertheless, MSX1 displayed the highest expression level in endometrial cancer, which showed high tissue specificity. Therefore, we examined its expression level using an anti-MSX1 antibody by IHC assay (Figure 5E), revealing that MSX1 positive staining was present at a higher level in samples with endometrial cancer than in samples of paracancer endometrium.
MSX1 is Significantly Upregulated in Human EC Resistant Cells and Its Suppression Increased Progesterone Sensitivity by in vitro Experiments
To identify whether the expression of the hub genes could be recapitulated in vitro experiments, we performed qRT-PCR assays in both the progesterone sensitive Ishikawa cell line and progesterone resistant IshikawaPR cell line. High levels of MSX1 mRNA were observed in IshikawaPR cells compared with Ishikawa cells (Figure 6A), which were the most statistically significant and may play a crucial role in the formation of progestin resistance. Therefore, the gene MSX1 was selected for the following validation. We transfected IshikawaPR cells with specific siRNA for MSX1 at a concentration of 50 nM to investigate the role that MSX1 played in progesterone resistance. As illustrated in Figure 6B, the effect of gene silencing was obvious. Knockdown of MSX1 repressed the expression of proliferation-related gene and markers associated with epithelial-mesenchymal transition. When validated in protein level, the gene of MSX1 in IshikawaPR cells was overexpressed in both Ishikawa and IshikawaPR cells, while it was weakly expressed in EEC cells. After being transfected with siMSX1, the protein levels were obviously downregulated in Ishikawa and IshikawaPR cells, respectively (Figure 6C). Then we detected the cell viability of Ishikawa and IshikawaPR cell lines when treated with the indicated doses of MPA after MXS1 overexpression and silencing. Results showed that down-regulation of MSX1 made cells more sensitive to the drug of MPA, while the up-regulation of MSX1 attenuated the inhibitory effect of the drug in both progesterone sensitive and resistant cell lines (Figure 6D). Moreover, the IC50 concentrations of MPA after transfection are listed in Table 10. Meanwhile, the knockdown of MSX1 significantly inhibited cell growth and clonogenic formation compared to an untargeted siControl and increased the sensitivity of cells to progesterone (Figure 6E-F). Besides, to evaluate whether MSX1 influenced the migratory function of IshikawaPR cells, we conducted cell migration, invasion, and wound healing assays, the downregulated MSX1 apparently decreased the migration ability of resistant cells and enhanced the effects of MPA (Figure 6G-H).
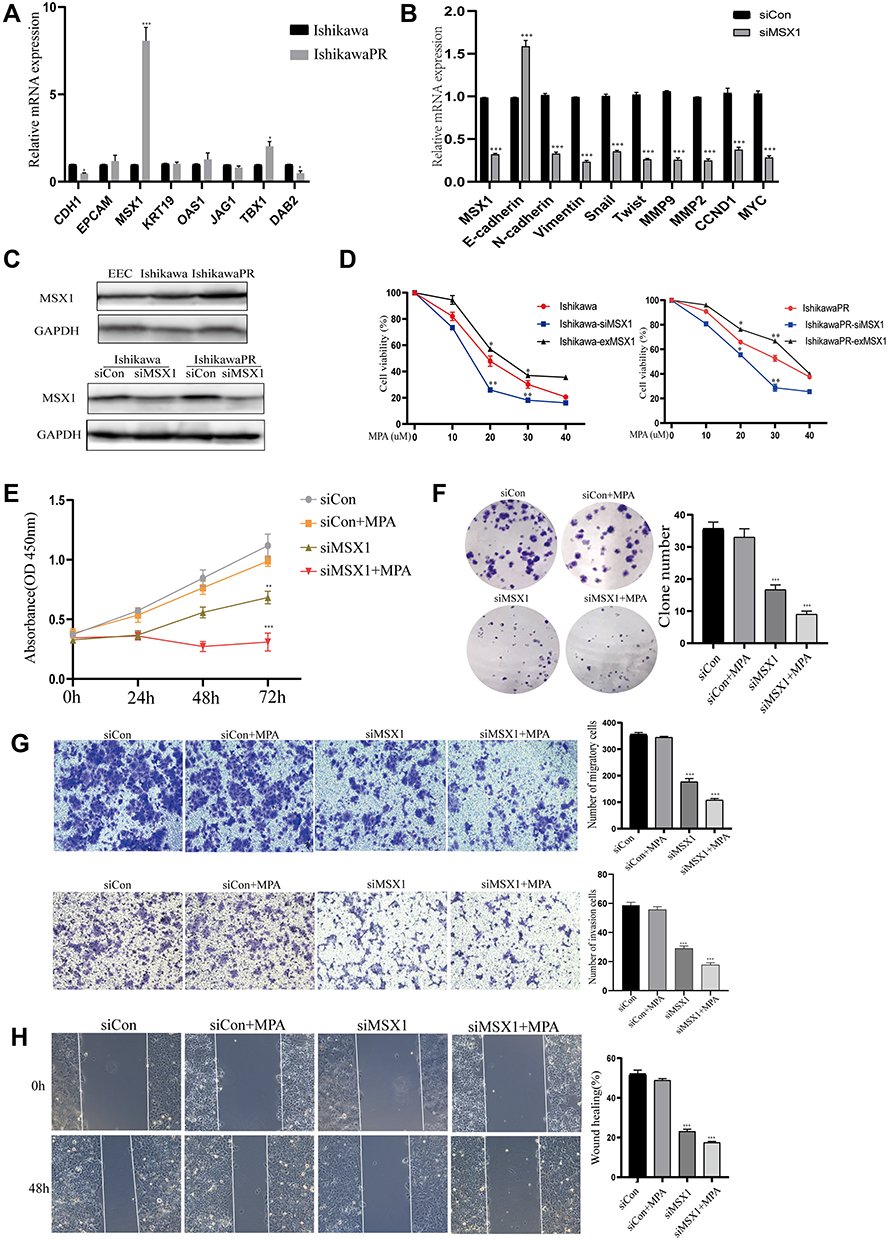 |
Figure 6 Validation of hub genes through in vitro experiments. (A) The RT-PCR analysis of candidate genes in Ishikawa and IshikawaPR cell lines. (B) Expression of MSX1 mRNA and other relevant molecules were evaluated by qRCR after transfection of siMSX1 for 24 hours. (C) The protein level of MSX1 in EEC, Ishikawa, and IshikawaPR cell lines, respectively. (D) Cell viability of Ishikawa and IshikawaPR cell lines when treated with the indicated doses of MPA after MXS1 overexpression and silencing. (E) Cell growth of siMSX1 transfected cells with or without MPA measured by CCK-8 assay. (F) The transfection of siMSX1 decreased clone number of IshikawaPR cells in vitro. (G) IshikawaPR-siMSX1 cells were subjected to transwell invasion and migration assays in the presence or absence of MPA. (H) Wound healing assays for IshikawaPR-siMSX1 cells and its relevant control cells. Data were shown as mean±SD; *P<0.05; **P<0.01; ***P<0.001. |
Validation of MSX1 Based on the TCGA Dataset
The relationship between MSX1 expression and different pathological grade was measured, which suggested that mRNA expression of MSX1 was significantly correlated with tumor grades (Figure 7A). To further investigate the potential functions of MSX1, we performed GSVA on the TCGA data. As shown in Figure 7B, genes in high expression groups of MSX1 were enriched in “positive regulation of intrinsic apoptotic signaling pathway by p53 class mediator” and “epithelial to mesenchymal transition” pathways. Furthermore, we enrolled survival and follow-up data from the TCGA cohort. It is suggested that high expression of MSX1 was significantly associated with favorable prognosis in EC patients (Figure 7C). We also used the tumor-immune system interactions (TISIDB) online database to detect the expression and prognostic value of MSX1 in other types of tumors (Figure 7D). It showed better prediction function in endometrial cancer (Figure 7E). In addition, we explored the association of hub genes’ expression with immune infiltration, the results showed that no or weak associations were observed between MSX1 and infiltration of lymphocytes, while we found MSX1 was positively associated with immunostimulator NT5E (Figure 7F-G).
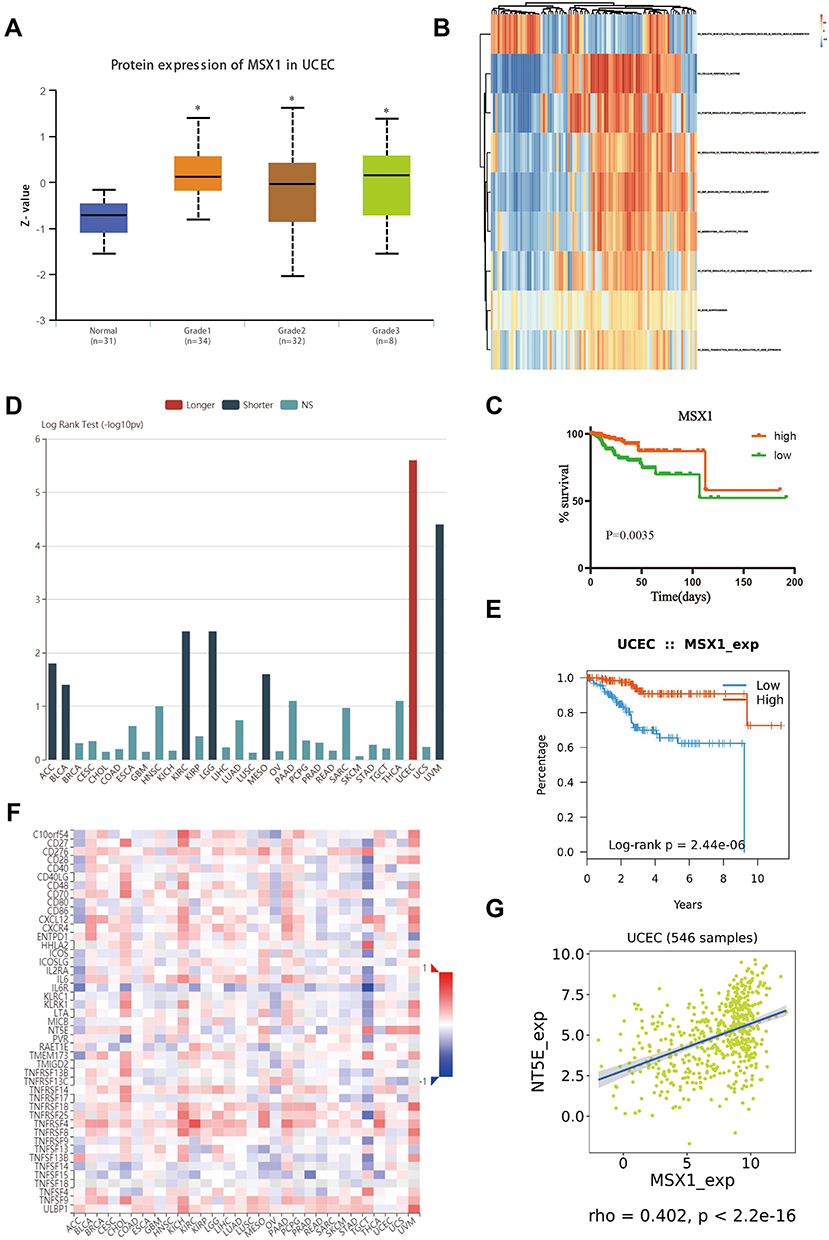 |
Figure 7 Validation of hub gene in the TCGA dataset. (A) Transcriptional expression of MSX1 was significantly correlated with pathological grades of EC. (B) GSVA-derived clustering heatmap of differentially expressed pathways for MSX1. (C) The survival value of MSX1 based on TCGA data. (D) The prognostic value of MSX1 in human tumors based on TCGA cohort. (E) High expression of MSX1 is related to the better prognosis of patients with EC. (F) Spearman correlations between expression of MSX1 and immunostimulators across human cancers. (G) Correlation between expression of MSX1 and immunostimulator NT5E. *p<0.05. |
Discussion
The majority of women in their reproductive period with endometrial precancerous lesion and well-differentiated endometrial neoplasm have an intense desire to preserve fertility. However, when closely following up younger patients with the progestin conservative therapy, clinicians observed that more than 30% of them responded poorly to the treatment.4 The major account for such a high failure rate is that the potential molecular mechanisms of drug resistance remain unclear. Our team has been keen on this research theme for several years.5–7,30,31 On the basis of our previous work, we recently conducted bioinformatics research replying on the dataset from the GEO website. By comparing the endometrial adenocarcinoma cell line Ishikawa with its counterpart IshikawaPR (MPA resistant cell line), we systematically analyzed their significant different genes, relevant molecular pathways, as well as their DNA copy number and the status of methylation in order to identify the essential candidate genes that promoted the carcinogenesis and progestin resistance.
In our present research, among the 24,384 DEGs, we utilized the top 250 genes to conduct functional and pathway enrichment analysis and GSEA analysis, which may provide novel insights for clarifying pathogenesis of progestin resistant. As was exhibited in DAVID, the genes were enriched in biological processes (BP) of negative regulation of DNA binding, type I interferon signaling pathway, neuron migration, and axonogenesis involved in innervation, which made complementary remarks to previous points that EGF/EGFR32 and insulin33 signaling pathways may lead to progestin resistance. Meanwhile, the KEGG pathway showed that cell adhesion molecules pathway and endocytosis signals were involved. Furthermore, the results of GSEA reported that nuclear receptor activity, chronic inflammatory response, and endothelial cell proliferation pathways were enriched in MPA resistant cells, which were significantly different from MPA sensitive cells, suggesting that prolonged progestin treatment may result in changes of cell membranes and nuclear receptors activity, affect signaling transduction, and induce peripheral inflammation response and neurological development. As was said, intestinal bacteria can induce a chronic subclinical inflammatory process, leading to insulin resistance,34 confirming the association between inflammation and resistance, while how inflammatory cytokines evoked progestin resistance remained uncovered, and the role neurological factors played in drug resistance provided a new perspective for us to explore.
The PPI network of DEGs demonstrated the functional correlations, in which hub genes were screened out. Afterwards, we investigated the mutation status of essential genes, all mutation rates were less than 10%, suggesting that their expressions were regulated by other factors, other than genomic mutations. Then, the protein expressions were testified in the TCGA database, genes with statistically significant differences were enumerated, while PTGES and CNTNAP2 had no remarkable difference between normal and tumor samples, so the results were not shown. Moreover, the relevant microRNA and transcription factors were detected and has-miR-335-5p, has-miR-124-3p, MAZ, and TFDP1 played a vital role. As was reported, has-miR-335-5p inhibits invasion and metastasis of thyroid cancer cells,35 breast cancer cells,36 and non-small cell lung cancer.37 In endometrial stromal sarcomas (ESS), has-miR-335-5p was more highly expressed in patients with tumor metastasis and relapse.38 In this study, high expression of has-miR-124-3p predicted worse survival, which was consistent with its effect on hepatocellular carcinoma.39 MAZ was thought to act as a therapeutic target for aerobic glycolysis and the progression of neuroblastoma40 and prostate cancer bone metastasis.41 TFDP1 was involved in colon cancer stemness and cell cycle progression42 and in the endometrium of women with deep infiltrating endometriosis (DIE).43 The relevant microRNA and interactions between hub genes and core TFs MAZ and TFDP1 had already been verified, suggesting they may participate in the formation of progestin resistance, while the detailed regulated mechanisms between TFs and hub genes needed to be further confirmed both in vitro and vivo.
Epigenetic processes, such as DNA methylation, are known to regulate specific gene expression.28 Therefore, in the current study, we researched the methylation status of key genes and presented the significantly different genes such as CDH1, JAG1, EPCAM, and MSX1, which corresponded to their expressions based on TCGA datasets and HPA website. According to the RNA expressions of four hub genes in different carcinoma organs depending on the TCGA database, both CDH1 and EPCAM showed moderate expression levels, while the level of JAG1 was low. Meanwhile, MSX1 was reported to demonstrate the highest expression in endometrial neoplasm, showing its high tissue specificity. Additionally, existing researches reported that MSX1 inhibited the growth and metastasis of breast cancer cells and was frequently silenced by promoter methylation,44 and that MSX1 induced G0/G1 arrest and apoptosis in cervical cancer45 and that epigenetic regulation of MSX1 associated with platinum-resistant disease in high-grade serous epithelial ovarian cancer.46 However, the expression and function of MSX1 had not been explored in endometrial resistant lesions. Therefore, although all of the four genes were associated with patients’ overall survival, due to its high tissue specificity, MSX1 may become a promising tissue specific marker to predict the therapy effect of progestin. In in vitro experiments, we found MSX1 was the most significantly upregulated gene in progesterone resistant IshikawaPR cells than other candidates and its knockdown made progesterone treatment more effective.
We further verified the expression of MSX1 in a larger TCGA cohort. The results confirmed our findings that MSX1 had a significant prediction value in EC and may make an impact on cancer progression through the P53 pathway. We also explored associations of MSX1’s expression with the tumor microenvironment and found the interaction between MSX1 and immunostimulator NT5E.47 However, a series of experimental verifications about our found mechanism need to be investigated and its immune-reinforcing effect needs further detection.
In conclusion, a comprehensive analysis of the hub genes based on the GEO dataset will likely shed new light on progestin therapy. Our study highlighted a novel understanding of the potential biological mechanism in progestin resistance and identified the homeobox gene MSX1 as a biomarker to detect the sensitivity and efficacy of progestin treatment.
Conclusions
In summary, by using comprehensive bioinformatics analysis and in vitro experiment, we have identified DEGs and demonstrated for the first time that MSX1 is likely one of the main molecular indicators of progestin resistance in endometrial cancer. If validated in a larger cohort, MSX1 may become a useful target to detect the progestin therapy effect, which is beneficial for younger patients who want to preserve fertility.
Abbreviations
EC, endometrial cancer; GEO, Gene Expression Omnibus; DEGs, differentially expressed genes; STRING, Search Tool for the Retrieval of Interacting Genes Database; PPI, protein–protein interaction; MCODE, molecular complex detection; GSEA, gene set enrichment analysis; IHC, immunohistochemistry.
Data Sharing Statement
All data analyzed during this study are included in this published article.
Ethics Approval and Consent to Participate
This research was approved by the Institutional Ethics Committee of the International Peace Maternity and Child Health Hospital and conformed to the tenets of Helsinki. All patients provided informed consent.
Acknowledgments
We thank the Center Laboratory and Department of Gynecology of the International Peace Maternity for providing excellent experimental platform.
Author Contributions
All authors contributed to data analysis, drafting or revising the article, have agreed on the journal to which the article will be submitted, gave final approval of the version to be published, and agreed to be accountable for all aspects of the work.
Funding
This study was supported by Shanghai Municipal Key Clinical Specialty (No. shslczdzk06302), National Natural Science Foundation of China (No. 81172477, 81402135), the Project of the Science and Technology Commission of Shanghai Municipality (No. 17441907400) and Shanghai Jiao Tong University Medicine-Engineering Fund (No. YG2017MS41).
Disclosure
The authors declare that they have no competing interests.
References
1. Syed SM, Kumar M, Ghosh A, et al. Endometrial Axin2(+) cells drive epithelial homeostasis, regeneration, and cancer following oncogenic transformation. Cell Stem Cell. 2020;26:64–80.e13. doi:10.1016/j.stem.2019.11.012
2. Bray F, Ferlay J, Soerjomataram I, et al. Global cancer statistics 2018: GLOBOCAN estimates of incidence and mortality worldwide for 36 cancers in 185 countries. CA Cancer J Clin. 2018;68:394–424. doi:10.3322/caac.21492
3. Siegel RL, Miller KD, Jemal A. Cancer statistics, 2019. CA Cancer J Clin. 2019;69:7–34. doi:10.3322/caac.21551
4. Perez-Medina T, Bajo J, Folgueira G, et al. Atypical endometrial hyperplasia treatment with progestogens and gonadotropin-releasing hormone analogues: long-term follow-up. Gynecol Oncol. 1999;73:299–304. doi:10.1006/gyno.1998.5322
5. Wang J, Sun X, Zhang H, et al. MPA influences tumor cell proliferation, migration, and invasion induced by RANKL through PRB involving the MAPK pathway in endometrial cancer. Oncol Rep. 2015;33:799–809. doi:10.3892/or.2014.3651
6. Wang J, Liu Y, Wang L, et al. Clinical prognostic significance and pro-metastatic activity of RANK/RANKL via the AKT pathway in endometrial cancer. Oncotarget. 2016;7:5564–5575. doi:10.18632/oncotarget.6795
7. Liu Y, Wang J, Ni T, et al. CCL20 mediates RANK/RANKL-induced epithelial-mesenchymal transition in endometrial cancer cells. Oncotarget. 2016;7:25328–25339. doi:10.18632/oncotarget.8291
8. Iizuka N, Oka M, Yamada-Okabe H, et al. Oligonucleotide microarray for prediction of early intrahepatic recurrence of hepatocellular carcinoma after curative resection. Lancet. 2003;361:923–929. doi:10.1016/s0140-6736(03)12775-4
9. Zhang W, Gao L, Wang C, et al. Combining bioinformatics and experiments to identify and verify key genes with prognostic values in endometrial carcinoma. J Cancer. 2020;11:716–732. doi:10.7150/jca.35854
10. Tang Z, Li C, Kang B, et al. GEPIA: a web server for cancer and normal gene expression profiling and interactive analyses. Nucleic Acids Res. 2017;45:W98–w102. doi:10.1093/nar/gkx247
11. Dawson MA, Kouzarides T. Cancer epigenetics: from mechanism to therapy. Cell. 2012;150:12–27. doi:10.1016/j.cell.2012.06.013
12. Ying J, Xu T, Wang Q, et al. Exploration of DNA methylation markers for diagnosis and prognosis of patients with endometrial cancer. Epigenetics. 2018;13:490–504. doi:10.1080/15592294.2018.1474071
13. Huang da W, Sherman BT, Lempicki RA. Systematic and integrative analysis of large gene lists using DAVID bioinformatics resources. Nat Protoc. 2009;4:44–57. doi:10.1038/nprot.2008.211
14. Du J, Yuan Z, Ma Z, et al. KEGG-PATH: kyoto encyclopedia of genes and genomes-based pathway analysis using a path analysis model. Mol Biosyst. 2014;10:2441–2447. doi:10.1039/c4mb00287c
15. Huo X, Sun H, Liu Q, et al. Clinical and expression significance of AKT1 by co-expression network analysis in endometrial cancer. Front Oncol. 2019;9:1147. doi:10.3389/fonc.2019.01147
16. Hanzelmann S, Castelo R, Guinney J. GSVA: gene set variation analysis for microarray and RNA-seq data. BMC Bioinform. 2013;14:7. doi:10.1186/1471-2105-14-7
17. Szklarczyk D, Franceschini A, Kuhn M, et al. The STRING database in 2011: functional interaction networks of proteins, globally integrated and scored. Nucleic Acids Res. 2011;39:D561–568. doi:10.1093/nar/gkq973
18. Shannon P, Markiel A, Ozier O, et al. Cytoscape: a software environment for integrated models of biomolecular interaction networks. Genome Res. 2003;13:2498–2504. doi:10.1101/gr.1239303
19. Yang G, Zhang Y, Yang J, Five-microRNA A. Signature as prognostic biomarker in colorectal cancer by bioinformatics analysis. Front Oncol. 2019;9:1207. doi:10.3389/fonc.2019.01207
20. Li B, Pu K, Wu X. Identifying novel biomarkers in hepatocellular carcinoma by weighted gene co-expression network analysis. J Cell Biochem. 2019. doi:10.1002/jcb.28420
21. Chou CH, Shrestha S, Yang CD, et al. miRTarBase update 2018: a resource for experimentally validated microRNA-target interactions. Nucleic Acids Res. 2018;46:D296–d302. doi:10.1093/nar/gkx1067
22. Xia J, Gill EE, Hancock RE. NetworkAnalyst for statistical, visual and network-based meta-analysis of gene expression data. Nat Protoc. 2015;10:823–844. doi:10.1038/nprot.2015.052
23. Gu C, Zhang Z, Yu Y, et al. Inhibiting the PI3K/Akt pathway reversed progestin resistance in endometrial cancer. Cancer Sci. 2011;102:557–564. doi:10.1111/j.1349-7006.2010.01829.x
24. Zhao S, Chen X, Lu X, et al. Epidermal growth factor receptor signaling enhanced by long-term medroxyprogesterone acetate treatment in endometrial carcinoma. Gynecol Oncol. 2007;105:45–54. doi:10.1016/j.ygyno.2006.12.014
25. McClelland RA, Barrow D, Madden TA, et al. Enhanced epidermal growth factor receptor signaling in MCF7 breast cancer cells after long-term culture in the presence of the pure antiestrogen ICI 182,780 (Faslodex). Endocrinology. 2001;142:2776–2788. doi:10.1210/endo.142.7.8259
26. Herman ME, Katzenellenbogen BS. Response-specific antiestrogen resistance in a newly characterized MCF-7 human breast cancer cell line resulting from long-term exposure to trans-hydroxytamoxifen. J Steroid Biochem Mol Biol. 1996;59:121–134. doi:10.1016/s0960-0760(96)00114-8
27. Murphy LC, Dotzlaw H, Wong MS, et al. Mechanisms involved in the evolution of progestin resistance in human breast cancer cells. Cancer Res. 1991;51:2051–2057.
28. Bai M, Yang L, Liao H, et al. Metformin sensitizes endometrial cancer cells to chemotherapy through IDH1-induced Nrf2 expression via an epigenetic mechanism. Oncogene. 2018;37:5666–5681. doi:10.1038/s41388-018-0360-7
29. Subramanian A, Tamayo P, Mootha VK, et al. Gene set enrichment analysis: a knowledge-based approach for interpreting genome-wide expression profiles. Proc Natl Acad Sci U S A. 2005;102:15545–15550. doi:10.1073/pnas.0506580102
30. Meng Q, Sun X, Wang J, et al. The important application of thioridazine in the endometrial cancer. Am J Transl Res. 2016;8:2767–2775.
31. Gu S, Ni T, Wang J, et al. CD47 blockade inhibits tumor progression through promoting phagocytosis of tumor cells by M2 polarized macrophages in endometrial cancer. J Immunol Res. 2018;2018:6156757. doi:10.1155/2018/6156757
32. Xu Y, Tong J, Ai Z, et al. Epidermal growth factor receptor signaling pathway involved in progestin-resistance of human endometrial carcinoma: in a mouse model. J Obstet Gynaecol Res. 2012;38:1358–1366. doi:10.1111/j.1447-0756.2012.01881.x
33. Shen ZQ, Zhu HT, Lin JF. Reverse of progestin-resistant atypical endometrial hyperplasia by metformin and oral contraceptives. Obstet Gynecol. 2008;112:465–467. doi:10.1097/AOG.0b013e3181719b92
34. Saad MJ, Santos A, Prada PO. Linking gut microbiota and inflammation to obesity and insulin resistance. Physiology (Bethesda). 2016;31:283–293. doi:10.1152/physiol.00041.2015
35. Luo L, Xia L, Zha B, et al. miR-335-5p targeting ICAM-1 inhibits invasion and metastasis of thyroid cancer cells. Biomed Pharmacother. 2018;106:983–990. doi:10.1016/j.biopha.2018.07.046
36. Jia Q, Ye L, Xu S, et al. Circular RNA 0007255 regulates the progression of breast cancer through miR-335-5p/SIX2 axis. Thorac Cancer. 2020;11(3):619–630. doi:10.1111/1759-7714.13306
37. Du W, Tang H, Lei Z, et al. miR-335-5p inhibits TGF-beta1-induced epithelial-mesenchymal transition in non-small cell lung cancer via ROCK1. Respir Res. 2019;20:225. doi:10.1186/s12931-019-1184-x
38. Gonzalez Dos Anjos L, de Almeida BC, Gomes de Almeida T, et al. Could miRNA signatures be useful for predicting uterine sarcoma and carcinosarcoma prognosis and treatment? Cancers (Basel). 2018;10. doi:10.3390/cancers10090315
39. Long HD, Ma YS, Yang HQ, et al. Reduced hsa-miR-124-3p levels are associated with the poor survival of patients with hepatocellular carcinoma. Mol Biol Rep. 2018;45:2615–2623. doi:10.1007/s11033-018-4431-1
40. Li H, Yang F, Hu A, et al. Therapeutic targeting of circ-CUX1/EWSR1/MAZ axis inhibits glycolysis and neuroblastoma progression. EMBO Mol Med. 2019;11:e10835. doi:10.15252/emmm.201910835
41. Yang Q, Lang C, Wu Z, et al. MAZ promotes prostate cancer bone metastasis through transcriptionally activating the KRas-dependent RalGEFs pathway. J Exp Clin Cancer Res. 2019;38:391. doi:10.1186/s13046-019-1374-x
42. Morimoto Y, Mizushima T, Wu X, et al. miR-4711-5p regulates cancer stemness and cell cycle progression via KLF5, MDM2 and TFDP1 in colon cancer cells. Br J Cancer. 2020;122:1037–1049. doi:10.1038/s41416-020-0758-1
43. Jibrim RLM, de Carvalho CV, Invitti AL, et al. Expression of the TFDP1 gene in the endometrium of women with deep infiltrating endometriosis. Gynecol Endocrinol. 2019;35:490–493. doi:10.1080/09513590.2018.1540569
44. Yue Y, Yuan Y, Li L, et al. Homeobox protein MSX1 inhibits the growth and metastasis of breast cancer cells and is frequently silenced by promoter methylation. Int J Mol Med. 2018;41:2986–2996. doi:10.3892/ijmm.2018.3468
45. Yue Y, Zhou K, Li J, et al. MSX1 induces G0/G1 arrest and apoptosis by suppressing Notch signaling and is frequently methylated in cervical cancer. Onco Targets Ther. 2018;11:4769–4780. doi:10.2147/ott.S165144
46. Bonito NA, Borley J, Wilhelm-Benartzi CS, et al. Epigenetic regulation of the homeobox gene MSX1 associates with platinum-resistant disease in high-grade serous epithelial ovarian cancer. Clin Cancer Res. 2016;22:3097–3104. doi:10.1158/1078-0432.Ccr-15-1669
47. Zhu J, Zeng Y, Li W, et al. CD73/NT5E is a target of miR-30a-5p and plays an important role in the pathogenesis of non-small cell lung cancer. Mol Cancer. 2017;16:34. doi:10.1186/s12943-017-0591-1
 © 2020 The Author(s). This work is published and licensed by Dove Medical Press Limited. The full terms of this license are available at https://www.dovepress.com/terms.php and incorporate the Creative Commons Attribution - Non Commercial (unported, v3.0) License.
By accessing the work you hereby accept the Terms. Non-commercial uses of the work are permitted without any further permission from Dove Medical Press Limited, provided the work is properly attributed. For permission for commercial use of this work, please see paragraphs 4.2 and 5 of our Terms.
© 2020 The Author(s). This work is published and licensed by Dove Medical Press Limited. The full terms of this license are available at https://www.dovepress.com/terms.php and incorporate the Creative Commons Attribution - Non Commercial (unported, v3.0) License.
By accessing the work you hereby accept the Terms. Non-commercial uses of the work are permitted without any further permission from Dove Medical Press Limited, provided the work is properly attributed. For permission for commercial use of this work, please see paragraphs 4.2 and 5 of our Terms.