")
Back to Journals » Diabetes, Metabolic Syndrome and Obesity » Volume 15
Identification and Validation of Hub Genes in Acute Pancreatitis and Hypertriglyceridemia
Authors Zhang S , Liang Z, Xiang X, Liu L, Yang H, Tang G
Received 23 November 2021
Accepted for publication 2 February 2022
Published 24 February 2022 Volume 2022:15 Pages 559—577
DOI https://doi.org/10.2147/DMSO.S349528
Checked for plagiarism Yes
Review by Single anonymous peer review
Peer reviewer comments 2
Editor who approved publication: Professor Ming-Hui Zou
Shiyu Zhang, Zhihai Liang, Xuelian Xiang, Li Liu, Huiying Yang, Guodu Tang
Department of Gastroenterology, The First Affiliated Hospital of Guangxi Medical University, Nanning City, Guangxi Province, People’s Republic of China
Correspondence: Guodu Tang, Department of Gastroenterology, The First Affiliated Hospital of Guangxi Medical University, 22 Shuangyong Road, Nanning City, Guangxi Province, People’s Republic of China, Tel +86 13739139408, Email [email protected]
Background: The pathogenesis of acute pancreatitis (AP) and the relationship between acute pancreatitis and hypertriglyceridemia are complex and not fully understood. The purpose of this study was to identify the hub genes along with common differentially expressed genes (DEGs) between acute pancreatitis and hypertriglyceridemia.
Methods: We downloaded three gene expression profiles of AP and one gene expression profile of hypertriglyceridemia from the Gene Expression Omnibus (GEO) database and filtered the DEGs based on the above four datasets. Next, we identified the hub genes by performing the Gene Ontology (GO) term analysis, Kyoto Encyclopedia of Genes and Genomes (KEGG) pathway enrichment analysis, and protein–protein interaction (PPI) construction. We also constructed the miRNA-hub gene network and established mouse models with hypertriglyceridemia and AP using a high-fat diet and injection of caerulein (CAE), respectively. Finally, the immunohistochemical analysis was used to verify the differential expressions of hub genes in AP, hypertriglyceridemia, and normal pancreatic tissue.
Results: A total of 105 DEGs associated with AP and 149 DEGs associated with hypertriglyceridemia were identified. Additionally, we identified six hub genes of AP, all of which were closely related to the cytoskeleton while two DEGs genes were common in both AP and hypertriglyceridemia. We also verified their expression in mouse models. Finally, a network of miRNA-mRNA was also constructed, and the top seven interactive miRNAs (hsa-mir-1– 3p, hsa-mir-5195– 3p, hsa-mir-145– 5p, hsa-let-7b-5p, hsa-mir-10b-5p, hsa-mir-206, and hsa-mir-613) targeting the most hub genes were identified.
Conclusion: Overall, we identified six hub genes associated with AP and two common DEGs associated with AP and hypertriglyceridemia along with seven miRNAs that may regulate AP. This study could provide new ideas for further elucidation of the pathogenesis of hypertriglyceridemia-induced acute pancreatitis in the future.
Keywords: acute pancreatitis, biomarkers, hypertriglyceridemia-induced pancreatitis, bioinformatics
Introduction
Acute pancreatitis (AP) is a common disease found in clinics, and requires urgent Hospital admission. The incidence of AP is increasing in recent years worldwide.1 The patients with AP increased from 1,727,789.3 to 2,814,972.3 between 1990 and 2019 in 204 countries and territories.2 Meanwhile, nearly 20% of AP patients will progress to moderate or severe acute pancreatitis.3 Severe AP is life-threatening and is one of the most common causes of morbidity and mortality in the world. The prevalence rate involves 40 cases per 100,000 adults per year in the United States.4
Gallstones, chronic alcohol abuse, hypertriglyceridemia are the major three etiologies of AP.6 Additionally, the percentage of hypertriglyceridemia-induced pancreatitis (HTGP) is rapidly rising,7,8 which ranks 2 in China.9,10 The complication rate observed in HTGP patients caused by other causes was significantly higher than that of the AP patients.11 Despite advances in treatment, no significant decline has been observed in the mortality rate of AP patients.12 Therefore, it is important to further explore the pathogenesis of AP, especially HTGP.
With the progress of the Human Genome Project, gene microarray has been playing an increasingly important role in the identification of genes leading to various diseases and has already been widely used in disease diagnosis.13,14 Genetic changes also play an important role in the pathogenesis of AP12 and HTG,15 but so far, none have studied the common differential genes (DEGs) in hypertriglyceridemia and AP. CAE, a cholecystokinin analog, has been widely used to induce AP in vivo16 and in vitro.17–19 Animal models of hypertriglyceridemia can also be successfully induced using a high-fat diet.20 Therefore, it is feasible to identify differentially expressed genes associated with acute pancreatitis and hypertriglyceridemia by analyzing data related to these two diseases in online databases, and verifying the DEGs using vivo models.
In this study, three gene expression profiles of AP (GSE54129, GSE79973, and GSE13911) and one gene expression profile of hypertriglyceridemia (GSE1010) were downloaded from the Gene Expression Omnibus (GEO) database while the DEGs were filtered based on the above four datasets. Next, the Gene Ontology (GO) term analysis, Kyoto Encyclopedia of Genes and Genomes (KEGG) pathway enrichment analysis, and protein–protein interaction (PPI) construction were performed to identify the hub genes. The miRNA-hub gene network was also constructed, and mouse models of hypertriglyceridemia and AP were established using a high-fat diet and injection of CAE, respectively. Finally, immunohistochemistry was used to verify the differential expression of hub genes in AP, hypertriglyceridemia, and normal pancreatic tissue.
Materials and Methods
Downloading and Processing of the Data
Three microarray datasets of AP (GSE3644, GSE121038, and GSE65146) and one microarray dataset of hypertriglyceridemia (GSE1010) were downloaded from the GEO (https://www.ncbi.nlm.nih.gov/gds/, accessed time: May 16, 2021) and preprocessed using GEOquery21 and affy22 R packages, respectively. These datasets included the samples of AP or hypertriglyceridemia and their corresponding controls.
Identification of DEGs
In the case of the multiple probe sets corresponding to the same gene, the mean value of the expression of those probe sets was calculated. After the probe ID was converted to gene symbol, the differential analysis was performed using the Limma package23 of R software. The fold-change was regarded as significant with adjusted P <0.05 and with threshold values >1.0 or <−1.0. Additionally, the expression of DEGs was visualized through packages pheatmap and ggplot2 of R software.
Functional Enrichment Analysis
The Database for Annotation, Visualization and Integrated Discovery (DAVID) (version 6.8, https://david.ncifcrf.gov/, accessed time: May 25, 2021) can provide a comprehensive set of functional annotation tools for investigators to understand the biological meaning behind a large list of genes. We submitted the upregulated and downregulated DEGs to the DAVID online program and performed the GO and KEGG enrichment analyses. Next, we visualized the genes using the ggplot2 package of R software, where P<0.05 was considered statistically significant.
Construction and Module Analysis of PPI Network of the DEGs
The PPI network analysis was performed using the Search Tool for the Retrieval of Interacting Genes/Proteins (STRING; https://string-db.org/, accessed time: May 26, 2021) with an interaction score > 0.4. Furthermore, the interaction network between the DEGs and their related genes was presented with the minimum number of two interactions. We used Cytoscape software (version 3.8.2) to visualize the PPI network and analyzed the main modules of the PPI network using the MCODE plugin of Cytoscape. The connectivity scores were calculated using the Cytoscape plugin cytoHubba, and the top six genes were defined as the hub genes.
Validation of Expression of the Hub Genes in Different Human Organs
The genotype-tissue expression (GTEx) project is an open access database containing gene expression levels in 328 healthy human pancreatic tissues (https://www.gtexportal.org/home/, accessed time: May 28, 2021). We applied this online tool to evaluate the RNA expression level of hub genes in different human organs, especially in the pancreas. After entering the database and searching the gene name in the expression module, the average mRNA expression level of the gene in different tissues can be viewed.
Construction of miRNA-Hub Gene Network
The related miRNAs of the six hub genes were predicted through visualization by the CyTargetLinker plugin of Cytoscape software (version 3.8.2). Next, the centrality of networks (degree, betweenness, and closeness) was analyzed, and the hub miRNAs were identified using the CytoNCA plugin.
Animals
Twenty-four C57BL/6J male mice, aged 4-weeks, were purchased from Changsha Tianqin Co., LTD (Changsha, Hunan, China) and were randomly divided into the following three groups: the control group, HTG group, and AP group. All mice were kept in a temperature-controlled room, fed freely, and maintained under a humidity of 50–60% with 12-hour light/12-hour dark cycles. Mice in the HTG group were fed a high-fat diet (12451, Boaigang, China), while mice in the non-HTG group were fed a regular diet. When mice were 8-weeks old, AP was induced through seven intraperitoneal injections of CAE (EYS113, Amquar, USA) administered at a dose of 50 µg/kg at an interval of 1 h. Simultaneously, the mice in the control group were injected with the same amount of normal saline. After 24 h of the last injection, blood was collected from the inferior vena cava along with the pancreatic tissues. The obtained blood was used for subsequent detection of triglyceride and amylase levels, while the pancreatic tissue was used for HE and immunohistochemical staining.
Detection of Triglyceride and Serum Amylase in Mice
The venous blood of mice was kept at 26 °C for 2 h and then centrifuged (4 °C, 3000 RPM, 15 min). The supernatant was collected for subsequent detection. We used a triglyceride detection kit (c061-a, Changchun Huili Biotech CO., LTD., Changchun, China) and an amylase detection kit (C033, Changchun Huili Biotech CO., LTD., Changchun, China) to detect the levels of triglyceride and serum amylase, respectively. The preparation of the detection reagent was carried out according to the instructions. After adding the detection reagent, the absorbance of the supernatant was read under the microplate reader. The final test results were statistically analyzed by an independent sample t-test using SPSS 23.0.
HE and Immunohistochemistry
Pancreatic tissues were immediately soaked in 4% paraformaldehyde solution for 12 h, and then embedded in paraffin, and sectioned (5 µm size). The tissue sections were stained with HE and observed under a microscope for pancreatic pathological scores. The pancreatic histopathological scoring criteria were based on the study of Van Laethem JL.24 The final pancreatic histopathological scores were statistically analyzed by an independent sample t-test. Dewaxing, hydration, and thermal repair were performed, and then the primary antibodies (ACTB, D110001, Sangong Biotech, 1:100; TPM1, D121373, Sangong Biotech, 1:100; DSTN, D222231, Sangong Biotech, 1:200; TPM4, D123959, Sangong Biotech, 1:50; WDR1, D225121, Sangong Biotech, 1:150, WSB1, D123579, Sangong Biotech, 1:50; FBXO4, bs-9087R, Beijing Bioss Biotech, 1:250) were added and incubated overnight at 4 °C. After incubating the tissues with HRP-labeled linked polymer (KIT-5009, MXB biotechnologies) for 40 min at 26 °C, the signal was detected using DAB (P0202, Beyotime). After statistical analysis, the expression of hub genes was measured using the Image-Pro Plus 6.0 and visualized using GraphPad Prism 8.0.
Results
Identification of DEGs
As shown in Figure 1, 105 DEGs, including 11 down-regulated genes (Figure 1A) and 94 upregulated genes (Figure 1B), were identified from the three microarray profile datasets (GSE121038, GSE3644, and GSE65146) (Table 1). In the three AP datasets and one hypertriglyceridemia dataset, we observed two common upregulated DEGs: WD repeat and SOCS box containing 1 (WSB1) and F-Box protein 4 (FBXO4) (Figure 1D), and no common downregulated DEGs (Figure 1C). Additionally, the volcano plots and heatmaps were generated to demonstrate the downregulated and upregulated genes in the GEO datasets (Figures 2 and 3).
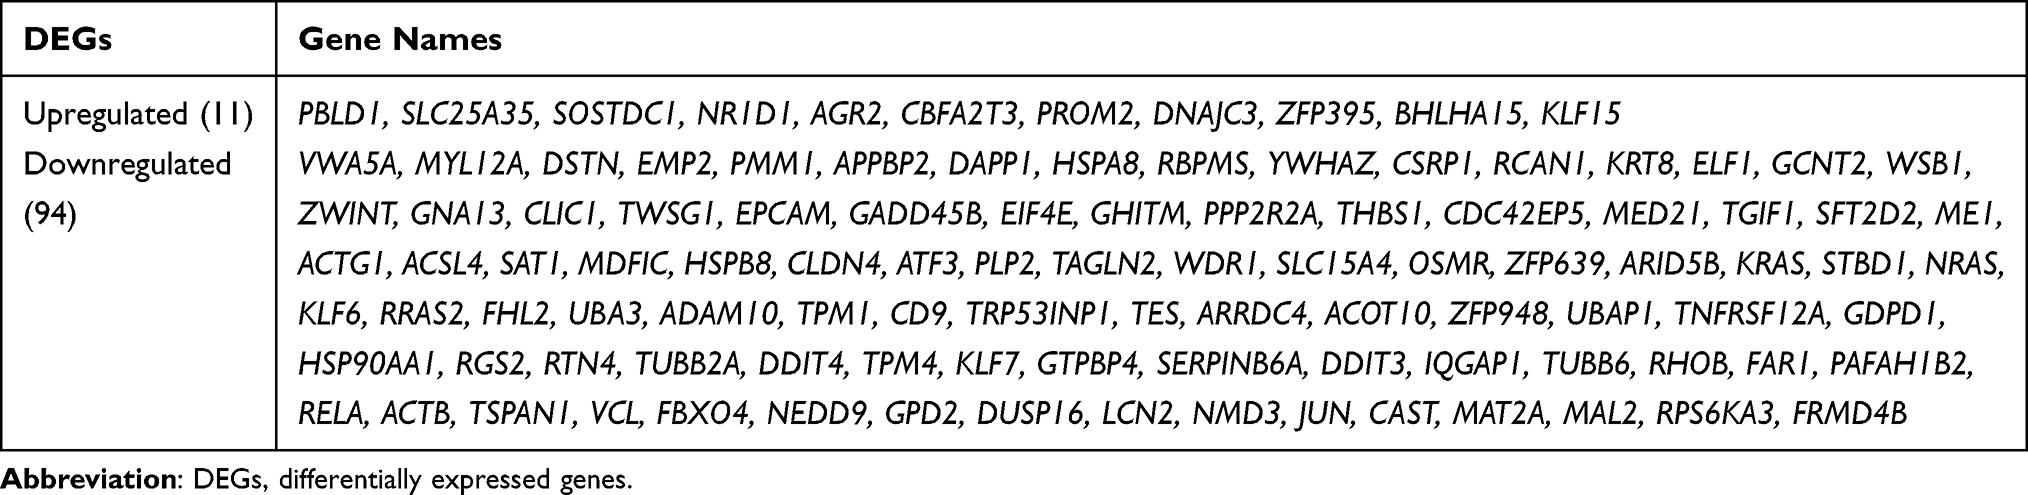 |
Table 1 The Detailed Information of the DEGs Identified from the Three Datasets of Acute Pancreatitis |
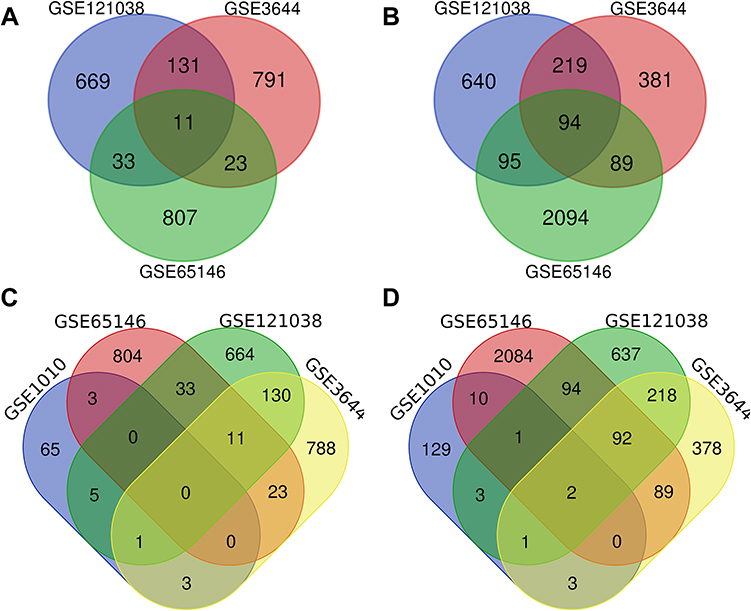 |
Figure 1 The Venn diagram of DEGs based on the datasets. The intersection of downregulated (A, C) and upregulated (B, D) DEGs were identified from the four datasets, namely, GSE1010, GSE121038, GSE3644, and GSE65146. DEGs, differentially expressed genes. |
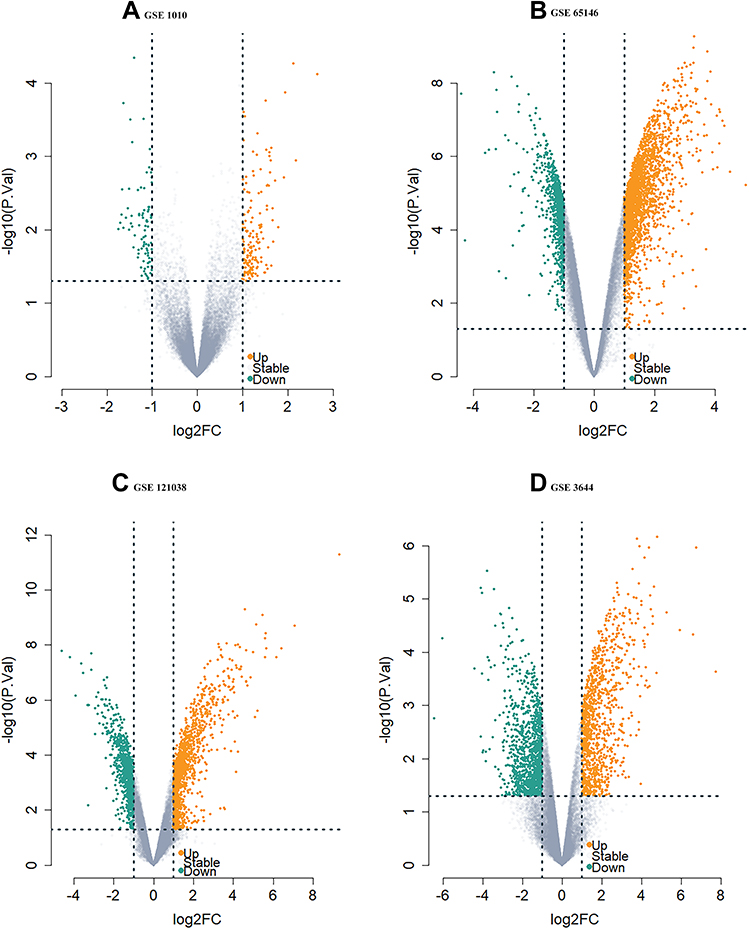 |
Figure 2 The Volcano plot distribution of DEGs. The volcano plot of (A) GSE1010, (B) GSE65146, (C) GSE121038, and (D) GSE3644. The green dots indicate the screened downregulated DEGs, Orange dots indicate the screened upregulated DEGs while the gray dots indicate genes with no significant differences. Abbreviation: DEGs, differentially expressed genes. |
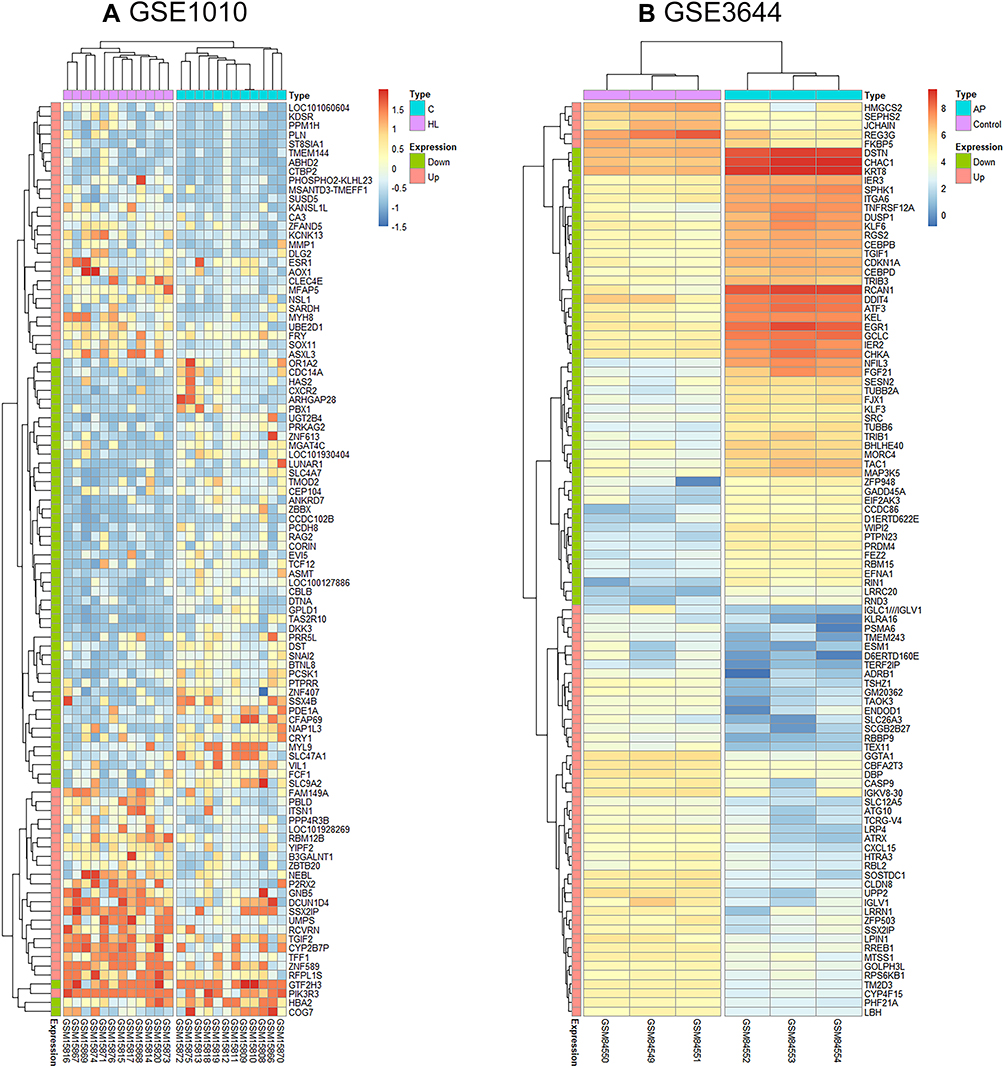 |
Figure 3 The heatmap of the top 50 DEGs from GSE1010 (A) and GSE3644 (B). Color change from red to blue indicates a gradual decrease in the expression level of the gene in the sample. |
Functional Enrichment Analysis
In the Biological Process (BP) category, the upregulated DEGs were involved in the movement of cells or subcellular components, locomotion, localization of cells, cell motility, and cell adhesion (Figure 4A), whereas the downregulated DEGs were significantly involved in the cellular responses to an organic substance, topologically incorrect protein and chemical stimulus along with endoplasmic reticulum unfolded protein response (Figure 4E). In the Cellular Component (CC) category, the upregulated DEGs were correlated with the focal adhesion, cell-substrate adherens junction, cell-substrate junction, adherens junction, and anchoring junction (Figure 4B). In the Molecular Function (MF) category, the upregulated DEGs were found to be enriched in the protein complex binding, cell adhesion molecule binding, macromolecular complex binding, and cadherin-and protein-binding involved in cell-cell adhesion (Figure 4C). In the KEGG pathway enrichment analysis, the upregulated DEGs were found to be enriched in the MAPK signaling pathway, regulation of the actin cytoskeleton, PI3K-Akt signaling pathway, oxytocin signaling pathway, and B-cell receptor signaling pathway (Figure 4D). Detailed results of the enrichment analysis for upregulated and downregulated DEGs are shown in Tables 2 and 3.
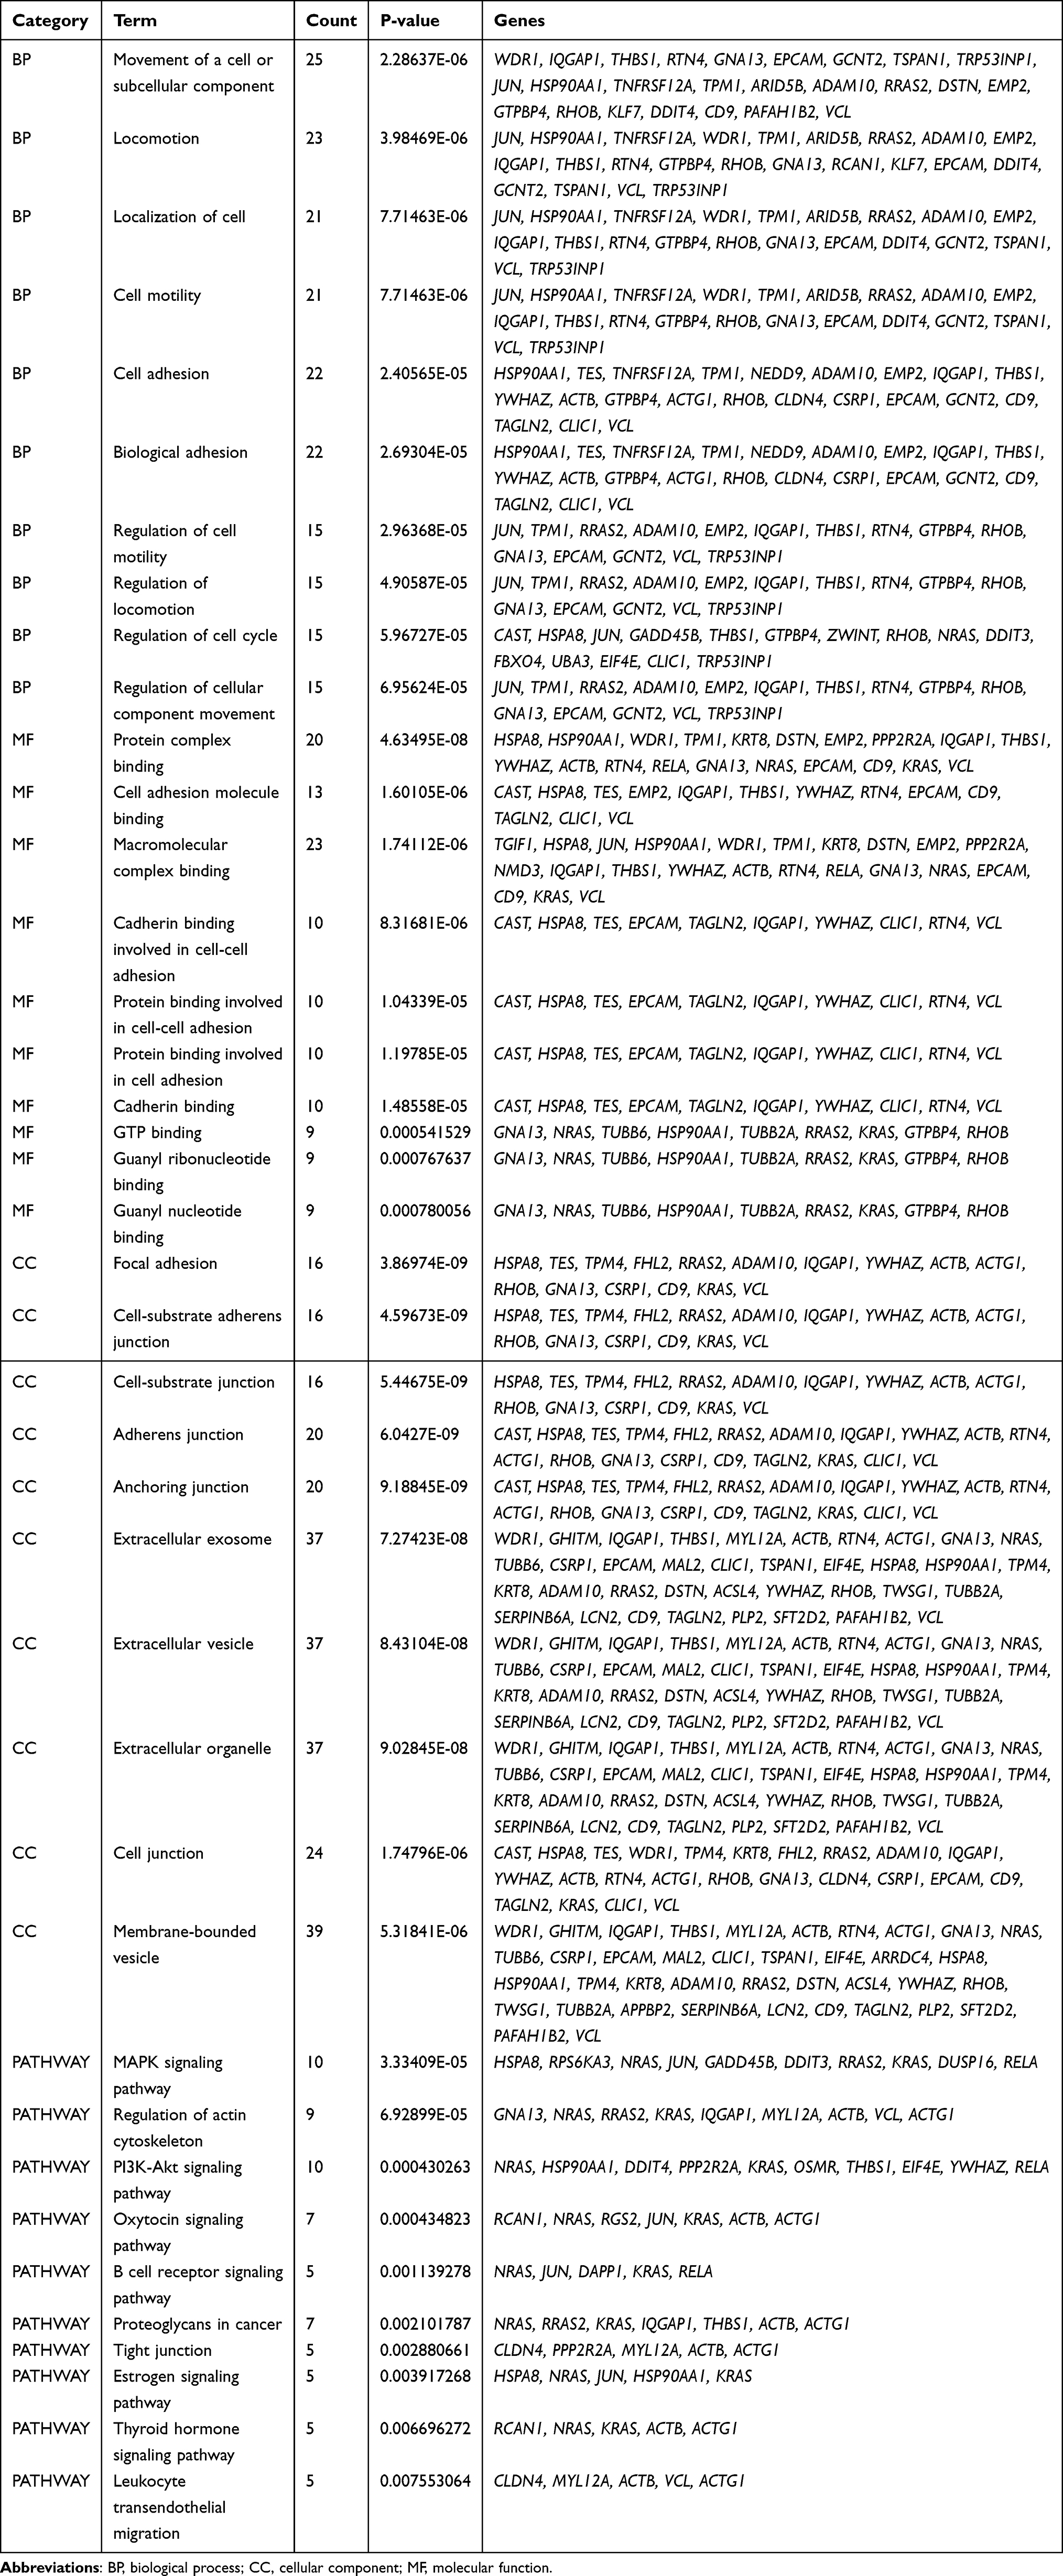 |
Table 2 Functional Enrichment Analysis of the Upregulated DEGs |
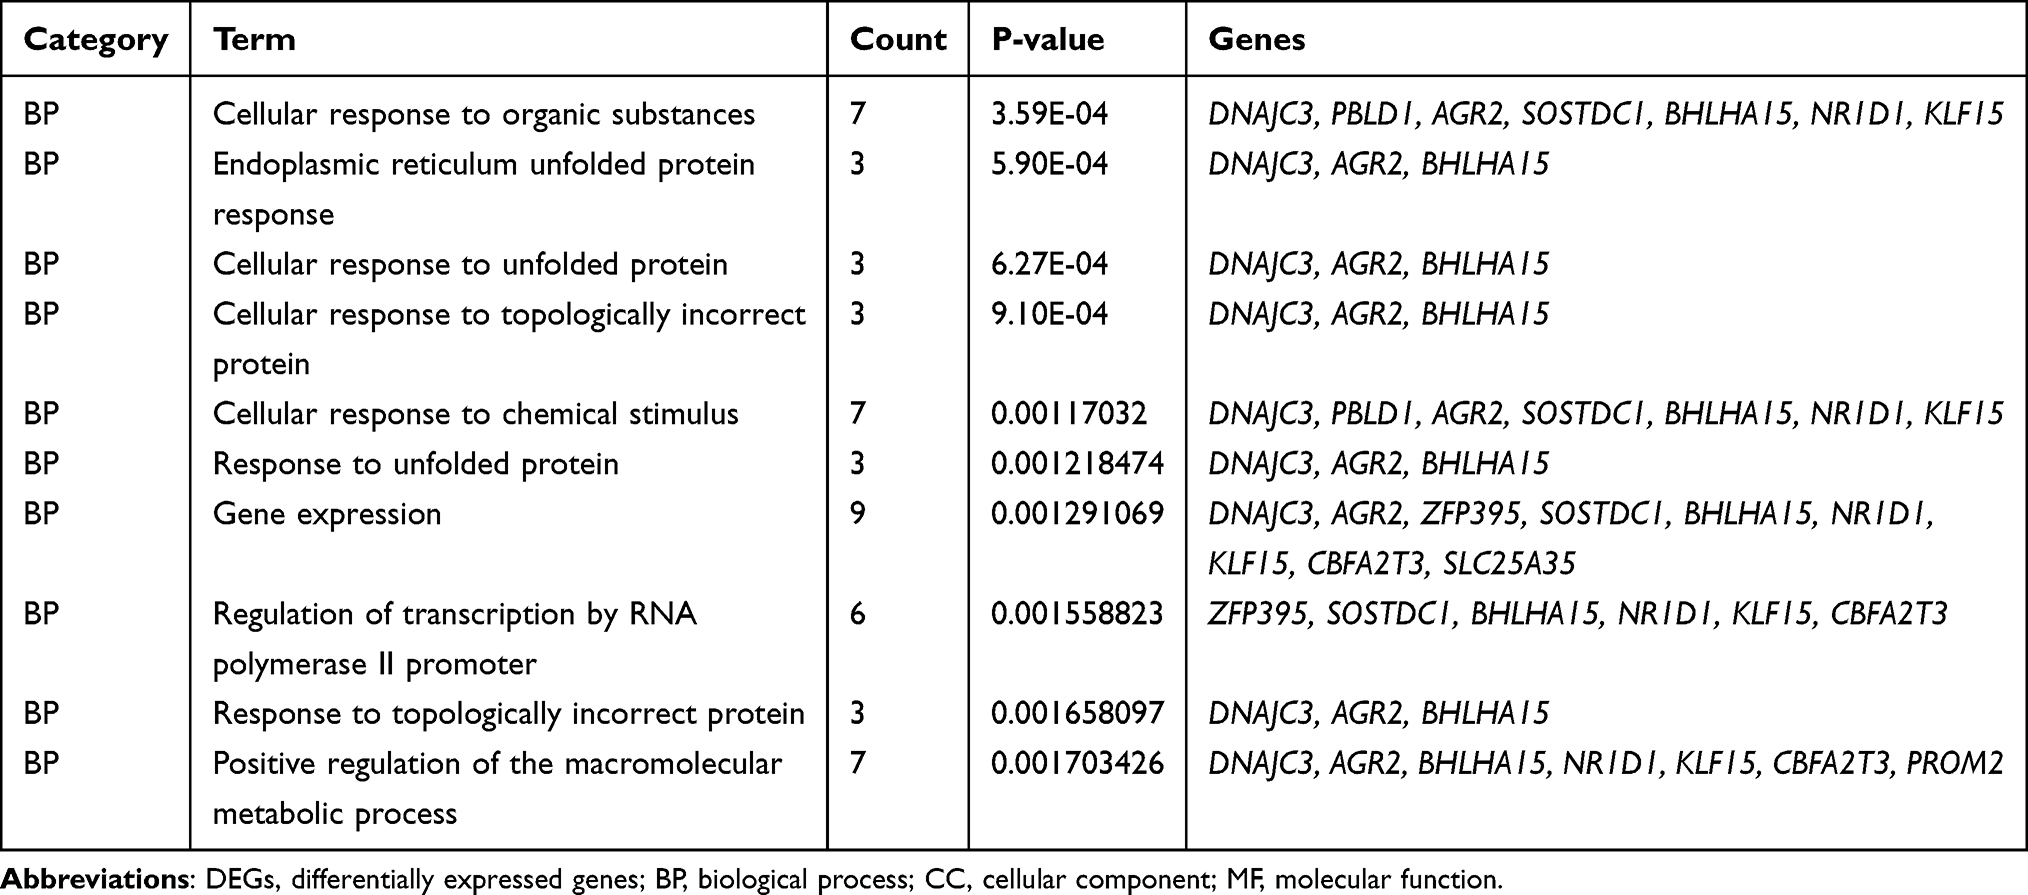 |
Table 3 Functional Enrichment Analysis of the Downregulated DEGs |
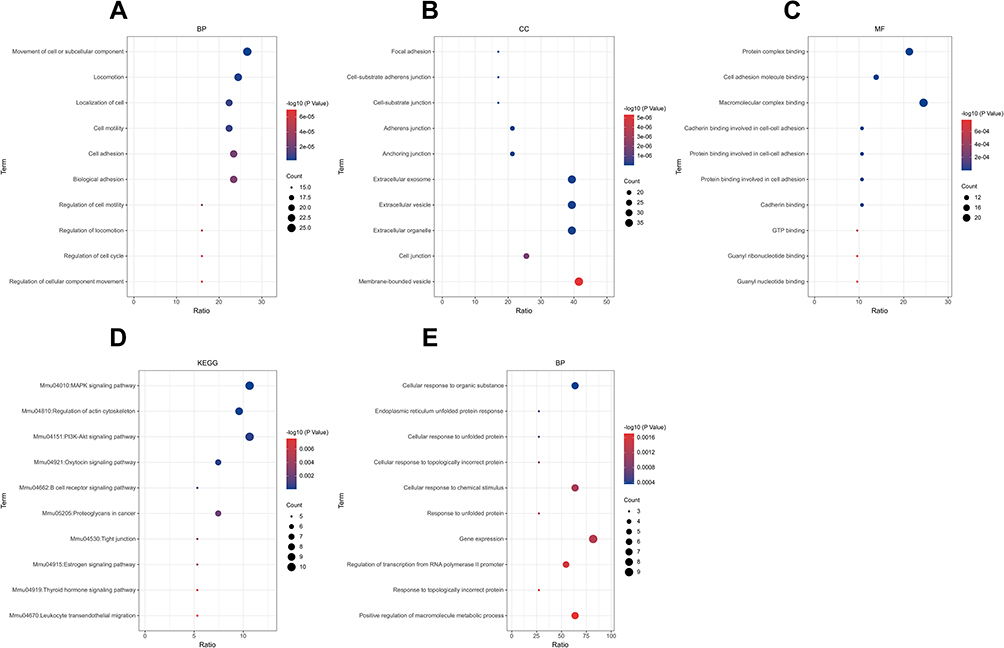 |
Figure 4 GO and KEGG enrichment analysis of upregulated (A–D) and downregulated DEGs (E). The red color indicates a lower P-value, while the blue color indicates a higher P-value. The larger the diameter of the dot, the greater the number of the genes enriched. Abbreviations: GO, Gene Ontology; BP, biological process; CC, cellular component; MF, molecular function; KEGG, Kyoto Encyclopedia of Genes and Genomes; DEGs, differentially expressed genes. |
Construction and Module Analysis of PPI Network of DEGs
A PPI network consisting of 105 points and 150 edges was constructed using the STRING online tool (PPI enrichment P-value <1.0e-16 (Figure 5). The results of further module analysis are shown in Figures 6A–D. The values of the MCODE score, the number of nodes and edges in each module were as follows: module 1 (Figure 6A), MCODE score = 6.286, 8 nodes and 22 edges; module 2 (Figure 6B), MCODE score = 3.714, 8 nodes and 13 edges; module 3 (Figure 6C), MCODE score = 3, 3 nodes and 3 edges; and module 4 (Figure 6D), MCODE score = 3, 3 nodes and 3 edges). A total of 6 AP-related hub genes were identified as follows: actin beta (ACTB), actin gamma 1 (ACTG1), tropomyosin 1 (TPM1), tropomyosin 4 (TPM4), destrin (DSTN), and WD repeat domain 1 (WDR1). As shown in Table 4, all the six identified hub genes were upregulated DEGs.
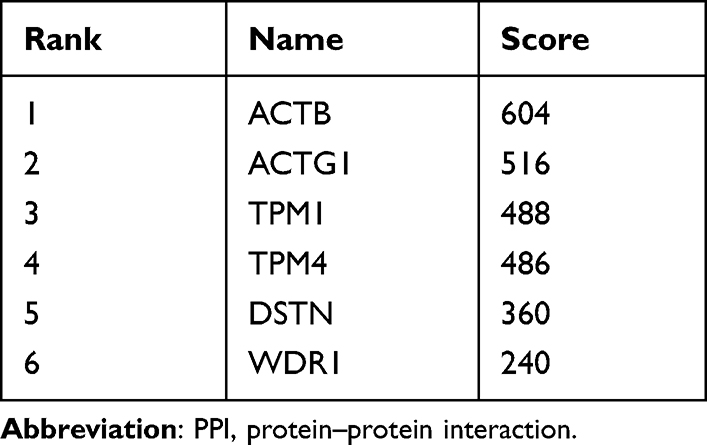 |
Table 4 The Top Six Hub Genes in the PPI Network as Ranked by the Degree Method |
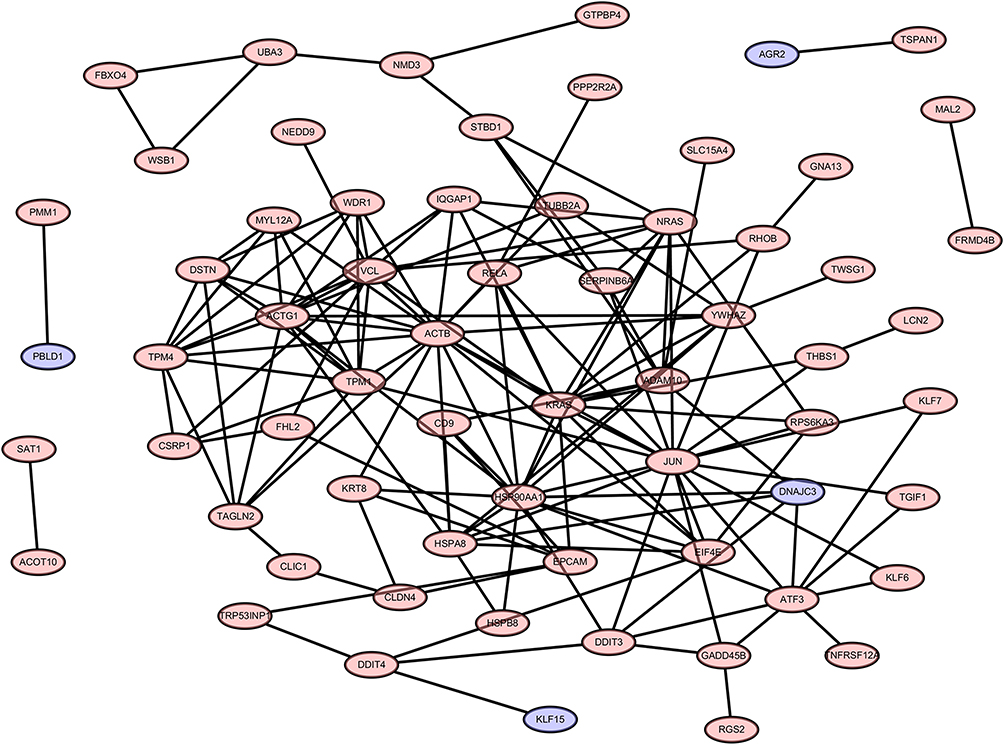 |
Figure 5 PPI network of 105 DEGs. The criteria of the PPI network are as follows: Confidence score ≥ 0.4 and a maximum number of interactions ≤ 5. Abbreviations: PPI, protein–protein interaction; DEGs, differentially expressed genes. |
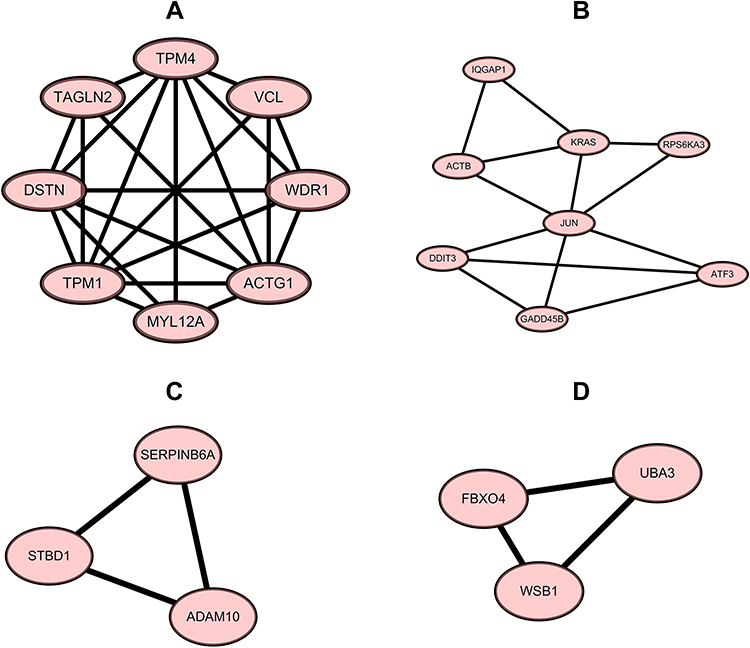 |
Figure 6 The top four modules of the PPI network. (A) module 1, MCODE score = 6.286, 8 nodes and 22 edges; (B) module 2, MCODE score = 3.714, 8 nodes and 13 edges; (C) module 3, MCODE score = 3, 3 nodes and 3 edges; (D) module 4, MCODE score = 3, 3 nodes and 3 edges. Abbreviation: PPI, protein–protein interaction. |
Expression of Hub Genes in Different Human Organs
As shown in Figure 7, the six hub genes were detected in human pancreatic tissue at different RNA expression levels. ACTG1 (Figure 7B, median TPM: 965.3) showed the highest expression level in the pancreas among all hub genes, followed by ACTB (Figure 7A, median TPM: 404.8), DSTN (Figure 7C, median TPM: 100.7), TPM1 (Figure 7D, median TPM: 39.52), and TPM4 (Figure 7E, median TPM: 28.53) while WDR1 (Figure 7F, median TPM: 17.52) showed the lowest levels of RNA expression. Additionally, the expression levels of all these hub genes in the pancreas were lower than those found in most other organs.
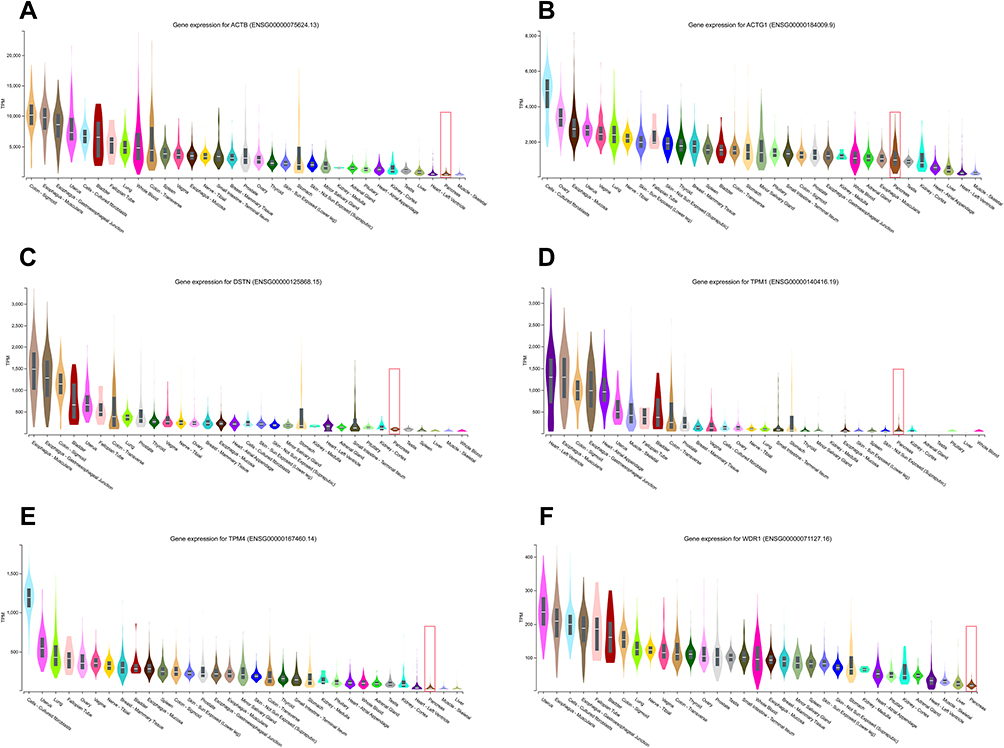 |
Figure 7 The comparison of the basic expression of the hub genes between the pancreas and other different human organs. ACTG1 (B, median TPM: 965.3) showed the highest expression level in the pancreas among all hub genes, followed by ACTB (A, median TPM: 404.8), DSTN (C, median TPM: 100.7), TPM1 (D, median TPM: 39.52), and TPM4 (E, median TPM: 28.53) while WDR1 (F, median TPM: 17.52) showed the lowest levels of RNA expression. |
Construction of miRNA-Hub Gene Network
We constructed a network consisting of six hub genes and 310 miRNAs using the CyTargetLinker plugin of Cytoscape software (Figure 8). Some miRNAs that regulate multiple genes are speculated to play an important role in the regulation of hub genes. The miRNA hsa-mir-1–3p was predicted to regulate ACTB, WDR1, TPM1, and TPM4; hsa-mir-5195–3p, hsa-mir-145–5p and hsa-let-7b-5p were predicted to regulate ACTB, ACTG1, and TPM4; hsa-mir-10b-5p was predicted to regulate ACTG1, TPM1, and TPM4; hsa-mir-206 and hsa-mir-613 were predicted to regulate ACTB, TMP4, and WDR1. Additionally, details of miRNAs regulating multiple hub genes are shown in Table 5.
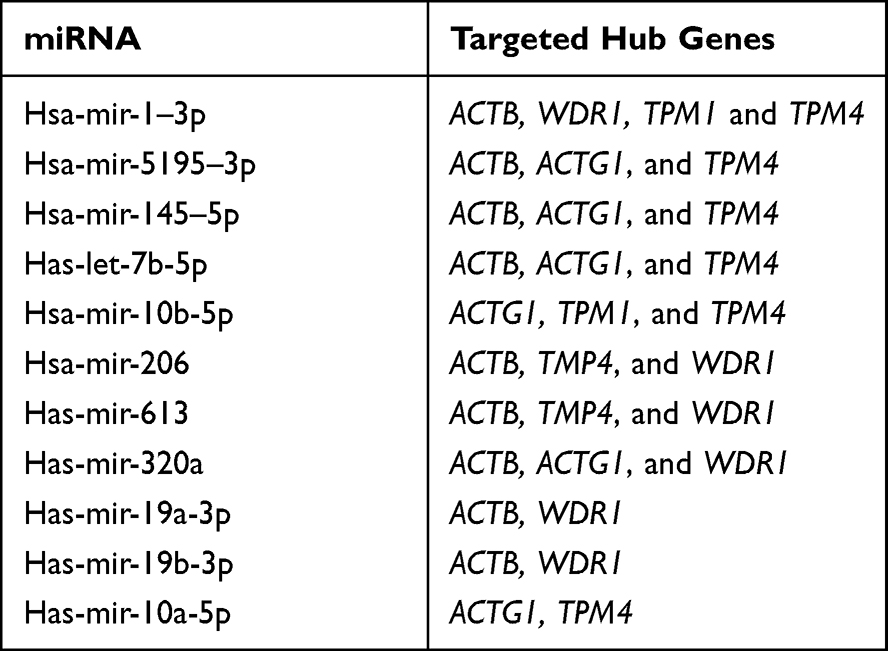 |
Table 5 Details of the miRNAs Regulating Multiple Hub Genes |
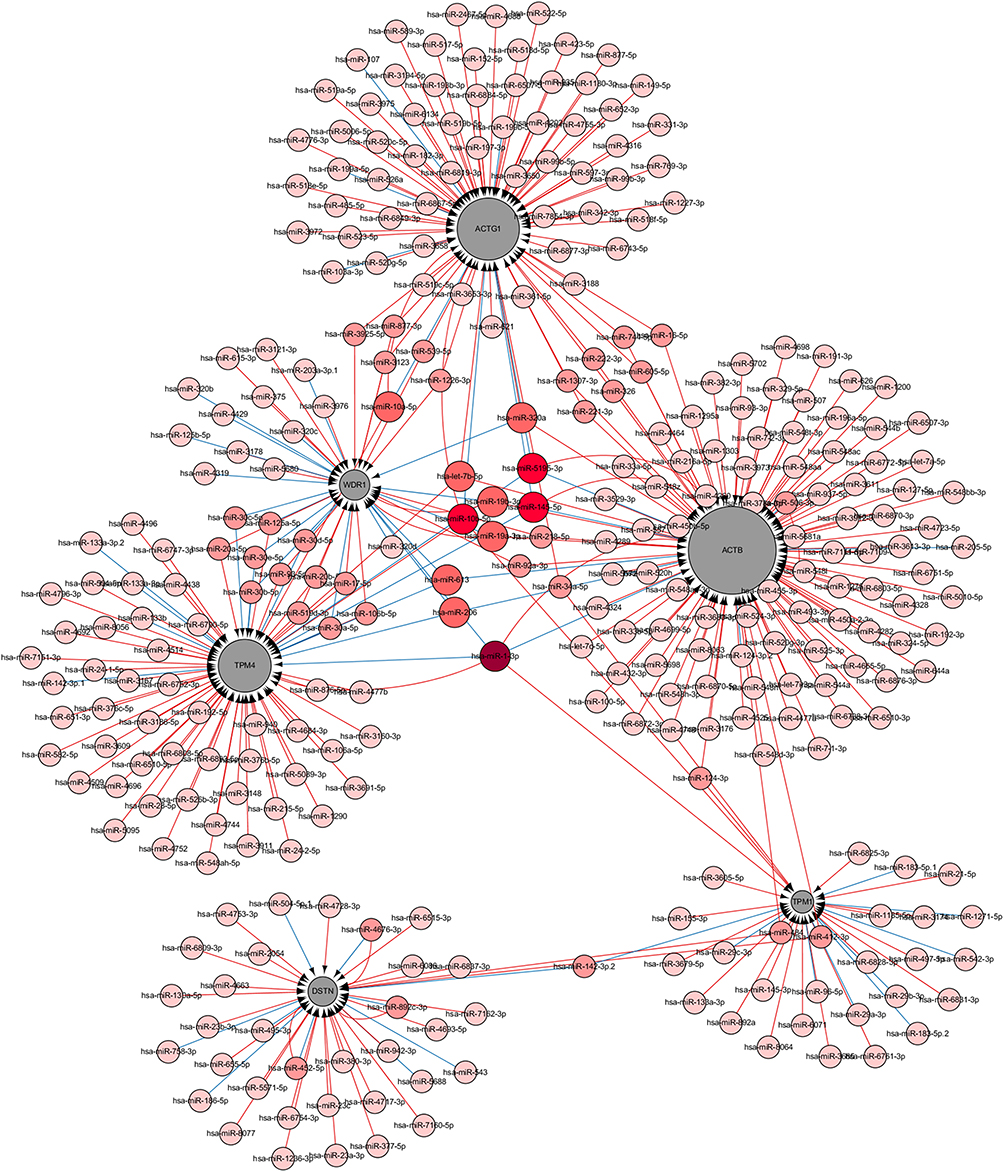 |
Figure 8 Interaction network between the hub genes and targeted miRNAs. Hub genes are presented in gray circles, whereas miRNAs are shown in red circles. The darker the color, the greater the number of hub genes involved in the regulation. The larger the gray circle, the more number of miRNAs regulating that gene. The interaction between the hub genes and related miRNAs is shown in the form of arrows. |
Detection of Triglyceride and Serum Amylase Levels in Mice
The serum triglyceride level in the TG group was significantly higher than that of the non-TG group (Figure 9A, HTG vs control, t = 5.019, P < 0.001; HTG vs AP, t = 5.338, P < 0.001). However, no significant difference was observed in amylase levels between AP and non-AP groups (Figure 9B, AP vs control, t = 0.819, P = 0.426; AP vs HTG, t = 1.774, P = 0.978).
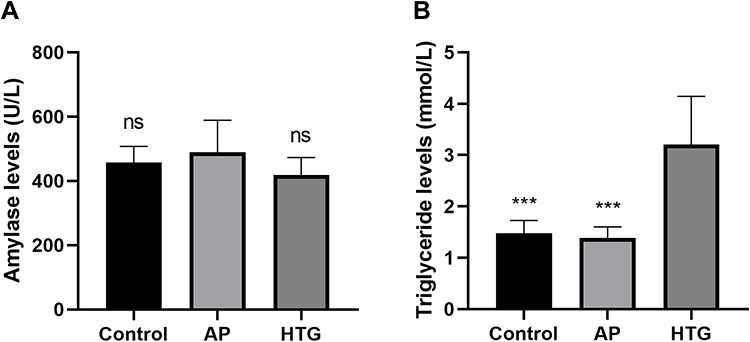 |
Figure 9 Differences in serum amylase and triglyceride levels among the groups. (A) No significant difference observed in serum amylase levels between AP and non-AP groups (AP vs control, t = 0.819, P = 0.426; AP vs HTG, t = 1.774, P = 0.978). (B) The serum triglyceride level in the HTG group was significantly higher than that of the non-HTG group (HTG vs control, t = 5.019, P <0.001; HTG vs AP, t = 5.338, P <0.001). ns, no significant difference; ***, P < 0.001. |
HE Staining and Pancreatic Histopathological Score
In the AP group, HE staining showed a large number of neutrophil infiltrates in the pancreatic tissue, obvious edema around the pancreatic lobules with significantly widened space between the lobules (Figure 10C). Pancreatic histopathological score in the AP group was significantly higher than that of the control group (Figure 10D, t = 29.95, P < 0.001) and HTG group (Figure 10D, t = 26.24, P < 0.001). However, no significant difference was observed between the control (Figure 10A and D) and HTG groups (Figure 10B and D, t = 1.143, P = 0.255).
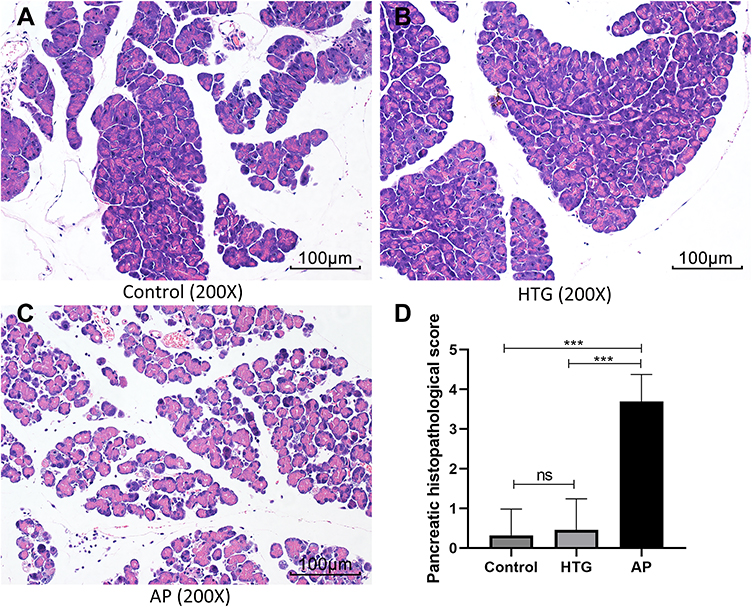 |
Figure 10 The HE staining of pancreatic tissues among different groups. Numerous neutrophil infiltrates, perilobular edema, and interlobular space was observed in the acute pancreatitis group (C) and not in the non-pancreatitis group (A, control; B, HTG). (D) The statistical results of pancreatic histopathological score. ns, no significant difference; ***, P < 0.001. |
Immunohistochemistry Staining
We verified the expression levels of five hub genes and two common DEGs by immunohistochemical staining (Figures 11 and 12). Microscopic images showed that the five hub genes in the AP group were significantly more stained than those in the control group (Figure 11A–J). Similarly, the staining degrees of two common DEGs in the AP and HTG groups were significantly higher than those in the control group (Figure 12A–F). Further, the statistical analysis showed significant differences among the groups (Figure 11K, ACTB, AP vs control, t = 22.02, P < 0.001; DSTN, AP vs control, t = 32.37, P < 0.001; TPM1, AP vs control, t = 17.71, P < 0.001; TPM4, AP vs control, t = 9.28, P < 0.0001; WDR1, AP vs control, t = 18.42, P < 0.0001; Figure 12G, FBXO4, HTG vs control, t = 22.54, P < 0.0001; WSB1, HTG vs control, t = 16.82, P<0.001; FBXO4, AP vs control, t = 30.38, P < 0.0001; WSB1, AP vs control, t = 23.87, P < 0.0001).
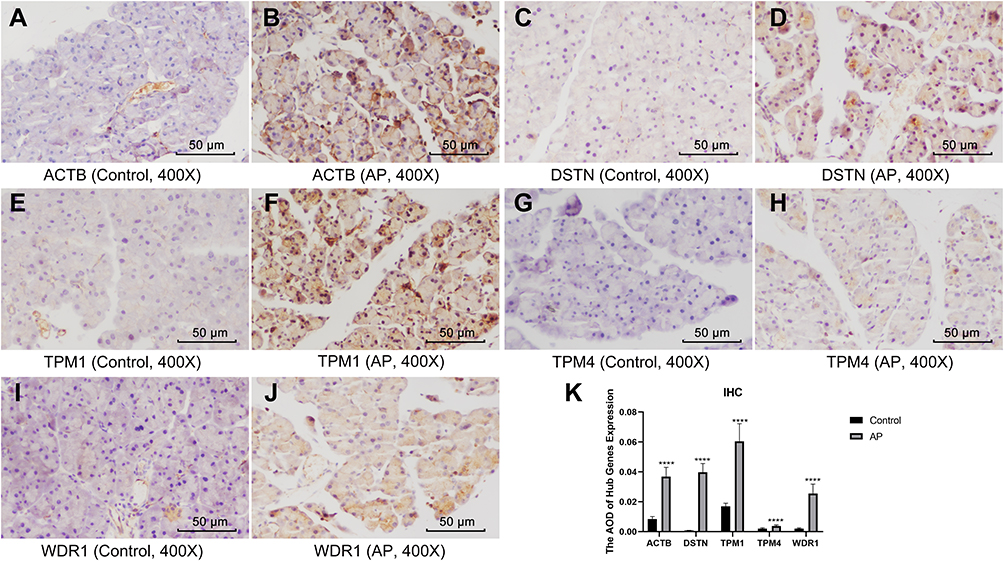 |
Figure 11 Immunohistochemistry and statistical results of the pancreas among different groups. (A–J) The five hub genes in the AP group were significantly more stained than those of the control group. (K) Statistical analysis results of the immunohistochemical staining, which is as follows: ACTB, AP vs control, t = 22.02, P < 0.001; DSTN, AP vs control, t = 32.37, P < 0.001; TPM1, AP vs control, t = 17.71, P < 0.001; TPM4, AP vs control, t = 9.28, P < 0.0001; WDR1, AP vs control, t = 18.42, P < 0.0001. ****, P < 0.0001. |
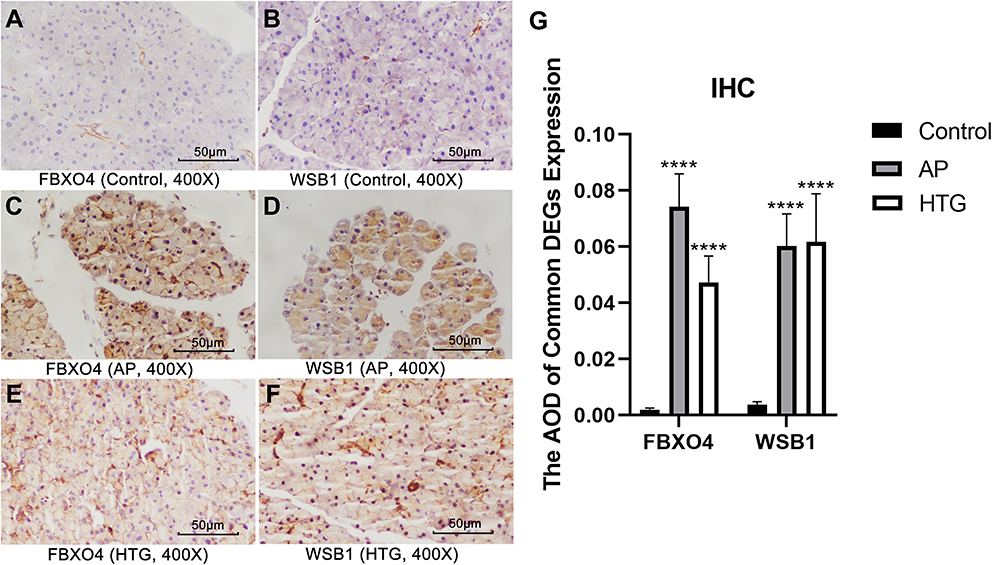 |
Figure 12 Immunohistochemistry and statistical results of the pancreas among different groups. (A–G) The expression of FBXO4 and WSB1 in AP group and HTG group was significantly higher than that in control group: FBXO4, HTG vs control, t = 22.54, P < 0.0001; WSB1, HTG vs control, t = 16.82, P<0.001; FBXO4, AP vs control, t = 30.38, P < 0.0001; WSB1, AP vs control, t = 23.87, P < 0.0001. ****, P < 0.0001. |
Discussion
The worldwide incidence of AP is on the rise. Additionally, increasing evidence has been showing that in general, HTGP is more severe than AP of any other etiology, but the reasons for this are not clear.5,25 With the advancement of high-throughput sequencing, more and more diseases are being well explained at the genetic level. In recent years, bioinformatics research on the pathogenesis of tumors has made great progress. However, only a few bioinformatics studies are available on AP and hypertriglyceridemia.
HE staining showed that in the AP group, a large number of neutrophil infiltrates were found in the pancreatic tissue along with obvious edema around the pancreatic lobules with significantly widened space between the lobules. The histopathological score of the AP group was significantly higher than that of the non-AP group, with a statistically significant difference. The serum triglyceride level in the HTG group was significantly higher than that of the non-TG group, with a statistically significant difference. In a study of AP conducted in mice by Xinnong Liu, serum amylase levels began to rise 6 h after the onset of the disease, which peaked at 12 h and dropped to normal levels at 24 h.26 Our study showed that in the CAE-induced AP mouse model, no significant difference was observed in the serum amylase level after 24 h of the onset of disease in normal mice, which was also consistent with Xinnong Liu’s study. These results confirmed the validity of the CAE-induced AP model as well as the high-fat diet-induced hypertriglyceridemia model in mice.
In this study, 105 DEGs were identified from the three microarray profile datasets of AP, including 11 downregulated and 94 upregulated genes in the AP tissues compared to the normal controls. Subsequently, functional enrichment analysis of the DEGs was performed using the David online tool. In the KEGG pathway enrichment analysis, the upregulated DEGs were found to be enriched in the MAPK signaling pathway, regulation of actin cytoskeleton, and PI3K-Akt signaling pathway. The MAPK-activated protein kinase (MK2) is a key enzyme, which is closely related to p38 and is associated with inflammation.27 MK2 knockout mice show protection from a wide range of inflammatory/autoimmune diseases, including arthritis, pulmonary inflammation, and myocardial ischemia.28–30 P38 MAPK is a signaling molecule downstream of a proinflammatory cytokine receptor, which mediates proinflammatory cytokine synthesis by regulating both transcription and post-transcriptional modification.31 The inhibition of the MAPK signaling pathway can alleviate lung injury caused by severe pancreatitis.32 However, whether the inhibition of MAPK signaling alleviates AP is unknown and needs further investigation.
The PPI network of the DEGs was constructed in AP based on the information obtained from the STRING database. The PPI network included 105 nodes and 150 edges, and its PPI enrichment P-value was found to be lower than 1.0e-16. The six hub genes showing the highest score (ACTB, ACTG1, TPM1, TPM4, DSTN, and WDR1) were up-regulated in the AP group compared to the normal pancreatic tissue, which was confirmed by immunohistochemistry. ACTB and ACTG1 encode β-actin and γ-actin, respectively. Both TPM1 and TPM4 are members of the tropomyosin family and are involved in the cytoskeletal composition of non-muscle cells. DSTN, also known as an actin-depolymerizing factor, is a member of the ADF family of actin-binding proteins. The main function of the DSTN is to cut the actin filaments (F-actin) and bind to actin monomers (G-actin), while the function of the gene WDR1 is mainly to induce depolymerization of the actin filaments. Changes in the actin cytoskeleton, including myosin activation, actin redistribution, and filamentous actin loss,33,34 can be observed in the early stages of CAE-induced AP.35 Our study verified that in the AP model induced byCAE, the functions of all up-regulated hub genes were closely related to the actin cytoskeleton, which indicated that the destruction of the actin cytoskeleton might play an important role in the pathogenesis of AP. More severe AP can be caused by the loss of polarity in the pancreatic acinar cells and disruption of the actin network;35 however, the exact mechanism needs to be clarified. Gene expression levels were evaluated by the online database HPA, and it was found that the expression levels of all hub genes were lower in pancreatic tissues compared to other organs. During the onset of AP, the expression levels of all the hub genes were significantly increased. This further suggested the importance of the role of the identified hub genes in the onset of AP.
In the three AP datasets and one hypertriglyceridemia dataset, two common up-regulated DEGs (WSB1 and FBXO4) were identified. These genes, WSB1 and FBXO4, are substrate recognition proteins within an E3 ubiquitin ligase, which can bind to diverse targets and mediate ubiquitinylation and proteolytic degradation.36,37 Most of the current studies on WSB1 and FBXO4 have focused on tumors but have not been reported in hypertriglyceridemia and AP. We used bioinformatics methods to screen common DEGs in hypertriglyceridemia and AP and found that WSB1 and FBXO4 were highly expressed in both diseases. This may provide a new idea for us to elucidate the pathogenesis of HTGP at the genetic level in the future.
The miRNAs are small non-coding RNAs that regulate gene expression by interfering with transcription or translation.38 To further predict miRNAs that might regulate hub genes, a miRNA-mRNA network was constructed. Some miRNAs (hsa-mir-1–3p, hsa-mir-5195–3p, hsa-mir-145–5p, hsa-let-7b-5p, hsa-mir-10b-5p, hsa-mir-206, and hsa-mir-613) that have been found to regulate multiple genes are speculated to play an important role in the regulation of hub genes.
Conclusions and Limitations
First, we identified 105 DEGs and six hub genes (ACTB, ACTG1, TPM1, TPM4, DSTN, and WDR1) associated with AP. Also, we are the first ones to report the common DEGs (WSB1 and FBXO4) in hypertriglyceridemia and AP. Second, we have validated the expression of six hub genes and two common DEGs by immunohistochemistry. Interestingly, all hub genes were expressed at low levels in normal pancreatic tissues, but were significantly upregulated in AP pathogenesis, and all hub genes functioned in the actin cytoskeleton; hence, we believe that the changes in the actin cytoskeleton caused by these hub genes may have an important role in the pathogenesis of AP. Third, we identified several miRNAs that may regulate hub genes. However, our study has some shortcomings. Firstly, the main data of our study is derived from online databases, and our study also has a small sample size. Secondly, we only identified and validated the hub genes that may be associated with the pathogenesis of AP, along with exploring the common DEGs in AP and hypertriglyceridemia. However, their specific roles in the pathogenesis of acute AP and HTGP need further study. Thirdly, we did not construct HTGP mouse models to verify the differential expression of these genes, which is also one of the limitations of this study. Finally, due to the limited conditions, we could not verify the differential expression of all DEGs, which will be one of our future research works.
Data Sharing Statement
All data in the study is available from the submitting author, Shiyu Zhang.
Ethics Approval
The study has been approved by the Ethics Committee of the First Affiliated Hospital of Guangxi Medical University (No. 2021 KY-E-187), and followed the principles of ethical animal research outlined in the Basel Declaration and the ethical guidelines of the International Council for Laboratory Animal Science (ICLAS).
Consent for Publication
All authors agree to the publication of all texts, images and tables in this study.
Funding
All funding for this study was provided by the National Natural Science Foundation of China (81970558) and Guangxi Natural Science Foundation (2020GXNSFAA259095).
Disclosure
All authors report no conflicts of interest for this work and state that there is no potential conflict of interest in this research.
References
1. Roberts SE, Morrison-Rees S, John A, Williams JG, Brown TH, Samuel DG. The incidence and aetiology of acute pancreatitis across Europe. Pancreatology. 2017;17(2):155–165. doi:10.1016/j.pan.2017.01.005
2. Li CL, Jiang M, Pan CQ, Li J, Xu LG. The global, regional, and national burden of acute pancreatitis in 204 countries and territories, 1990–2019. BMC Gastroenterol. 2021;21(1):332. doi:10.1186/s12876-021-01906-2
3. Banks PA, Freeman ML. Practice guidelines in acute pancreatitis. Am J Gastroenterol. 2006;101(10):2379–2400. doi:10.1111/j.1572-0241.2006.00856.x
4. Carr RA, Rejowski BJ, Cote GA, Pitt HA, Zyromski NJ. Systematic review of hypertriglyceridemia-induced acute pancreatitis: a more virulent etiology? Pancreatology. 2016;16(4):469–476.
5. Zheng J, Wu J, Chen J, et al. Therapeutic effects of quercetin on early inflammation in hypertriglyceridemia-related acute pancreatitis and its mechanism. Pancreatology. 2016;16(2):200–210.
6. Yang AL, McNabb-Baltar J. Hypertriglyceridemia and acute pancreatitis. Pancreatology. 2020;20(5):795–800.
7. Banks PA, Bollen TL, Dervenis C, et al. Classification of acute pancreatitis–2012: revision of the Atlanta classification and definitions by international consensus. Gut. 2013;62(1):102–111.
8. Tai WP, Lin XC, Liu H, et al. A retrospective research of the characteristic of hypertriglyceridemic pancreatitis in Beijing, China. Gastroenterol Res Pract. 2016;2016:6263095.
9. Zhu Y, Pan X, Zeng H, et al. A study on the etiology, severity, and mortality of 3260 patients with acute pancreatitis according to the revised Atlanta classification in Jiangxi, China over an 8-year period. Pancreas. 2017;46(4):504–509.
10. Zheng Y, Zhou Z, Li H, et al. A multicenter study on etiology of acute pancreatitis in Beijing during 5 years. Pancreas. 2015;44(3):409–414. doi:10.1097/MPA.0000000000000273
11. Adiamah A, Psaltis E, Crook M, Lobo DN. A systematic review of the epidemiology, pathophysiology and current management of hyperlipidaemic pancreatitis. Clin Nutr. 2018;37(6Pt A):1810–1822. doi:10.1016/j.clnu.2017.09.028
12. Whitcomb DC. Genetic risk factors for pancreatic disorders. Gastroenterology. 2013;144(6):1292–1302. doi:10.1053/j.gastro.2013.01.069
13. Pfeifer SP. From next-generation resequencing reads to a high-quality variant data set. Heredity. 2017;118(2):111–124. doi:10.1038/hdy.2016.102
14. Owzar K, Barry WT, Jung SH, Sohn I, George SL. Statistical challenges in preprocessing in microarray experiments in cancer. Clin Cancer Res. 2008;14(19):5959–5966. doi:10.1158/1078-0432.CCR-07-4532
15. Wang YL, Xue F, Liu LZ, He ZH. Pathway analysis detect potential mechanism for familial combined hyperlipidemia. Eur Rev Med Pharmacol Sci. 2013;17(14):1909–1915.
16. Lerch MM, Gorelick FS. Models of acute and chronic pancreatitis. Gastroenterology. 2013;144(6):1180–1193. doi:10.1053/j.gastro.2012.12.043
17. Sun W, Chen Y, Li H, et al. Material basis and molecular mechanisms of Dachengqi decoction in the treatment of acute pancreatitis based on network pharmacology. Biomed Pharmacother. 2020;121:109656. doi:10.1016/j.biopha.2019.109656
18. Fu X, Li P, Yin W, et al. Overexpression of Nrf2 protects against lipopolysaccharide and cerulein-induced pancreatitis in vitro and in vivo. Pancreas. 2020;49(3):420–428. doi:10.1097/MPA.0000000000001501
19. Xue BH, Liu Y, Chen H, Sun Y, Yu WL. A novel function of IRF9 in acute pancreatitis by modulating cell apoptosis, proliferation, migration, and suppressing SIRT1-p53. Mol Cell Biochem. 2020;472(1–2):125–134. doi:10.1007/s11010-020-03791-x
20. Ochiai M, Nozaki T, Kato M, Ishihara KO. Camellia japonica seeds extract suppresses lipid-induced hypertriglyceridemia and fat accumulation in mice. J Oleo Sci. 2018;67(12):1563–1569. doi:10.5650/jos.ess18138
21. Davis S, Meltzer PS. GEOquery: a bridge between the Gene Expression Omnibus (GEO) and BioConductor. Bioinformatics. 2007;23(14):1846–1847. doi:10.1093/bioinformatics/btm254
22. Gautier L, Cope L, Bolstad BM, Irizarry RA. affy–analysis of Affymetrix GeneChip data at the probe level. Bioinformatics. 2004;20(3):307–315. doi:10.1093/bioinformatics/btg405
23. Ritchie ME, Phipson B, Wu D, et al. limma powers differential expression analyses for RNA-sequencing and microarray studies. Nucleic Acids Res. 2015;43(7):e47. doi:10.1093/nar/gkv007
24. Van Laethem JL, Marchant A, Delvaux A, et al. Interleukin 10 prevents necrosis in murine experimental acute pancreatitis. Gastroenterology. 1995;108(6):1917–1922. doi:10.1016/0016-5085(95)90158-2
25. Bosques-Padilla FJ, Vázquez-Elizondo G, González-Santiago O, et al. Hypertriglyceridemia-induced pancreatitis and risk of persistent systemic inflammatory response syndrome. Am J Med Sci. 2015;349(3):206–211. doi:10.1097/MAJ.0000000000000392
26. Liu X, Zhu Q, Zhang M, et al. Isoliquiritigenin ameliorates acute pancreatitis in mice via inhibition of oxidative stress and modulation of the Nrf2/HO-1 Pathway. Oxid Med Cell Longev. 2018;2018:7161592. doi:10.1155/2018/7161592
27. Kotlyarov A, Neininger A, Schubert C, et al. MAPKAP kinase 2 is essential for LPS-induced TNF-alpha biosynthesis. Nat Cell Biol. 1999;1(2):94–97. doi:10.1038/10061
28. Gorog DA, Jabr RI, Tanno M, et al. MAPKAPK-2 modulates p38-MAPK localization and small heat shock protein phosphorylation but does not mediate the injury associated with p38-MAPK activation during myocardial ischemia. Cell Stress Chaperones. 2009;14(5):477–489. doi:10.1007/s12192-009-0101-5
29. Hegen M, Gaestel M, Nickerson-Nutter CL, Lin LL, Telliez JB. MAPKAP kinase 2-deficient mice are resistant to collagen-induced arthritis. J Immunol. 2006;177(3):1913–1917. doi:10.4049/jimmunol.177.3.1913
30. Gorska MM, Liang Q, Stafford SJ, et al. MK2 controls the level of negative feedback in the NF-kappaB pathway and is essential for vascular permeability and airway inflammation. J Exp Med. 2007;204(7):1637–1652. doi:10.1084/jem.20062621
31. Yeung YT, Aziz F, Guerrero-Castilla A, Arguelles S. Signaling pathways in inflammation and anti-inflammatory therapies. Curr Pharm Des. 2018;24(14):1449–1484. doi:10.2174/1381612824666180327165604
32. Wu XM, Ji KQ, Wang HY, et al. microRNA-542-5p protects against acute lung injury in mice with severe acute pancreatitis by suppressing the mitogen-activated protein kinase signaling pathway through the negative regulation of P21-activated kinase 1. J Cell Biochem. 2019;120(1):290–304. doi:10.1002/jcb.27356
33. Torgerson RR, McNiven MA. The actin-myosin cytoskeleton mediates reversible agonist-induced membrane blebbing. J Cell Sci. 1998;111(Pt 19):2911–2922. doi:10.1242/jcs.111.19.2911
34. O’Konski MS, Pandol SJ. Effects of caerulein on the apical cytoskeleton of the pancreatic acinar cell. J Clin Invest. 1990;86(5):1649–1657. doi:10.1172/JCI114887
35. Tashiro M, Schäfer C, Yao H, Ernst SA, Williams JA. Arginine induced acute pancreatitis alters the actin cytoskeleton and increases heat shock protein expression in rat pancreatic acinar cells. Gut. 2001;49(2):241–250.
36. Chu X, Zhang T, Wang J, et al. Alternative splicing variants of human Fbx4 disturb cyclin D1 proteolysis in human cancer. Biochem Biophys Res Commun. 2014;447(1):158–164.
37. Haque M, Kendal JK, MacIsaac RM, Demetrick DJ. WSB1: from homeostasis to hypoxia. J Biomed Sci. 2016;23(1):61.
38. Chen L, Heikkinen L, Wang C, Yang Y, Sun H, Wong G. Trends in the development of miRNA bioinformatics tools. Brief Bioinform. 2019;20(5):1836–1852.
 © 2022 The Author(s). This work is published and licensed by Dove Medical Press Limited. The full terms of this license are available at https://www.dovepress.com/terms.php and incorporate the Creative Commons Attribution - Non Commercial (unported, v3.0) License.
By accessing the work you hereby accept the Terms. Non-commercial uses of the work are permitted without any further permission from Dove Medical Press Limited, provided the work is properly attributed. For permission for commercial use of this work, please see paragraphs 4.2 and 5 of our Terms.
© 2022 The Author(s). This work is published and licensed by Dove Medical Press Limited. The full terms of this license are available at https://www.dovepress.com/terms.php and incorporate the Creative Commons Attribution - Non Commercial (unported, v3.0) License.
By accessing the work you hereby accept the Terms. Non-commercial uses of the work are permitted without any further permission from Dove Medical Press Limited, provided the work is properly attributed. For permission for commercial use of this work, please see paragraphs 4.2 and 5 of our Terms.