")
Back to Journals » Journal of Inflammation Research » Volume 15
Identification and Validation of Autophagy-Related Genes in Sepsis-Induced Acute Respiratory Distress Syndrome and Immune Infiltration
Authors Sun M , Yang Q, Hu C, Zhang H, Xing L
Received 10 January 2022
Accepted for publication 29 March 2022
Published 5 April 2022 Volume 2022:15 Pages 2199—2212
DOI https://doi.org/10.2147/JIR.S355225
Checked for plagiarism Yes
Review by Single anonymous peer review
Peer reviewer comments 2
Editor who approved publication: Dr Monika Sharma
Mengfei Sun,1,* Qianqian Yang,2,* Chunling Hu,1 Hengchao Zhang,2 Lihua Xing1
1Department of Respiratory and Critical Care Medicine, The First Affiliated Hospital of Zhengzhou University, Zhengzhou, 450052, People’s Republic of China; 2Department of Erythrocyte Biology Laboratory, School of Life Sciences, Zhengzhou University, Zhengzhou, 450052, People’s Republic of China
*These authors contributed equally to this work
Correspondence: Lihua Xing, The First Affiliated Hospital of Zhengzhou University, No. 1 Jianshedong Road, Zhengzhou, Henan, 450052, People’s Republic of China, Tel/Fax +8613838095088, Email [email protected]
Purpose: Autophagy-related genes (ARGs) play an important role in the pathophysiology processes of sepsis-induced acute respiratory distress syndrome (ARDS). However, expression profiles of ARGs have rarely been used to explore the relationship between autophagy and sepsis-induced ARDS. Therefore, we aim to identify and validate the potential ARGs of sepsis-induced ARDS through bioinformatics analysis and experiment validation.
Methods: We downloaded GSE32707 data from the Gene Expression Omnibus (GEO) database. The potential differentially expressed genes (DEGs) and differentially expressed ARGs (DEARGs) of sepsis-induced ARDS were screened by R software. Then, we performed functional enrichment analyses to explore the potential biological functions of DEARGs and constructed protein–protein interaction (PPI) networks. Subsequently, correlation analysis and receiver operating characteristic (ROC) curve were used for the DEARGs. In addition, we estimated the proportions of 22 immune cell subsets by using CIBERSORT algorithm. Finally, RNA expression of seven DEARGs were validated by qRT-PCR in blood samples from sepsis-induced ARDS and healthy controls.
Results: We identified 28 DEARGs, including 11 up-regulated genes and 17 down-regulated genes, which were primarily involved in autophagy and apoptosis. Seven genes (BAG3, CTSD, ERBB2, MYC, PEA15, RAB24 and SIRT1) with AUC > 0.70 were considered possible to be sepsis-induced ARDS hub genes for ROC curve analysis. CIBERSORT results shown that sepsis-induced ARDS contained a higher proportion of naive CD4+ T cells, gamma delta T cells, monocytes, and neutrophils, and lower levels of CD8+ T cells, memory resting CD4+ T cells, follicular helper T cells were relatively lower. The results of qRT-PCR also demonstrated that the expression levels of BAG3, CTSD, ERBB2, MYC and SIRT1 in sepsis-induced ARDS patients and healthy controls had differences.
Conclusion: We identified an association between DEGs and immune infiltration in sepsis-induced ARDS and validated BAG3, CTSD, ERBB2, MYC and SIRT1 that may be have excellent diagnostic performance.
Keywords: autophagy, sepsis-induced ARDS, immune infiltration, bioinformatics analysis, Gene Expression Omnibus dataset
Introduction
Acute respiratory distress syndrome (ARDS) is an acute inflammatory lung injury characterized by rapidly progressing respiratory failure, pulmonary edema, diffuse alveolar damage, and inflammatory cell infiltration.1 Sepsis is a common risk factor for ARDS and patient prognosis is worsened when sepsis is present.2 Previous studies suggested that multiple plasma biomarkers, such as interleukin-6 (IL-6), interleukin-8 (IL-8), angiopoietin-2 (ANG-2), Kerbs von Lungren 6 antigen (KL-6), receptor for advanced glycation endproducts (RAGEs), and surfactant protein D (SP-D), had predictive value for ARDS prognosis.3–5 Accumulating evidence showed that several biological functions also are involved in the pathogenesis of sepsis-induced ARDS, including cell proliferation, apoptosis and autophagy.6–8 Among these biological functions, autophagy plays an essential roles in the development of sepsis-induced ARDS.
Autophagy (“self-eating”) is the process through which parts of the cell are degraded in the lysosome.9 In recent decades, there have been some signaling pathways, which have been reported to affect the biological functions of ARDS through autophagy. For instance, one previous study demonstrated that autophagy attenuates pulmonary inflammation, lung permeability and hypoxemia by downregulating NLR family pyrin domain containing 3 (NLRP3) and interleukin-1β (IL-1β) inflammatory vesicle activity in Lipopolysaccharide(LPS) and mechanical ventilation(MV)-induced acute lung injury(ALI) mouse models.10,11 In addition, autophagy activation participated in the pathophysiologic process of sepsis, and alleviated the cytokine excessive release and lung injury in sepsis.6 However, ARGs of sepsis-induced ARDS remain largely unknown and need to be further explored, which would provide us with potential biomarkers to treat ARDS.
In this study, we downloaded GSE32707 data from the Gene Expression Omnibus (GEO) database. Next, we identified the key DEARGs that are relevant for diagnosis, which may discriminate sepsis-induced ARDS patients from controls. Subsequently, we used CIBERSORT for the first time to analyze differences in the immune infiltration between sepsis-induced ARDS patients and controls in whole blood samples. Finally, the expression levels of DEARGs were further verified in sepsis-induced ARDS patients and healthy individuals.
Materials and Methods
Autophagy-Related Genes Datasets and Microarray Data
A total of 222 genes were obtained from The Human Autophagy Database (http://www.autophagy.lu/index.html). We extracted information from datasets downloaded from the Gene Expression Omnibus (GEO, https://www.ncbi.nlm.nih.gov/geo/). The GSE32707 gene expression profiles,12 obtained using the GPL10558 platform, contained 144 human blood samples, including 58 from patients with sepsis, 31 from patients with sepsis-induced ARDS, 21 from patients with systemic inflammatory response syndrome and 34 healthy controls. All patients were undergoing mechanical ventilation. The 21 systemic inflammatory response syndrome samples and 58 sepsis samples were excluded from our analysis. The normalize Between Arrays function in the limma package was applied to normalize all the gene expression profiles.13 All the analyses were performed using R software version 3.5.3. (https://www.r-project.org/). The workflow of the present study is shown in Figure 1.
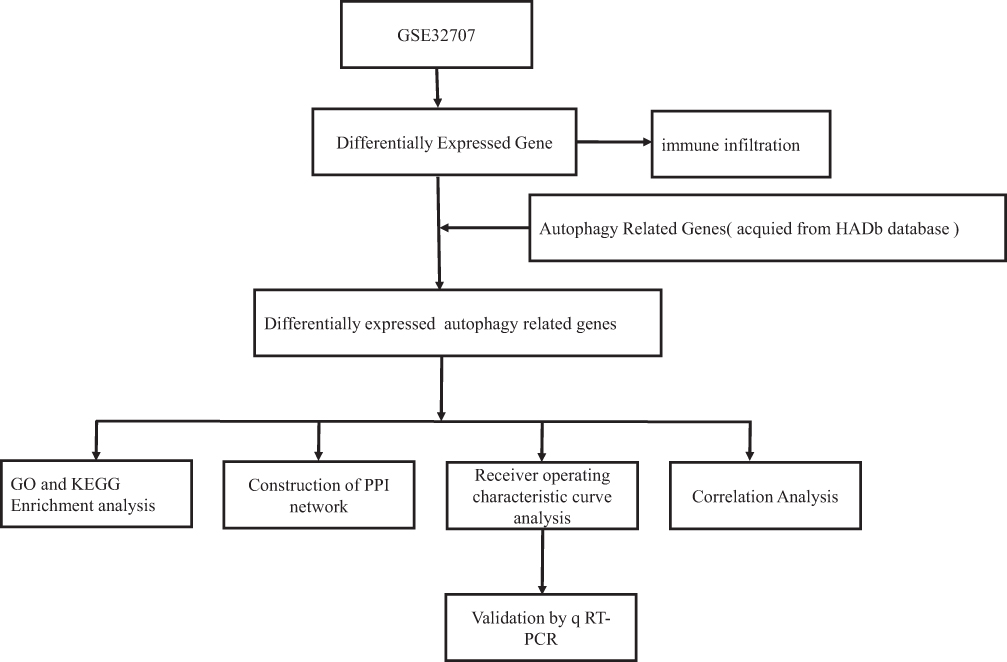 |
Figure 1 Workflow chart of the study. |
Differentially Expressed Analysis of Autophagy-Related Genes (DEARGs)
The normalized expression matrix of microarray data was downloaded from the GSE32707 dataset. Then the “limma” package of R software was used to identify the DEARGs. Genes with an adjusted P-value <0.05 and absolute fold-change value >1.5 were considered as differentially expressed genes. The volcano plot, heatmap and box plot were conducted using “ggplot2” and “heatmap” packages of R software.
GO and KEGG Pathway Enrichment Analysis of Autophagy-Related Genes
GO and KEGG pathway enrichment analysis were conducted in R software using the package “clusterProfiler”. The GO analysis consisted of cellular component (CC), biological process (BP) and molecular function (MF).
Correlation Analysis and PPI Analysis of the Differentially Expressed Autophagy-Related Genes
The correlation analysis of the DEARGs was identified using Spearman correlation in the “corrplot” package of R software. PPI analysis of the DEARGs was analyzed using STRING database (https://string-db.org/) and Cytoscape software (version 3.5.1).
Receiver Operating Characteristic (ROC) Curve Analysis
The receiver operating characteristic curves (ROCs) were performed to calculate the area under the curve (AUC) on screened DEARGs which their diagnostic value were assessed using ROC curve analysis with the p ROC software package in R.14
Estimation of Immune Cell Subtype Distribution
The CIBERSORT algorithm was used to transform the normalized gene expression value into the component of peripheral blood immune cells with the LM22 reference signature matrix set at 1000 permutations.15 We retained the CIBERSORT output and calculated the percentage of immune cell subtypes in all samples. We applied CIBERSORT to characterize the immune cells in sepsis-induced ARDS and control samples. In R we used box plots to depict the infiltration levels of immune cells from different subpopulations between the two groups.
ARDS Patients and Healthy Individuals
A total of 6 sepsis-induced ARDS patients (cases) and 6 age and sex-matched healthy individuals (controls) were obtained from the First Affiliated Hospital of Zhengzhou University between October 2021 and November 2021. Sepsis-induced ARDS was defined according to the Berlin consensus definition.16 Sepsis was defined according to standard criteria.17 The 6 healthy individuals were recruited from the hospital’s health checkup center. This study was conducted in accordance with the Declaration of Helsinki and approved by the Medical Ethics Committee of the hospital. Written informed consent was obtained from all the participants. Venous blood was collected from all cases and controls who participated in the study.
RNA Extraction and Quantitative Real-Time Polymerase Chain Reaction (qRT-PCR)
The blood samples from each participant were processed to isolate peripheral blood mononuclear cells (PBMCs) using Ficoll solution (Solarbio Life Sciences, Beijing, China). Total RNA was extracted from PBMCs with RNA Extraction Kit (TRIzon Reagent, Shanghai, China). Reverse transcription was conducted using Prime Script RT Master Mix Kit (Takara, Dalian, China). The mRNA level was assessed using TB Green Premix Ex Taq Kit (Takara, Dalian, China) following the instructions. Relative expression levels were normalized to GAPDH. Primers are available in Supplementary Table S1. The relative expression of mRNA was calculated by 2−ΔΔCt method with the normalization to GAPDH.
Results
Identification of DEARGs Between Normal and Sepsis-Induced ARDS
We analyzed the expression of 222 ARGs in 31 sepsis-induced ARDS patients and 34 healthy individuals, and 28 ARGs were identified using the criteria of adjusted P-value <0.05 and absolute fold-change value >1.5, including 11 up-regulated genes and 17 down-regulated genes (Table 1). Following the analysis of the GSE32707 dataset with R software, the 28 DEARGs between sepsis-induced ARDS and normal groups were presented in volcano plot and heatmap (Figure 2A and B). Moreover, box plots showed the expression patterns of 28 DEARGs between ARDS and normal samples (Figure 3A and B).
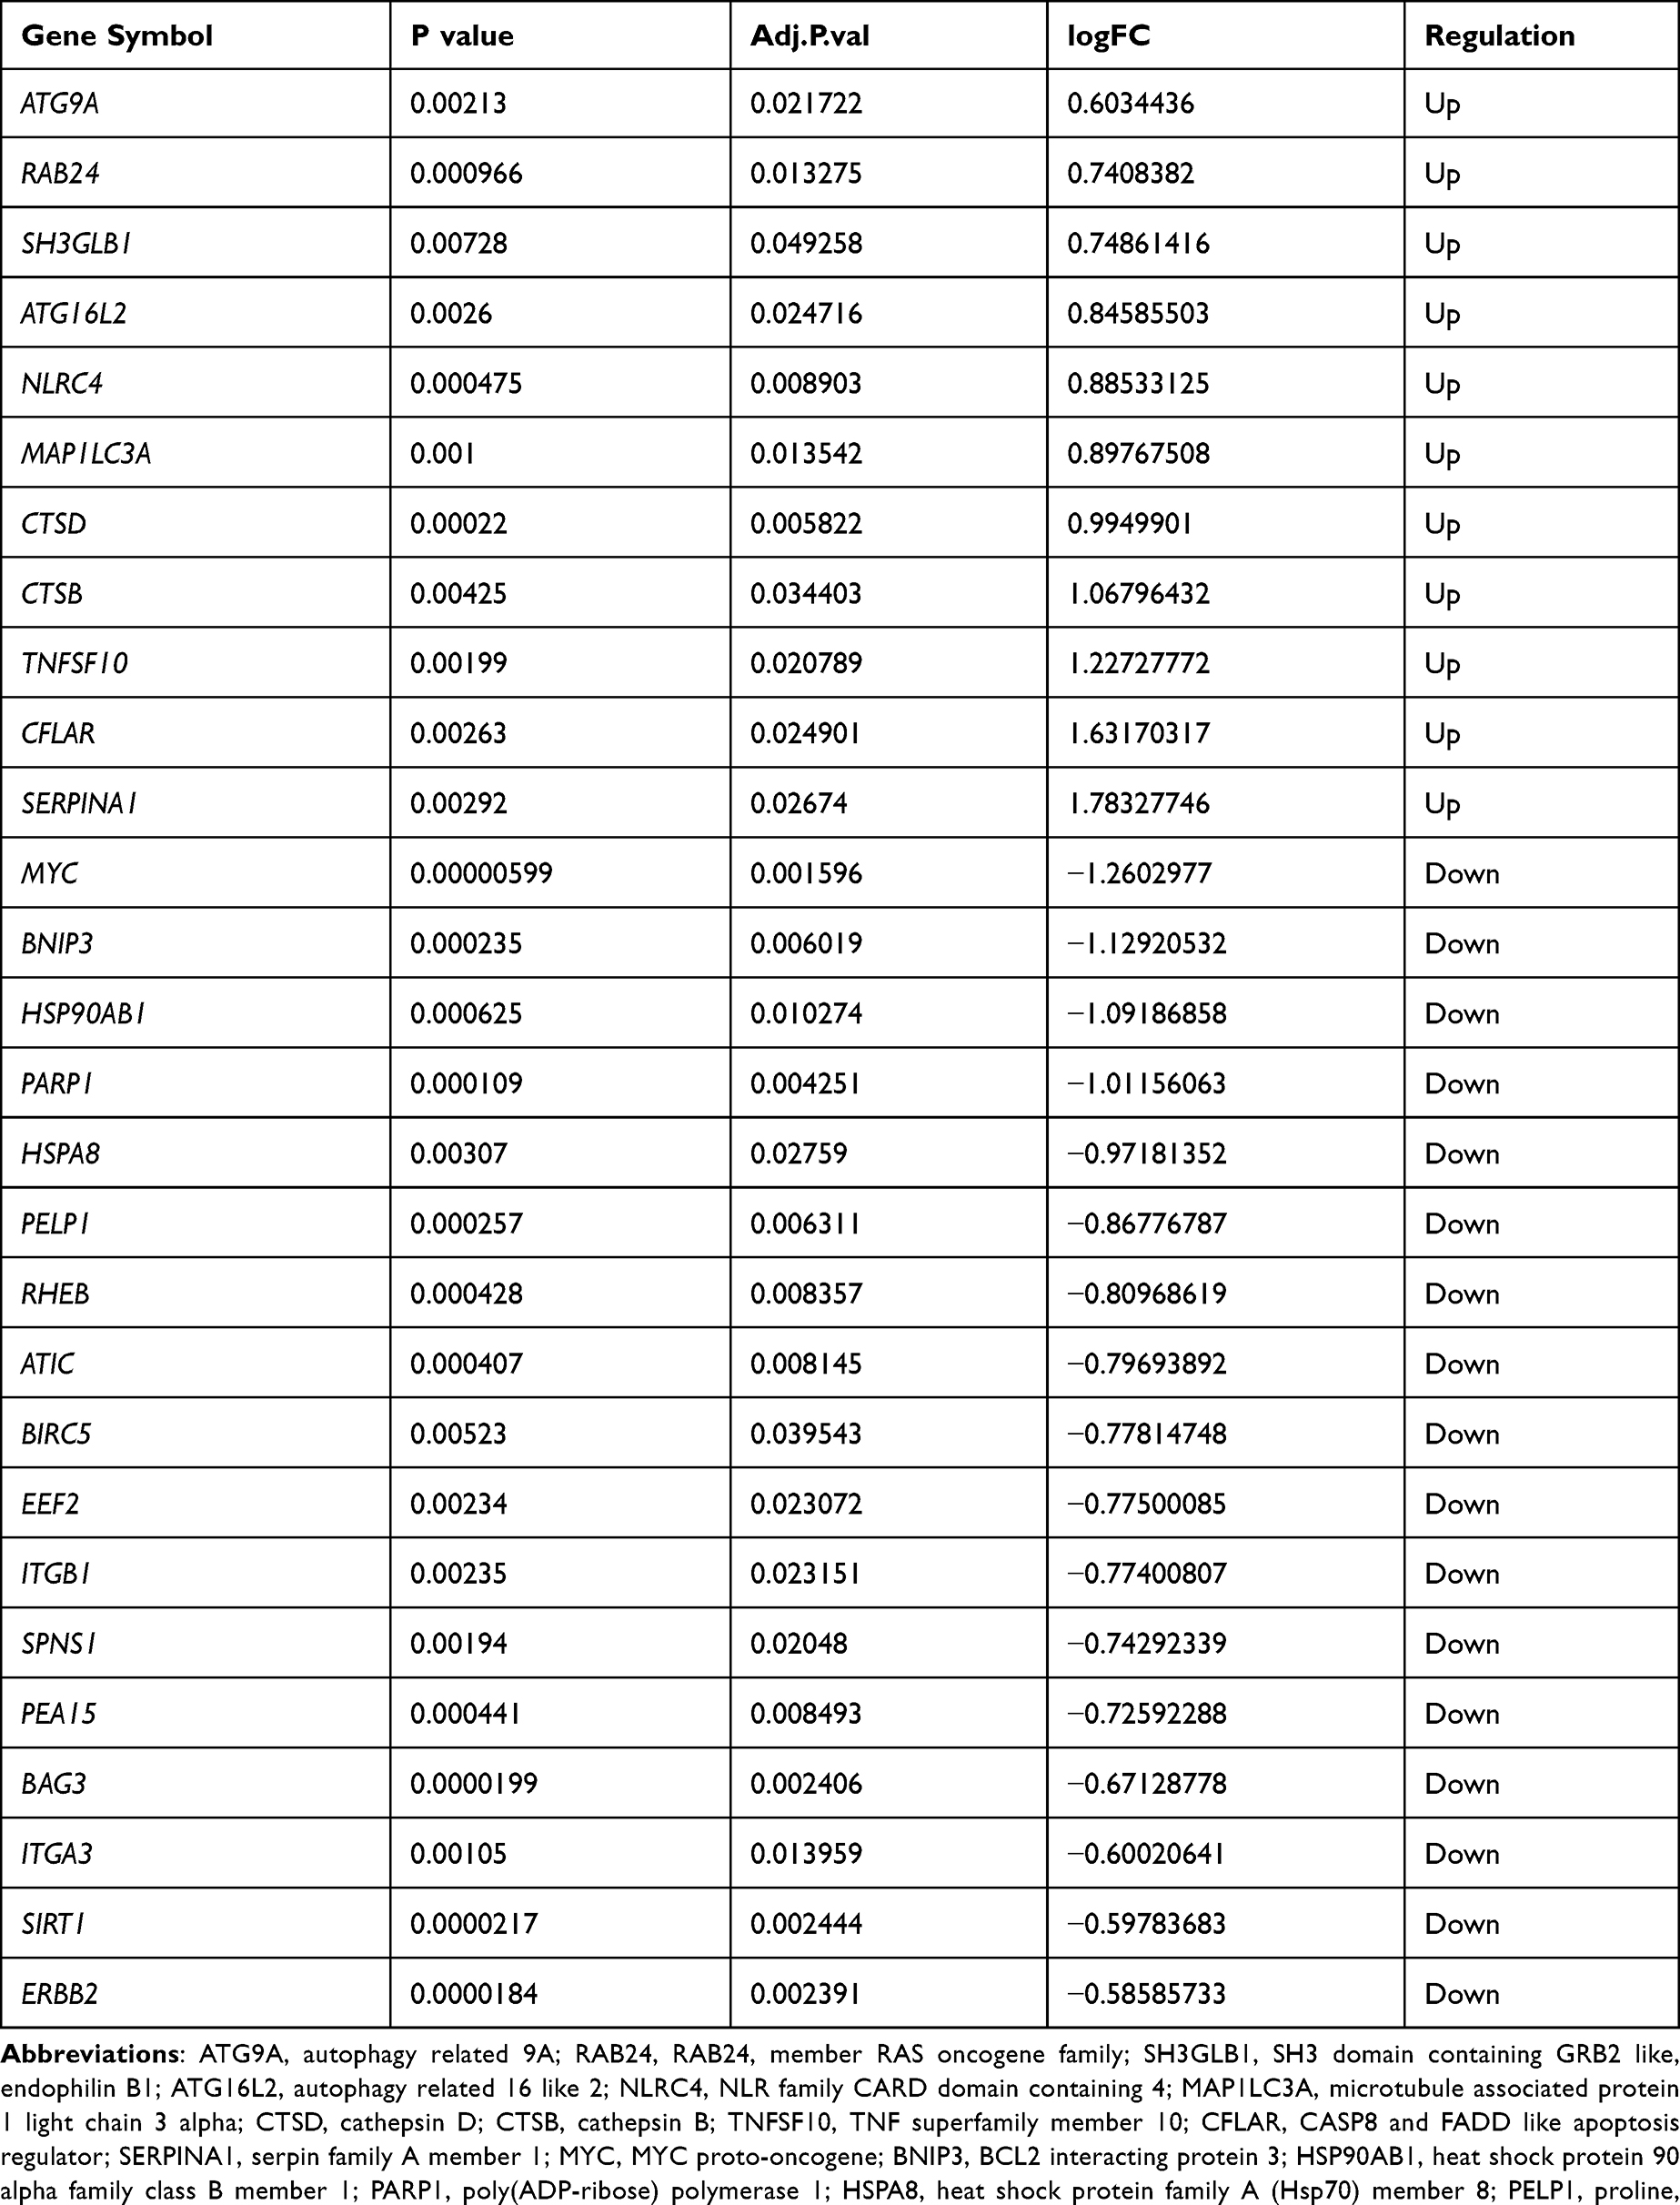 |
Table 1 The 28 DEAGs in ARDS Samples Compared to Healthy Sample |
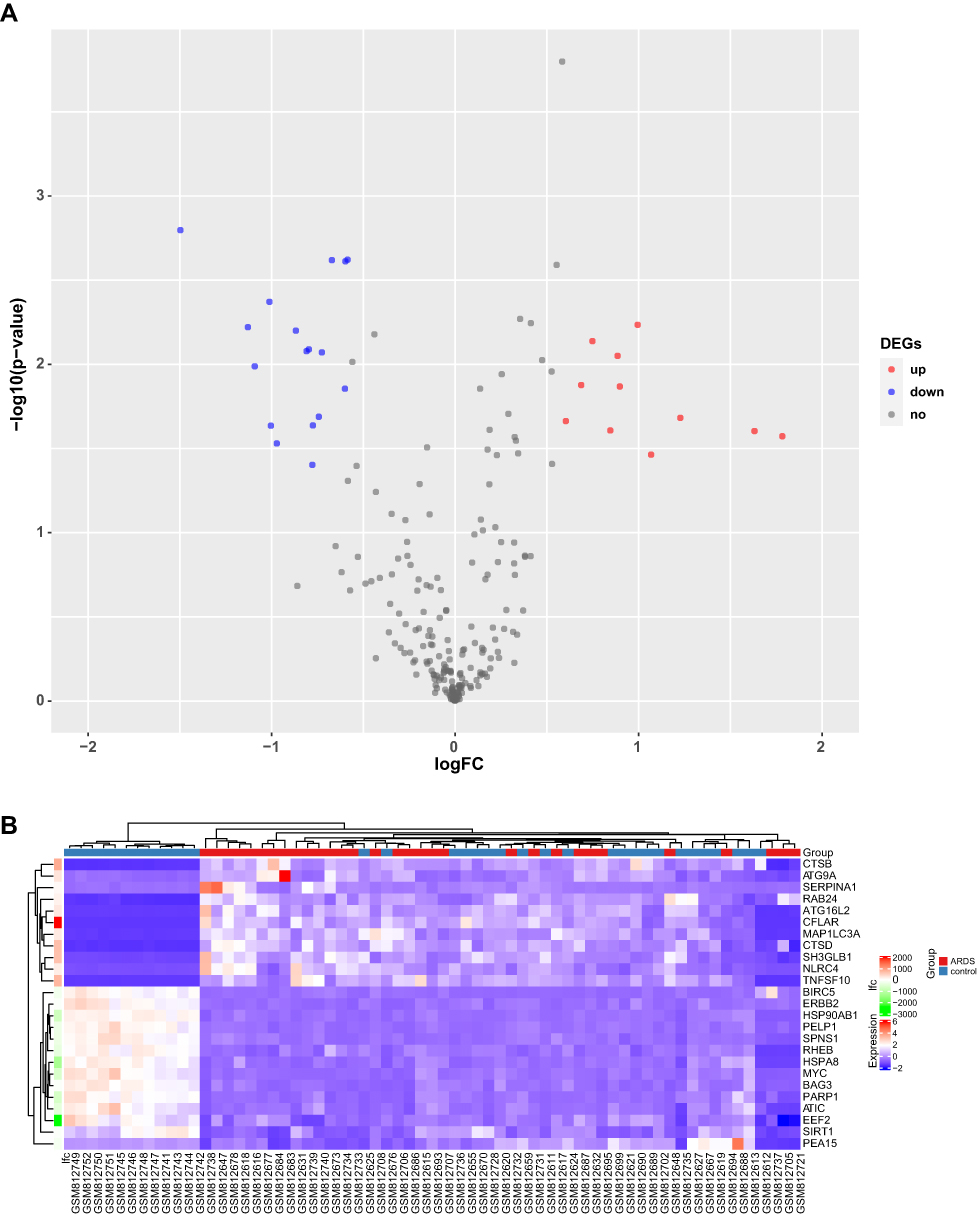 |
Figure 2 DEARGs in sepsis-induced ARDS and healthy samples. (A) Volcano plot of the 222 DEARGs. The red dots represent the significantly up-regulated genes and the blue dots indicate the significantly down-regulated genes. (B) Heatmap of the 28 DEARGs in sepsis-induced ARDS and healthy samples. |
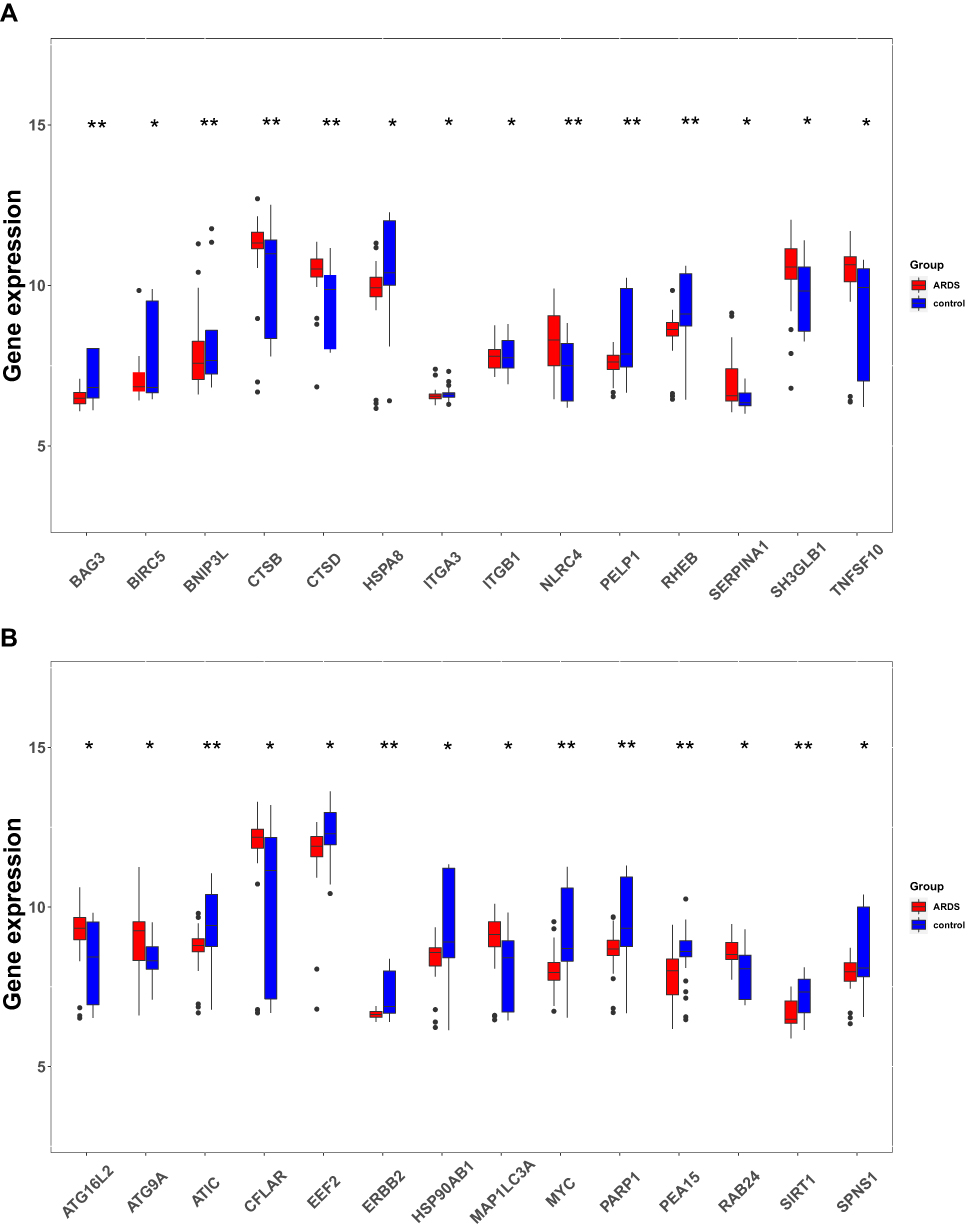 |
Figure 3 The boxplot of 28 DEARGs in sepsis-induced ARDS and healthy samples. (A) The boxplot of top 14 DEARGs in sepsis-induced ARDS and healthy samples. (B) The boxplot of last 14 DEARGs in sepsis-induced ARDS and healthy samples. P-values were calculated using a two-sided unpaired Student’s t-test. *P<0.05; **P<0.01. |
GO and KEGG Enrichment Analysis of the DEARGs
We performed GO and KEGG enrichment analyses using R software to determine the potential function of DEARGs in the development of sepsis-induced ARDS. The BP analysis showed that these genes are associated with the autophagy, process utilizing autophagic, as well as with the macroautophagy in the sepsis-induced ARDS (Figure 4A). In terms of the CCs, these genes were involved in the autophagosome, vacuolar membrane, and ficolin-1-rich granule (Figure 4A). With regard to MF, these genes participated in certain key functions, such as cell adhesion molecule binding, cadherin binding, and protease binding (Figure 4A) (Supplementary Table S2). In addition, the KEGG pathway enrichment analysis indicated that these genes were associated with Autophagy-animal, Apoptosis, PI3K-Akt signaling pathway. (Figure 4B, Supplementary Table S3).
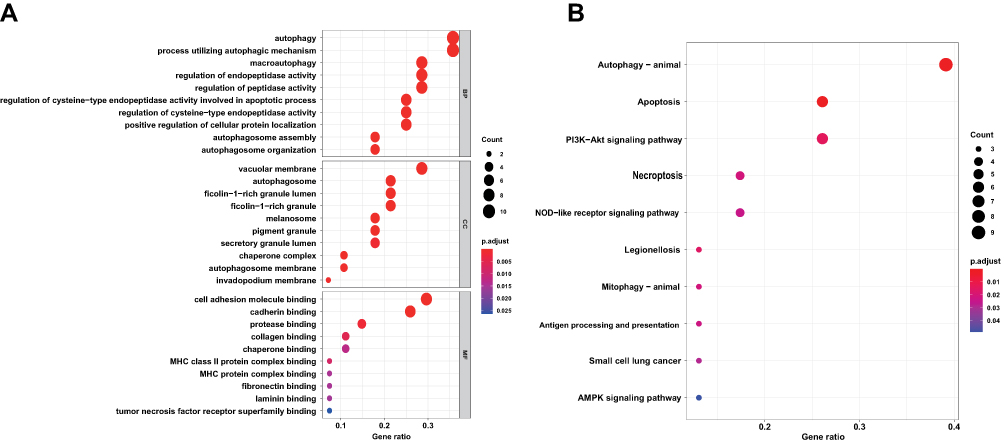 |
Figure 4 Functional enrichment of the DEARGs. (A) BP, biological process; CC, cellular component; MF, molecular function. (B) KEGG pathway enrichment analysis. |
Correlation Analysis and PPI Network of the DEARGs
To explore the expression correlation of these ARGs, correlation analysis was performed. The results revealed the relationship of the 28 DEARGs in the GSE32707 dataset (Figure 5). To determine the interactions between the DEARGs, PPI analysis was performed. The results demonstrated that these ARGs interacted with each other (Figure 6).
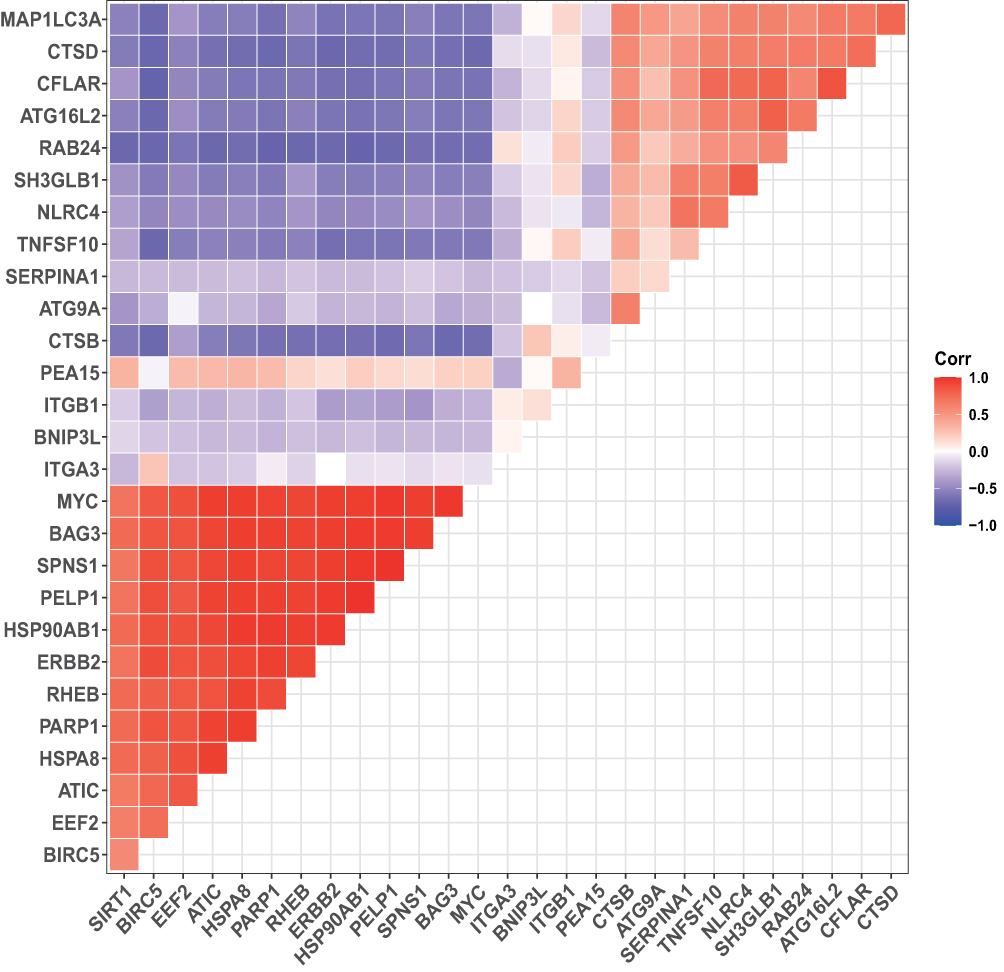 |
Figure 5 Spearman correlation analysis of the 28 DEARGs. |
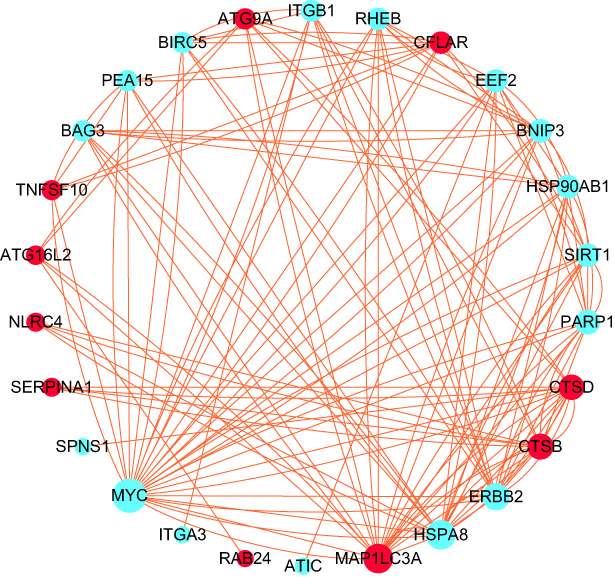 |
Figure 6 Protein–protein interactions (PPI) analysis the 28 DEARGs. Red and blue circles indicate upregulated and downregulated differentially expressed genes, respectively. Circle size indicates the node degree. |
Receiver Operating Characteristic (ROC) Curve Analysis
We performed ROC curve analysis using R Studio to further validate the reliability of these ARGs in the peripheral blood of patients. Seven genes (BAG3, CTSD, ERBB2, MYC, PEA15, RAB24, and SIRT1) with an AUC greater than 0.70 were considered possible to be hub genes, indicating that they may be able to diagnose patients with sepsis-related ARDS with excellent specificity and sensitivity (Figure 7).
 |
Figure 7 ROC curves to evaluate the diagnostic value of the DEARGs. Abbreviation: 95% CI, confidence interval. |
Distribution Pattern of Immune Cell Subtype
The overall distribution of different immune subsets in all samples was shown in a histogram (Figure 8A). Different colors and heights represent various types and percentages of immune cells in the sample, and the sum of the proportion of various immune cells is 1. CD8+ T cells, naive CD4+ T cells, memory resting CD4+ T cells, follicular helper T cells, gamma delta T cells, monocytes, mast cells resting, eosinophils and neutrophils were the primary infiltrating cells. There are individual differences in the proportion of immune cells between the two groups. The different immune cell subsets were weakly-to-moderately correlated (Figure 8B). Compared with healthy controls, the proportion of naive CD4+ T cells, gamma delta T cells, monocytes, and neutrophils was higher in sepsis-related ARDS samples, while the fraction of CD8+ T cells, memory resting CD4+ T cells, follicular helper T cells, mast cells resting, and eosinophils was relatively lower (Figure 8C).
 |
Figure 8 The profiles of immune cell subtype distribution pattern in GSE32707 cohort. (A) The bar plot visualizing the relative percent of 22 immune cell in each sample. (B) Correlation heatmap of all 22 immune cells. (C) Boxplot of all 22 immune cells differentially infiltrated fraction. P-values were calculated using a two-sided unpaired Student’s t-test. *P<0.05; **P<0.01. Abbreviation: ns, non significant. |
Validation the DEARGs by Real-Time PCR Analysis
To validate the reliability of the seven DEARG expression levels that were further identified by qRT-PCR in our clinical samples. The qRT-PCR results indicated that CTSD was upregulated and other four genes (BAG3, ERBB2, MYC and SIRT1) were downregulated. Only the expression of PEA15 and ERBB2 were inconsistent with our integrated analysis (Figure 9).
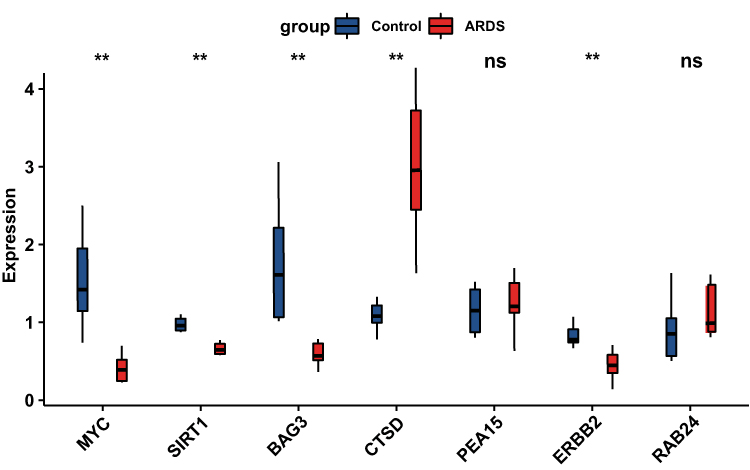 |
Figure 9 RNA expression of seven DEARGs were measured in sepsis-induced ARDS and healthy samples. (A) RNA expression of BAG3, CTSD, ERBB2, MYC, PEA15, RAB24 and SIRT1were measured in blood samples using qRT-PCR. P-values were calculated using a two-sided unpaired Student’s s t-test. **P<0.01. Abbreviation: ns, non significant. |
Discussion
Sepsis-induced ARDS has poorer recovery from lung injury, higher overall disease severity and higher mortality than non-sepsis-induced ARDS.18 Unfortunately, mechanisms of sepsis-induced ARDS still remain unclear and effective therapies are lacking. Increasing evidences suggested autophagy plays critical roles in the pathogenesis of sepsis-induced ARDS. Autophagy is a double-edged sword. In the early stages, sepsis-induced ARDS can activate various autophagy-related proteins, which reduce cytokine release, inflammatory response, and apoptosis in the lung.6,19,20 Another evidence suggested that autophagy, by virtue of excessive autophagosomes accumulation, may play a maladaptive role in the late stages sepsis-related ARDS.21,22 Therefore, there is an urgent need to improve the understanding of autophagy in pathogenesis of sepsis-induced ARDS by extensive validations.
Recently, a series of studies have explored that autophagy is associated with sepsis-induced ARDS. Colell et al results indicated that glyceraldehyde-3-phosphate dehydrogenase (GAPDH) protected against sepsis-related lung injury by promoting autophagy related 12 (ATG12)-mediated autophagy and ameliorated oxidative stress.23,24 In addition, a recent study found that MicroRNA-377-3p released from mesenchymal stem cell exosomes improves LPS-induced ALI by targeting RPTOR to induce autophagy.25 Another study reported that CD39+ regulatory T cells attenuate LPS-induced ALI via autophagy and ERK/FOS pathway.26 However, bioinformatics analysis of ARGs has not been well explored in sepsis-induced ARDS.
In this study, we identified 28 potential DEARGs of sepsis-induced ARDS by bioinformatics analysis. The potential biological functions of these DEARGs were performed by GO and KEGG enrichment analysis which mainly indicated a key role of autophagy in the pathophysiological mechanisms of sepsis-induced ARDS.
We further performed ROC curves to assess the diagnostic ability of DEARGs in sepsis-induced ARDS. The seven genes (BAG3, CTSD, ERBB2, MYC, PEA15, RAB24 and SIRT1) were indicated that they may be able to diagnose sepsis-induced ARDS patients with excellent specificity and sensitivity. Abundant research has confirmed that the immune system plays a central role in sepsis-induced ARDS. Therefore, we used CIBERSORT, a transcriptome deconvolution algorithm, to calculate the proportion of blood immune cell subsets which can better understand the role of leukocyte infiltration and the inflammatory response in the pathogenesis and development of sepsis-related ARDS. Besides, there were also obviously differences in the proportion of most of 22 immune cells between sepsis-related ARDS and healthy controls. These differences include an increase in the proportion of naive CD4+ T cells, gamma delta T cells, monocytes, and neutrophils, while the fraction of CD8+ T cells, memory resting CD4+ T cells, follicular helper T cells, mast cells resting, and eosinophils was relatively lower in sepsis-induced ARDS.
Finally, based on bioinformatics analysis results, the expression levels of seven DEARGs were further identified by qRT-PCR in our clinical samples. CTSD was upregulated and the other four genes (BAG3, ERBB2, MYC and SIRT1) were downregulated. Only the expression of PEA15 and ERBB2 were inconsistent with our integrated analysis. Some of these verified genes have been reported to be associated with sepsis-related ARDS. Liu et al revealed that SIRT1 can enhance cellular autophagy via regulating of ATG7 and alleviate LPS-induced ARDS.27 Dong et al found that LC3 and ATG16 expressions are elevated in activated autophagy, which maintain barrier and adherens functional integrity in the murine model of ALI. Besides, activated autophagy can alleviate cytokine release and further improve ALI evoked by LPS stimulation in mice.28 Nevertheless, the explicit mechanism whereby these verified genes remain largely unclear in sepsis-induced ARDS to need further exploration.
Our research inevitably presents some limitations. Firstly, our research represents the second mining and analysis of previously published data sets, so we did not know the severity of patients, treatment methods and relevant clinical data, which may have confounded factors in our analysis. Secondly, the small number of clinical samples were used for analysis, which further studies with a larger sepsis-induced ARDS cohort will be needed to further confirm and extend the conclusions of this study. Thirdly, we only verified the expression level of the differentially expressed autophagy-related genes in clinical samples, owing to the lack of sepsis-induced ARDS detailed information, it is difficult to draw a clear association between selected genes and the severity of sepsis-induced ARDS while using the same samples. Therefore, mechanisms of sepsis-induced ARDS are needed to further explore in vitro or in vivo experiments.
Conclusion
We identified an association between DEG and immune infiltration in sepsis-induced ARDS and validated BAG3, CTSD, ERBB2, MYC and SIRT1 that may be have excellent diagnostic performance.
Data Sharing Statement
The data GSE32707 was downloaded from the Gene Expression Omnibus (GEO) database (https://www.ncbi.nlm.nih.gov/geo/). The 222 genes were obtained from The Human Autophagy Database (http://www.autophagy.lu/index.html).
Ethics Approval and Informed Consent
All procedures performed in studies involving humans were reviewed and permitted by the First Affiliated Hospital of Zhengzhou University (2020-KY-462, 24 Nov. 2020). Written informed consent was obtained from all individual participants included in the study. The study was conducted in accordance with the Declaration of Helsinki.
Acknowledgments
This study was supported by the National Natural Science Foundation of China (82074212).
Author Contributions
All authors made a significant contribution to the work reported, whether that is in the conception, study design, execution, acquisition of data, analysis and interpretation, or in all these areas; took part in drafting, revising or critically reviewing the article; gave final approval of the version to be published; have agreed on the journal to which the article has been submitted; and agree to be accountable for all aspects of the work.
Disclosure
The authors report no conflicts of interest in this work.
References
1. Thompson BT, Chambers RC, Liu KD, Drazen JM. Acute respiratory distress syndrome. N Engl J Med. 2017;377(6):562–572. doi:10.1056/NEJMra1608077
2. Xue M, Sun Z, Shao M, et al. Diagnostic and prognostic utility of tissue factor for severe sepsis and sepsis-induced acute lung injury. J Transl Med. 2015;13:172.
3. Calfee CS, Gallagher D, Abbott J, et al. Plasma angiopoietin-2 in clinical acute lung injury: prognostic and pathogenetic significance. Crit Care Med. 2012;40(6):1731–1737.
4. Zhao Z, Wickersham N, Kangelaris KN, et al. External validation of a biomarker and clinical prediction model for hospital mortality in acute respiratory distress syndrome. Intensive Care Med. 2017;43(8):1123–1131.
5. Sato H, Callister ME, Mumby S, et al. KL-6 levels are elevated in plasma from patients with acute respiratory distress syndrome. Eur Respir J. 2004;23(1):142–145.
6. Zhao H, Chen H, Xiaoyin M, et al. Autophagy activation improves lung injury and inflammation in sepsis. Inflammation. 2019;42(2):426–439.
7. Vishnupriya S, Priya Dharshini LC, Sakthivel KM, Rasmi RR. Autophagy markers as mediators of lung injury-implication for therapeutic intervention. Life Sci. 2020;260:118308.
8. Pei C, Wang F, Huang D, et al. Astragaloside IV protects from PM2.5-induced lung injury by regulating autophagy via inhibition of PI3K/Akt/mTOR signaling in vivo and in vitro. J Inflamm Res. 2021;14:4707–4721.
9. Mizushima N, Levine B. Autophagy in human diseases. N Engl J Med. 2020;383(16):1564–1576.
10. Nosaka N, Martinon D, Moreira D, et al. Autophagy protects against developing increased lung permeability and hypoxemia by down regulating inflammasome activity and IL-1β in LPS plus mechanical ventilation-induced acute lung injury. Front Immunol. 2020;11:207. doi:10.3389/fimmu.2020.00207
11. Fan EKY, Fan J. Regulation of alveolar macrophage death in acute lung inflammation. Respir Res. 2018;19(1):50.
12. Dolinay T, Kim YS, Howrylak J, et al. Inflammasome-regulated cytokines are critical mediators of acute lung injury. Am J Respir Crit Care Med. 2012;185(11):1225–1234.
13. Ritchie ME, Phipson B, Wu D, et al. limma powers differential expression analyses for RNA-sequencing and microarray studies. Nucleic Acids Res. 2015;43(7):e47.
14. Robin X, Turck N, Hainard A, et al. pROC: an open-source package for R and S+ to analyze and compare ROC curves. BMC Bioinform. 2011;12:77.
15. Fan X, Qi B, Ma L, Ma F. Screening of underlying genetic biomarkers for ankylosing spondylitis. Mol Med Rep. 2019;19(6):5263–5274.
16. Ranieri VM, Rubenfeld GD; ARDS Definition Task Force. Acute respiratory distress syndrome: the Berlin Definition. JAMA. 2012;307(23):2526–2533.
17. Singer M, Deutschman CS, Seymour CW, et al. The Third International Consensus definitions for sepsis and septic shock (Sepsis-3). JAMA. 2016;315(8):801–810.
18. Bellani G, Laffey JG, Pham T, et al. Epidemiology, patterns of care, and mortality for patients with acute respiratory distress syndrome in intensive care units in 50 countries. JAMA. 2016;315(8):788–800.
19. Rojo de la Vega M, Dodson M, Gross C, et al. Role of Nrf2 and autophagy in acute lung injury. Curr Pharmacol Rep. 2016;2(2):91–101.
20. Kanayama M, He YW, Shinohara ML. The lung is protected from spontaneous inflammation by autophagy in myeloid cells. J Immunol. 2015;194(11):5465–5471.
21. Lo S, Yuan SS, Hsu C, et al. Lc3 over-expression improves survival and attenuates lung injury through increasing autophagosomal clearance in septic mice. Ann Surg. 2013;257(2):352–363.
22. Guo L, Stripay JL, Zhang X, et al. CaMKIα regulates AMP kinase-dependent, TORC-1-independent autophagy during lipopolysaccharide-induced acute lung neutrophilic inflammation. J Immunol. 2013;190(7):3620–3628.
23. Takaoka Y, Goto S, Nakano T, et al. Glyceraldehyde-3-phosphate dehydrogenase (GAPDH) prevents lipopolysaccharide (LPS)-induced, sepsis-related severe acute lung injury in mice. Sci Rep. 2014;4:5204.
24. Colell A, Ricci JE, Tait S, et al. GAPDH and autophagy preserve survival after apoptotic cytochrome c release in the absence of caspase activation. Cell. 2007;129(5):983–997.
25. Wei X, Yi X, Lv H, et al. MicroRNA-377-3p released by mesenchymal stem cell exosomes ameliorates lipopolysaccharide-induced acute lung injury by targeting RPTOR to induce autophagy. Cell Death Dis. 2020;11(8):657.
26. Chen C, Li X, Li C, et al. CD39+ regulatory T cells attenuate lipopolysaccharide-induced acute lung injury via autophagy and the ERK/FOS pathway. Front Immunol. 2021;11:602605.
27. Liu J, Lv X, Dong W, et al. The role of SIRT1 in autophagy in lipopolysaccharide-induced mouse type II alveolar epithelial cells. Inflammation. 2018;41(6):2222–2235.
28. Dong W, He B, Qian H, et al. RAB26-dependent autophagy protects adherens junctional integrity in acute lung injury. Autophagy. 2018;14(10):1677–1692.
 © 2022 The Author(s). This work is published and licensed by Dove Medical Press Limited. The full terms of this license are available at https://www.dovepress.com/terms.php and incorporate the Creative Commons Attribution - Non Commercial (unported, v3.0) License.
By accessing the work you hereby accept the Terms. Non-commercial uses of the work are permitted without any further permission from Dove Medical Press Limited, provided the work is properly attributed. For permission for commercial use of this work, please see paragraphs 4.2 and 5 of our Terms.
© 2022 The Author(s). This work is published and licensed by Dove Medical Press Limited. The full terms of this license are available at https://www.dovepress.com/terms.php and incorporate the Creative Commons Attribution - Non Commercial (unported, v3.0) License.
By accessing the work you hereby accept the Terms. Non-commercial uses of the work are permitted without any further permission from Dove Medical Press Limited, provided the work is properly attributed. For permission for commercial use of this work, please see paragraphs 4.2 and 5 of our Terms.