")
Back to Journals » International Journal of General Medicine » Volume 15
Identification and Validation of an Endoplasmic Reticulum Stress-Related lncRNA Signature for Colon Adenocarcinoma Patients
Authors Chen X, Gao K, Xiang Z, Zhang Y, Peng X
Received 17 January 2022
Accepted for publication 12 April 2022
Published 21 April 2022 Volume 2022:15 Pages 4303—4319
DOI https://doi.org/10.2147/IJGM.S358775
Checked for plagiarism Yes
Review by Single anonymous peer review
Peer reviewer comments 2
Editor who approved publication: Dr Scott Fraser
Xueru Chen,1,* Kai Gao,2,* Zijin Xiang,1 Yujun Zhang,1 Xiangdong Peng1
1Department of Pharmacy, The Third Xiangya Hospital, Central South University, Changsha, Hunan, 410013, People’s Republic of China; 2Department of Gastrointestinal Surgery, The Third Xiangya Hospital of Central South University, Changsha, People’s Republic of China
*These authors contributed equally to this work
Correspondence: Xiangdong Peng, Department of Pharmacy, The Third Xiangya Hospital, Central South University, 138 Tongzipo Road, Changsha, Hunan Province, 410013, People’s Republic of China, Email [email protected]
Purpose: Endoplasmic reticulum (ER) stress has a significant effect on cancer cells. Increasing numbers of studies indicate that long non-coding RNAs (lncRNAs) promote the development of colon adenocarcinoma (COAD), but the relationship between ER stress-related lncRNAs and the prognosis of COAD remains unclear. The aim of the current study was to construct and validate an ER stress-related lncRNA prognostic signature to predict COAD prognoses.
Methods: Gene expression data and clinical information from the Cancer Genome Atlas and the Gene Expression Omnibus with COAD were downloaded and analyzed. Cox regression and least absolute shrinkage and selection operator regression were then used to develop an ER stress-related lncRNA signature. COAD patients were then divided into high-risk and low-risk groups based on the median risk score to analyze prognoses. Tumor mutation burdens (TMBs) and the differences in copy number variations (CNVs) between the two groups were also analyzed. Lastly, gene set enrichment analysis (GSEA) was used to explore the enrichment pathways and biological processes associated with differentially expressed genes in the high-risk and low-risk groups, and lncRNA expression in the model was validated via quantitative real-time PCR in colon cancer and paracancerous tissues.
Results: A signature including 8 ER stress-related lncRNAs was constructed. COAD prognoses were significantly poorer in the high-risk group than in the low-risk group. There were few differences in TMBs and CNVs between the two groups. In GSEA analysis, in the high-risk group highly expressed genes associated with extracellular matrix pathways were significantly enriched.
Conclusion: The 8-ER stress-related lncRNA derived from the present study is a potential indicator of COAD prognosis.
Keywords: TCGA, GEO, colon adenocarcinoma, endoplasmic reticulum stress, long non-coding RNA
Introduction
Colon adenocarcinoma (COAD) is a malignant tumor and is the third-most lethal tumor of the digestive system. The 5-year survival rate of COAD is approximately 50%.1,2 With the continuous development of diagnostic and treatment methods in recent years, the survival rate of COAD has improved, but the mechanism of COAD progression remains unclear. Because the detection rate is still not perfect, some COAD biomarkers are being used or tested in clinical trials.3–5 There is a need to explore additional potentially informative biomarkers to improve COAD prognoses.
Endoplasmic reticulum (ER) is the organelle responsible for the synthesis, folding, modification, and control of secreted proteins and membrane proteins in eukaryotic cells.6–9 Many disturbances can impair a cell’s ability to process protein folding and then lead to ER stress.10,11 When an unfolded protein response cannot maintain the balance of ER stress, it can induce cell apoptosis and affect the growth, survival, differentiation, and maintenance of protein homeostasis in tumor cells.12–16 Therefore, the utilization of ER stress-related genes may be an effective strategy for the treatment of COAD. Long non-coding RNAs (lncRNAs) have been generally defined as non-coding RNAs > 200 nucleotides in length with incomplete functional open reading frames.17,18 They participate in the regulation of COAD-related cell signaling pathways.19,20 Several studies indicate that lncRNAs are related to ER stress, and recent studies suggest that lncRNA DANCR protects cardiomyocytes from ER stress injury by sponge-adsorbed microRNA-6324.21 LncRNA MEG3 promotes ER stress through the MEG3/miR-103a-3p/PDHB pathway.22 We therefore hypothesized that the identification of ER stress-related lncRNAs may be useful for the prediction of COAD prognoses, which provide the basis for individualized treatment.
In this study, COAD RNA sequencing data downloaded from the Cancer Genome Atlas (TCGA) database were used as a training set, then data downloaded from the Gene Expression Omnibus (GEO) database were used as a validation set. A risk prognosis model including eight ER stress-related lncRNAs was established via Cox regression and least absolute shrinkage and selection operator (LASSO) regression analyses. COAD patients were then divided into low-risk and high-risk groups based on the median risk score, and survival analysis, tumor mutation burden (TMB) and copy number variation (CNV) analyses, and the gene set enrichment analysis (GSEA) analysis were conducted in the two groups. The predictive capacity of the model was verified in the GEO validation cohort. Lastly, lncRNA expression in the model was validated via RT-PCR using clinical tissue samples.
Materials and Methods
Data Sources
COAD RNA sequencing and clinical characteristics data were obtained from two databases. A training cohort dataset data from 434 patients was downloaded from the TCGA project (https://portal.gdc. cancer.gov/repository). The external validation cohort dataset containing data from 556 patients was derived from the GEO databases (GSE39582)(https://www.ncbi.nlm.nih.gov/geo/). RNA sequencing transcriptome data of HTseq-counts were transformed into TPM for subsequent analysis. Patients with unknown overall survival (OS) or incomplete information were excluded from both datasets.
Screening of ER Stress Gene-Associated lncRNAs
ER stress-related genes were obtained from the GSEA/MSigDB platform (https://www.gsea-msigdb.org/gsea/login.jsp). Three gene sets associated with ER stress were included23 (GO_PERK_MEDIATED_UNFOLDED_PROTEIN_RESPON
ESPONSE, GO_IRE1_MEDIATED_UNFOLDED_PROTEIN_RESPON
ESPONSE, and REACTOME_ATF6_ATF6_ALPHA_ACTIVATES_CHAPE
CHAPERONE_GENES). The limma package was used to normalize the presentation data. Pearson’ s correlations were calculated to assess relationships between ER stress-related genes and lncRNAs (|R| >0.2).
Establishment of a Risk Signature
Univariate Cox regression analysis was used to identify ER stress-related lncRNAs associated with prognosis (p < 0.05). The lncRNAs identified were then used in LASSO analysis and multivariate Cox regression analysis to generate a set of prognostic characteristics associated with ER stress. Based on Akaike Information Criteria values, the best ER stress-related lncRNA prognostic signature was selected for further analysis. Each patient’s risk score was calculated via the following formula, where Coef(i) and x(i) respectively represent estimates of each regression coefficient and expression value of ER stress-related lncRNA: risk score = ∑Coef(i)×x(i). COAD patients in the TCGA and GEO databases were divided into high-risk and low-risk groups based on the median risk score.
TMB and CNV Analyses
Mutation data were downloaded from the cbioportal database, and the “maftools” R package was used to visualize somatic mutation data in the mutation annotation format. The TMB value was then calculated by adding the number of somatic mutations to the length of the exon. Finally, differences in TMB values between the high-risk group and the low-risk group were analyzed.
The GISTIC algorithm was used to analyze masked CNV data derived from different transcriptome clusters. CNV data associated with Y chromosome aberrations in germ cells were excluded from this analysis. Differences in CNV values between the high-risk group and the low-risk group were analyzed.
Survival Analysis
To construct survival curves for patients at high and low risk, Kaplan-Meier curves and Log rank tests were used to assess associations between risk model scores in high-risk and low-risk groups and patient survival. Because COADs are closely associated with genetic mutations, survival in high-risk and low-risk groups was also analyzed with respect to BRAF, KRAS, NRAS, MSI, and MSS mutational status. By using the “survivorROC” package in R language, time-dependent receiver operating characteristic (ROC) curves were generated to evaluate the predictive accuracy of prognostic features.
Patients and Tissue Samples
Altogether 6 COAD tissues and paired normal tissues were collected from patients who provided informed consent who had undergone radical surgical resection of COAD between September 2016 and January 2017 at the Third Xiangya Hospital of Central South University, China. All dissected samples were immediately stored in liquid nitrogen until preparation for total RNA extraction. The collection of tumor samples from patients with COAD was approved by the Ethics Committee of the Third Xiangya Hospital of Central South University, China (application number: 2017-S259).
Reverse Transcription and Quantitative Real-Time PCR
Total RNA was isolated from tissue using RNAiso Plus (TRIzol) (Takara, Dalian, China, Code No:9109) and reverse transcribed into cDNA using the PrimeScript RT Reagent Kit (Takara, Dalian, China, Code No: RR047A) in accordance with the manufacturer’s instruction. The reaction was performed in a Light Cycler@ 480 II Sequence Detection System (Roche, Basel, Switzerland). Relative gene expression was calculated using the 2-ΔCt method with glyceraldehyde 3-phosphate dehydrogenase (GAPDH) as an internal control. All primers were synthesized by Sangon Biotech (Shanghai, China). The primers sequences were: GAPDH FP: 5’-TCAAGATCATTGCTCCTCCTGA-3’, RP: 5’-ACATCTGCTGGAAGGTGGACA-3’; MIR210HG FP: 5’-FGGTTCTGGCTTGCTGACAC-3’, RP: 5’-CAACTCGGCTTGGTTATTTC-3’; ALMS1-IT1 FP: 5’-AGGATACCTGGGATGGCTGT-3’, RP: 5’-ACAGCCATCCCAGGTATCCT-3’; LINC00638 FP: 5’-ACAATTCGACCCGTAACAGC-3’, RP: 5’-TGCTCGATATTCCCATGTCA-3’; ZEB1-AS1 FP: 5’-CCGTGGGCACTGCTGAA-3’, RP: 5’-CTGCTGGCA AGCGGAAC-3’; FLJ21408 FP: 5’-GCCCGCTCTCGATCCTTAAT-3’, RP:
5’-ACTACATTGTGCCAGCGGAA-3’; LINC00648 FP: 5’-CGCATTTTCACCCTCTTCGC-3’, RP:5’-CCTGAGAAGGCATAGCGACT-3’.
Statistical Analysis
R software (version 3.6.3) and GraphPad Prism v7.0 (GraphPad Software Inc.) were used as analysis tools. Expression levels of single lncRNAs in tumor tissues and normal tissues were compared via the paired t-test. P < 0.05 was deemed to indicate statistical significance.
Results
Identification of an ER Stress-Related lncRNA Signature
A total of 990 patients were included in the study, 434 derived from the TCGA, and 556 derived from the GEO. The clinicopathological characteristics of COAD patients are detailed in Table 1. A flow chart representing the entire study is shown in Figure 1. Pearson’s correlational analysis yielded 675 ER stress-related lncRNAs. In univariate Cox analysis, 109 ER stress-related lncRNAs exhibited prognostic value in COAD patients (p < 0.05). Eight ER stress-related lncRNAs were subsequently identified via LASSO regression. In multivariate Cox regression analysis, 8 lncRNAs were independent prognostic factors. Lastly, an 8-ER stress-related lncRNA signature was generated (Figure 2A–C).
 |
Table 1 The Clinicopathological Characteristics of COAD Patients |
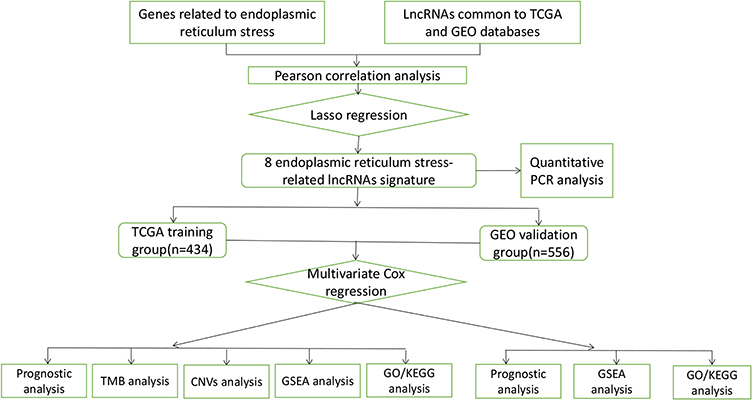 |
Figure 1 Flowchart of data preparation, processing, analysis, and validation. |
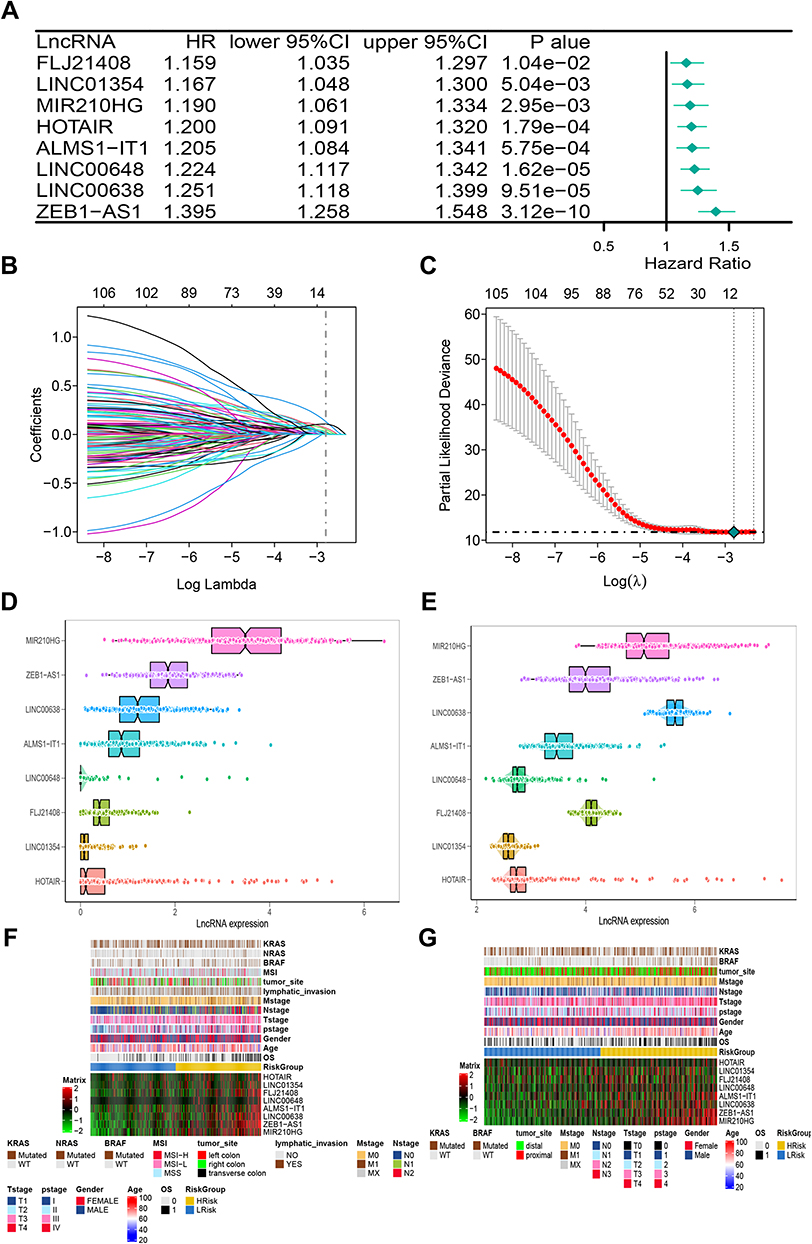 |
Figure 2 The construction of risk model and identification of ER stress-related lncRNAs. (A) The forest plot of univariate COX regression analysis among eight lncRNAs. (B) Partial likelihood deviation was plotted relative to the logarithm of lambda in 10-fold cross-validation. (C) The trajectory graph of each variable. (D and E) The expression heat map of eight lncRNAs and clinical features in TCGA (D) and GEO (E) cohorts. (F and G) The histogram of the expression of eight lncRNAs in the TCGA (F) and GEO (G) cohorts. |
The median risk score was used as the cut-off for low-risk and high-risk COAD patients. Expression of lncRNAs in the training and validation cohorts is shown in Figures 2D and E. Heatmaps were generated representing gene expression profiles in the high-risk and low-risk groups in the TCGA-training cohort (Figure 2F) and the GEO-validation cohort (Figure 2G). In the TCGA-training cohort, the high-risk and low-risk groups differed with respect to TNM stage and pathological stage. Specifically, there were more advanced malignancies in the high-risk group (Table 2). Similarly, in the GEO-validation cohort, TNM stage and pathological stage were significantly higher in the high-risk group than in the low-risk group. In the TCGA cohort, there were no significant differences in tumor site or BRAF mutation between the high-risk and low-risk groups, but there were significant differences between the high-risk and low-risk groups in the GEO cohort (Table 3). ER stress-related lncRNAs were more likely to be expressed in the high-risk groups in both the training cohort and the validation cohort. Online database GEPIA analysis indicated that the differential gene expression identified was related to the prognosis, whereby high expression indicated a worse prognosis (Figures 3A–G).
 |
Table 2 Demographic and Molecular Comparison Between HRisk and LRisk in TCGA |
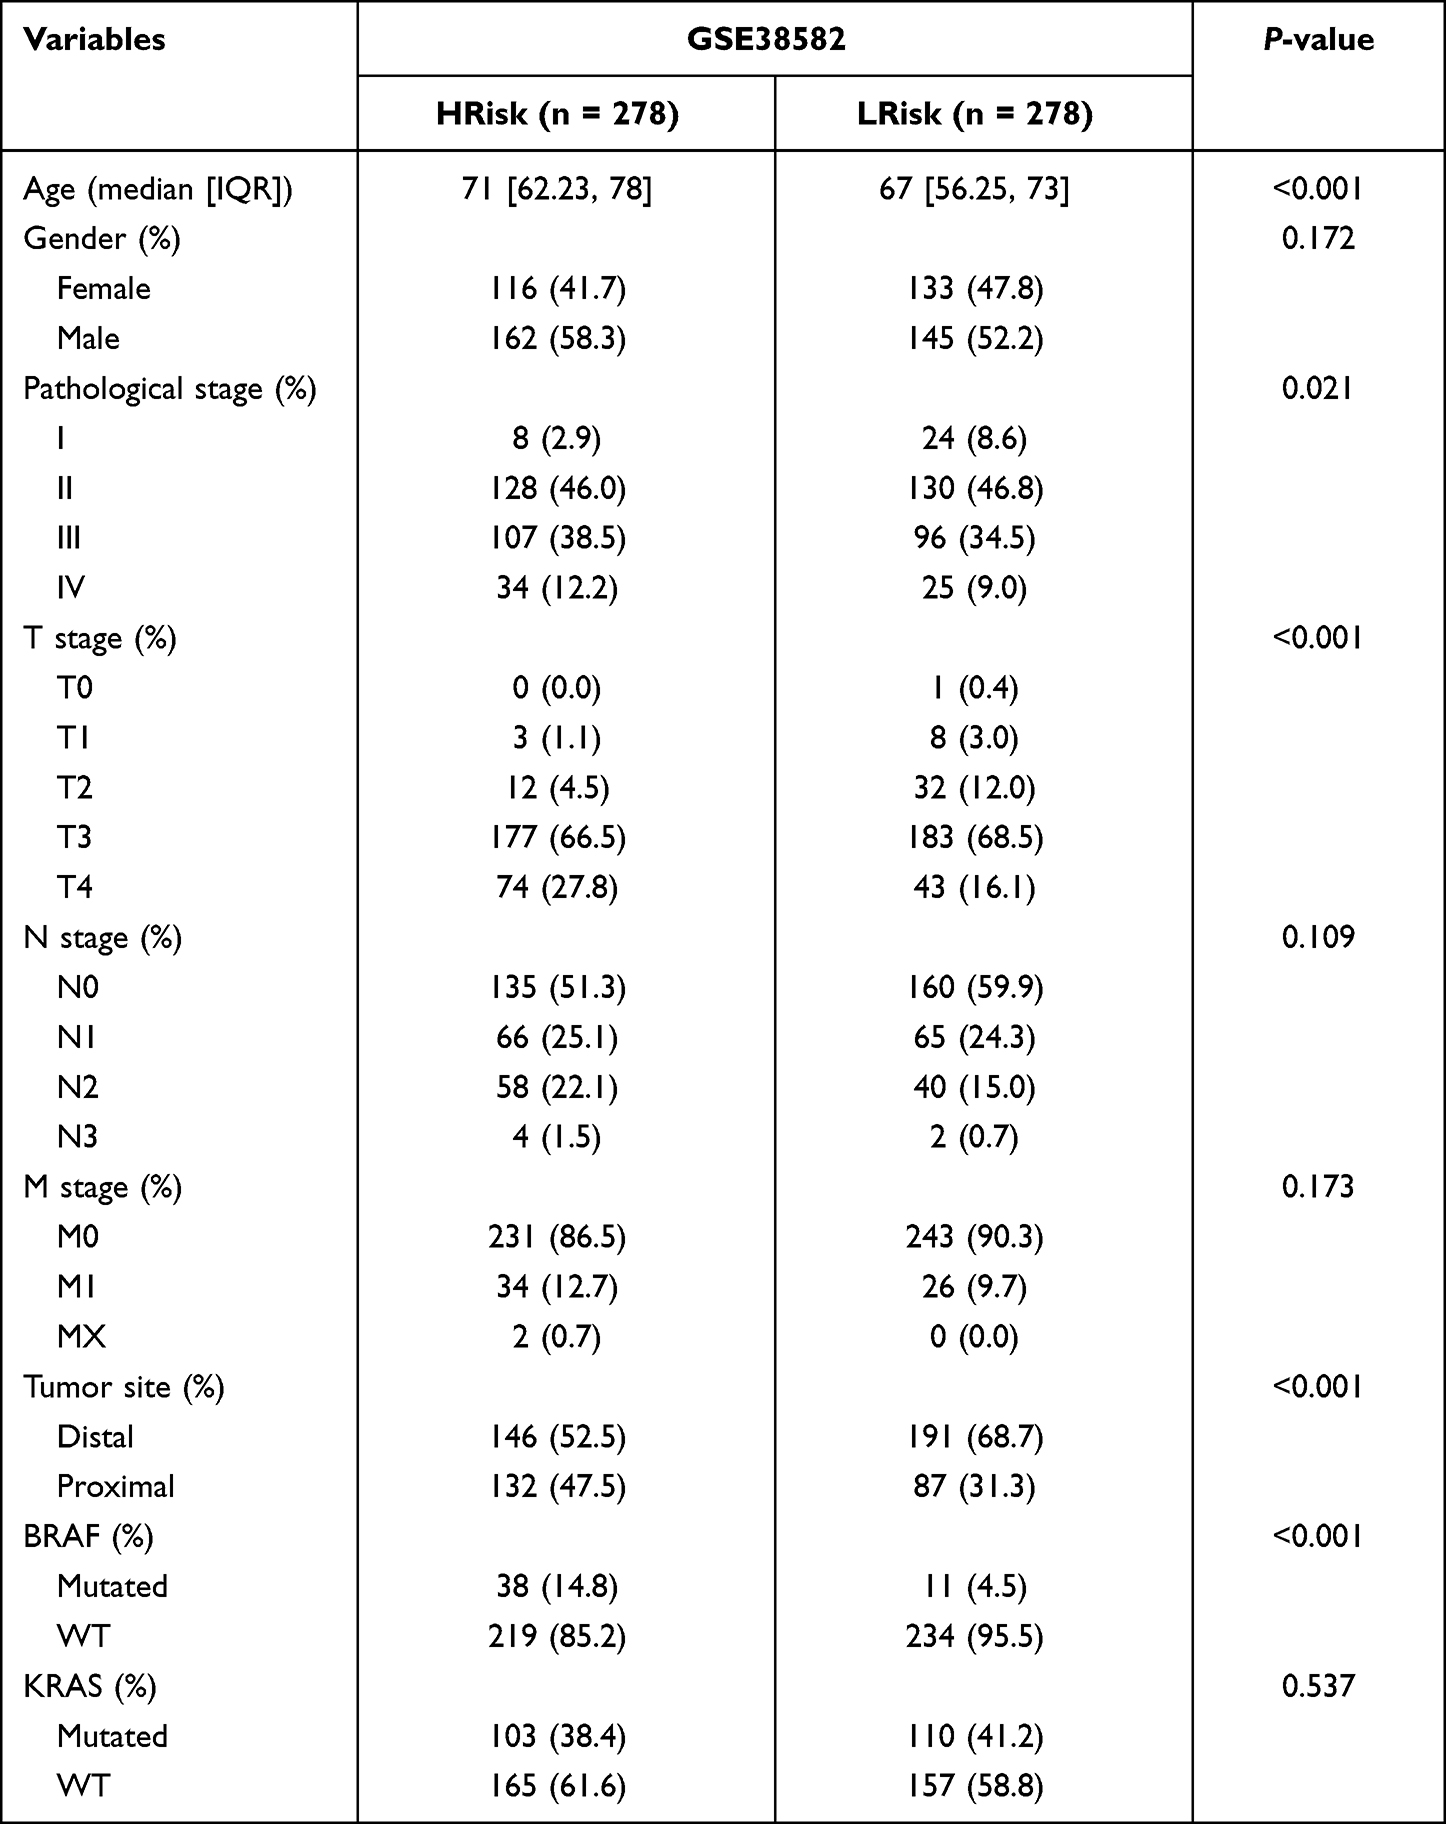 |
Table 3 Demographic and Molecular Comparison Between HRisk and LRisk in GSE38582 |
 |
Figure 3 The prognostic analysis of a single lncRNA in GEPIA. (A–G) The survival curves of 7 lncRNAs. |
Prognostic Effects of the lncRNA Signature in the Training and Validation Cohorts
Risk score was significantly associated with OS in patients with COAD. Kaplan-Meier curves indicated that prognoses were worse in high-risk group (Figure 4A). In ROC curve analysis, the areas under the curve (AUCs) corresponding to 1-year, 3-year, and 5-year survival were 0.7, 0.73, and 0.81. In the validation cohort, there were differences in OS between the high-risk and low-risk groups, The AUCs corresponding to 1-year, 3-years, and 5-years survival were 0.71, 0.61, and 0.6 (Figure 4B). The distribution patterns of risk scores and survival status are shown in Figures 4C and D. As risk score increased, the mortality rate gradually increased.
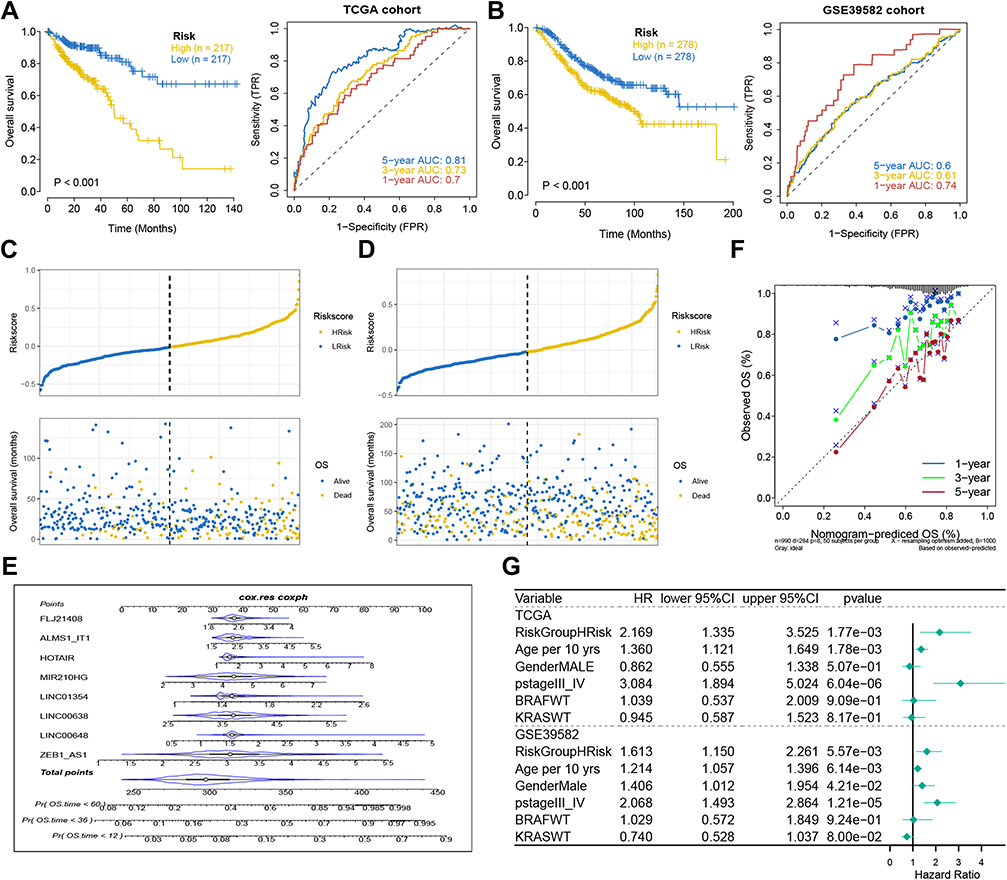 |
Figure 4 Analysis of prognostic survival of patients with COAD by risk model. (A and B) Kaplan-Meier curve and ROC curve drawn by dividing high- and low- risk groups based on the risk model in TCGA (A) and GEO (B) cohorts. (C and D) The risk score value of each sample, the survival status ranked from low to high-risk score in TCGA (C) and GEO (D) cohorts. (E) Nomogram to predict the 1-, 3-, 5-year OS for eight lncRNAs. (F) The calibration curves of the TCGA dataset. (G) The forest plot of multivariate COX regression analysis includes the risk model and clinical features. |
A nomogram of the eight genes was constructed, predicting 1, 3, and 5-year survival (Figure 4E). A calibration curve indicated that the predicted and actual 5-year survival values were in good agreement, but the predicted and actual 1- and 3-year survival values were somewhat discrepant (Figure 4F). In multivariate Cox regression analysis performed based on the risk scores in the training cohort and validation cohort, risk score was a prognostic indicator (training group: p=1.77e-03, hazard ratio: 2.169; Validation group: p=5.57e-03, hazard ratio: 1.613) (Figure 4G). Because the prognostic model, tumor position stage, and BRAF/KRAS mutation types were independent indicators of OS in the two separate datasets, and NRAS mutation and MSI/MSS were also independent prognostic indicators in the TCGA training cohort, stratified analyses were conducted to investigate whether the prognostic model effectively predicted OS in COAD patients with different tumor position stages, BRAF/KRAS/NRAS mutation types, and MSI/MSS types. The results are shown in Figures 5A–I.
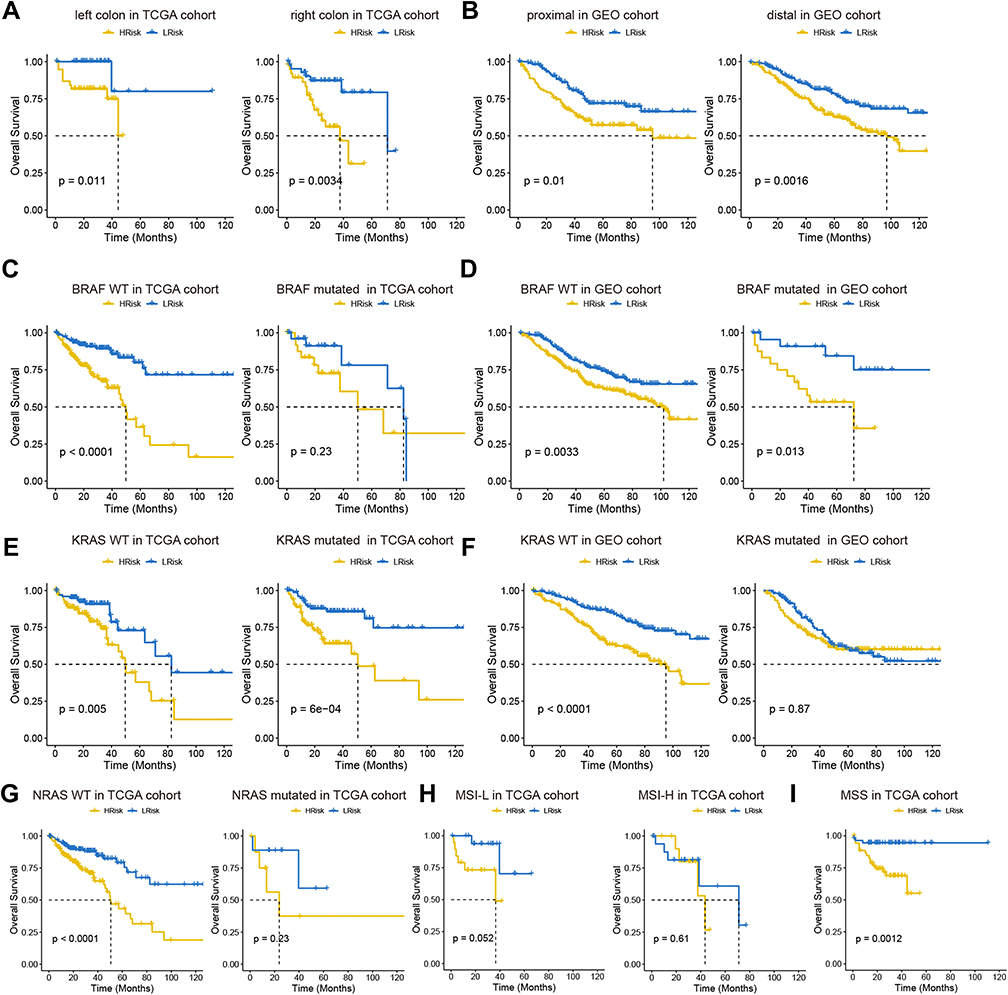 |
Figure 5 Analysis of prognostic survival of patients with COAD by risk model. (A and B) Kaplan-Meier curve based on the tumor location in TCGA (A) and GEO (B) cohort. (C–F) Kaplan-Meier curve based on BRAF and KRAS status in TCGA (C and D) and GEO (E and F) cohorts. NRAS status in TCGA (G). MSI status in TCGA (H). MSS status in TCGA (I). |
COAD Tumor Mutation Profiles
Missense mutations were the most frequent type in the training cohort and the validation cohort. With regard to mutation types, the frequency of single nucleotide polymorphisms was higher than that of deletion and insertion mutations, and C > T was the major type of single nucleotide variant class. In the COAD samples, the top 10 mutated genes in the high-risk group were APC (71%), TP53 (60%), KRAS (44%), PIK3CA (32%), CSMD3 (22%), RYR2 (21%), ZFHX4 (21%), FBXW7 (19%), HTDIN (18%), BRAF (16%), in the low-risk group, they were APC (71%), TP53 (52%), KRAS (42%), PIK3CA (33%), RYR2 (21%), ZFHX4 (21%), SPTA1 (18%), DCSH2 (17%), DMD (17%), CSMD3 (16%) (Figures 6A and B). Details of mutations in the COAD samples in the high-risk and low-risk groups are represented as waterfall diagrams in Figures 6C and D.
 |
Figure 6 The summary information of somatic mutation in colon cancer samples from the TCGA database. (A and B) Somatic mutation in high- and low-risk groups, including frequency of different mutation classification, frequency of mutational variant types, frequency of SNV class, TMB level of each colon cancer sample, and top 10 mutated genes in colon cancer samples. SNP, single nucleotide polymorphism; INS, insertion; DEL, deletion; SNV, single nucleotide variants. (C and D) The waterfall plot of the mutation profile of a single gene in each COAD sample. |
Copy Number Profiles in Between Low-Risk and High-Risk Groups
Tthe GISTIC algorithm was used to analyze copy number data derived from 426 COAD patients downloaded from the database. Frequently changing areas were identified in the high-risk score and low-risk score groups’ genomes (Figures 7A and B). Many areas with significant copy gain and loss were detected. The copy number-altered genomes in the high-risk group were greater than those in the low-risk group because the copy number-lost genomes in the high-risk group were greater than those in the low-risk group (Figure 7C, p<0.05). These results suggested that lncRNA copy deletion may be associated with the occurrence and development of COAD.
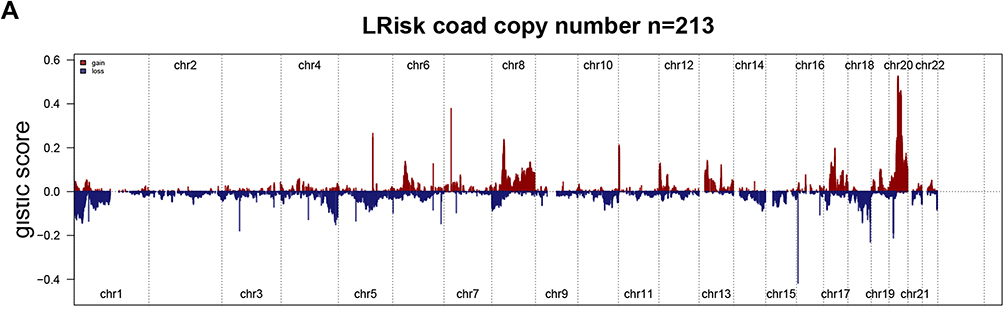 |
Figure 7 Continued. |
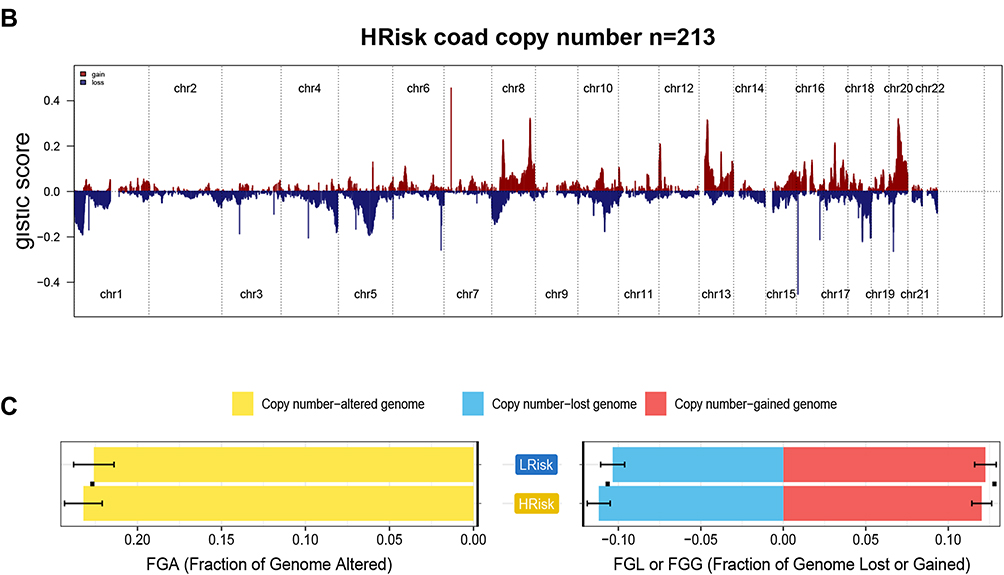 |
Figure 7 Gene copy number variations in COAD. (A and B) The amplification and deletion of gene fragments in COAD patients among two groups. (C) The comparison of copy number of the altered genome, lost genome, and gained genome between high- and low-risk groups. |
Enrichment Analysis
To investigate the biological functions potentially associated with the lncRNA signature, GSEA was conducted in the high-risk and low-risk groups in the TCGA and GEO cohorts. Several tumor process pathways were enriched in the high-risk group, such as degradation of the extracellular matrix (ECM), ECM proteoglycans, ECM organization, and MET activation of PTK2 signaling (Figures 8A and B). The scores of these pathways in the samples are represented as heat maps in Figures 8C and D. Gene ontology and Kyoto Encyclopedia of Genes and Genomes analyses revealed enrichment mainly of genes involved in cell-ECM organization and extracellular structure organization (Figures 8E–H). Generally, ER stress triggers the activation of an adaptive response known as the Unfolded Protein Response. Studies indicate that the mechanism of the unfolded protein response in cell migration and invasion is closely related to ECM remodeling and cell adhesion modification.24 Concordantly, the relatively highly expressed genes in the high-risk group were mainly involved in ECM degradation.
 |
Figure 8 Continued. |
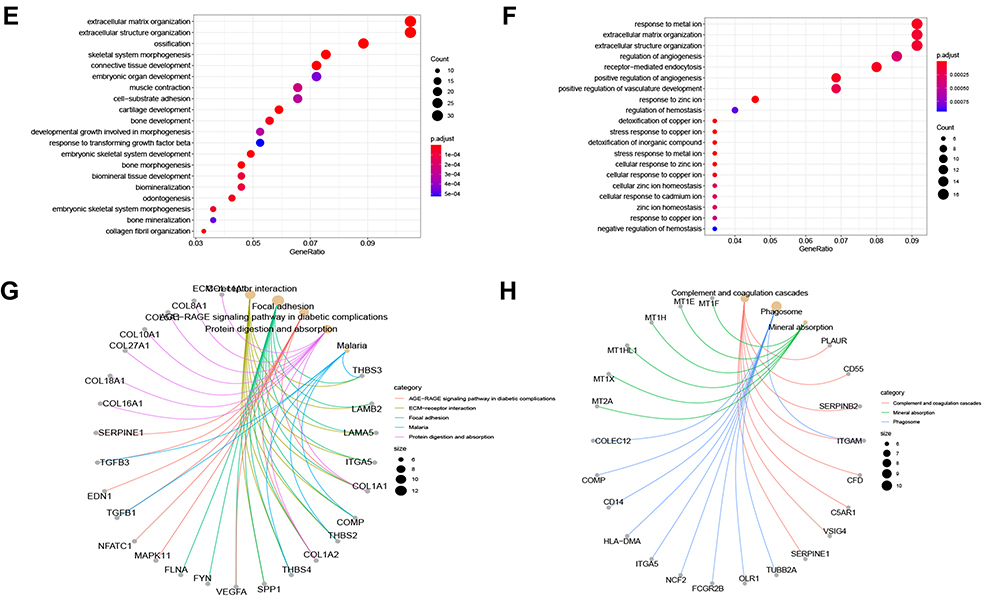 |
Figure 8 Enrichment analysis. (A and B) GSEA analysis reveals pathways in the regulation of high-expressed genes in the high-risk group. (C and D) The heat maps of the scores of enrichment pathways in each sample. (E–H) GO analysis and KEGG analysis. |
Confirmation of Expression of the Eight Genes
After generating the model based on tumor sample data analysis, differences between the eight lncRNAs identified were analyzed in normal samples and tumor samples. Expression of LINC00648 and ALMS1-IT1 were lower in tumor samples than in normal samples, whereas expression of FLJ21408, LINC00638, and MIR210HG were higher (Figures 9A–E).
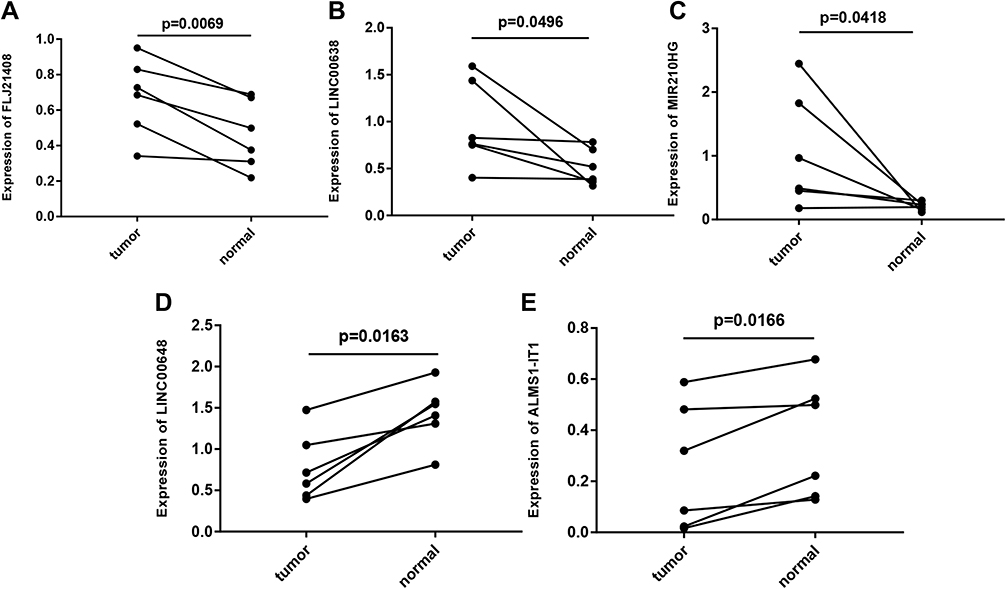 |
Figure 9 Gene expression profiles in clinical samples. (A) FLJ21408 expression profiles in clinical samples. (B) LINC00638 expression profiles in clinical samples. (C) MIR210HG expression profiles in clinical samples. (D) LINC00648 expression profiles in clinical samples. (E) ALMS1-IT1 expression profiles in clinical samples. In clinical samples, the target gene expression was normalized to GAPDH (ΔCt), data are presented as 2−ΔCt. |
Discussion
Despite advances in surgery and chemotherapy in recent years, the prognoses of patients with advanced and metastatic COAD remains unsatisfactory.25,26 In addition, due to molecular heterogeneity, patients with the same TNM stage or similar risk factors may have different clinical outcomes.27,28 Therefore we aimed to establish a risk-scoring model for the early diagnosis of COAD.
LASSO regression and Cox regression were utilized to identify eight ER stress-related lncRNAs, and a new signature that can be used as an independent prediction factor was constructed. By applying this risk prediction signature to the patients, the outcomes of patients with high-risk and low-risk scores can be predicted. Patients in the high-risk group had significantly worse outcomes than those in the low-risk group. These results suggested that the prognostic value of the ER stress-related lncRNA signature was reliable for survival prediction in COAD patients. In the analysis of TMB and CNVs there were differences between patients with high and low scores. The high-risk group had higher CNVs. Genomic CNVs contribute to various types of human dysfunction or tumorigenicity in many ways, suggesting that high-risk groups are at higher risk of tumors.
GSEA revealed potential signal pathways that the 8 ER stress-related lncRNAs were associated with. ECM-related processes were upregulated in the high-risk group. Previous studies indicate that in the course of tumor occurrence and development ECM undergoes a remodeling process.29,30 The reconstructed ECM can create a favorable microenvironment for tumor growth, leading to tumor cell proliferation, invasion, and metastasis.31,32 The relevant characteristics of ECM remodeling can be used as important indicators for tumor clinical staging, early diagnosis, and prognosis.
Eight ER stress-related lncRNAs (LINC01354, MIR210HG, HOTAIR, ALMS1-IT1, and ZEB1-AS1) have been reported to be associated with cancer. LINC01354 promotes the proliferation and invasion of lung cancer cells.33 It is also closely related to the development of colorectal cancer. Studies have shown that LINC01354 promotes the proliferation and metastasis of colorectal cancer,34 and promotes osteosarcoma cell invasion via upregulation of integrin β1.35 MIR210HG is highly expressed in a variety of cancers and it can promote tumor growth in triple-negative breast cancer and non-small cell lung cancer,36,37 as well as the proliferation and invasion of cervical cancer cells.38 HOTAIR acts as an oncogene in human cancer and some studies indicate that HOTAIR enhances liver cancer cell proliferation via the promotion of epithelial-to-mesenchymal transition.39 A recent study indicated an association between a genomic variant within HOTAIR and the risk of psoriasis.40 ALMS1-IT1 reportedly has prognostic value, and some studies indicate that high ALMS1-IT1 expression is associated with a poor prognosis in head and neck squamous cell carcinoma.41 Subsequent studies have suggested that ZEB1-AS1 is highly expressed in glioma and bladder cancer, among others,42,43 and that it is upregulated in hepatocellular carcinoma.44 ZEB1-AS1 regulates ZEB1 expression, promoting tumor cell proliferation and invasion in hepatocellular carcinoma, leading to a poor prognosis. There are few reports on LINC00638, FLJ21408, and LINC00648, thus our future studies will focus on those lncRNAs.
The advantage of the current study is that we generated a prognostic indicator based on an 8-gene signature that predicted survival with relatively high AUCs in both a training cohort and a validation cohort. Nonetheless, the study had some limitations. Neither in vitro nor in vivo mechanism investigations were conducted to confirm the reliability of the signature analysis. Therefore, a large number of experiments will be conducted in the future to demonstrate the mechanistic association between these genes and the progression of COAD.
Conclusions
After a series of bioinformatics analyses and verifications, we constructed a prognostic model consisting of 8 ER stress-related lncRNAs with strong predictive value. To the best of our knowledge, this is the first report of the construction of an ER stress-related lncRNA prognostic model for malignancies. This study provides novel research targets for studying the pathogenesis and progression of COAD.
Abbreviations
ER, endoplasmic reticulum; lncRNAs, long non-coding RNAs; COAD, colon adenocarcinoma; TCGA, the Cancer Genome Atlas; GEO, Gene Expression Omnibus; LASSO, least absolute shrinkage and selection operator; OS, overall survival; TMB, tumor mutation burden; CNVs, copy number variations; GSEA, gene set enrichment analysis; AUC, areas under the curve; ECM, extracellular matrix.
Data Sharing Statement
All data generated or analysed during this study are available in the TCGA (https://portal.gdc.cancer.gov) and the GEO database (https://www.ncbi.nlm.nih.gov/geo/).
Ethics Statement
The clinical samples used in this study was approved by the Ethics Committee of the Third Xiangya Hospital of Central South University, China. And this study complied with the Declaration of Helsinki.
Consent for Publication
All members agree to the publication of this manuscript.
Acknowledgments
We sincerely acknowledge the contributions from the TCGA and GSE38582 projects.
Author Contributions
All authors made a significant contribution to the work reported, whether that is in the conception, study design, execution, acquisition of data, analysis and interpretation, or in all these areas; took part in drafting, revising or critically reviewing the article; gave final approval of the version to be published; have agreed on the journal to which the article has been submitted; and agree to be accountable for all aspects of the work.
Funding
No funding for this research.
Disclosure
The authors have declared that no competing interest exists in this work.
References
1. Brenner H, Kloor M, Pox CP. Colorectal cancer. Lancet 2014;383(9927):1490–1502. doi:10.1016/S0140-6736(13)61649-9
2. Thanikachalam K, Khan G. Colorectal cancer and nutrition. Nutrients. 2019;11:1. doi:10.3390/nu11010164
3. Rizeq B, Zakaria Z, Ouhtit A. Towards understanding the mechanisms of actions of carcinoembryonic antigen-related cell adhesion molecule 6 in cancer progression. Cancer Sci. 2018;109(1):33–42. doi:10.1111/cas.13437
4. Jung G, Hernández-Illán E, Moreira L, Balaguer F, Goel A. Epigenetics of colorectal cancer: biomarker and therapeutic potential. Nat Rev Gastroenterol Hepatol. 2020;17(2):111–130. doi:10.1038/s41575-019-0230-y
5. De Renzi G, Gaballo G, Gazzaniga P, Nicolazzo C. Molecular biomarkers according to primary tumor location in colorectal cancer: current standard and new insights. Oncology. 2021;99(3):135–143. doi:10.1159/000510944
6. Shao S, Hegde RS. Membrane protein insertion at the endoplasmic reticulum. Annu Rev Cell Dev Biol. 2011;27:25–56. doi:10.1146/annurev-cellbio-092910-154125
7. Lagace TA, Ridgway ND. The role of phospholipids in the biological activity and structure of the endoplasmic reticulum. Biochim Biophys Acta. 2013;1833(11):2499–2510. doi:10.1016/j.bbamcr.2013.05.018
8. Schwarz DS, Blower MD. The endoplasmic reticulum: structure, function and response to cellular signaling. Cell Mol Life Sci. 2016;73(1):79–94. doi:10.1007/s00018-015-2052-6
9. Joshi AS, Zhang H, Prinz WA. Organelle biogenesis in the endoplasmic reticulum. Nat Cell Biol. 2017;19(8):876–882. doi:10.1038/ncb3579
10. Moon HW, Han HG, Jeon YJ. Protein quality control in the endoplasmic reticulum and cancer. Int J Mol Sci. 2018;19:10. doi:10.3390/ijms19103020
11. Li C, Xia B, Wang S, Xu J. Folded or degraded in endoplasmic reticulum. Adv Exp Med Biol. 2020;1248:265–294.
12. Swanton E, Bulleid NJ. Protein folding and translocation across the endoplasmic reticulum membrane. Mol Membr Biol. 2003;20(2):99–104. doi:10.1080/0968768031000069241
13. Buchanan BW, Mehrtash AB, Broshar CL, et al. Endoplasmic reticulum stress differentially inhibits endoplasmic reticulum and inner nuclear membrane protein quality control degradation pathways. J Biol Chem. 2019;294(51):19814–19830. doi:10.1074/jbc.RA119.010295
14. Robinson PJ, Pringle MA, Woolhead CA, Bulleid NJ. Folding of a single domain protein entering the endoplasmic reticulum precedes disulfide formation. J Biol Chem. 2017;292(17):6978–6986. doi:10.1074/jbc.M117.780742
15. Fernández A, Ordóñez R, Reiter RJ, González-Gallego J, Mauriz JL. Melatonin and endoplasmic reticulum stress: relation to autophagy and apoptosis. J Pineal Res. 2015;59(3):292–307. doi:10.1111/jpi.12264
16. Fontana F, Moretti RM, Raimondi M, et al. δ-Tocotrienol induces apoptosis, involving endoplasmic reticulum stress and autophagy, and paraptosis in prostate cancer cells. Cell Prolif. 2019;52(3):e12576. doi:10.1111/cpr.12576
17. Li D, Yang C, Yin C, et al. LncRNA, important player in bone development and disease. Endocr Metab Immune Disord Drug Targets. 2020;20(1):50–66. doi:10.2174/1871530319666190904161707
18. Qian X, Zhao J, Yeung PY, Zhang QC, Kwok CK. Revealing lncRNA structures and interactions by sequencing-based approaches. Trends Biochem Sci. 2019;44(1):33–52. doi:10.1016/j.tibs.2018.09.012
19. Ma Z, Zhang J, Xu X, et al. LncRNA expression profile during autophagy and Malat1 function in macrophages. PLoS One. 2019;14(8):e0221104. doi:10.1371/journal.pone.0221104
20. Lin Y, Shen Y, Chen J, Hu C, Zhou Z, Yuan C. The function of LncRNA FTX in several common cancers. Curr Pharm Des. 2021;27(20):2381–2386. doi:10.2174/1381612826666201029164036
21. Li J, Xie J, Wang YZ, et al. Overexpression of lncRNA Dancr inhibits apoptosis and enhances autophagy to protect cardiomyocytes from endoplasmic reticulum stress injury via sponging microRNA-6324. Mol Med Rep. 2021;23:2. doi:10.3892/mmr.2020.11640
22. Wang G, Ye Q, Ning S, et al. LncRNA MEG3 promotes endoplasmic reticulum stress and suppresses proliferation and invasion of colorectal carcinoma cells through the MEG3/miR-103a-3p/PDHB ceRNA pathway. Neoplasma. 2021;68(2):362–374. doi:10.4149/neo_2020_200813N858
23. Xu C, Bailly-Maitre B, Reed JC. Endoplasmic reticulum stress: cell life and death decisions. J Clin Invest. 2005;115(10):2656–2664. doi:10.1172/JCI26373
24. Limia CM, Sauzay C, Urra H, Hetz C, Chevet E, Avril T. Emerging roles of the endoplasmic reticulum associated unfolded protein response in cancer cell migration and invasion. Cancers. 2019;11:5. doi:10.3390/cancers11050631
25. Moghadamyeghaneh Z, Hanna MH, Hwang G, et al. Outcomes of colon resection in patients with metastatic colon cancer. Am J Surg. 2016;212(2):264–271. doi:10.1016/j.amjsurg.2016.01.025
26. Bush A, Humes R, Young P. Colon cancer metastatic to the pancreas presenting as of diabetic ketoacidosis. ACG Case Rep J. 2020;7(10):e00455. doi:10.14309/crj.0000000000000455
27. Henson DE, Hueman MT, Chen D, Patel JA, Wang H, Schwartz AM. The anatomy of the TNM for colon cancer. J Gastrointest Oncol. 2017;8(1):12–19. doi:10.21037/jgo.2016.11.10
28. Liu Q, Luo D, Cai S, Li Q, Li X. P-TNM staging system for colon cancer: combination of P-stage and AJCC TNM staging system for improving prognostic prediction and clinical management. Cancer Manag Res. 2018;10:2303–2314. doi:10.2147/CMAR.S165188
29. Mohan V, Das A, Sagi I. Emerging roles of ECM remodeling processes in cancer. Semin Cancer Biol. 2020;62:192–200. doi:10.1016/j.semcancer.2019.09.004
30. Cai J, Li B, Liu K, Li G, Lu F. Macrophage infiltration regulates the adipose ECM reconstruction and the fibrosis process after fat grafting. Biochem Biophys Res Commun. 2017;490(2):560–566. doi:10.1016/j.bbrc.2017.06.078
31. Acerbi I, Cassereau L, Dean I, et al. Human breast cancer invasion and aggression correlates with ECM stiffening and immune cell infiltration. Integr Biol. 2015;7(10):1120–1134. doi:10.1039/c5ib00040h
32. He X, Lee B, Jiang Y. Cell-ECM interactions in tumor invasion. Adv Exp Med Biol. 2016;936:73–91.
33. Yang G, Yang C, She Y, Shen Z, Gao P. LINC01354 enhances the proliferation and invasion of lung cancer cells by regulating miR-340-5p/ATF1 signaling pathway. Artif Cells, Nanomed Biotechnol. 2019;47(1):3737–3744. doi:10.1080/21691401.2019.1667816
34. Li J, He M, Xu W, Huang S. LINC01354 interacting with hnRNP-D contributes to the proliferation and metastasis in colorectal cancer through activating Wnt/β-catenin signaling pathway. J Exp Clin Cancer Res. 2019;38(1):161. doi:10.1186/s13046-019-1150-y
35. Jiang Y, Luo Y. LINC01354 promotes osteosarcoma cell invasion by up-regulating integrin β1. Arch Med Res. 2020;51(2):115–123. doi:10.1016/j.arcmed.2019.12.016
36. Du Y, Wei N, Ma R, Jiang SH, Song D. Long noncoding RNA MIR210HG promotes the Warburg effect and tumor growth by enhancing HIF-1α translation in triple-negative breast cancer. Front Oncol. 2020;10:580176. doi:10.3389/fonc.2020.580176
37. Kang X, Kong F, Huang K, et al. LncRNA MIR210HG promotes proliferation and invasion of non-small cell lung cancer by upregulating methylation of CACNA2D2 promoter via binding to DNMT1. Onco Targets Ther. 2019;12:3779–3790. doi:10.2147/OTT.S189468
38. Wang AH, Jin CH, Cui GY, et al. MIR210HG promotes cell proliferation and invasion by regulating miR-503-5p/TRAF4 axis in cervical cancer. Aging. 2020;12(4):3205–3217. doi:10.18632/aging.102799
39. Yang T, He X, Chen A, Tan K, Du X. LncRNA HOTAIR contributes to the malignancy of hepatocellular carcinoma by enhancing epithelial-mesenchymal transition via sponging miR-23b-3p from ZEB1. Gene. 2018;670:114–122. doi:10.1016/j.gene.2018.05.061
40. Rakhshan A, Zarrinpour N, Moradi A, et al. A single nucleotide polymorphism within HOX transcript antisense RNA (HOTAIR) is associated with risk of psoriasis. Int J Immunogenet. 2020;47(5):430–434. doi:10.1111/iji.12482
41. Luan T, Zhang TY, Lv ZH, et al. The lncRNA ALMS1-IT1 may promote malignant progression of lung adenocarcinoma via AVL9-mediated activation of the cyclin-dependent kinase pathway. FEBS Open Bio. 2021;11(5):1504–1515. doi:10.1002/2211-5463.13140
42. Wei N, Wei H, Zhang H. Long non-coding RNA ZEB1-AS1 promotes glioma cell proliferation, migration and invasion through regulating miR-577. Eur Rev Med Pharmacol Sci. 2018;22(10):3085–3093. doi:10.26355/eurrev_201805_15068
43. Zhao X, Wang D, Ding Y, Zhou J, Liu G, Ji Z. lncRNA ZEB1-AS1 promotes migration and metastasis of bladder cancer cells by post-transcriptional activation of ZEB1. Int J Mol Med. 2019;44(1):196–206. doi:10.3892/ijmm.2019.4187
44. Fu J, Cui Y. Long noncoding RNA ZEB1-AS1 expression predicts progression and poor prognosis of colorectal cancer. Int J Biol Markers. 2017;32(4):e428–e33. doi:10.5301/ijbm.5000303
 © 2022 The Author(s). This work is published and licensed by Dove Medical Press Limited. The full terms of this license are available at https://www.dovepress.com/terms.php and incorporate the Creative Commons Attribution - Non Commercial (unported, v3.0) License.
By accessing the work you hereby accept the Terms. Non-commercial uses of the work are permitted without any further permission from Dove Medical Press Limited, provided the work is properly attributed. For permission for commercial use of this work, please see paragraphs 4.2 and 5 of our Terms.
© 2022 The Author(s). This work is published and licensed by Dove Medical Press Limited. The full terms of this license are available at https://www.dovepress.com/terms.php and incorporate the Creative Commons Attribution - Non Commercial (unported, v3.0) License.
By accessing the work you hereby accept the Terms. Non-commercial uses of the work are permitted without any further permission from Dove Medical Press Limited, provided the work is properly attributed. For permission for commercial use of this work, please see paragraphs 4.2 and 5 of our Terms.