")
Back to Journals » International Journal of General Medicine » Volume 14
Identification and Validation of a Seizure-Free-Related Gene Signature for Predicting Poor Prognosis in Lower-Grade Gliomas
Authors Li J, Huan J, Yang F, Chen H, Wang M, Heng X
Received 19 July 2021
Accepted for publication 28 September 2021
Published 29 October 2021 Volume 2021:14 Pages 7399—7410
DOI https://doi.org/10.2147/IJGM.S329745
Checked for plagiarism Yes
Review by Single anonymous peer review
Peer reviewer comments 2
Editor who approved publication: Dr Scott Fraser
Jinxing Li,1,2 Jing Huan,1 Fu Yang,1,2 Haixin Chen,2,3 Mingguang Wang,2 Xueyuan Heng2
1Guangzhou University of Chinese Medicine, Guangzhou, 510006, Guangdong, People’s Republic of China; 2Department of Neurosurgery, Linyi People’s Hospital, Linyi, 276000, Shandong, People’s Republic of China; 3Weifang Medical University, Weifang, 261053, Shandong, People’s Republic of China
Correspondence: Xueyuan Heng
Department of Neurosurgery, Linyi People’s Hospital, Linyi, 276000, Shandong, People’s Republic of China
Tel +86 13908990919
Email [email protected]; [email protected]
Background: Lower-grade gliomas (LGGs) patients presented seizure-free have a worse survival than those presented with seizures. However, the current knowledge on its potential value in LGGs remains scarce.
Purpose: This study aimed to identify a novel gene signature associated with seizures-free for predicting poor prognosis for LGGs patients.
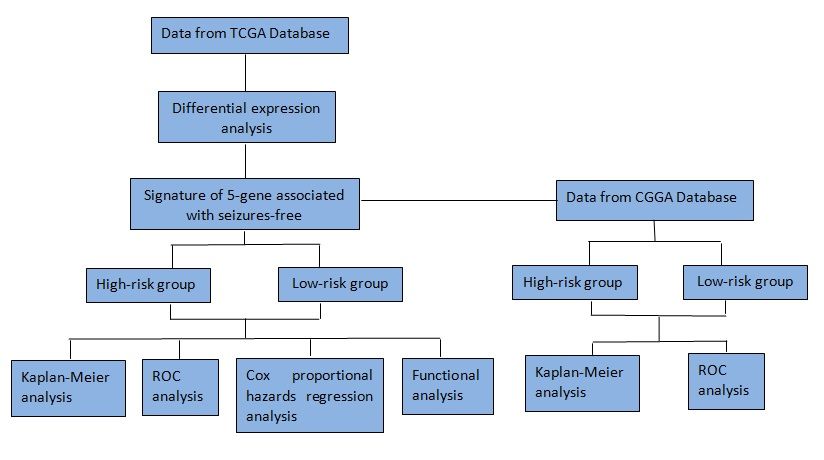
Materials and Methods: The RNA expression and clinical information of LGGs patients were downloaded from the Cancer Genome Atlas database. Differentially expressed genes (DEGs) were screened out between LGGs patients presented seizures-free and seizures. The novel gene signature was constructed by Lasso and multivariate regression analyses for predicting prognosis in LGGs. Its prognostic value was assessed and validated by Kaplan–Meier analyses and receiver operating characteristic (ROC) curves. Multivariate regression analysis was applied to identify the independent prognostic value of the gene signature. Furthermore, bioinformatics analysis was performed to elucidate the molecular mechanisms.
Results: A total of 253 DEGs were screened out between LGG patients presented with seizures and free of seizures. A 5-gene signature (HIST1H4F, HORMAD2, LILRA3, PRSS33, and TBX20 genes) was constructed from these 253 DEGs. Kaplan–Meier analyses and ROC curves assessed and validated the good performance of the 5-gene signature in differentiating and predicting prognosis of high- and low-risk patients. Multivariate regression analysis determined the independent prognostic value of the 5-gene signature. According to bioinformatics analysis, DEGs were mainly enriched in biological processes related to positive regulation of transcription from RNA polymerase II promoter, G-protein coupled receptor signaling pathway, and pathways of cytokine–cytokine receptor interaction, chemokine signaling pathway.
Conclusion: Our findings suggested that the 5-gene signature might serve as a potential prognostic biomarker and provide guidance for the personalized LGGs management.
Keywords: lower-grade gliomas, seizures-free, gene signature
Graphical Abstract:
Introduction
Lower-grade gliomas (LGGs), comprising grade II and grade III diffuse gliomas, represent an important class of malignant primary brain tumors with high morbidity and mortality worldwide.1 The poor prognosis has predominantly been determined by lack of early symptoms and high rate of relapse. Epileptic seizures, often referred to simply as seizures, are common in patients with LGGs.2 LGGs are at the highest risk for developing seizures among the primary brain tumors. The incidence of seizures is approximately 65–90% in LGGs.3 In most cases, seizures represent as an initial symptom and prompt diagnosis. Interestingly, many studies have shown that seizures predict more favorable outcomes in patients of LGGs. Two recent studies revealed that seizures at presentation had better survival outcomes than absence of seizures in LGGs.4,5 A meta-analysis confirmed that LGGs patients presented free of seizures had a worse overall survival (OS) than those presented seizures.6 The reasons for this survival gap between seizures and seizures-free patients are considered to be multi-factorial and still poorly understood. A known explanation is that LGGs patients presenting with seizures can prompt early detection of this disease.7 In contrast, several studies have suggested that one appealing mechanism behind the survival gap might be isocitrate dehydrogenase 1 (IDH1) mutations or synaptic and electrical integration in neural circuits rather than early detection prompted by seizures.8–10 Besides, it was reported that gliomas located supratentorially and cortically had a greater risk of seizures.11 A meta-analysis suggested that frontal gliomas were associated with a higher risk of preoperative seizures, while gliomas in the occipital lobe were associated with a lower seizure risk.12
Over the past decades, the development of molecular biology has prompted our ability of early diagnosis and prognosis assessment of LGGs. A number of gene expression signatures have been identified to predict the survival of LGGs patients.1,13,14 But it is still paramount to find more powerful signatures as all the existing prognostic signatures have been shown to offer only a marginal clinical utility.15 Recently, an increasing number of studies have showed that the combination of differentially expressed genes (DEGs) and clinicopathological parameters result in more effective prognostic evaluation of cancers.16 However, no prognostic signatures have been established in LGGs patients based on DEGs associated with seizures-free yet. In this study, we constructed a novel signature associated with seizures-free in survival risk stratification of LGGs patients. With this risk model, high-risk patients could be picked out for more effective and personalized treatment strategies.
Materials and Methods
Databases
The level 3 RNA sequencing and clinical data for LGGs patients in The Cancer Genome Atlas (TCGA) (http://tcga-data.nci.nih.gov/tcga/) database were obtained using R software and TCGAbiolinks package.17 Subsequently, we evaluated the eligibility of clinical data. We included patients aged 18 years or older who had a lower-grade (WHO grade II and III) glioma (astrocytoma, oligoastrocytoma, or oligodendroglioma). Also, only individuals with complete clinical information, such as age, gender, tumor histological grade, OS, radiation and themotherapy were included in the study. Overall, 272 individuals from TCGA database were included in the study. All samples obtained from the TCGA platform were used as the training dataset. A RNA-seq expression dataset including 157 patients with LGGs was downloaded from the Chinese Glioma Genome Atlas (CGGA) (http://www.cgga.org.cn/) database and used as the validation dataset. Due to the open access to RNA-Seq expression and clinical data in TCGA and CGGA, additional approval from local ethics committee was not needed for this study.
Identification of DEGs Between Seizures and Seizures-Free
The publicly accessible TCGA RNA-Seq (level 3) data is preprocessed in the RESM normalization method, so that the initial normalization is not needed before differential expression analysis. EdgeR package of the R platform was applied to identify DEGs between seizures and seizures-free group of LGGs patients. In accordance with previous studies, the differential expression thresholds of DEGs were set as |log2 fold change (FC)| >0.5 and P-value <0.05.18,19 The same thresholds were also used to identify DEGs for breast cancer and ovarian cancer.20,21 All DEGs were then enrolled for the construction of gene signature.
Construction of the Gene Signature
Least absolute shrinkage and selection operator (Lasso) and multivariate regression analyses are commonly applied to select prognostic genes in various conditions. Lasso regression model selects candidate prognostic genes by estimating the likelihood deviance and the ideal coefficient. In R platform, Lasso regression method is implemented by glmnet package. First, all DEGs were subjected to Lasso approach for preliminary selection of prognostic genes. Next, multivariate regression was employed to select the most prognostic genes. The same approach was used to identify gene signatures for LGGs and endometrial carcinoma.22,23 And genes were considered significant with a cut-off of P-value <0.05. The prognostic gene signature was computed as follows: risk score = (βgene1 × expression value of gene1) +(βgene2 × expression value of gene2) +(βgene3 × expression value of gene3)+ … +(βgenei × expression value of genei). βgenei stood for regression coefficient of genei.
Assessment and Validation the Gene Signature
The prognostic performance of this gene signature in LGGs OS was evaluated by time-dependent receiver operating characteristic (ROC) through the timeROC package. According to the median risk score, 272 LGGs patients were dichotomized into high- and low-risk groups. Survival analysis of high- and low-risk groups was carried out using the survival and survivalROC packages. The prognostic power of this risk model was subsequently validated in an external dataset from CGGA.
Independent Prognostic Value of the Gene Signature
Moreover, Cox proportional hazards regression analysis was conducted to estimate hazard ratios (HRs) and their 95% confidence intervals (CIs) for potential prognostic factors such as age, gender, radiation therapy, risk score, and so forth. Univariate Cox proportional regression analysis was used to screen out the relevant factors affecting the OS. Multivariate Cox proportional hazards regression model was used to analyze the independent prognostic factors influencing the OS of patients. Only factors with statistical significance in univariate regression analysis will be further subjected to multivariate Cox proportional hazard regression model. Cox proportional hazards regression models were tested using the coxph() function of the R survival package. P-value <0.05 was considered as statistically significant.
Bioinformatics Analysis
DEGs between high- and low-risk patients were identified using R edgeR package. The differential expression thresholds of DEGs were set as |log2 fold change (FC)| >0.5 and P-value <0.05. To further analyze biological processes of DEGs, bioinformatics analysis including Gene Ontology (GO) and Kyoto Encyclopedia of Genes and Genomes (KEGG) pathway was carried out via the Database for Annotation, Visualization, and Integration Discovery (DAVID, https://david.ncifcrf.gov). P-value <0.05 and enriched gene count >2 were considered statistically enriched in GO terms and the KEGG pathways.
Statistical Analysis
All statistical analyses were conducted by R software and SPSS v.23.0 software (IBM Corp.). Student’s t-test for independent samples was performed to assess the significant differences between the two groups. Spearman correlation analysis was used for the correlation analysis.
Results
Identification of DEGs Between Seizures and Seizures-Free LGGs Patients
Two hundred and seventy-two LGGs patients were divided into the seizures (n = 223) and seizures-free (n = 49) groups according to their first presenting symptom. Table 1 summarizes patient demographics and clinical characteristics in TGGA cohort. For covariates, age, gender, tumor grade, tumor location, loco-regional surgery, molecular therapy, and radiation therapy all yielded no statistical differences between LGGs patients with and without seizures. In total, 253 DEGs were achieved between LGGs patients presented with seizures and free of seizures (Supplementary Table 1). Among them, 223 were up-regulated and 30 were down-regulated between two groups.
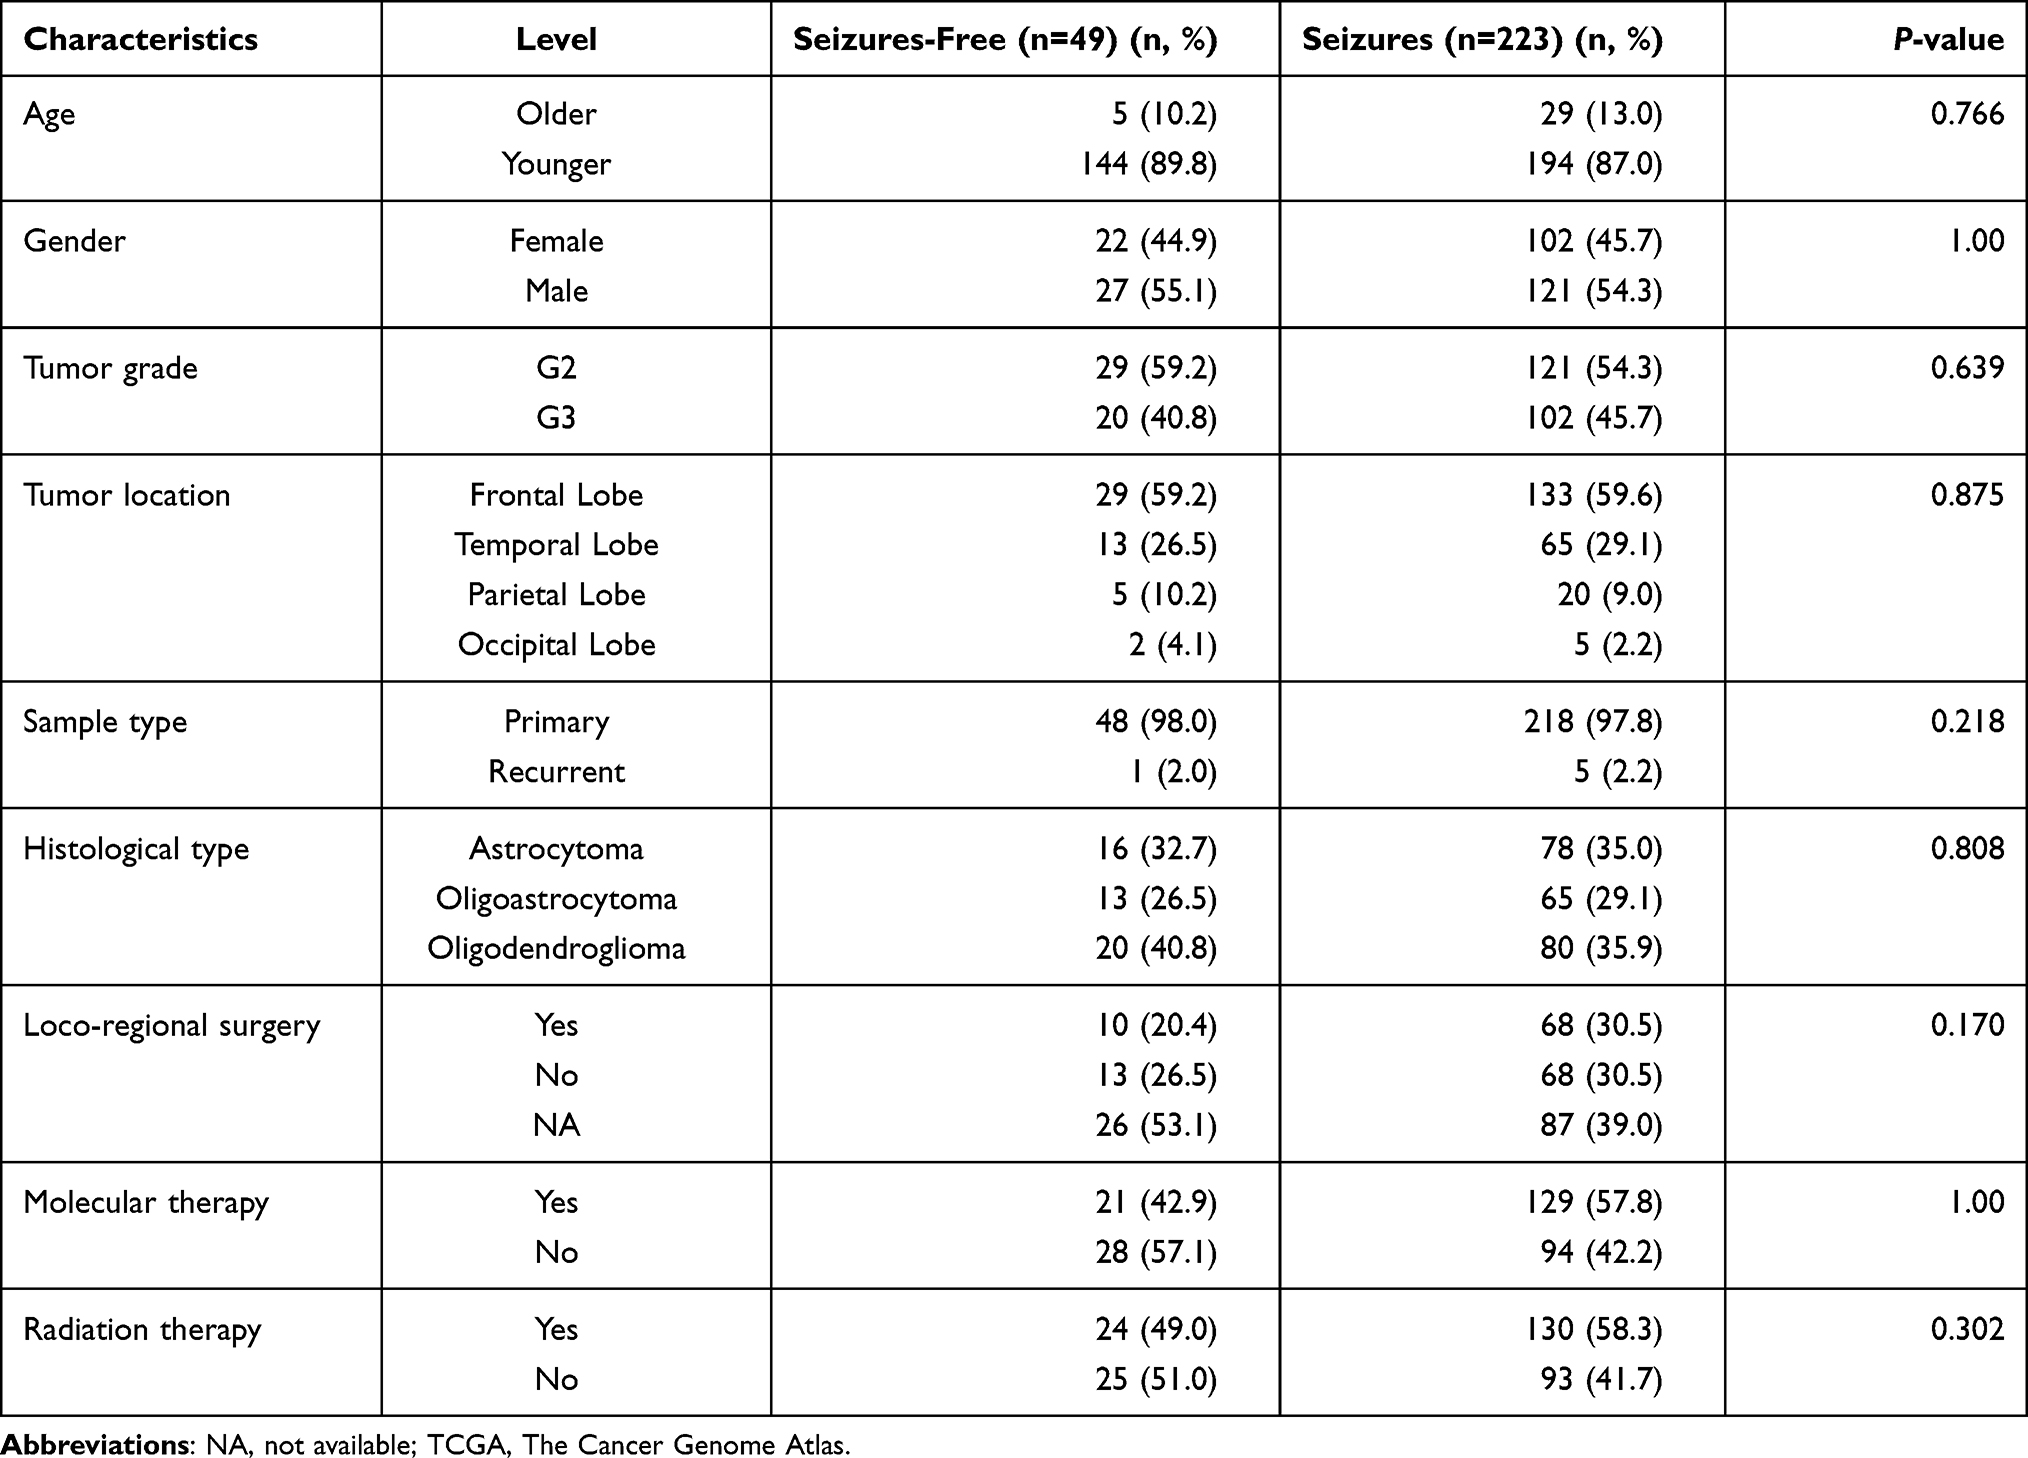 |
Table 1 Clinical Characteristics and Therapy Information in TCGA Cohort |
Construction of the Prognostic Model
A total of 253 DEGs were incorporated into Lasso approach for preliminary selection of prognostic genes. As a result, 24 candidate prognostic genes were obtained through Lasso regression model (Figure 1A and B) and the name and coeff-value of each gene are shown in Figure 1C. As shown in Figure 1D, the area under the ROC curve (AUC) is 0.8343, which means that the prognostic effect of the whole 24 genes is 83.43%. Following proportional regression model, five genes (HIST1H4F, HORMAD2, LILRA3, PRSS33, and TBX20 gene) were ultimately identified as prognostic signature. The linear prediction model was characterized on the basis of the regression coefficient of each prognostic gene in the multivariate analysis. The risk score was imputed as follows: risk score = (−3.6638 × expression value of HIST1H4F) + (0.5897 × expression value of HORMAD2) + (0.5533 × expression value of LILRA3) + (0.2498 × expression value of PRSS33) + (−1.55280 × expression value of TBX20).
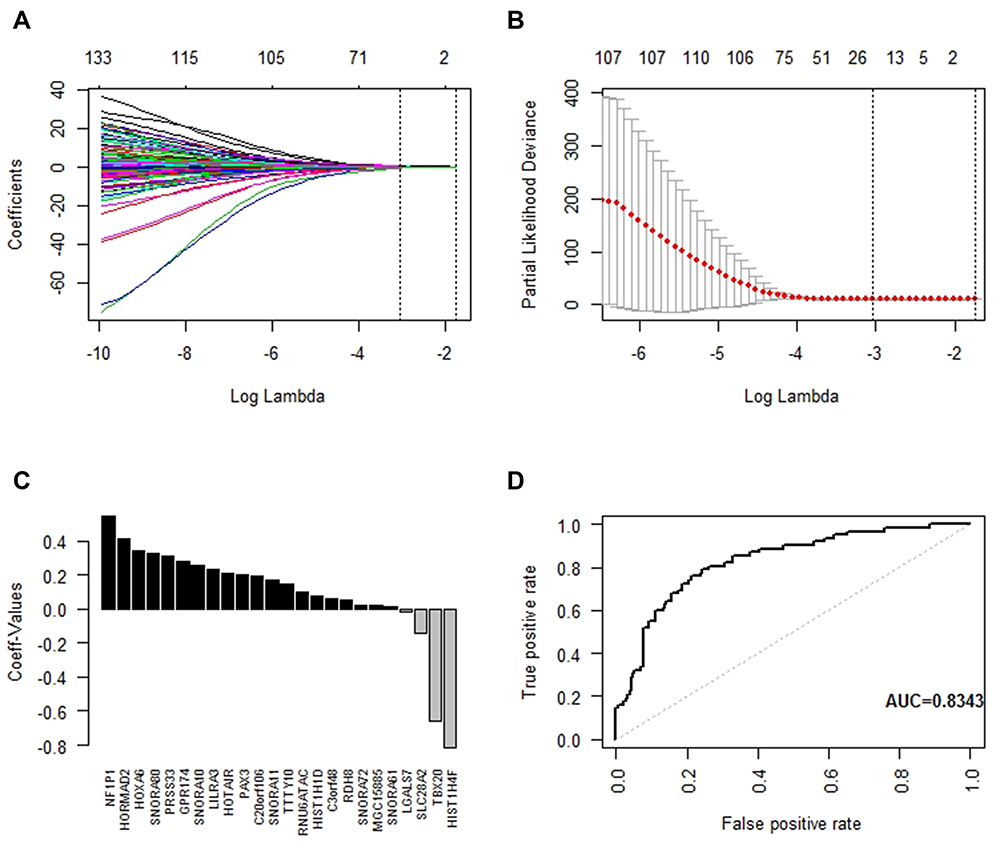 |
Figure 1 The preliminary selection of candidate prognostic genes by Lasso methods. (A) Ten-time cross-validation for tuning parameter selection in the Lasso model. (B) Partial likelihood deviation map with Lasso approach. (C) Coeff-values of the preliminary selected 24 genes. (D) ROC curve for the preliminary selected 24 genes. Abbreviations: Lasso, least absolute shrinkage and selection operator; ROC, receiver operating characteristic. |
Assessment of the Prognostic Model
According to the median risk score, 272 LGGs patients were divided into high- (n = 136) and low-risk (n = 136) groups. Kaplan–Meier analysis revealed that high-risk patients were linked to worse OS outcome compared with low-risk ones (P < 0.0001; Figure 2). To evaluate the prognostic signature in different clinical parameters, we adopted stratified survival analyses. Similarly, the results on OS were in favor of low-risk patients for age (younger, P < 0.0001; older, P = 0.036), gender (male, P < 0.0001; female, P = 0.0046), tumor grade (G2, P < 0.0001; G3, P < 0.0001), and seizures (with, P < 0.0001; without, P < 0.0001). Kaplan–Meier curves of all above stratified survival analyses are provided in Figure 3. ROC curves of the 1-, 3- and 5-year OS was constructed to reveal the predictive performance of the 5-gene signature. The AUC of the signature for 1-, 3- and 5-year OS is 0.885, 0.811, and 0.798, respectively (Figure 4).
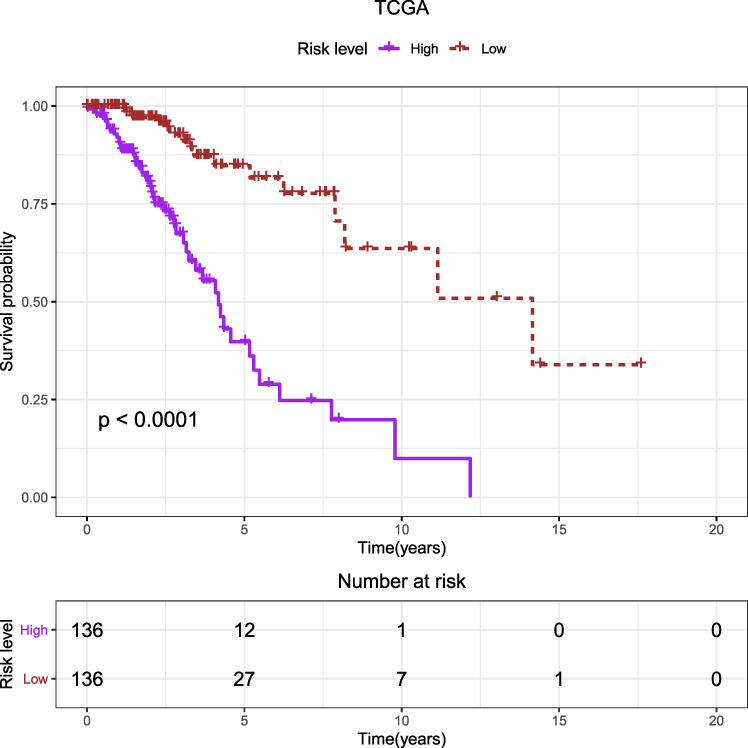 |
Figure 2 Kaplan–Meier curves of the five-gene signature for high- (n = 136) and low-risk (n = 136) patients with lower-grade gliomas in TCGA database. Abbreviation: TCGA, The Cancer Genome Atlas. |
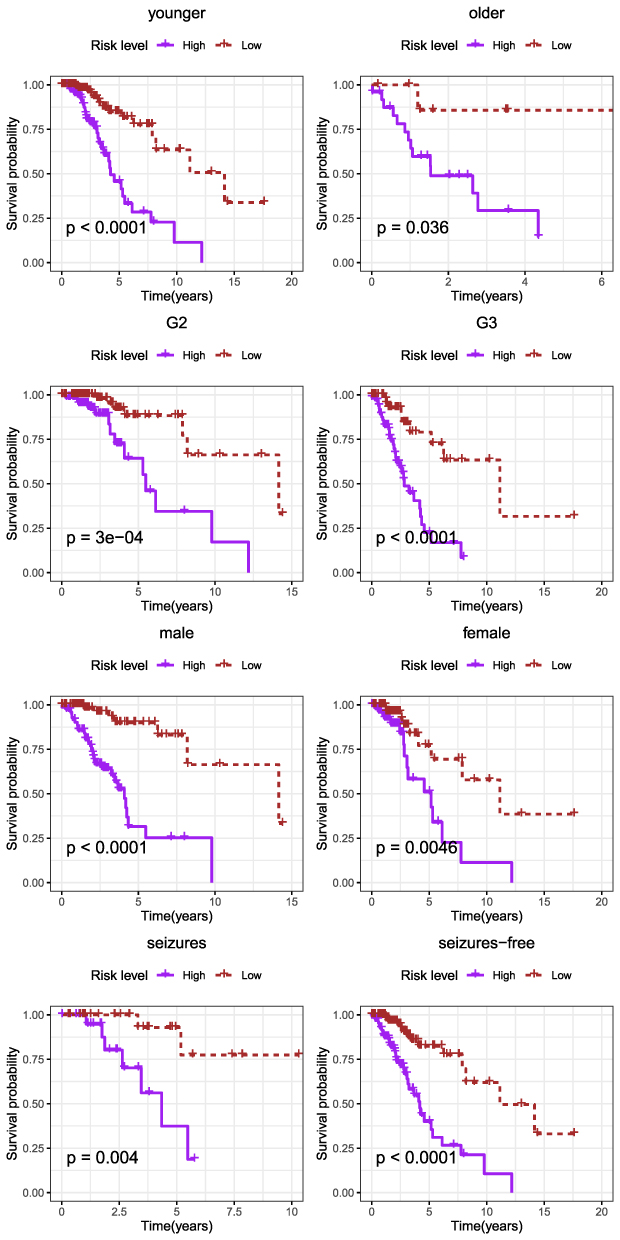 |
Figure 3 Kaplan–Meier curves of the five-gene signature for high- (n = 136) and low-risk (n = 136) patients with lower-grade gliomas stratified by age, gender, tumor grade, and seizures status in TCGA database. Abbreviation: TCGA, The Cancer Genome Atlas. |
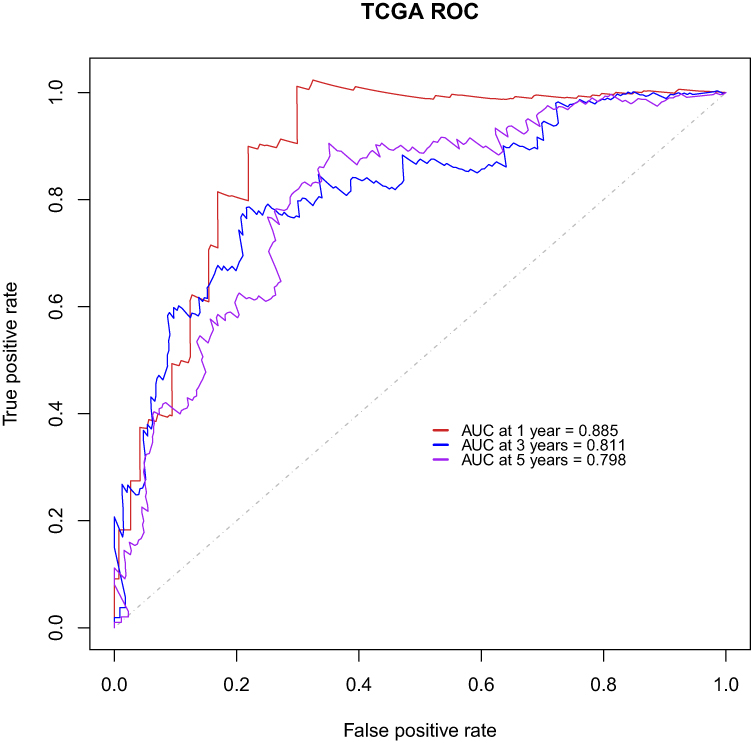 |
Figure 4 ROC of the five-gene signature for predicting the 1-, 3- and 5-year survival of 272 patients with lower-grade gliomas in TCGA database. Abbreviations: TCGA, The Cancer Genome Atlas; ROC, receiver operating characteristic. |
Validation of the Prognostic Model in CGGA Database
To verify the validity and reliability of the 5-gene signature impact on the prognosis of patients, we downloaded and analyzed an external dataset with a cohort of 157 LGGs cases from CGGA database. In this dataset, Kaplan–Meier survival showed that patients in the high-risk group had a significantly lower survival probability than those in the low-risk group (P < 0.001) (Figure 5). To further validate the accuracy of the risk prediction model, ROC curves of the 1-, 3- and 5-year OS were applied to reveal the predictive performance. Similar to that observed in TCGA database, the results showed that the AUC of the signature for 1-, 3- and 5-year OS is 0.778, 0.703, and 0.669, respectively (Figure 6).
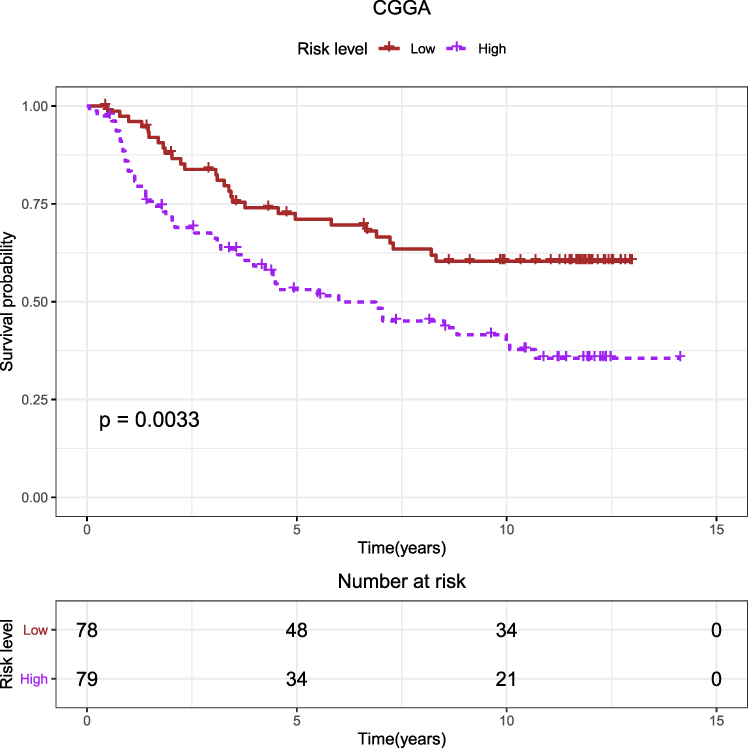 |
Figure 5 Kaplan–Meier curves of the five-gene signature for high- (n = 136) and low-risk (n = 136) patients with lower-grade gliomas stratified by age, gender, tumor grade, and seizures status in CGGA database. Abbreviation: CGGA, the Chinese Glioma Genome Atlas. |
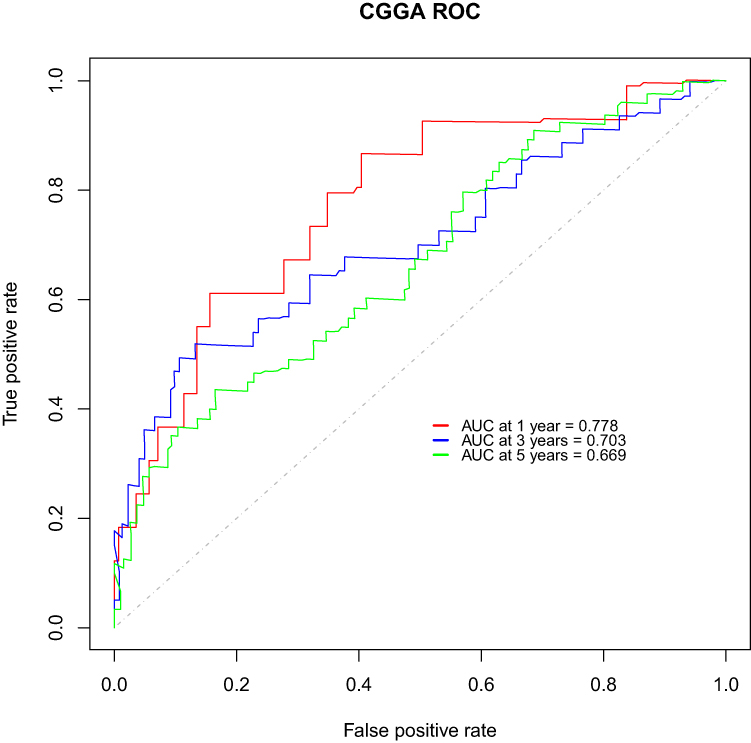 |
Figure 6 ROC of the five-gene signature for predicting the 1-, 3- and 5-year survival of 157 patients with lower-grade gliomas in CGGA database. Abbreviations: CGGA, the Chinese Glioma Genome Atlas; ROC, receiver operating characteristic. |
Independent Prognostic Value of the Signature
To determine the independent prognostic value of the five-gene signature for LGGs patients, univariate and multivariate regression analyses were conducted in TCGA database. Univariate proportional risk analysis demonstrated that the 5-gene signature (HR = 1.132, 95% CI 1.087 −1.179, P < 0.001), age (HR = 1.055, 95% CI 1.034 −1.076, P < 0.001), tumor grade (HR = 3.009, 95% CI 1.772 −5.107, P < 0.001), and radiation therapy (HR = 0.452, 95% CI 0.252 −0.813, P = 0.008) were all significantly correlated with the OS of LGGs patients. Differentiation remained statistically significant when entered in multivariate proportional risk regression with the five-gene signature (HR = 1.085, 95% CI 1.034 −1.134, P < 0.001), except radiation therapy (Table 2).
 |
Table 2 Cox Regression Analysis of Clinical Pathologic Features for OS in TGGA Cohort |
Bioinformatics Analysis
To further analyze biological processes of DEGs between high- and low-risk patients, GO and KEGG pathway enrichment analyses were performed via the online biological tool DAVID. As shown in Figure 7, these DEGs were mainly enriched in biological processes related to positive regulation of transcription from RNA polymerase II promoter, G-protein coupled receptor signaling pathway, and pathways of cytokine–cytokine receptor interaction, chemokine signaling pathway, and so forth.
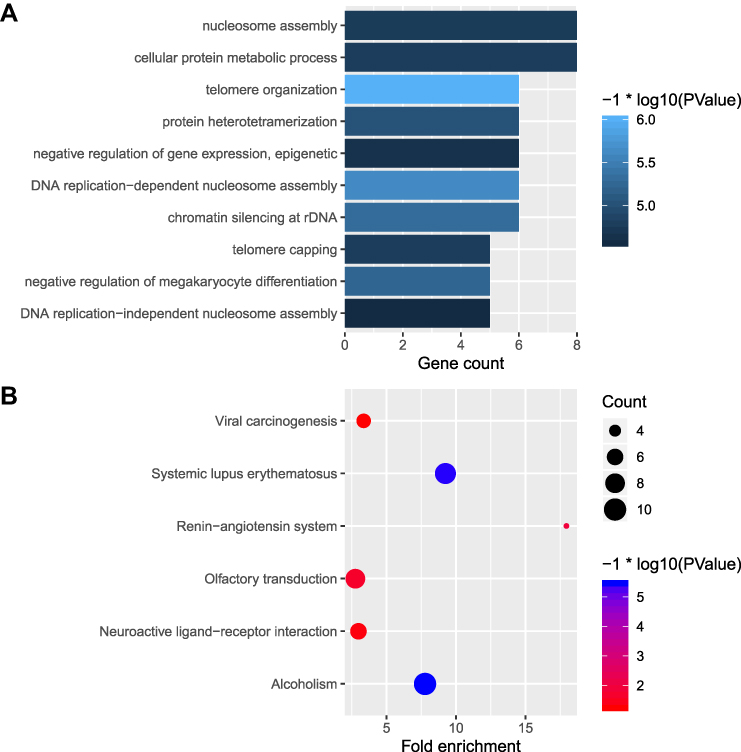 |
Figure 7 Functional enrichment analysis of DEGs between different seizures presentations in lower-grade gliomas. (A) GO enrichment analysis of DEGs between different seizures presentations in lower-grade gliomas. (B) KEGG pathways of DEGs between different seizures presentations in lower-grade gliomas. Abbreviations: DEGs, differentially expressed genes; GO, Gene Ontology; KEGG, Kyoto Encyclopedia of Genes and Genomes. |
Discussion
Seizures refer to symptom related to abnormal excessive electrical activity within the brain. Seizures are frequently the first symptoms of a brain tumor, especially of LGGs. Interestingly, there is a seizures survival advantage in patients with LGGs. Scott and Gibberd first reported the prognostic value of seizures at presentation in gliomas in 1980.24 Seizures have received increasing attention ever since. A meta-analysis with 2088 individuals confirmed the association between seizures at presentation and better survival outcomes in patients with gliomas.6 The reasons for this survival gap between seizures and seizures-free patients are considered to be multi-factorial and still poorly understood. Tumor location, early diagnosis, and IDH mutations might all contribute to the better survival outcomes of seizures patients with LGGs.5,7,12 In addition, exploring the pathogenesis of LGGs and development of more effective prognostic markers are still hot topics in the branch of medicine. However, prognostic signatures based on different seizures presentations have not been identified in patients with LGGs till now.
To our knowledge, this study first constructed prognostic gene signature in LGGs based on different seizures presentations. Considering the combination of DEGs between different seizures presentations result in more effective prognostic signature in LGGs, we identified a total of 253 DEGs in patients with LGGs. Moreover, to gain a deep understanding of biological functions of DEGs between high- and low-risk patients, bioinformatics analysis of GO and KEGG pathways was employed. It revealed that these DEGs were mainly enriched in biological processes related to positive regulation of transcription from RNA polymerase II promoter, G-protein coupled receptor signaling pathway, and pathways of cytokine–cytokine receptor interaction, chemokine signaling pathway, and so forth. Coincidentally, Xue et al conducted a bioinformatics analysis of differentially methylated genes (DMGs) in gliomas and found that DMGs were also enriched in biological processes of positive regulation of transcription from RNA polymerase II promoter and immune response.25 Chemokine and its receptor expression by tumor cells contribute to tumor growth and angiogenesis.26 These biological processes and signaling pathways may contribute to the high risk of gliomas patients.
Lasso and multivariate Cox model is a popular tool to generate prognostic genes in the context of high-dimensional data. Compared to a single-gene biomarker, signatures composed of multiple genes are believed to be more robust and more accurate. With the help of R software and related packages, the prognostic signature was constructed in our study which consisted of five genes, including HIST1H4F, HORMAD2, LILRA3, PRSS33, and TBX20. As expected, Kaplan–Meier analysis found that the five-gene signature model could differentiate the survival outcome of low- and high-risk group of patients. The risk score was confirmed to be effective in different age groups, gender, tumor grade, and seizures status (with vs without). Furthermore, the AUC value of 1-, 3- and 5-year was greater than 0.79, indicating good performance of this risk model in predicting the survival. In addition, a multivariate Cox regression model analysis involving the risk score, age, gender, seizures status, tumor location, loco-regional surgery, radiation and molecular therapy demonstrated that the five-gene signature was an independent prognostic factor. In the TCGA and CGGA cohorts, there was also a prognostic difference between high- and low-risk patients.
The five-gene signature also provided new potential molecular treatment targets of LGGs. Histones are major essential components of chromatin and conserved in eukaryotic cells.27 HIST1H4F, as one of the histone genes, was randomly distributed in human genome. Recent evidence has demonstrated that HIST1H4F was universally hypermethylated in patients with different cancer types, which may act as promising biomarker in screening for early cancer diagnosis in clinical applications.28 For HORMAD2, it was a conserved meiotic chromosomal protein-coding gene in many organisms.29 HORMAD2 was expressed at high levels in the lung adenocarcinoma tissue compared to the adjacent normal lung tissues and detected more frequently in early-stage lung adenocarcinoma, suggesting that HORMAD2 may be a candidate lung adenocarcinoma risk gene.30 To some extent, this is consistent with our finding that high expression of HORMAD2 increased the risk of LGGs. There is a paucity of studies investigating roles of LILRA3, PRSS33, and TBX20 in LGGs type. Further research is needed to elucidate their role in this disorder.
Inevitably, there were several innate limitations towards the present study. First, though the consistence of our results with published data has suggested the validity of our results, it is necessary to be validated in a prospective clinical trial. Second, due to the IDH information was not available in the TCGA-LGGs dataset, the prognostic value of seizures in IDH mutations LGGs was not evaluated in our study. Further prospective studies are necessary to investigate if there is a seizures survival advantage in IDH mutations LGGs. Despite these drawbacks, our findings demonstrated that the five-gene signature could serve as reliable prognostic predictor of LGGs patients.
Conclusion
A five-gene signature was established as a novel biomarker for prognosis and provides guidance for the therapeutic strategy for these patients.
Data Sharing Statement
The data set used and analyzed during this study is available at TCGA (http://tcga-data.nci.nih.gov/tcga/) and CGGA (http://www.cgga.org.cn/).
Disclosure
The authors declare no conflicts of interest.
References
1. Xiao H, Bai J, Yan M, et al. Discovery of 5-signature predicting survival of patients with lower-grade glioma. World Neurosurg. 2019;126:e765–e772. doi:10.1016/j.wneu.2019.02.147
2. van Breemen MSM, Wilms EB, Vecht CJ. Epilepsy in patients with brain tumours: epidemiology, mechanisms, and management. Lancet Neurol. 2007;6(5):421–430. doi:10.1016/S1474-4422(07)70103-5
3. You G, Sha Z-Y, Yan W, et al. Seizure characteristics and outcomes in 508 Chinese adult patients undergoing primary resection of low-grade gliomas: a clinicopathological study. Neuro Oncol. 2012;14(2):230–241. doi:10.1093/neuonc/nor205
4. Wang Y, Wang Y, Fan X, et al. Putamen involvement and survival outcomes in patients with insular low-grade gliomas. J Neurosurg. 2017;126(6):1788–1794. doi:10.3171/2016.5.JNS1685
5. Pouratian N, Mut M, Jagannathan J, Lopes MB, Shaffrey ME, Schiff D. Low-grade gliomas in older patients: a retrospective analysis of prognostic factors. J Neurooncol. 2008;90(3):341. doi:10.1007/s11060-008-9669-3
6. Fan X, Li Y, Shan X, et al. Seizures at presentation are correlated with better survival outcomes in adult diffuse glioma: a systematic review and meta-analysis. Seizure. 2018;59:16–23. doi:10.1016/j.seizure.2018.04.018
7. Lote K, Stenwig AE, Skullerud K, Hirschberg H. Prevalence and prognostic significance of epilepsy in patients with gliomas. Eur J Cancer. 1998;34(1):98–102. doi:10.1016/S0959-8049(97)00374-2
8. Phan K, Ng W, Lu VM, et al. Association between IDH1 and IDH2 mutations and preoperative seizures in patients with low-grade versus high-grade glioma: a systematic review and meta-analysis. World Neurosurg. 2018;111:e539–e545. doi:10.1016/j.wneu.2017.12.112
9. Chen H, Judkins J, Thomas C, et al. Mutant IDH1 and seizures in patients with glioma. Neurology. 2017;88(19):1805–1813. doi:10.1212/WNL.0000000000003911
10. Venkatesh HS, Morishita W, Geraghty AC, et al. Electrical and synaptic integration of glioma into neural circuits. Nature. 2019;573(7775):539–545. doi:10.1038/s41586-019-1563-y
11. Rudà R, Bello L, Duffau H, Soffietti R. Seizures in low-grade gliomas: natural history, pathogenesis, and outcome after treatments. Neuro Oncol. 2012;14(Suppl 4):iv55–64. doi:10.1093/neuonc/nos199
12. Zhang J, Yao L, Peng S, Fang Y, Tang R, Liu J. Correlation between glioma location and preoperative seizures: a systematic review and meta-analysis. Neurosurg Rev. 2019;42(3):603–618. doi:10.1007/s10143-018-1014-5
13. Zhou Z, Huang R, Chai R, et al. Identification of an energy metabolism-related signature associated with clinical prognosis in diffuse glioma. Aging. 2018;10(11):3185–3209. doi:10.18632/aging.101625
14. Jang BS, Kim IA. A radiosensitivity gene signature and PD-L1 predict the clinical outcomes of patients with lower grade glioma in TCGA. Radiother Oncol. 2018;128(2):245–253. doi:10.1016/j.radonc.2018.05.003
15. Ahluwalia P, Mondal AK, Bloomer C, et al. Identification and clinical validation of a novel 4 gene-signature with prognostic utility in colorectal cancer. Int J Mol Sci. 2019;20(15):3818. doi:10.3390/ijms20153818
16. Wu M, Li X, Zhang T, Liu Z, Zhao Y. Identification of a nine-gene signature and establishment of a prognostic nomogram predicting overall survival of pancreatic cancer. Front Oncol. 2019;9:996. doi:10.3389/fonc.2019.00996
17. Colaprico A, Silva TC, Olsen C, et al. TCGAbiolinks: an R/Bioconductor package for integrative analysis of TCGA data. Nucleic Acids Res. 2016;44(8):e71–e71. doi:10.1093/nar/gkv1507
18. Wang L, Li Z, Song X, Liu L, Su G, Cui Y. Bioinformatic analysis of genes and MicroRNAs associated with atrioventricular septal defect in down syndrome patients. Int Heart J. 2016;57(4):490–495. doi:10.1536/ihj.15-319
19. He P, Zhang Z, Liao W, Xu D, Fu M, Kang Y. Screening of gene signatures for rheumatoid arthritis and osteoarthritis based on bioinformatics analysis. Mol Med Rep. 2016;14(2):1587–1593. doi:10.3892/mmr.2016.5423
20. Ruan L, Xie Y, Liu F, Chen X. Serum miR-1181 and miR-4314 associated with ovarian cancer: miRNA microarray data analysis for a pilot study. Eur J Obstet Gynecol Reprod Biol. 2018;222:31–38. doi:10.1016/j.ejogrb.2018.01.006
21. Wang R, Li J, Zhao Y, Li Y, Yin L. Investigating the therapeutic potential and mechanism of curcumin in breast cancer based on RNA sequencing and bioinformatics analysis. Breast Cancer. 2018;25(2):206–212. doi:10.1007/s12282-017-0816-6
22. Ouyang D, Li R, Li Y, Zhu X. A 7-lncRNA signature predict prognosis of Uterine corpus endometrial carcinoma. J Cell Biochem. 2019;120(10):18465–18477. doi:10.1002/jcb.29164
23. Xiao K, Liu Q, Peng G, Su J, Qin C-Y, Wang X-Y. Identification and validation of a three-gene signature as a candidate prognostic biomarker for lower grade glioma. PeerJ. 2020;8:e8312. doi:10.7717/peerj.8312
24. Scott GM, Gibberd FB. Epilepsy and other factors in the prognosis of gliomas. Acta Neurol Scand. 1980;61(4):227–239. doi:10.1111/j.1600-0404.1980.tb01487.x
25. Xue J, Gao HX, Sang W, et al. Identification of core differentially methylated genes in glioma. Oncol Lett. 2019;18(6):6033–6045.
26. Razmkhah M, Arabpour F, Taghipour M, Mehrafshan A, Chenari N, Ghaderi A. Expression of chemokines and chemokine receptors in brain tumor tissue derived cells. Asian Pac J Cancer Prev. 2014;15(17):7201–7205. doi:10.7314/APJCP.2014.15.17.7201
27. Hu Y, Lai Y. Identification and expression analysis of rice histone genes. Plant Physiol Biochem. 2015;86:55–65. doi:10.1016/j.plaphy.2014.11.012
28. Dong S, Li W, Wang L, et al. Histone-related genes are hypermethylated in lung cancer and hypermethylated HIST1H4F could serve as a pan-cancer biomarker. Cancer Res. 2019;79(24):6101–6112. doi:10.1158/0008-5472.CAN-19-1019
29. Wojtasz L, Daniel K, Roig I, et al. Mouse HORMAD1 and HORMAD2, two conserved meiotic chromosomal proteins, are depleted from synapsed chromosome axes with the help of TRIP13 AAA-ATPase. PLoS Genet. 2009;5(10):e1000702. doi:10.1371/journal.pgen.1000702
30. Liu M, Chen J, Hu L, et al. HORMAD2/CT46.2, a novel cancer/testis gene, is ectopically expressed in lung cancer tissues. Mol Hum Reprod. 2012;18(12):599–604. doi:10.1093/molehr/gas033
 © 2021 The Author(s). This work is published and licensed by Dove Medical Press Limited. The full terms of this license are available at https://www.dovepress.com/terms.php and incorporate the Creative Commons Attribution - Non Commercial (unported, v3.0) License.
By accessing the work you hereby accept the Terms. Non-commercial uses of the work are permitted without any further permission from Dove Medical Press Limited, provided the work is properly attributed. For permission for commercial use of this work, please see paragraphs 4.2 and 5 of our Terms.
© 2021 The Author(s). This work is published and licensed by Dove Medical Press Limited. The full terms of this license are available at https://www.dovepress.com/terms.php and incorporate the Creative Commons Attribution - Non Commercial (unported, v3.0) License.
By accessing the work you hereby accept the Terms. Non-commercial uses of the work are permitted without any further permission from Dove Medical Press Limited, provided the work is properly attributed. For permission for commercial use of this work, please see paragraphs 4.2 and 5 of our Terms.