")
Back to Archived Journals » Research and Reports in Biodiversity Studies » Volume 5
Identification and protection of terrestrial global biodiversity hotspots: progress and challenges
Authors Roy A
Received 3 April 2015
Accepted for publication 13 November 2015
Published 20 May 2016 Volume 2016:5 Pages 15—27
DOI https://doi.org/10.2147/RRBS.S70322
Checked for plagiarism Yes
Review by Single anonymous peer review
Peer reviewer comments 3
Editor who approved publication: Dr David Lane
Arijit Roy
Forestry and Ecology Department, Indian Institute of Remote Sensing, Dehradun, India
Abstract: Due to ever-increasing demand on the natural resources, earth is on the verge of a global mass extinction. The biodiversity hotspots are the remnant natural areas of high terrestrial biodiversity which are rapidly degrading and constitute more than half of the global endemic species in approximately 2% of the global land area which requires conservation and protection along with effort to identify new areas. Presently, data gaps and nonavailability of adequate information across the biodiversity hotspots has resulted in unsustainable commercial exploitation in these areas. In this paper, effort has been made to assess the status of the various biodiversity hotspots across the globe with respect to the geographic distribution, the area under natural vegetation, concentration of endemic plants, and the human development index in these areas. Monitoring such a large extent across the globe has its difficulties. The use of recent tools and technologies including earth observation systems and information technology can help in monitoring and identification of the global biodiversity hotspots and help in conservation and protection of these areas. It is suggested to identify the biodiversity-rich areas at a coarse scale and have a detailed study of the biodiversity-rich areas to design appropriate conservation and protection of the biodiversity hotspots.
Keywords: biodiversity hotspots, monitoring, earth observation systems, conservation
Introduction
One of the major challenges for conservation professionals in today’s fast paced globalization is what to conserve and where to conserve. Myers1 had provided a beautiful concept based on the principle of irreplaceability and vulnerability to aid in planning for conservation in the form of “Biodiversity Hotspots”. Since it has been estimated that approximately 44% of the vascular plants and 35% of vertebrates are confined to the then 24 hotspots occupying 1.4% of the land surface,2 protection of these hotspots can result in a significant reduction of the risk of a major chunk of the species from extinction. At present, approximately 36 biodiversity terrestrial hotspots have been identified by Conservation International3 for conservation prioritization, but there may be many more areas where, due to data gaps,4 assessment of an area is not possible and these may be at a greater risk of biodiversity loss due to overexploitation.5 Hence, a quick and effective methodology to characterize the biological diversity of a region is necessary for identification of biodiversity hotspots. This may be either through models or proxies for designing effective conservation strategies to reduce the risk to the global biodiversity.
Biodiversity is closely related to sustainable development and is essential for ecosystem stability. It directly or indirectly benefits human life.6 It has been reported that loss of biodiversity may result in vulnerability to crop production.7 Biodiversity also provides new sources of drugs for health care, essential nutrients to improve human health, and bioremediation to clean up environment. It also contributes economically in terms of nature tourism, non-timber forest produce, crop productivity, pest management, and as environmental change indicators.8 These natural areas help in watershed regulation and soil or coastal zone stabilization9,10 to the extent that these ecosystems if degraded may affect the human society. The loss of populations, species, or groups of species from an ecosystem can upset its normal functioning and disrupt these ecological services. For example, the recent decline in honeybee populations may result in loss of pollination services for fruit crops and flowers.11 Biodiversity also provide medical models (eg, Taxol for cancer drug development12) for research into solving human health issues.
Some of the regions in the world have the ideal conditions for speciation and endemism due to physical isolation, optimum temperature and precipitation, topographical uniqueness, or a combination of all the factors.13 In most of these global biodiversity hotspots, optimal temperature and precipitation coupled with their relative isolation has resulted in regions of endemism. In the recent times mostly during the last few centuries, these regions of high endemism have been extensively degraded mainly due to global economic growth and rapid increase in the human footprints across the globe.14 Furthermore, since the socioeconomic fabric of these regions has depended on subsistence farming and on extraction of forest resources, there has been gradual loss of forests in these regions.
Biodiversity hotspots as defined by Myers and Conservation International15 are those regions of the world which contain a minimum of 0.5% (~1,500) of global endemic vascular plant species (~300,000 estimated for the world) and have less than 30% or less of the original vegetation cover remaining. But this qualification is fuzzy both for the number of species and for the historical extent of the original vegetation cover. This is due to the huge data gap in terms of the number of species surveyed as well as data on the historical coverage of the original vegetation.16 Scientific documentation of the vegetation cover as well as species surveys started only in the 18th century, but it was only in the second half of the 20th century that serious organized surveys of the global species distribution has been initiated.17,18 Another important aspect of the global biodiversity hotspots relates to the spatial boundaries of the hotspot areas and the criteria by which they have been delineated on the map. To address this, a sustained effort is necessary to generate the data required for identifying “what and where” of the biological diversity. And this should not be a top-down or bottom-up approach,19 but a scientific effort toward identification of the “whole” using the latest available tools and techniques. The effort should be coordinated among a global network of scientists, conservationists, academicians, and naturalists all working toward a common goal – identification of additional biologically rich areas under threat of land use and land cover (LULC) change.
Biodiversity hotspots concepts
The concept of biodiversity hotspots proposed by Myers2 and further developed by subsequent workers3 considers only the terrestrial hotspots as the definition also takes into account the percent of land area lost in regions of high endemism. Although at present 36 biodiversity hotspots have been identified, there are still many biodiversity-rich regions on Earth that have an immense contribution in global species diversity and associated economy,20 especially the marine ecosystems such as the coral reefs and deep sea megabenthos.21,22 These aquatic ecosystems probably harbor the highest concentration of biodiversity and endemic species; they also represent some of the highly threatened ecosystems that have not been considered in the present concept of biodiversity hotspots. Recent work in marine biodiversity has resulted in identification of heretofore unknown regions of aquatic biodiversity23 which due to the lack of access and immense distribution across the earth (three-fourth of the earth surface) that can harbor even greater biodiversity than the terrestrial ecosystems. Data from trawling and deep sea remote operating vehicles have provided new areas of high biodiversity in the aquatic ecosystems.24 It has been established that there has been a significant shift in the global marine biodiversity regions throughout the geological history.25 In light of this, there is a need to revise the definition of biodiversity hotspots to include other indicators or some other indices using recent tools and techniques to include the marine ecosystems as biodiversity hotspots26 as well as to include the impact of high population pressure of the coastal regions on the marine biodiversity.27 However in this article, we will restrict the analysis to the terrestrial biodiversity hotspots.
Threats to biodiversity hotspots
Global biodiversity is under tremendous threat28,29 from different agents. Major threats to global biodiversity is land use, CO2 enrichment, nutrient loading, climate change, and invasive species.28 But in biodiversity hotspots, it is mostly land use that is a major threat. It has been highlighted in Millennium Ecosystem Assessment29 that most of the biodiversity hotspots are densely populated by humans and yet they have low human development index, where the pressure on the natural ecosystems for basic requirements such as food and energy is high. Hence, the biodiversity hotspot regions across the world have very high anthropogenic pressures.30 Furthermore, since most of the biodiversity is concentrated in these 36 hotspots, there is a huge risk of commercial exploitation if these regions are developing due to globalization, and in consequence result in loss of biodiversity and the traditional knowledge associated with them.31,32 Tropical forests are home to approximately three-fourth of the world’s terrestrial biodiversity and are estimated to harbor not less than three million species, although the richness could be ten times higher. However, only approximately half a million species from the tropical forests has been scientifically catalogued. It implies that another 2.5–25 million species are unrecorded and with the current trends of habitat loss, most of them are going to disappear in near future without being even identified.33
Quantification of biodiversity for protection and conservation of biodiversity hotspots
With the current trend of globalization and Intellectual Property Rights regimes, there is an urgent need for proper and scientific quantification and documentation of the biodiversity and associated knowledge base, especially in developing nations.34 Traditional systems of knowledge sharing have not necessarily always been open and are restricted by hierarchy, community, caste, and class,35 among the various ethnic groups. Since most of the information is not documented, it is probable that the information of the varied uses of biodiversity in tropical developing nations may be lost or privatized by some multinational companies ultimately taking away the biodiversity-based sources and sustenance from ethnic groups. The challenge for the 21st century is in developing – for the first time – a working knowledge of Earth’s biological diversity in all its complexity so as to preserve and use these resources sustainably.36,37 This knowledge is critical to science and society – for maintaining a nation’s natural resources, for its economy, human health, and food security, hence improving the quality of human life. We urgently require this knowledge as the conversion of natural systems to human-managed systems accelerates the decline of biological diversity and its habitats.
Biodiversity is intricately related to the plant community as it determines the biological diversity of the ecosystem. Plant community influences the ecosystem functioning essential for the survival of species, and its heterogeneity is an important indicator for biodiversity assessment at a landscape level.38 Furthermore, plant species generally exists in association and any change in species composition may lead to changes in the plant community resulting in changes to the native biodiversity of the region. Change in the biodiversity is due to three basic ecological processes: 1) invasion of exotic plants, 2) progressive succession as a part of the ecological process, and 3) retrogressive succession due to natural and anthropogenic pressures on ecosystems. Assessment of changes in the biodiversity or the state of biodiversity is evident from the presence of indicator species and the distribution and abundance of keystone species.39
Indicator species can play a major role in quick assessment of the biodiversity status of a region. For example, invertebrate richness in the soil and plant litter is a good indicator of the presence of a rich diversity in the ecosystem.39 Studies by Nally and Fleishman40 have shown that identification and analysis of the behavior of relatively few indicator species in a community can predict the variation in 89% of the species in the community. Keystone species on the other hand are responsible for the sustenance of the community in its present form. Any change in the abundance and distribution of the keystone species will lead to a irreversible change in the ecosystem functioning and structure in terms of species composition, hence affecting biodiversity. One of the possible ways of characterizing keystone species in the forest ecosystem is through the assessment of competitiveness of the species along the successional gradient and focusing on their role, which supports or contributes in maintenance of the existing vegetation type.41
A limitation of the field-based data lies in extending the insights from the data to regional or global scales. Methods to reduce the amount of time spent collecting data are therefore of interest.42 Biodiversity can be assessed at each level of ecological organization by monitoring the different attributes. At the landscape level, attributes that could be monitored include the identity, distribution, and proportions of each type of habitat, and the distribution of species within those habitats. At the ecosystem level, richness, evenness, and diversity of species, guilds, and communities are important. At the species level, abundance, density, and biomass of each population may be of interest. And, at the genetic level, genetic diversity of individual organisms within a population is important. It is best to assess and interpret biodiversity across all these levels of organization by using various approaches at several spatial and temporal scales.43,44 The priorities of biodiversity conservation and management has resulted in a policy shift from conservation of single species to habitats through interactive network of species at the landscape level. In this “top-down” approach,19,45 biodiversity can first be characterized at the landscape level to prioritize, and a subsequently detailed inventory can be undertaken for the prioritized areas. This “top-down” approach allows extrapolation to large landscapes and involves the development of a spatial environmental database and systematic monitoring.
Identification of biodiversity hotspots
Approaches used till date, challenges in hotspots identification
To date, global biodiversity hotspots have been identified hypothetically using the data generated by the various scientific explorations and secondary information on regions of endemism.46 Myers1 used plants as indicator species to identify the centers of high-endemic biological diversity and it was a commendable concept. But now even with availability of newer technologies, there is still little large-scale adoption of these technologies in conservation biology. The concepts of landscape ecology47 have rarely been used for identification of the biological hotspots. Although in recent years, a few promising studies using recent tools such as ecological niche modeling, remote sensing, and Geographic Information System (GIS) for identification of biodiversity hotspots have been published.48,49 Much needs to be done to evolve a workable uniform approach in determining the hotspots. One of the lacunas in global biodiversity conservation is the absence of comprehensive data on the distribution and quantifiable estimate of biodiversity of a region. It is a well-known fact that while the species diversity is highest in the tropics, the information on biological diversity is biased more toward the poles.50 There is a serious gap in information on the distribution and spread of the global biodiversity due to the relative unavailability of databases from the tropics. Another aspect of the available databases is that many of them do not have a geospatial location tag on them making it extremely difficult to use such databases for meaningful conservation planning.
Recent tools and techniques which can be used for biodiversity hotspot identification
Information technology has changed immensely the way we use and disseminate the information globally.51 A number of offshoots in information technology are now being extensively used for assessing biological diversity and even biodiversity hotspots. To date, much biodiversity hotspot identification has been based on statistical tools such as species-area, species-endemism, and other tools. Since biodiversity hotspots are closely associated with the loss of the original habitats, use of remote sensing and GIS can provide accurate data on the amount and extent of changes in the original habitat. Apart from this, spatial data on the LULC of a region can also provide valuable information on the fragmentation and habitat suitability of a region which can be used for estimating the extent of damage to the original vegetation of the region. Numerous mathematical models as well as other information theory tools such as multi-criteria-based analysis and spatial decision support system can help in providing a better estimate of the spatial and temporal changes in biodiversity hotspots in real time. Since analysis of biodiversity hotspots uses the proxies such as a number of endemic species, various modeling techniques, especially species distribution modeling using geospatial techniques,52,53 can be used for locating new biodiversity hotspots.
A number of works have been carried out for identification of the biodiversity hotspots across the world.54 Apart from species distribution modeling, identification of vulnerable areas is also important for hotspot identification as land cover change is one of the important aspects of biodiversity hotspots.55 In recent years, space-based earth observation (EO) system has been used with remarkable accuracy to characterize the biodiversity at the landscape level.56 The main concept behind this approach is that a definition of biodiversity which has a practical use in conservation and which takes into account the structural and functional aspect of the biodiversity is difficult to fathom with the current tools. So a logical and a more workable approach would be to characterize the biodiversity of a region,43 which can be the basis for conservation and prioritization policies of the natural areas and their biodiversity. Availability of spatial database on the topography, terrain, climate, and high-resolution multispectral database has enabled us to characterize the biodiversity on the basis of the vegetation type, level of disturbance,46,57 uniqueness of the ecosystem, biodiversity value from representative stratified samples, etc.58
Recently, a monumental work has been carried out for Indian landscape19 to characterize the biologically rich areas in India using geospatial modeling. Using spatial data on vegetation type, fragmentation, disturbance regimes, as well as field sample-based phytosociological data from more than 16,500 geospatially tagged sample plots representing all the major vegetation types across the Indian landscape, a biological richness map was modeled. This map can act as baseline information for identification of potential biodiversity hotspots. An interesting observation from this study has been that, apart from the Western Ghats, which is one of the global biodiversity hotspots, the Eastern Ghats has a comparable number of endemic species and is therefore a repository of the important gene pools.19
The holistic understanding of the complex mechanisms that control biodiversity, as well as their spatial and temporal dynamics, requires synergetic adoption of measurement approaches, sampling designs, and technologies. The data requirements include data of both spatial and nonspatial nature and also of various timescales. In view of this, the combination of satellite remote sensing, Global Positioning System, and integrative tools (such as GIS and Information Systems) is an important complimentary system to ground-based studies. It has been well explained by Murthy et al59 that these technologies together form the basis for geoinformatics. The various parameters required for biodiversity assessment and their amenability for measurements by different techniques are given in Table 1.
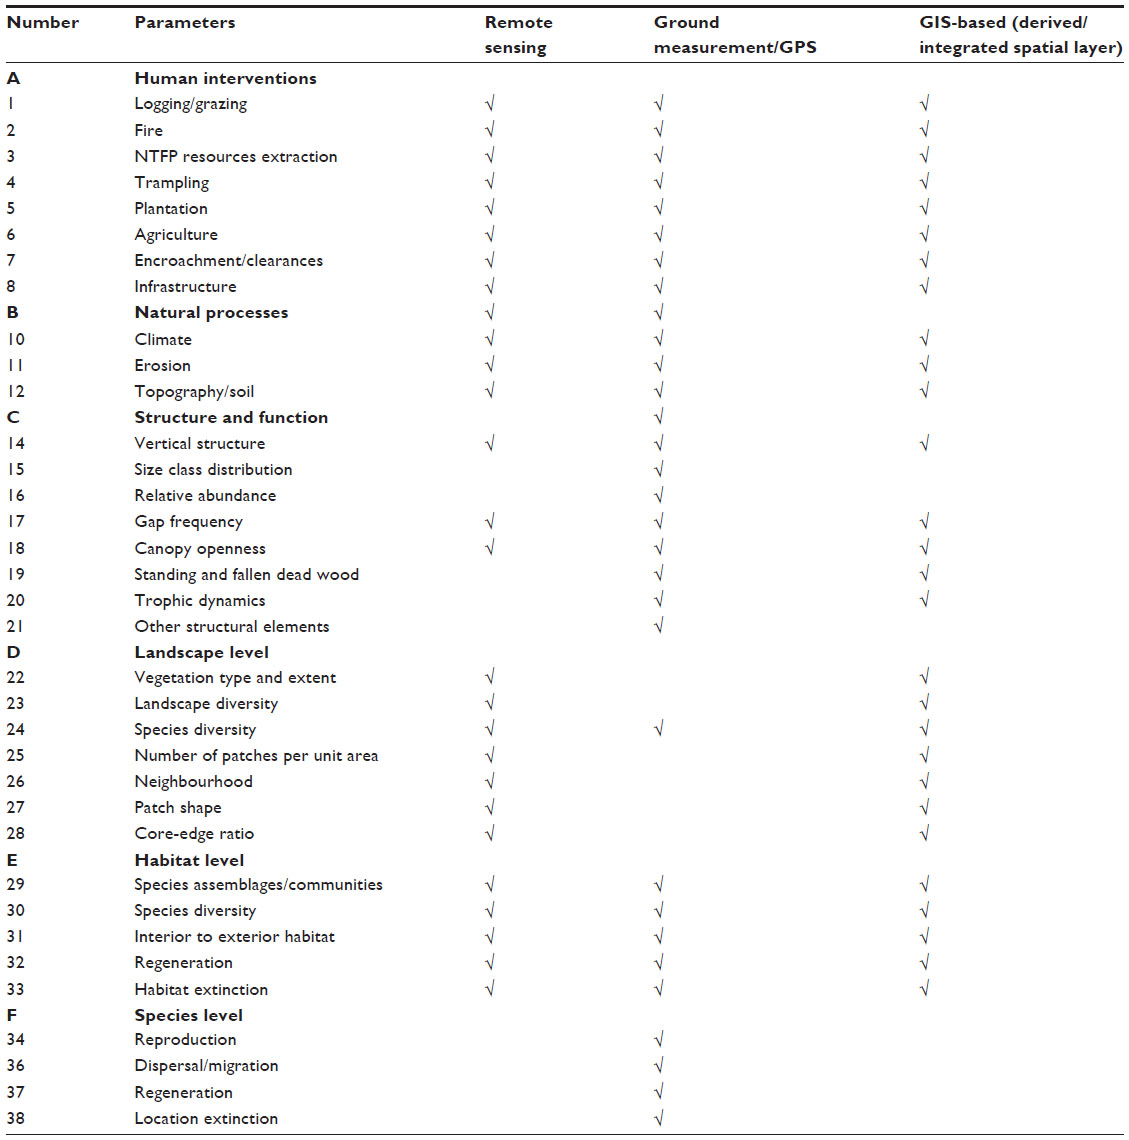 | Table 1 Components of biodiversity assessment and measurement tools |
The need of the hour is a global data baseline on the spatial distribution of the biological richness based on identified sets of parameters applicable for individual ecosystems or biogeographical regions. Recent availability of the database on global land cover,60 global ecological land units,61 global land forms (using digital elevation models), etc, along with the regional level high-resolution data such as the biological richness maps,19 temporal land use, and land cover maps,62 has provided us with an enormous amount of data previously unavailable. This has enabled us to have synoptic information of the various global biodiversity hotspots in space (although in coarse resolution) and obtain an unbiased estimate of the status of the degradation and other forces in play in the biodiversity hotspots across the world.
Rapid assessment and identification of biological diversity
Identifying regions having high biological richness or biologically rich areas under threat has an immense bearing on the prioritization and also helps in inventorization of endemic and threatened species. Biodiversity characterization from landscape to species level can help in prioritization of ecologically threatened habitats and also uses landscape modeling techniques for identification of potential sites for endangered and threatened species for conservation in situ by protecting their habitats.63 Furthermore, this technique is also helpful in identifying potential biodiversity-rich areas for intensive exploration for improving the plant biodiversity inventory.
Identification measurement and monitoring of biodiversity is complex due to its multi-scale and all-encompassing approach. A simplified but workable approach to rapid assessment of biodiversity is to use identified indicators that can serve as surrogates of biodiversity at national and regional levels. Although the selection of indicators differs for the different aspects of biodiversity inventory and biodiversity monitoring, the basic criteria are more or less the same, eg, threatened, endemic, and economically important species.63 Using these tools, rapid biodiversity assessment can be carried out in relatively unexplored areas by characterizing the biological value of the landscape based on the species richness, the degree of species endemism uniqueness of comparable ecosystem, and the magnitude of extinction threats. Using a combination of landscape level characterization of the biodiversity and field-based rapid biological richness assessment, potential biodiversity can be characterized across the globe for the continuous monitoring of biodiversity hotspots.
Current status of biodiversity hotspots
At present, there are 36 biodiversity hotspots across the globe covering an area of approximately 23.79 million km2 with an actual vegetation cover of approximately 3.44 million km2. The average endemic plant species diversity across the biodiversity hotspots is more than 44 species for every 100 km2 (Table 2).64 But in all probability, this is an underestimate as most of these areas remain relatively underexplored and the floristic surveys (by academic and research institutions) are mostly along accessible routes and in most cases within a radius not exceeding 150–200 km.65 Estimates from moderate resolution satellite data (~300 m) on LULC indicate that the biodiversity hotspots have 14.89% of intact vegetation cover.64 This is definitely an improvement over the estimates of earlier authors,2,66 but coarse resolution satellite data has its limitations as it is not able to capture the small fragmentations in the forests due to infrastructure development in the biodiversity hotspot regions.
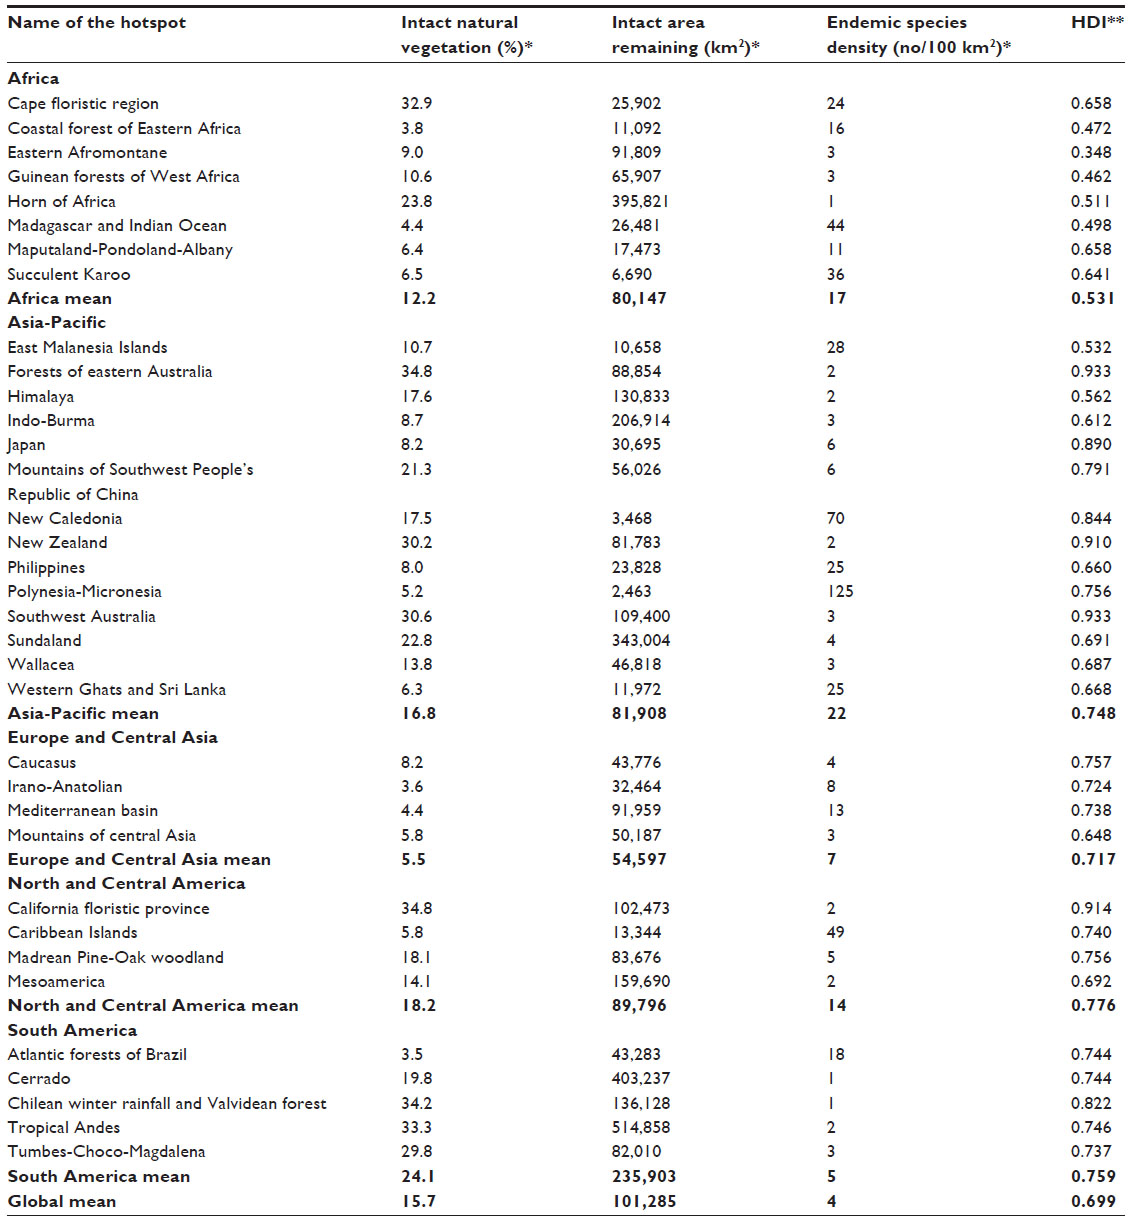 | Table 2 Characteristics of global biodiversity hotspots |
Global scenario
If we compare the biodiversity hotspots across the world, an interesting pattern emerges. There are around eight biodiversity hotspots which have approximately 30% or more intact forested area. Of these eight hotspots, seven lie in the temperate region where the population pressure on natural ecosystems is relatively low and there is relatively high human developmental index.14 In contrast, the biodiversity hotspot regions having the lowest absolute intact forest areas are regions which have a very high population pressure and a very low human development index (Table 2). This indicates that anthropogenic pressure in terms of LULC change is one of the most important causes of the loss in natural vegetation cover in the biodiversity hotspot regions of the world.
Across the global biodiversity hotspots, as discussed earlier, there are on an average four endemic vascular plant species per 100 km2 of intact natural vegetation in these regions. With the current rate of deforestation in these biodiversity hotspots, these endemic species are in serious threat of extinction due to their shrinking habitats. But the most threatened regions are areas which have much less absolute intact natural vegetation. Areas such as Polynesia-Micronesia, New Caledonia, and Succulent Karoo having a few thousand square kilometer of remaining forests which are at the gravest risk of species loss and extinction.64
Almost all the hotspots in the tropical regions are under tremendous threat of land cover loss. Recent work in the Western Ghats by Roy and Srivastava68 has shown that even inside the hotspots, there are LULC changes resulting in the hot and cold regions that are mostly due to population pressure and policy decisions. A similar situation exists in the tropical Andes, Madagascar, Sundaland, Himalayas, and Indo-Burma. There is an urgent need to identify the potential regions of land cover change in the biodiversity hotspot regions for necessary conservation and protection. These regions need to be flagged for frequent monitoring. This requires high temporal datasets from EO satellites as well as ground-based sources/observations. Furthermore, the LULC changes in these regions are not very evident from moderate resolution satellite images as the changes are subtle and most often clandestine, such as removing the undergrowth, unsustainable harvesting of non-wood forest produce, illegal poaching, and removal of keystone species. Hence, satellite data of high spatial as well as temporal resolution is required for monitoring these areas.
Satellite-based assessment
A synoptic snapshot of the biodiversity hotspots at regular intervals can help us in identification of the potential regions of ongoing degradation or changes in the biodiversity hotspots around the world65 (Figure 1). The present capability of the EO systems to obtain a synoptic snapshot of the biodiversity hotspots at high resolution provides us with a great opportunity to identify and model the potential changes in the biodiversity hotspots across the globe. Figure 1 shows the LULC at a moderate resolution (300 m) prepared using satellite data for all the 36 global hotspot regions. The global datasets provide the status of the vegetation cover of these biodiversity hotspots at uniform resolution and accuracy. This helps in identification of the level of degradation of natural areas in the terrestrial biodiversity hotspots of the earth. With a baseline data on regional LULC, the changes in the natural cover in these regions can be monitored over time.
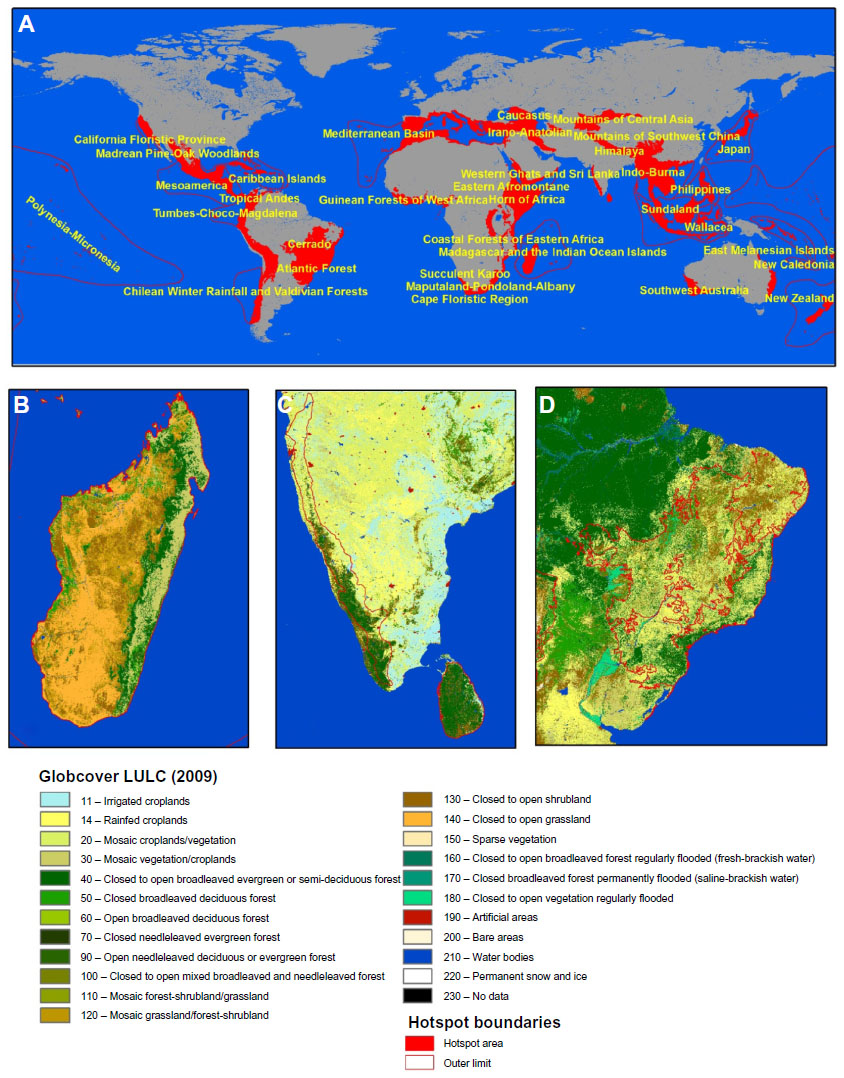 | Figure 1 Distribution and LULC in biodiversity hotspots. |
Spatial organization of biodiversity on the earth has coevolved with physical environment of the region, in general and local biotic influences, in particular. It is also understood that ecological systems do not exist as discrete units but represent a continuum on an environmental gradient consisting of different land cover patches in the form of landscapes. Landscapes represent a mosaic of interacting ecosystems in relatively large to very large areas consisting of patches of different LULCs. The landscape processes have a significant bearing on the diversity at the landscape level which additionally becomes an important characterizing parameter of a landscape. The spatial information of the vegetation cover provides critical inputs to the fragmentation69 and disturbance regimes19 responsible for biodiversity loss. Satellite-based assessments of the LULC change are playing an important role in highlighting the regions of change and loss of forest cover. Recent work by Roy et al,61 in preparation of high resolution decadal maps of LULC over India, gives us important inputs in identification as well as prioritizing the change regions in the biologically rich hotspots. It is imperative and timely to produce high-resolution spatial databases on LULC at a global level for assessment of the global biodiversity, especially for hotspots.
Conservation and prioritization of biodiversity hotspots
Since the biodiversity hotspots harbor almost over 44% of the vascular plant gene pool of the earth, conserving the biodiversity hotspots, which cover less than 2% of the total land area, can have an immense potential to conserve the gene pool of the world.2 It has been reported by Mittermeier et al70 that just 17 countries across the world harbor more than 70% of all the species on the earth. The mega-biodiversity countries include Brazil, People’s Republic of China, Colombia, Australia, Democratic Republic of the Congo, Ecuador, India, Indonesia, Madagascar, Malaysia, Mexico, Papua New Guinea, Peru, the Philippines, South Africa, the USA, and Venezuela. Among all these countries, only the USA and Australia have relatively less pressure on their natural ecosystems, while the remaining countries are stretched for resources in terms of protection of the natural ecosystems, especially those with biodiversity hotspots.
Challenges in protection and conservation of biodiversity hotspots
In the present scenario, land use-derived changes in natural land cover is one of the most important threat to biodiversity globally.28 Since in most of the mega-biodiversity hotspots, especially in the tropics, there is a predominance of subsistence farming, the increase in the population in these biodiversity hotspot regions has led to a greater demand for land for food production.71 This is resulting in deforestation in these regions. Furthermore, demands for timber from the developed economies as well as the global footprints of the developed regions on natural areas are also resulting in degradation of the global biodiversity hotspots. Apart from this, the growth in infrastructure mostly due to an increase in road and rail networks and mining activities is resulting in the fragmentation of natural areas.69 The biodiversity hotspots are also facing serious threats from other drivers of biodiversity loss such as global warming,72 invasive species,73 climate change,72 and nutrient loading.74 Recent work on the impact of simulated climate change on global biodiversity hotspots has shown that some of the biodiversity hotspots are expected to lose up to 30% of the endemic species population.75 The hotspots mostly in the island regions such as the Caribbean islands, New Caledonia, New Zealand, Philippines, and Polynesia-Micronesia have a large number of invasive species which have been adapted to the particular climatic and land use conditions in the respective hotspots. Sea level rise as a result of global warming is also a threat to most low island ecosystems which constitute varied hotspots76 as well as the Mediterranean region, where many of the natural areas are almost at the sea level.
Global initiatives for biodiversity hotspot conservation and protection
Myer’s seminal paper1 in 1988 identified for the first time that instead of protecting the entirety of remnant global natural ecosystems, protecting the richest part of it representing less than 1.4% of the land area can help us in protection of the biodiversity hotspots.2 The first United Nations Conference on Environment and Development (UNCED) or Earth summit in Rio de Janeiro in 1992 was greatly influenced by this paper. The global initiatives on conservation as part of Conference of Parties Convention on Biological Diversity (COP-CBD) have emphasized the need for data generation, equitable and sustainable resource sharing. and the protection of the biodiversity-rich areas by member countries. The Conference of Parties has subsequently brought about various initiatives the most significant being the Aichi Targets.77 The Aichi Targets clearly identify the use of recent tools and techniques, like EO systems on various platforms, for monitoring and conservation of the biologically rich regions of the world.
Use of earth observation-based systems for conservation and prioritization of biodiversity hotspots
The present need is a sensor web involving the use of EO satellites as well as ground-based real-time data of global biodiversity hotspots. Apart from continuous monitoring of biodiversity hotspots, there is also a need to characterize the biodiversity hotspots for their biological richness so as to identify the areas for prioritization of conservation of the biodiversity in these regions.19 As part of this, a high-resolution EO-based data such as Landsat or IRS LISS-III in the biodiversity hotspots at approximately 5-year temporal resolution can give a fairly good idea regarding changes in the biodiversity hotspots and can identify the regions most prone to change and enable adequate steps to be taken for protection and conservation of the region. Figure 2A–F gives a pictorial representation of EO-based monitoring of the biodiversity hotspots. This uses a top-down approach to identify the areas of change in the biodiversity hotspot regions using coarse resolution satellite data of Globcover and then focus the observations at a higher resolution to study the finer level changes in the biodiversity hotspots. The databases on the vegetation type and land cover of the biodiversity at various levels, ie, from global to regional19,78 and detailed modeling of the land cover change hotspots.68 One of the classic works using EO data by Sloan et al64 has been able to highlight globally the discrepancies in the estimates of the percent of remaining intact natural areas in the global biodiversity hotspots. Using coarse resolution LULC products from Globcover,60 the mean patch area with respect to the percent of natural areas for different hotspots has been estimated, indicating that most of the hotspot areas have relatively low contiguous forests and forest fragmentation is one of the most important factors threatening the global hotspots. But similar studies need to be carried out at high resolution across the world by different groups at regular intervals to identify the critical hotspots as well as critical areas within the biodiversity hotspots.
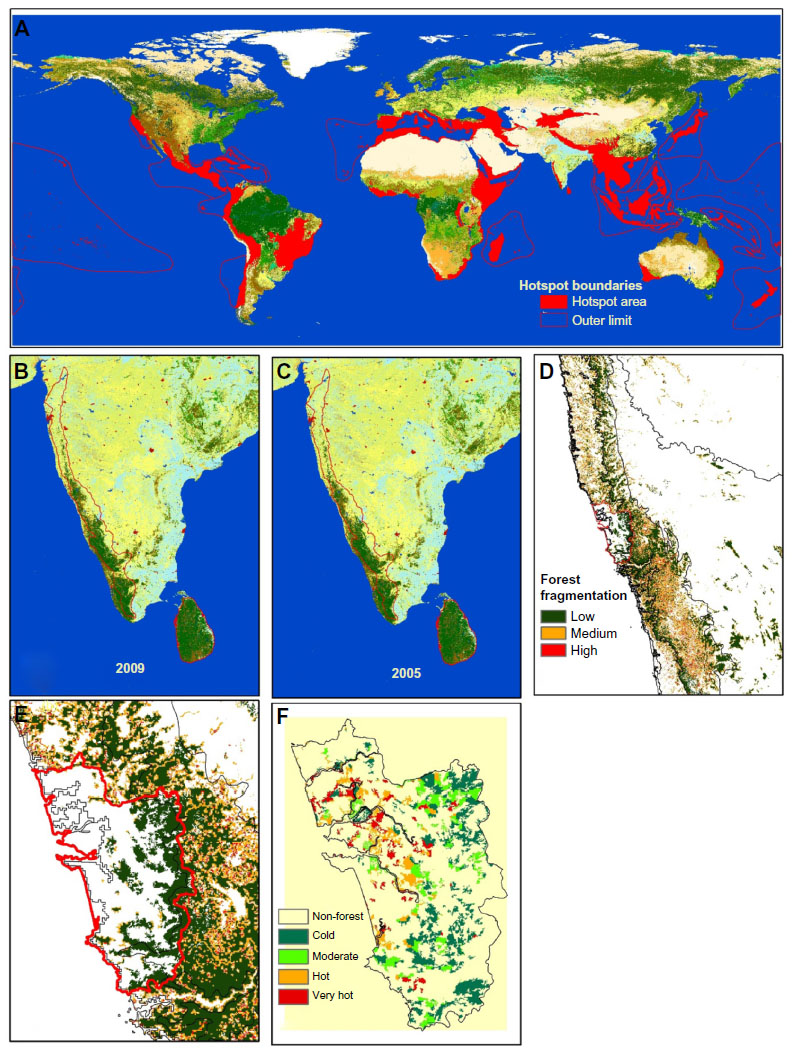 | Figure 2 Top-down approach for global biodiversity hotspots monitoring and prioritization. |
Future direction, need for database creation and continuous monitoring
The biodiversity hotspots which are essentially the storehouse for almost 50% of the global gene-pool are one of the critical areas for conservation and prioritization. Since they occupy less than 2% of the total land area, conservation of these areas will require significantly less effort by the global community in protecting the gene pool by focusing their efforts toward the target areas. This is beneficial in terms of both financial and political contribution by the global community.
There have been a significant number of views expressed by different environmentalist as well as naturalists for including marine ecosystems which are very rich in terms of biological richness but do not qualify due to the absence of the significant diversity of vascular plants in these ecosystems. These marine regions are also under tremendous threat of degradation due to various anthropogenic activities. Furthermore, most of these ecosystems hold tremendous biodiversity which needs to be preserved. These areas, such as coral reef ecosystems, are also in close proximity to and support highly populated areas of the world (eg, Philippines, Indonesia, Srilanka). With the growth of the maritime industries such as fishing as well as exploration for various underwater minerals of economic importance, these biodiversity-rich ecosystems are under tremendous threat.
Identification of critical hotspots
The urgent need is to identify the critical ecosystems in need of conservation and protection. A combination of space-based and ground-based observations and data, incorporated into different geospatial models, can be used to identify areas which are in the process of losing their natural cover both in terms of quality as well as quantity. Geospatial modeling coupled with spatial decision support system for hotspot areas is the future for identification of critical areas and provide inputs to managers for prioritization and conservation.79 Another promising tool for data generation is crowd sourcing, wherein the data is generated by the people with simple resources like smartphones are sent to centralized servers for real-time monitoring to support policies for the protection of the natural areas within biodiversity hotspots.80 This tool is currently being used successfully in disaster management and mitigation in India.81
Participation of stakeholders and indigenous people
To achieve conservation objectives, there is a need for people participation. Sensitization of the local population regarding protection of their natural heritage needs to be carried out by the governments. The People’s Biodiversity Register is one of the important initiatives of Government of India to coordinate and educate the stakeholders in documentation as well as conservation of the gene pool and their natural habitat for sustainable utilization of the resources. In fact, the various Conventions on Biological Diversity (COP-CBD) have time and again emphasized the involvement of the stakeholders in conservation and sustainable use of the biological resources in the mega biodiversity regions of the world.82
Acknowledgments
I take this opportunity to thank my students, colleagues, and coworkers who have contributed in the different research projects which have helped to build up this article. The data provided by Globcover and Conservation International which is used in this article is duly acknowledged. I also thank the anonymous reviewers as well as the Editor-in-Chief (Dr Lane) for taking pains to review the manuscript, providing their valuable suggestions, and proof editing the manuscript. Finally, I put on record my gratitude to Director, Indian Institute of Remote Sensing Dr A Senthil Kumar for his encouragement in completing this work.
Disclosure
The author reports no conflicts of interest in this work.
References
Myers N. Threatened biotas: “Hot spots” in tropical forests. Environmentalist. 1988;8:1–20. | |
Myers N, Mittermeier RA, Mittermeier CG, da Fonseca GAB, Kent J. Biodiversity hotspots for conservation priorities. Nature. 2000;403:853–858. doi:10.1038/35002501. | |
Conservation International (webpage). 2014. Available from: http://www.conservation.org/How/Pages/Hotspots.aspx. Accessed March 19, 2015. | |
Langhammer PF, Bakarr MI, Bennun LA, et al. Identification and gap analysis of key biodiversity areas: targets for comprehensive protected area systems. IUCN Best Practice Protected Area Guidelines Series 15. Gland, Switzerland; 2007. | |
Anderson ER, Cherrington EA, Tremblay-Boyer L, Flores AI, Sempris E. Identifying critical areas for conservation: biodiversity and climate change in Central America, Mexico, and the Dominican Republic. Biodiversity. 2008;9(3&4):89–99. | |
Tangley L. Cataloging Costa Rica’s diversity. BioScience. 1990;40:633–636. | |
Emile A, Frison EA, Cherfas J, Hodgkin T. Agricultural biodiversity is essential for a sustainable improvement in food and nutrition security. Sustainability. 2011;3:238–253. doi:10.3390/su3010238. | |
Pramova E, Locatelli B, Djoudi H, Somorin OA. Forests and trees for social adaptation to climate variability and change. Climate Change. 2012;3(6):581–596. doi: 10.1002/wcc.195. | |
Campbell A, Kapos V, Chenery A, et al. The Linkages Between Biodiversity and Climate Change Mitigation. UNEP World Conservation Monitoring Centre; 2008. | |
Potts SG, Biesmeijer JC, Kremen C, et al. Global pollinator declines: trends, impacts and drivers. Trends Ecol Evol. 2010;25(6):345–353. doi:10.1016/j.tree.2010.01.007. | |
Lee A, Langer R. Shark cartilage contains inhibitors of tumor angiogenesis. Science. 1983;221:1185–1187. doi: 10.1126/science. 6193581. | |
Siefert JL. Man and his spaceships: vehicles for extraterrestrial colonization? Mob Genet Elements. 2012;2(6):272–278. doi: 10.4161/mge.23238. | |
Carnaval AC, Waltari E, Rodrigues MT, et al. Prediction of phylogeographic endemism in an environmentally complex biome. Proc R Soc B. 2014;281:20141461. doi:10.1098/rspb.2014.1461. | |
Corvalan C, Hales S, McMichael A. Ecosystems and Human Well-Being: Health Synthesis: A Report of the Millennium Ecosystem Assessment. WHO Publication; 2005. ISBN 92 4 156309 5. | |
Mittermeier RA, Turner WR, Larsen FW, Brooks T, Gascon C. Global biodiversity conservation: the critical role of hotspots. In: Zachos FE and Habel JC, editors. Biodiversity Hotspots. –Berlin Heidelberg: Springer-Verlag; 2011:3–7. doi:10.1007/978-3-642-20992-5_1. | |
Collen B, Ram M, Zamin T, McRae L. The tropical biodiversity data gap: addressing disparity in global monitoring. Trop Conserv Sci. 2008;1(2):75–88. Available from: http://tropicalconservationscience.mongabay.com/content/v1/08-06-09-Ben_Collen_et_al.html. Accessed March 29, 2015. | |
Stork NE, Samways MJ, Bryant DA, et al. Inventoring and monitoring. In: Heywood VH, Watson RT, editors. Global Biodiversity Assessment. Cambridge University Press; 1995:457–475. | |
Lawrence WA, Edwards DP. The search for unknown biodiversity. PNAS. 2011;108(32):12971–12972. doi: 10.1073/pnas.1110319108. | |
Roy PS, Kushwaha SPS, Murthy MSR, et al. Biodiversity Characterization at Landscape Level. Dehradun, India: National Assessment, Indian Institute of Remote Sensing; 2012. 140. ISBN: 81-901418-8-0. | |
Marchese C. Biodiversity hotspots: a shortcut for a more complicated concept. Global Ecol Cons. 2015;3:291–309. | |
Aguzzi J, Sbragaglia V, Tecchio S, Navarro J, Company JB. Rhythmic behaviour of marine benthopelagic species and the synchronous dynamics of benthic communities. Deep-Sea Res I. 2014;95:1–11. | |
Mecho A, Billett DSM, Ramírez-Llodra E, Aguzzi J, Tyler PA, Company JB. First records, rediscovery and revision of deep-sea echinoderms in the middle and lower-slopes of the north-western Mediterranean Sea. Scientia Marina. 2014;78(2):281–302. | |
Aguzzi J, Company JB, Costa C, et al. Challenges to assessment of benthic populations and biodiversity as a result of rhythmic behaviour: video solutions from cabled observatories. Oceanogr Mar Biol Annu Rev. 2012;50:235–286. | |
Tecchio S, Ramírez-Llodra E, Aguzzi J, Flexas MM, Company JB, Sardà F. Seasonal fluctuations of deep megabenthos: Finding evidence of standing stock accumulation in a flux-rich continental slope. Prog Oceanogr. 2013;118:188–198. | |
Renema W, Bellwood DR, Braga JC, et al. Hopping hotspots: global shifts in marine biodiversity. Science. 2008;321:654–657. | |
De Monte S, Soccodato A, Alvain S, d’Ovidio F. Can we detect ocean biodiversity from space. IMSE J. 2013;7:2054–2056. | |
Longhurst A. Ecological Geography of the Sea. Burlington: Academic Press, 2007. | |
Sala OE, Chapin IFS, Armesto JJ, et al. Global biodiversity scenarios for the year 2100. Science. 2000;287(5459):1770–1774. | |
Millennium Ecosystem Assessment. Ecosystems and Human Well-Being: Synthesis. Washington, DC: Island Press; 2005. | |
Brooks TM, Mittermeier RA, Mittermeier CG, et al. Habitat loss and extinction in hotspots of biodiversity. Cons Biol. 2002;16(4):909–923. | |
Fisher B, Christopher, T. Poverty and biodiversity: measuring the overlap of human poverty and the biodiversity hotspots. Ecol Econom. 2007;62:93–103. | |
IIED. Protecting Community Rights over Traditional Knowledge. 2009. Available from: http://pubs.iied.org/pdfs/14591IIED.pdf. Accessed March 27, 2015. | |
Dirzo R, Raven PH. Global state of biodiversity and loss. Annu Rev Environ Resour. 2003;28:137–167. doi: 10.1146/annurev.energy.28.050302.105532. | |
Leach M, Mearns R, Scoones I. Environmental entitlements: dynamics and institutions in community-based natural resource management. World Dev. 1999;27(2):225–247. | |
Bloch E. Impact of Emerging Technologies on the Biological Sciences. Arlington (VA): National Science Foundation; 1995. | |
[PCAST] President’s Committee of Advisors on Science and Technology. Teaming with Life: Investing in Science to Understand and Use America’s Living Capital. Washington, DC: President’s Committee of Advisors on Science and Technology, Panel on Biodiversity and Ecosystems; 1998. | |
Hansen W, McComb C, Vega R, Raphael MG, Hunter M. Bird habitat relationships in natural and managed forests in the west Cascades of Oregon. Ecol Appl. 1995;5:555–569. | |
Ferris R, Humphrey JW. Review of biodiversity indicators for application in British forests. Forestry. 1999;72(4):313–328. | |
Weaver JC. Indicator species and the scale of observation. Cons Biol. 1995;9:939–942. | |
Mac Nally R, Fleishman E. A successful predictive model of species richness based on indicator species. Cons Biol. 2004;18:646–654. | |
Tripathi RS, Law P. Keystone species: the concept, their ecological significance and determining their keystone status. Environews. 2006;12(3). Available from: http://isebindia.com/05_08/06-07-2.html. Accessed March 27, 2015. | |
Innes JL, Koch B. Forest biodiversity and its assessment by remote sensing. Global Ecol Biogeo Lett. 1998;7(6):397–419. | |
Noss RF. Indicators for monitoring biodiversity: a hierarchical approach. Cons Biol. 1990;4(4):355–364. | |
Noss RF, Cooperrider A. Saving Nature’s Legacy: Protecting and Restoring Biodiversity. Washington, DC: Defenders of Wildlife and Island Press; 1994. 416. | |
Giriraj A. Spatial Characterization and Conservation Prioritization in Tropical Evergreen Forests of Western Ghats, Tamil Nadu Using Geoinformatics [PhD thesis]. Tamil Nadu: Bharathidasan University; 2006. | |
Tangley L. Cataloguing Costa Rica’s Diversity. Bioscience. 1990;40(9):633–636. | |
Peterson AT, Vieglais DA, Sigüenza AGN, et al. A global distributed biodiversity information network: building the world museum. Bull BOC. 2003;123A:186–196. | |
Mateo RG, de la Estrella M, Felicísimo AM, Muñoz J, Guisan A. A new spin on a compositionalist predictive modelling framework for conservation planning: a tropical case study in Ecuador. Biol Conserv. 2013;160:150–161. | |
Roy PS, Tomar S. Biodiversity characterization at landscape level using geospatial-modelling technique. Biol Conserv. 2000;95(1):95–109. | |
Foreman RTT, Gordon M. Landscape Ecology. New York: Wiley; 1986. | |
Gaston KJ Global patterns in biodiversity. Nature. 2000;405:220–227. doi:10.1038/35012228. | |
Dobson A. Monitoring global rates of biodiversity change: challenges that arise in meeting the Convention on Biological Diversity (CBD) 2010 goals. Phil Tans Royal Soc B. 2005;360(1454):229–241. | |
Elith J, Leathwick JR. Species distribution models: ecological explanation and prediction across space and time. Ann Rev Ecol Evol Syst. 2009;40:677–697. doi: 10.1146/annurev.ecolsys.110308.120159. | |
Rodríguez JP, Brotons L, Bustamante J, Seaone J. The application of predictive modelling of species distribution to biodiversity conservation. Diver Dist. 2007;13:243–251. | |
Hurlbert AH, Jetz W. Species richness, hotspots, and the scale dependence of range maps in ecology and conservation. PNAS. 2007;104(33):13384–13389. doi:10.1073/pnas.0704469104. | |
Lambin EF, Geist HJ, Lepers E. Dynamics of land-use and land-cover change in tropical regions. Ann Rev Env Res. 2003;28:205–241. doi: 10.1146/annurev.energy.28.050302.105459. | |
Roy PS, Roy A, and Karnatak H. Contemporary tools for identification: assessment and monitoring biodiversity. Trop Ecol. 2012;53(3):261–272. | |
Roy PS, Padalia H, Chauhan N, et al. Validation of geospatial model for biodiversity characterisation at landscape level – a study in Andaman and Nicobar Islands, India. Ecol Model. 2005;185(2–4):349–369. | |
Murthy MSR, Giriraj A, Dutt CBS. Geoinformatics for biodiversity assessment. Biol Lett. 2003;40(2):75–100. | |
Arino O, Bicheron P, Achard F, Latham J, Witt R, Weber JL. GLOBCOVER: the most detailed portrait of the earth. ESA Bull. 2008;136:24–31. | |
Sayre R, Dangermond J, Frye C. A New Map of Global Ecological Land Units – An Ecophysiographic Stratification Approach. Washington, DC: Association of American Geographers; 2014. 46. | |
Roy PS, Roy A, Joshi PK, et al. Development of decadal (1985–1995–2005) land use and land cover database for India. Remote Sens. 2015;7:2401–2430. | |
Kerr J, Sugar A, Packer L. Indicator taxa, rapid biodiversity assessment, and nestedness in an endangered ecosystem. Cons Biol. 2000;14:1726–1734. | |
Sloan S, Jenkins CN, Joppa LN, Gaveau DLA, Laurance WF. Remaining natural vegetation in the global biodiversity hotspots. Biol Cons. 2014;177:12–24. | |
Reddy CS. Survey – gap analysis for botanical research using integrated approach through taxonomical data and geoinformatics. J Indian Soc Remote Sens. 2010;38:1–13. | |
Mittermeier RA, Gil PR, Hoffman M, et al. Hotspots Revisited. Mexico City: CEMEX; 2004. | |
UNDP 2015. http://hdr.undp.org/en/data. Accessed March 29, 2015. | |
Roy A, Srivastava VK. Geospatial approach to identification of potential hotspots of land-cover change for biodiversity conservation in Western Ghats of Goa. Curr Sci. 2012;102(8):1174–1180. | |
Roy PS, Murthy MSR, Roy A, Kushwaha SPS, Singh S, Jha CS. Forest fragmentation in India, 2013. Current Sci. 2013;105(6):774–780. | |
Mittermeier RA, Myers N, Mittermeier CG, editors. Hotspots: Earth’s Biologically Richest and Most Endangered Terrestrial Ecoregions. Mexico City: CEMAX, SA; 1999. 430. ISBN 968-6397-58-2. | |
Morton JF. The impact of climate change on smallholder and subsistence agriculture. PNAS. 2007;104(50):19680–19685. | |
Bellard C, Camille L, Leroy B, et al. Vulnerability of biodiversity hotspots to global change. Global Ecol Biogeogr. 2014;1–11. doi:10.1111/ geb.12228. | |
Denslow JS. Managing dominance of invasive plants in wildlands. Curr Sci. 2007;93(11):1579–1586. | |
Phoenix GK, Hicks WK, Cinderby S, et al. Atmospheric nitrogen deposition in world biodiversity hotspots: need for greater global perspective in assessing N deposition impacts. Global Change Biology, 2006;12:470–476. | |
Brooks TM, Mittermeier RA, Mittermeier CG, et al. Habitat loss and extinction in the hotspots of biodiversity. Conserv Biol. 2002;16(4):909–923. | |
Bellard C, Leclarc C, Courchamp F. Impact of sea level rise in 10 insular biodiversity hotspots. Global Ecol Biobeogr. 2013;1–10. doi: 10.1111/geb 12093. | |
Roy PS, Behera MD, Murthy MSR, et al. New vegetation type map of India prepared using satellite remote sensing: comparison with global vegetation maps and utilities. Int J App Earth Obs Geoinf. 2015;39:142–159. | |
Roy PS, Karnatak H, Kushwaha SPS, Roy A, Saran S. India’s plant diversity database at landscape level on geospatial platform: prospects and utility in today’s changing climate. Curr Sci. 2012;102(8):1136–1142. | |
Clerici M, Combal B, Pekel G, et al. The eStation, an earth observation processing service in support to ecological monitoring. Ecol Informatics. 2013;(18):162–170. | |
Krishnamurthy YVN, Raju PLN, Srivastav SK, et al. Capacity building for collecting primary data through Crowdsourcing – an example of disaster affected Uttarakhand state (India). 1. The International Archives of the Photogrammetry, Remote Sensing and Spatial Information Sciences, 2014; XL-8:1249–1252, doi:10.5194/isprsarchives-XL-8-1249-2014. | |
COP 7 Decision VII/27. 2004. Available from: http://www.cbd.int/decision/cop/?id=7764. Accessed March 29, 2015. |
 © 2016 The Author(s). This work is published and licensed by Dove Medical Press Limited. The full terms of this license are available at https://www.dovepress.com/terms.php and incorporate the Creative Commons Attribution - Non Commercial (unported, v3.0) License.
By accessing the work you hereby accept the Terms. Non-commercial uses of the work are permitted without any further permission from Dove Medical Press Limited, provided the work is properly attributed. For permission for commercial use of this work, please see paragraphs 4.2 and 5 of our Terms.
© 2016 The Author(s). This work is published and licensed by Dove Medical Press Limited. The full terms of this license are available at https://www.dovepress.com/terms.php and incorporate the Creative Commons Attribution - Non Commercial (unported, v3.0) License.
By accessing the work you hereby accept the Terms. Non-commercial uses of the work are permitted without any further permission from Dove Medical Press Limited, provided the work is properly attributed. For permission for commercial use of this work, please see paragraphs 4.2 and 5 of our Terms.