")
Back to Journals » Journal of Hepatocellular Carcinoma » Volume 10
Identification and Experimental Validation of the Prognostic Significance and Immunological Correlation of Glycosylation-Related Signature and ST6GALNAC4 in Hepatocellular Carcinoma
Authors Dai T , Li J, Liang RB, Yu H, Lu X, Wang G
Received 29 December 2022
Accepted for publication 25 March 2023
Published 3 April 2023 Volume 2023:10 Pages 531—551
DOI https://doi.org/10.2147/JHC.S400472
Checked for plagiarism Yes
Review by Single anonymous peer review
Peer reviewer comments 2
Editor who approved publication: Dr David Gerber
Tianxing Dai,1,2,* Jing Li,3,* Run-Bin Liang,1,* Haoyuan Yu,2 Xu Lu,2 Guoying Wang1,2
1Department of Hepatobiliary Surgery, The First Affiliated Hospital of Guangzhou Medical University, Guangzhou, 510120, People’s Republic of China; 2Department of Hepatic Surgery and Liver Transplant Program, The Third Affiliated Hospital of Sun Yat-sen University, Guangzhou, 510630, People’s Republic of China; 3Department of Gastroenterology, The Second Affiliated Hospital of Guangzhou Medical University, Guangzhou, 510260, People’s Republic of China
*These authors contributed equally to this work
Correspondence: Guoying Wang, Department of Hepatobiliary Surgery, The First Affiliated Hospital of Guangzhou Medical University, 151 Yanjiangxi Road, Guangzhou, 510120, People’s Republic of China, Tel +86-20-83062703, Fax +86-20-83395651, Email [email protected]
Purpose: Glycosylation has been demonstrated to be involved in tumorigenesis, progression, and immunoregulation, and to present specific profiles in different tumors. In this study, we aimed to explore the specific glycosylation-related gene (GRG) signature and its potential immunological roles and prognostic implications in hepatocellular carcinoma (HCC).
Patients and Methods: The GRG expression profile was defined using the transcriptome data from The Cancer Genome Atlas and Gene Expression Omnibus. Univariate and the least absolute shrinkage and selection operator Cox analyses were performed to develop a GRG-based risk score model. A nomogram was subsequently established and validated. Its correlation with cancer immune microenvironment and drug susceptibility was further analyzed. The role and immunological correlation of ST6GALNAC4 were further experimentally validated at the tissue and cellular levels in HCC.
Results: A total of 87 GRGs were identified to be significantly dysregulated in HCC, and a novel risk score model was constructed using eight critical GRGs, which demonstrated superior prognostic discrimination and predictive power in both training and validation groups. High risk scores in HCC patients were associated with lower OS. The model was also identified as an independent risk factor for HCC, and a novel nomogram was subsequently constructed and validated. Notably, significant correlations were found in risk scores with immune cells infiltration, tumor immunophenotyping, immune checkpoint genes’ expression, and sensitivities to multiple drugs. Furthermore, we validated in local HCC samples that ST6GALNAC4 was significantly upregulated and its knockdown significantly inhibited the tumor proliferation, migration and invasion ability and affected the expression of immune checkpoints on hepatoma cells.
Conclusion: We identified a novel GRG-based model which showed significant prognostic and immunological correlations in HCC, and the oncogenic role of ST6GALNAC4 has been validated and may serve as a potential drug target.
Keywords: hepatocellular carcinoma, glycosylation, ST6GALNAC4, gene signature, prognosis, immune checkpoint
Introduction
As the most common type of primary liver cancer, the global incidence of hepatocellular carcinoma (HCC) remains high, with over 800,000 new cases each year.1,2 Besides, HCC is also one of the leading causes of cancer-related deaths due to the close proximity of the number of deaths to the number of incidences. The high rate of intermediate to advanced HCC with limited chance for radical treatments at the time of diagnosis is one of the major factors contributing to poor treatment outcomes.2 Although multiple systemic treatments for advanced HCC, such as chemotherapy and targeted therapy, have been developed in recent years, only limited support was provided in improving the patient prognosis.3 Sorafenib, the first approved targeted agent, currently faces a low proportion of effective population and high frequency of drug resistance. The emergence of new targeted therapies (such as Lenvatinib and regorafenib) offers new options, while the introduction of immunotherapy targeting immune checkpoints has opened a new era in the treatment of advanced HCC.4 Several immune checkpoint inhibitors (ICIs) targeting programmed cell death-1 (PD-1) and PD-1 ligand 1 (PD-L1) have already been certified for the treatment of advanced liver cancer and have achieved some therapeutic effects.5 However, in order to further improve the existing treatment dilemma, there is still an urgent need to deepen the research on the pathogenesis of hepatocellular carcinoma.
Glycosylation is a ubiquitous and important post-translational modification, and a variety of glycosyltransferases and glycosidases have been defined as specific regulators involved in the addition of glycan structures to proteins and lipids.6,7 The modification occurs mainly in the endoplasmic reticulum and Golgi apparatus and contributes to the formation of glycoconjugates such as glycoproteins, proteoglycans, and glycosphingolipids, which provides structural support for their molecular stability and thus affects the physicochemical properties and biological functions.8,9 Glycans, as key components constituting glycoconjugates, exhibit complex structural features and modification patterns due to the diversity of monosaccharides and the different linkages to proteins or lipids.10,11 Glucose (Glc), galactose (Gal), mannose (Man), fucose (Fuc), N-acetylglucosamine (GlcNAc), N-acetylgalactosamine (GalNAc), and sialic acid are common monosaccharides involved in the composition of sugar chains. Based on the different forms of glycosidic bonds, glycosylation can be classified into various types, of which N-linked glycosylation and O-linked glycosylation are the two major types.11,12 The N-linked glycosylation is a highly conserved and the most common form in eukaryotes, which is covalently attached to a certain asparagine (Asn) residue of polypeptide backbone. The presence of core glycan-chain structure (Man3GlcNAc2) is a common feature of N-glycans. According to the side-chain branching, the N-glycans can be further divided into three main subtypes: high mannose, hybrid, and complex types.13 O-linked glycosylation is the attachment of specific monosaccharide to serine (Ser) or threonine (Thr) residue on proteins. GalNAc-initiated mucin type is the most common O-glycan and often found in secreted or membrane-associated glycoproteins.14 O-glycans also include a variety of other types such as O-mannose, O-glucose, O-galactose, and O-GlcNAc. The glycan modifications are involved in multiple pathophysiological processes ranging from the protein folding, stability and intracellular transport, as well as the intercellular interactions and specific signaling pathways.
A growing body of evidence has shown that glycosylation patterns in tumors are significantly altered and that abnormal glycosylation profiles can serve as diagnostic biomarkers or therapeutic targets for tumors.15–17 The aberrant core fucosylation and sialylated Lewis structures, increased branched N-glycans and truncated O-glycans (Tn and Sialyl Tn antigen), and altered glycosphingolipid are the most frequently glycosylation changes in tumors, in which the dysregulation of glycosyltransferase and glycosidase expression may play an important role.15,16 In addition, aberrant localization of glycosyltransferases, altered molecular chaperone activity, PH dysregulation in the Golgi, and changed availability and abundance of sugar substrates can also lead to perturbations of glycomic homeostasis in tumors.12,16 The aberrant glycosylation has been demonstrated to be involved in various biological processes of tumorigenesis and progression, impacting the proliferation, invasion, metastasis, and angiogenesis of tumor cells.17,18 Notably, the effect of glycosylation or glycans on tumor immunity is drawing more and more attention recently.19–22 The specific glycosylation alterations of tumor cells can comprise tumor perception and recognition by immune cells and induce immunosuppressive signaling via various glycan-binding receptors of lectins (such as sialic acid-binding immunoglobulin-like lectins (SIGLECs), macrophage galactose-specific lectin (MGL), and dendritic cell-specific ICAM-3-grabbing non-integrin 1 (DC-SIGN)), which promotes the immune evasion of tumor microenvironment.19 In particular, recent studies have further revealed the effects of glycosylation modifications on the structure and function of immune checkpoint molecules.23–26 Therefore, the depiction and decoding of tumor-specific glycosylation profiles will help to establish a more comprehensive regulatory network of tumor malignant phenotypes, discover specific biomarkers for early diagnosis, and develop novel therapeutic targets.
In the present study, we performed an integrated analysis on the glycosylation-related genes (GRGs) in HCC using transcriptomic data and identified and constructed the aberrant expression profiles, interaction networks, and regulation mechanisms of GRGs. Then, a novel prognostic model based on the critical GRGs was constructed and validated, and its role in modulating the immunological microenvironment and drug sensitivity in HCC was further analyzed. Notably, the elevated expression and potential role of ST6GALNAC4 and its correlation with immune checkpoints were demonstrated in HCC tissues and cells. These findings may provide new insights into the role of glycosylation in HCC and offer new ideas for the development of new therapeutic targets for HCC.
Materials and Methods
Patients and Transcriptome Datasets
The RNA sequencing data from 424 samples (HCC samples: 374, normal controls: 50) was downloaded from the Cancer Genome Atlas (TCGA)-LIHC database (https://portal.gdc.cancer.gov/). Microarray data from 225 cancer samples and 220 normal tissues from an independent HCC cohort of GSE14520 were downloaded from Gene Expression Omnibus (GEO, https://www.ncbi.nlm.nih.gov/geo/). All samples were included for gene expression-related differential and correlation analyses, whereas only cases with complete clinicopathological data were enrolled for clinical correlation and prognostic analyses. Prognostic analyses were conducted on 370 and 221 HCC patients from the TCGA and GSE14520 cohorts, respectively. Table S1 presents the clinicopathological characteristics of patients from both cohorts.
As the local validation cohort, 47 HCC patients treated with hepatectomy in the Third Affiliated Hospital of Sun Yat-Sen University were retrospectively collected. Informed consent was obtained from each patient in writing. Additionally, the study was approved by the Ethics Committee of Sun Yat-Sen University’s Third Affiliated Hospital and conducted according to the Declaration of Helsinki.
Identification and Functional Enrichment Analyses of Differentially Expressed GRGs in HCC
The glycosylation-related gene sets were obtained from the Molecular Signatures Database (MSigDB) (http://www.broadinstitute.org/gsea/index.jsp) with Gene Ontology (GO) terms of “GOBP_PROTEIN_C_LINKED_GLYCOSYLATION (n = 5)”, “GOBP_PROTEIN_N_LINKED_GLYCOSYLATION (n = 74)”, “GOBP_PROTEIN_O_LINKED_GLYCOSYLATION (n = 104)”, and “GOBP_REGULATION_OF_PROTEIN_GLYCOSYLATION (n = 14)”. A total of 184 GRGs were yielded after elimination of duplicated genes (Table S2). After analyzing the expression profiles of these genes in both datasets, we obtained the intersecting genes (n = 108, Table S3). We used the Wilcoxon test to identify GRGs that exhibit differential expression between HCC tumors and normal/adjacent controls using the R package “limma” with a false discovery rate (FDR) <0.05. The expression profile was displayed as a heatmap using the R package ‘pheatmap’.
An analysis of differentially expressed GRGs’ protein–protein interaction networks (PPIs) was conducted on the STRING website (https://www.string-db.org/). After that, the network was further visualized using Cytoscape (Version 3.8.0) and analyzed by “cytoHubba” plugin to identify the critical genes. “ClusterProfiler” was used to analyze the Gene Ontology (GO) and Kyoto Encyclopedia of Genes and Genomes (KEGG) analyses.
Identification of the Prognostic GRGs and Construction of the GRGs-Related Risk Score Model in HCC
In the TCGA cohort, 186 cases were randomly assigned to the training group, and 184 cases to the internal validation group. As a first step, a univariate Cox analysis was performed in the overall TCGA cohort to identify prognostic GRGs for OS of HCC. A p-value of 0.001 was set as the screening cutoff. Then, the least absolute shrinkage and selection operator (LASSO) Cox regression analysis was performed using the R package “glment” in the TCGA training group. After screening eight GRGs, the following formula was used to calculate the novel risk score model:

Patients in the validation cohorts of the TCGA and GSE14520 were also calculated risk scores. A median risk score in the TCGA training group was used to divide patients into low- and high-risk groups. In both training and validation groups, survival analyses with Kaplan–Meier methods were carried out using the R package “survival”. The R package “timeROC” was used to assess the prognostic accuracy of the risk model with 1-, 3-, and 5-year receiver operating characteristic (ROC) curves. In the training and validation groups, the risk plots, patient status, and gene expression were generated using the R package “pheatmap”. Finally, principal component analysis (PCA) was applied to visualize the clustering of patients in different risk groups.
The distributions of risk scores were compared by Wilcoxon test in different subgroups. Additionally, survival analyses were conducted in different subgroups based on various clinical factors, such as age, gender, tumor grade, size, number, and stage.
Construction and Evaluation of a Novel Nomogram for HCC
To evaluate the independent prognostic significance of the risk score model in the training and validation groups, univariate and multivariate Cox regression analyses were performed. Then, combined with the significant clinical parameter, we developed a new nomogram for OS prediction of HCC based on the risk score model using the R package “rms”. We evaluated the prediction performance for 1-, 3-, and 5-year OS by calculating the concordance index (C-index) and calibration curves.
Gene Set Enrichment Analysis
With the KEGG gene set, gene set enrichment analysis (GSEA) was subsequently proceeded. Statistical significance was determined by an enrichment pathway with an FDR < 0.25 and an adjusted p value <0.05.
Correlations Between Risk Score Model and Immune Cells Infiltration, Immune Subtypes, and Immune Checkpoint Genes Expression
Single-sample GSEA (ssGSEA) provides an advanced analysis tool to evaluate immune-related features in each sample. Based on the characteristics of 29 gene sets, ssGSEA depicts the immune cells and immune function status in the samples by scoring. Herein, we used the R package “GSVA” for ssGSEA analyses with the method of “ssgsea” in the TCGA dataset and compared the enrichment score by Wilcoxon test in high- and low-risk groups. Then, the infiltration profiles of different immune cells in HCC were further evaluated by multiple estimation algorithms with XCELL, TIMER, QUANTISEQ, MCPCOUNTER, EPIC, CIBERSORT-ABS, and CIBERSORT for the TCGA cohort. From TIMER 2.0 (http://timer.cistrome.org/), the infiltration estimation of different immune cells was downloaded, and correlations between risk scores and immune cell infiltration were calculated using Spearman correlations. Also, from UCSC-Xena (https://xenabrowser.net/datapages/), we obtained the immune subtypes of HCC patients in the TGGA cohort. A Wilcoxon test was used to compare the risk scores between different immune subtypes.
In addition, Wilcoxon test was conducted to compare the expression of various immune checkpoint genes (PD-1; PD-L1; cytotoxic T lymphocyte-associated antigen-4, CTLA-4; lymphocyte-activation gene 3, LAG3; T-cell immunoglobulin and mucin domain 3, TIM3; T cell immunoreceptor with immunoglobulin and ITIM domain, TIGIT; and B7 homolog 3, B7-H3) in different risk groups, and Spearman analyses were used to evaluate the correlation between immune checkpoint genes and risk scores. Then, the correlations between eight critical GRGs and immune checkpoint genes were also assessed by the Spearman correlation analyses and visualized using the TIMER web tool (https://cistrome.shinyapps.io/timer/).
Prediction of HCC Drug Susceptibility with Risk Score Model
To explore the potential impact of GRG expression profile on drug susceptibility in HCC, the data from Genomics of Drug Sensitivity in Cancer (GDSC, https://www.cancerrxgene.org/) and Cellminer (version 2.5, https://discover.nci.nih.gov/cellminer/home.do) databases were used for assessment. First, we utilized the R package “pRRophetic” along with information from GDSC to compare the half-maximum inhibitory concentration IC50s of several chemotherapeutics and targeted drugs between different risk groups. The Cellminer database was then queried to retrieve the RNA-seq composite expression as well as the DTP NCI-60 z scores. Only the FDA approved drugs (n = 216) were retrieved for subsequent analysis. Correlations between the expression of critical GRGs and drug sensitivity were evaluated by the Pearson correlation analyses.
Culture and Transfection of Hepatoma Cells
Two hepatoma cell lines (Huh7 and LM3) were obtained from the Chinese Academy of Sciences’ Shanghai Cellbank and grown in Dulbecco’s modified Eagle’s medium (Gibco, Carlsbad, CA, USA) containing 10% fetal bovine serum (Gibco) and 1% penicillin/streptomycin (Beyotime, Shanghai, China). To knock-down the expression of ST6GALNAC4 in vitro, si-ST6GALNAC4 and negative control (si-NC) were purchased from Ribo Biotech (GuangZhou, China) and transfected into hepatoma cells using Lipo3000 (Invitrogen, Carlsbad, CA, USA). The siRNAs and lipo3000 reagents were mixed in Opti-MEM medium for 15–20 min before transfection with a final siRNA concentration being 50nM per well.
Flow Cytometry
To evaluate the influence of ST6GALNAC4 on immune checkpoints expression, hepatoma cells transfected with si-ST6GALNAC4 and si-NC were harvested after 48h and then stained with surface markers FITC mouse anti-human CD274 (MIH3, Bio-Legend) and PerCP/Cyanine5.5 mouse anti-human CD276 (MIH42, BioLegend). After washing, the cells were subjected to CytoFLEX LX flow cytometry (Beckman Coulter, Brea, CA, USA). The data were further analyzed using FlowJo software (version 10.07).
For cell cycle analysis, the transfected cells were fixed with 70% ethanol overnight at 4°C, and then incubated with PI-staining solution containing ribonuclease A for 30 min in dark at 37°C. Data acquisition was performed with a CytoFLEX LX flow cytometry (Beckman Coulter), and results were analyzed with ModFit LT software (version 3.3, Verity Software House).
Cell Counting Kit-8 Assay
The transfected cells were seeded in 96-well plates at 1000 cells per well, and then Cell Counting Kit 8 (CCK-8) reagent (APExBIO, Houston, TX, USA) was added in the culture at indicated time points. After 2 h of incubation, a microplate reader was used to measure the optical density at 450 nm.
Colony Formation Assay
The transfected cells were seeded and cultured in 6-well plates (1000 cells/well) for 14 days. Cellular clones were fixed with 4% paraformaldehyde (PFA) and stained with crystalline violet. A single clone was defined as cell number >50.
Wound Healing and Transwell Invasion Assay
After 24h of transfection, cells were seeded in 12-well plates and cultured until 90–95% confluence. Scratches were created with a 10-μL pipet tip, and cells were cultured with serum-free medium. Cell migration was assessed by photographing at the indicated time points and the data were processed by ImageJ software. For transwell invasion assay, the transfected cells (5x10⁴) were resuspended with serum-free medium and were seeded into transwell upper chambers (8 μm pore size, Millipore, Burlington, MA, USA), which was precoated with 10% Matrigel (BD Biosciences, San Jose, CA). The lower chamber was filled with medium containing 20% FBS. After incubation of LM3 and Huh7 cells for 24h and 48h, respectively, the cells on the upper surface of the membrane were wiped off and the inserts were fixed with 4% PFA and stained with crystal violet. Then, invading cells were recorded and quantified using an inverted light microscope.
Western Blot
Cells and tissues were lysed in RIPA lysis buffer (Beyotime) with 1 mM PMSF. After quantification of protein concentrations, equal amounts of protein were separated by SDS-PAGE and transferred to polyvinylidene difluoride membranes (Millipore), which were further blocked with 5% skimmed milk for 1 h at room temperature. Then, the membrane was further incubated with primary antibodies at 4°C overnight and horseradish peroxidase conjugated secondary antibodies at room temperature for 1 h. Immunoreactive bands were visualized using an enhanced chemiluminescence detection system (Tanon, Shanghai, China). The primary antibody for detecting ST6GALNAC4 (ab127016) was purchased from Abcam (Cambridge, MA, USA). The antibodies for detection of GAPDH (5174), PD-L1 (13684), and B7-H3 (14058) were purchased from Cell Signaling Technology (Danvers, MA, USA).
RNA Extraction and Quantitative Reverse Transcription-Polymerase Chain Reaction
Total RNA was extracted from cells and tissues using TRIzol reagent (Invitrogen) and then reverse transcribed into cDNA with the Transcriptor First-Strand cDNA Synthesis Kit (Roche, Basel, Switzerland). The SYBR Green I PCR Master Mix (Roche) was used for quantitative reverse transcription-polymerase chain reaction (qRT-PCR) with a LightCycler 480 Real-Time PCR System (Roche). The condition of qRT-PCR cycling was 95 °C for 5 min, 95 °C for 10s, 60 °C for 20s, 72 °C for 20s, 40 cycles. The primers were: ST6GALNAC4, F: 5′-GTGAGGAGATCGTGGTCTATG-3′ and R: 5′- TCTCAAAGTAG-TGGTAAGGCAC-3′; CD274, F: 5′-GGACAAGCAGTGACCATCAAG-3′ and R: 5′- CCCAGAATTACCAAGTGAGTCCT-3′; CD276, F: 5′-CTGGCTTTCGTGTGCTGGA-GAA-3′ and R: 5′- GCTGTCAGAGTGTTTCAGAGGC-3′; GAPDH, F: 5′-AGAAGGCTGGGGCTCATTTG-3′ and R: 5′- AGGGGCCATCCACAGTCTTC-3′. Relative mRNA expression levels of ST6GALNAC4, PD-L1 (CD274), and B7-H3 (CD276) were normalized to GAPDH.
Statistical Analysis
All statistical analyses were performed using the GraphPad Prism 5 (GraphPad Software, San Diego, CA, USA) and the R software (version 4.0.3, https://www.r-project.org/). A p value <0.05 (two-sided) was considered statistically significant.
Results
Identification and Functional Enrichment of the Differentially Expressed GRGs in HCC
By integrating the glycosylation-related gene sets from the MSigDB, we obtained a total of 184 specific GRGs. All of the 184 genes could be found in the TCGA dataset, but only 108 genes were in the GSE14520 dataset. After taking the intersection, 108 common GRGs were screened out for subsequent analyses (Figure 1A). Based on the differential expression analysis, 76 and 11 genes were found to be significantly upregulated and downregulated in HCC tumors in the TCGA dataset, respectively (all p < 0.05, Figure 1B). A heatmap was created to display the overall expression profiles of these differentially expressed GRGs (Figure 1C).
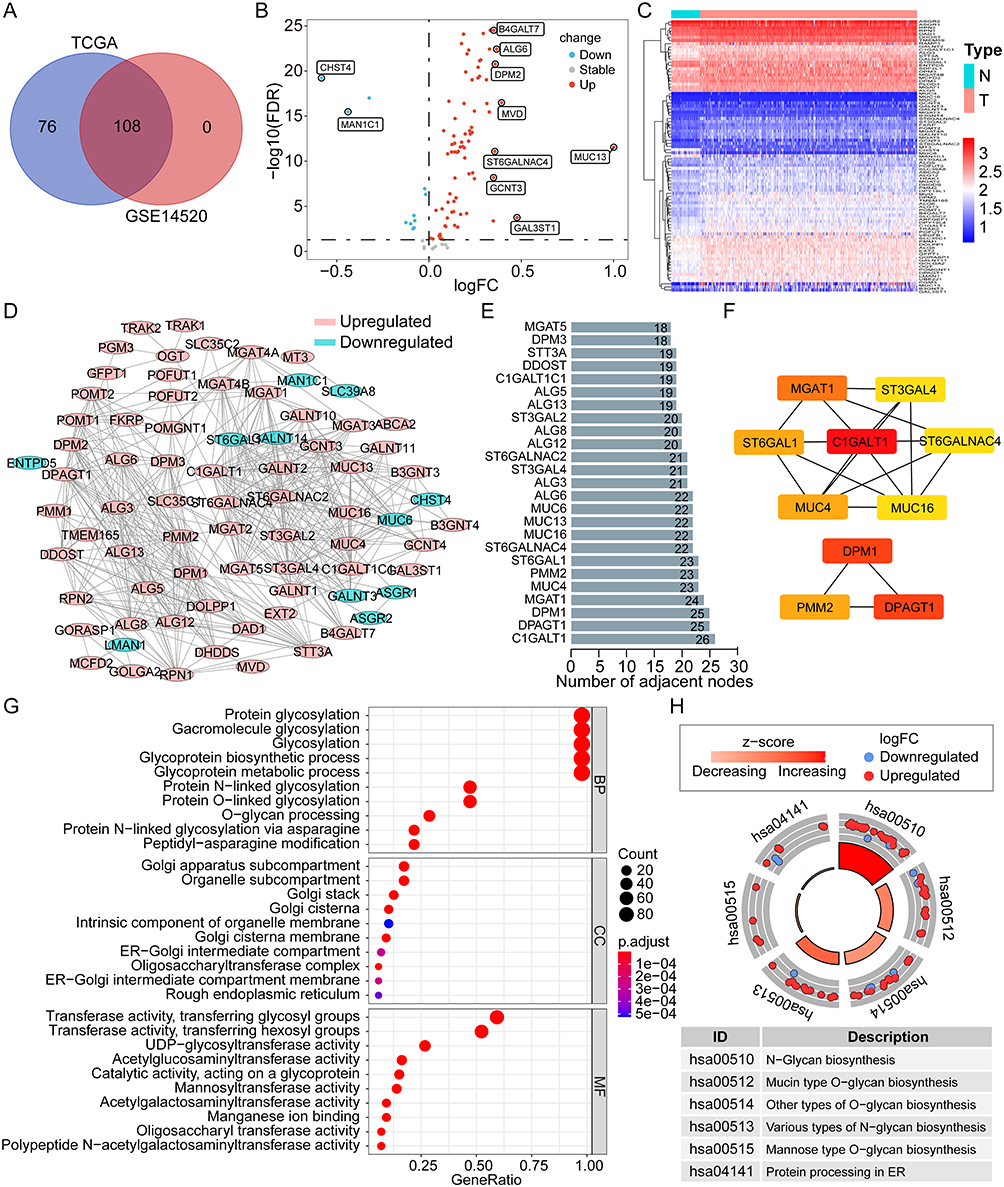 |
Figure 1 The expression profile, PPI network, and functional enrichment of GRGs in HCC. (A) Venn plot of the Common GRGs (n = 108) both in the TCGA and GSE14520 datasets. (B and C) Volcano plot and heatmap of the differentially expressed GRGs in HCC from the TCGA dataset. (D) PPI network of the differentially expressed GRGs in HCC. (E) Top 25 differentially expressed GRGs based on the number of adjacent nodes. (F) Top 10 core GRGs based on the “cytoHubba” algorithm. (G and H) GO and KEGG enrichment analyses of the differentially expressed GRGs in HCC. Abbreviations: GO, Gene Ontology; BP, biological process; CC, cellular component; MF, molecular function; KEGG, Kyoto Encyclopedia of Genes and Genomes; PPI, protein–protein interaction; GRGs, glycosylation-related genes; HCC, hepatocellular carcinoma; TCGA, the Cancer Genome Atlas. |
The PPI network indicated complicated interactions of these differentially expressed GRGs in HCC (Figure 1D). Through nodal analysis, we found that C1GALT1, DPAGT1, DPM1, MGAT1, MUC4, PMM2, ST6GAL1, ALG6, MUC13, MUC16, MUC6, and ST6GALNAC4 were the top genes with the most potential interactions with other differentially expressed GRGs (Figure 1E). With the “cytoHubba” algorithm, the top 10 key genes of these differentially expressed GRGs were identified with C1GALT1, DPM1, DPAGT1, MGAT1, PMM2, ST6GAL1, MUC4, ST6GALNAC4, ST3GAL4, and MUC16 (Figure 1F). Most of these top genes were covered in the nodal analysis.
Analyses of GO and KEGG were utilized to enrich functional pathways. It was found that GRGs were mostly enriched for biological processes (BP) such as glycoprotein biosynthesis and metabolic processes and protein glycosylation (N-linked and O-linked) (Figure 1G). The cellular component (CC) was mainly enriched in the Golgi subcompartment and endoplasmic reticulum (ER) for most glycosylation-related proteins (Figure 1G). As for the molecular function (MF), glycosyltransferase and hexosyltransferase activities were mainly enriched (Figure 1G). KEGG pathway analysis showed that the N-glycan, mucin-type O-glycan, other types of O-glycan, various types of N-glycan, mannose type O-glycan biosynthesis, and protein processing in ER were mainly enriched (Figure 1H). The findings indicated that GRGs were dysregulated in HCC and that potential molecular mechanisms were involved.
Development and Validation of a Prognostic GRG-Based Risk Score Model for HCC
Among the 108 differentially expressed GRGs, 22 genes were identified as the prognosis-related genes for OS in the overall TCGA cohort by univariate Cox regression analysis (all p < 0.01, Figure 2A). The hazard ratios (HRs) of these genes were all >1, which indicated their roles as risk factors for OS of HCC. Subsequently, the LASSO Cox regression analysis was utilized to identify the critical GRGs in the TCGA training group and eight genes were screened out (Figure 2B and C). Each gene was assigned a coefficient to construct a novel risk score model based on the GRGs: ALG3, 0.059; C1GALT1, 0.177; DPAGT1, 0.154; MT3, 0.186; POMT2, 0.213; RPN1, 0.103; ST6GALNAC4, 0.264; and STT3A, 0.085. Notably, ST6GALNAC4 owned the highest coefficient, and three genes (ST6GALNAC4, C1GALT1, and DPAGT1) were also listed as the core GRGs in the PPI network.
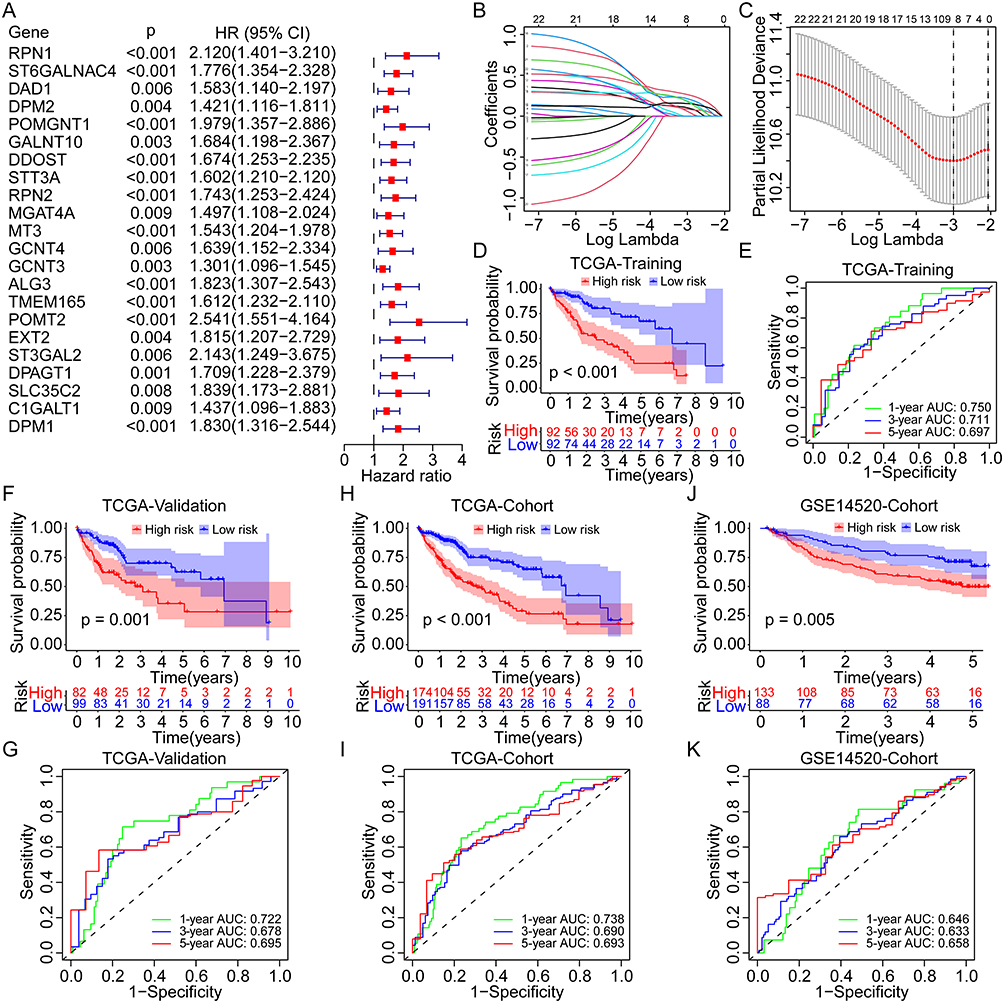 |
Figure 2 Construction and evaluation of the novel prognostic risk score model based on the GRGs in HCC. (A) Univariate Cox analysis of the differentially expressed GRGs for OS of HCC in the TCGA cohort. (B and C) Lasso Cox analysis to identify the critical GRGs for the construction of risk score model in the TCGA training group. Survival curves and the 1-, 3-, and 5-year ROC curves of high- and low-risk patients in the TCGA training group (D and E), the TCGA validation group (F and G), the TCGA overall cohort (H and I), and the GSE14520 cohort (J and K). Abbreviations: OS, overall survival; Lasso, least absolute shrinkage and selection operator; GRGs, glycosylation-related genes; HCC, hepatocellular carcinoma; TCGA, the Cancer Genome Atlas. |
According to the prescribed formula, risk scores were calculated for all patients in the TCGA training and validation cohorts and the GSE14520 cohort. The median risk score in the TCGA training cohort was set as the cut-off value for dividing patients into high- and low-risk groups. Survival analyses showed that patients in the high-risk group presented with worse OS than those in the low-risk group in the TCGA training cohort (p < 0.001, Figure 2D), and the area under the curve (AUC) for 1-, 3-, and 5-year OS was 0.750, 0.711, and 0.697, respectively (Figure 2E). According to the validation cohort of the TCGA, the high-risk group also had worse OS (p = 0.001, Figure 2F), with AUCs of 0.722, 0.678, and 0.695 (Figure 2G), respectively, at 1-, 3-, and 5-years. As for the overall TCGA cohort, worse OS was consistent in the high-risk group (Figure 2H), and the AUC for 1-, 3-, and 5-year OS was 0.738, 0.690, and 0.693, respectively (Figure 2I). In the GSE14520 cohort, similar results were obtained. Patients in the high-risk group had worse OS (p = 0.005, Figure 2J), and the AUC for 1-, 3-, and 5-year OS was 0.646, 0.633, and 0.658, respectively (Figure 2K).
In the TCGA training cohort, 51% of patients in the high-risk group occurred death events, but only 22% of patients in the low-risk group (Figure 3A). In the TCGA validation cohort, 45% and 26% of patients experienced death in high- and low-risk groups, respectively (Figure 3B). As for the overall TCGA cohort, the rate of death event in the high-risk group was two times than in the low-risk group (48% vs 24%, Figure 3C). Similar results were found in the GSE14520 cohort, with a higher incidence of death events in the high-risk group than in the low-risk group (46% vs 27%, Figure 3D). The risk plots further displayed the positive correlations between higher expression of all critical GRGs and the risk scores and the mortality rates in the TCGA training, validation, and overall cohorts, as well as the GSE14520 cohort (Figure 3E–H). The PCAs based on gene expression profiles confirmed the significant distribution difference between high- and low-risk groups both in the training and validation cohorts (Figure 3I–L).
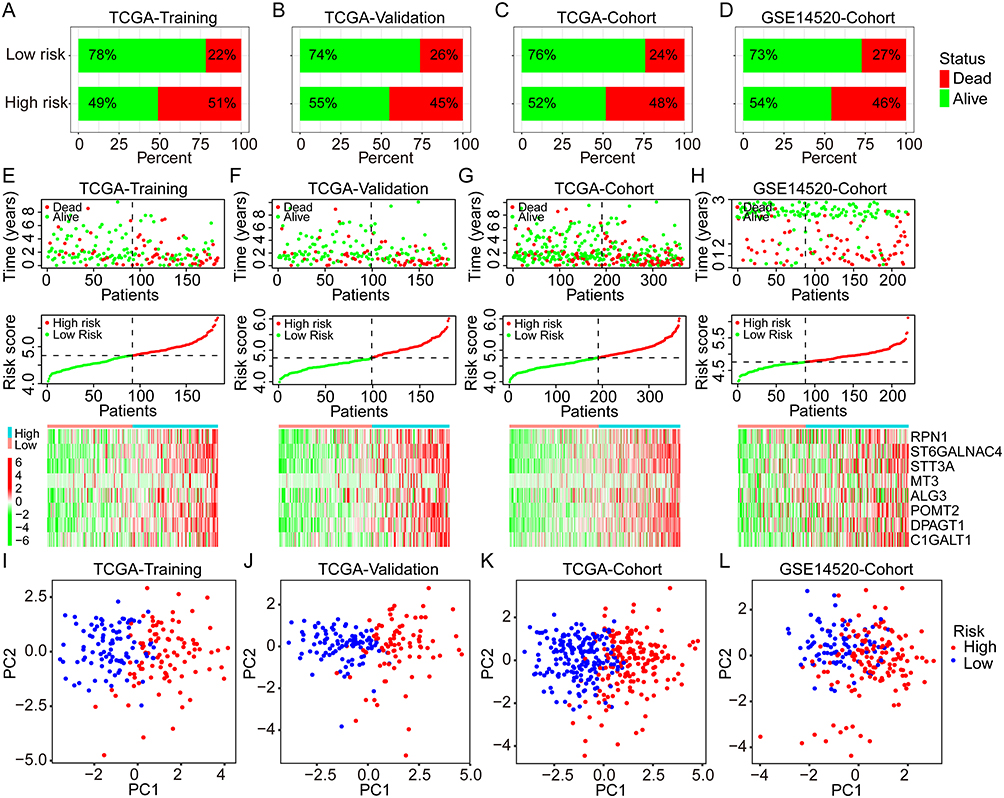 |
Figure 3 Distribution of the risk score, survival status, and GRGs expression in different cohorts. (A–D) Percentages of different survival status in high- and low-risk patients in the TCGA training group, the TCGA validation group, the TCGA overall cohort, and the GSE14520 cohort. (E–H) Distribution of the risk score, survival status, and GRGs’ expression in the TCGA training group, the TCGA validation group, the TCGA overall cohort, and the GSE14520 cohort. (I–L) PCA analysis for the distribution of high- and low-risk patients in the TCGA training group, the TCGA validation group, the TCGA overall cohort, and the GSE14520 cohort. Abbreviations: PCA, principal component analysis; GRGs, glycosylation-related genes; HCC, hepatocellular carcinoma; TCGA, the Cancer Genome Atlas. |
Independent Prognostic Significance of the Novel Risk Score Model Based on GRGs
Univariate and multivariate Cox analyses were performed to evaluate the independent prognostic value of the risk score model in the training and validation cohorts. In the TCGA training cohort, the risk score and tumor stage were identified as significant prognostic factors both in the univariate [stage, p = 0.002, HR = 1.538 (1.174–2.016); risk score, p < 0.001, HR = 6.361 (3.095–13.072)] and multivariate [risk score, p < 0.001, HR = 5.806 (2.764–12.198); stage, p = 0.013, HR = 1.419 (1.076–1.871)] Cox analyses (Figure 4A). In the TCGA validation group, risk score and tumor stage were also found with significance both in the univariate and multivariate Cox analyses (Figure 4B). Similar results were further identified in the entire TCGA cohort (Figure 4C). The univariate Cox analysis of the GSE14520 cohort found significant the cancer stage, tumor size, and risk score, while the multivariate analysis found significant only the tumor stage and risk score (Figure 4D). Hence, the novel risk score and tumor stage were identified and validated as the independent prognostic factors for OS of HCC in various cohorts.
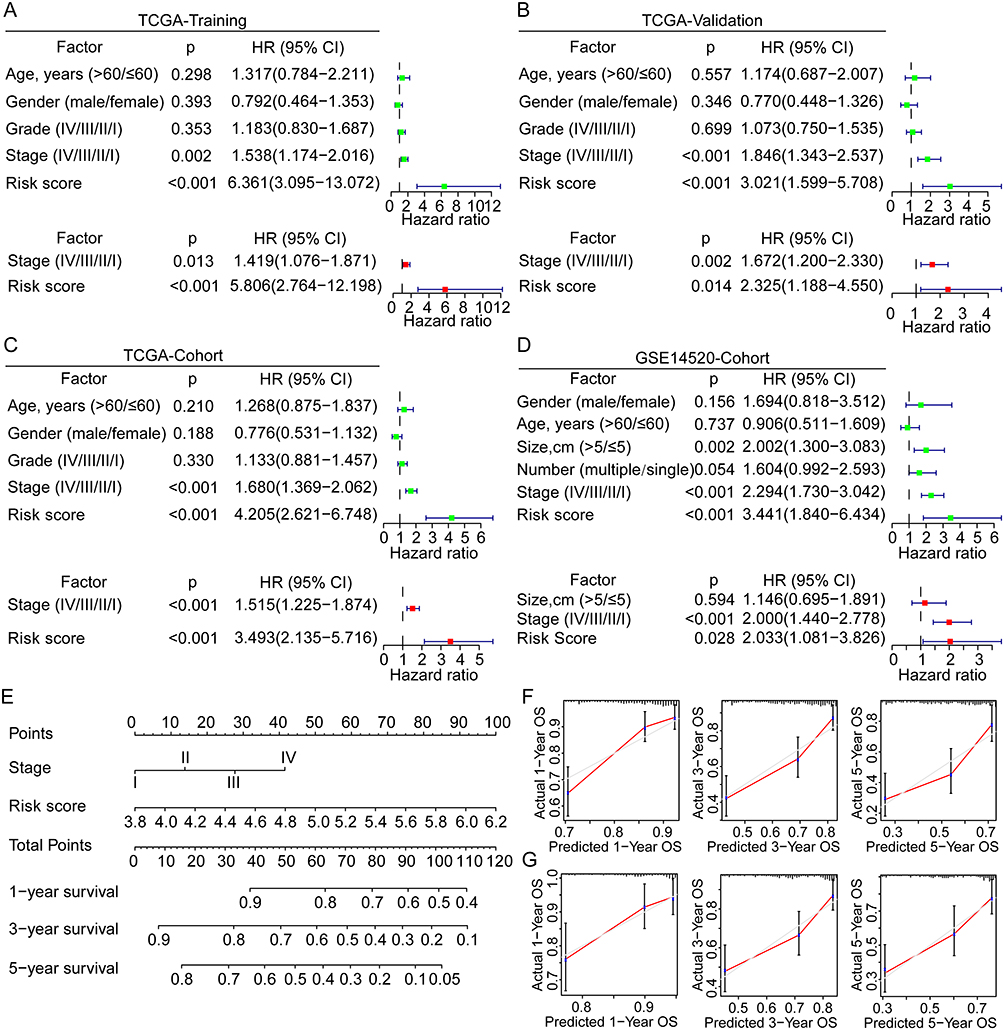 |
Figure 4 Univariate and multivariate Cox analyses for the development of a prognostic nomogram for OS prediction in HCC. (A–D) Univariate and multivariate Cox analyses for OS of HCC in the TCGA training group, the TCGA validation group, the TCGA overall cohort, and the GSE14520 cohort. (E) Establishment of a prognostic nomogram based on the risk score and clinical stage for OS prediction of HCC. (F and G) Calibration curves for evaluation of the prognostic accuracy of the nomograms for the TCGA and GSE14520 cohorts. Abbreviations: HR, hazard ratio; OS, overall survival; HCC, hepatocellular carcinoma; TCGA, the Cancer Genome Atlas. |
Based on the independent prognostic factor analyses, we developed a novel prognostic nomogram by integrating the risk score and tumor stage for 1-, 3-, and 5-year OS prediction (Figure 4E). In the TCGA and GSE14520 cohorts, the nomogram showed superior prediction accuracy, exhibiting C-indices of 0.700 and 0.699, respectively. Also, the calibration curves for 1-, 3- and 5-year OS rates were largely similar to the standard lines for TCGA and GSE14520 (Figure 4F–G). These findings indicated the significant prognostic value of GRG-based risk score in HCC.
Correlations Between Risk Scores and Clinicopathological Factors and Prognostic Subgroup Analyses
To evaluate the correlation between risk score and clinicopathological factors, we compared the distribution of risk scores in various subgroups divided by age, gender, tumor grade, stage, size, and number both in the TCGA overall cohort and the GSE14520 cohort. In the TCGA cohort, the mean risk score was higher in grade III–IV (p = 2.3e-05), T3-4 (p = 0.0029), and stage III–IV (p = 0.00039), whereas no significant difference was found between subgroups of age (>/≤ 60 years, p = 0.078) and gender (male/female, p = 0.11) (Figure 5A). There was a higher risk score in tumor sizes > 5cm (p = 0.0048), multiple tumor number (p = 0.014), and stage III–IV (p = 0.00086) in the GSE14520 cohort, while there was no significant difference between the age and gender subgroups (all p > 0.05) (Figure 5B). Moreover, we evaluated the prognostic significance of the risk model across subgroups in the whole TCGA cohort. According to the results, high-risk patients had a worse OS both with age >60 years (p < 0.001) and ≤60 years (p < 0.001), male (p < 0.001), grade I–II (p < 0.001) and III–IV (p = 0.001), and stage I–II (p < 0.001), whereas no significant difference in subgroups with female (p = 0.052) and stage III–IV (p = 0.129) (Figure 5C). A significant difference in OS was validated in subgroups of the GSE14520 cohort based on age ≤60 years (p = 0.005), male (p = 0.006), tumor size > 5cm (p = 0.010), and stage I–II (p = 0.026) (Figure 5D).
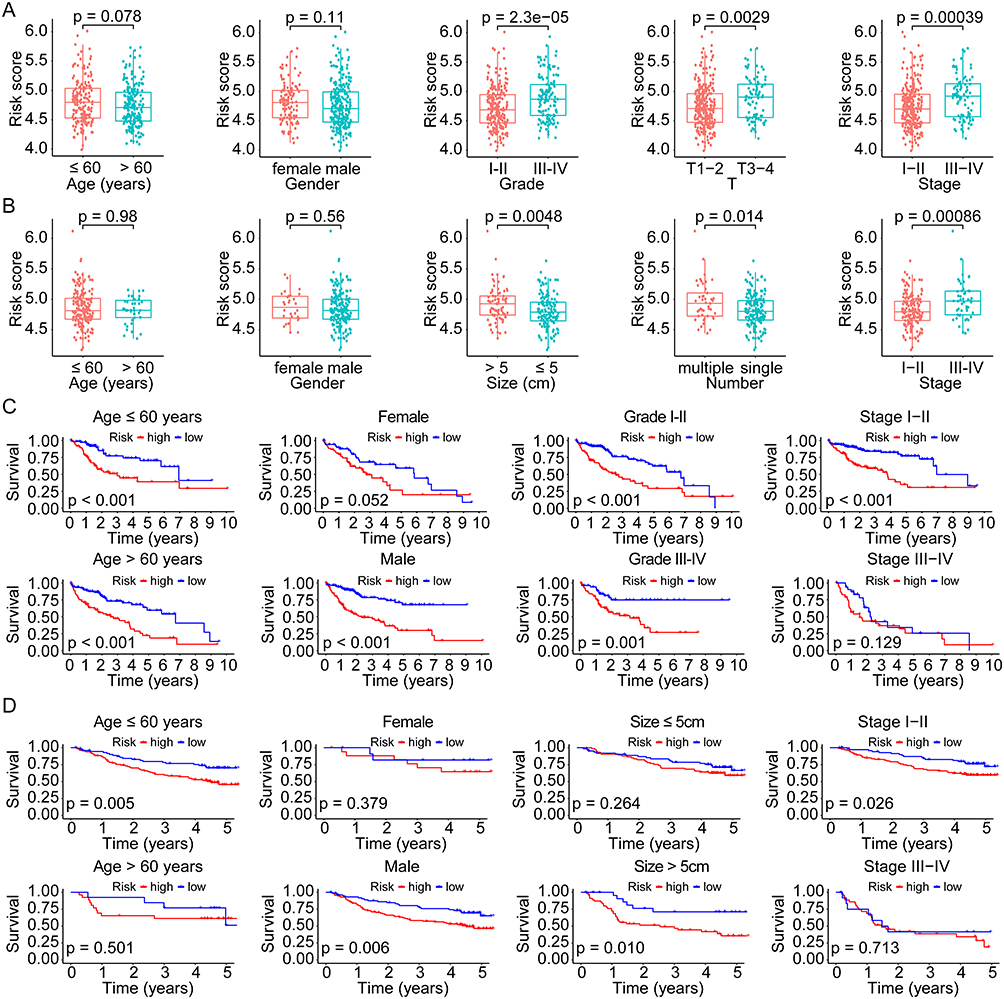 |
Figure 5 Correlation and subgroup survival analyses of the risk score and clinical characteristics in HCC. (A and B) Risk score in different subgroups divided by various clinical factors in the TCGA and GSE14520 cohorts. (C and D) Survival curves of the high- and low-risk patients in different subgroups of the TCGA and GSE14520 cohorts. Abbreviations: HCC, hepatocellular carcinoma; TCGA, the Cancer Genome Atlas. |
Analysis of Molecular Regulatory Pathways Based on Critical GRGs in HCC
To investigate the potential mechanism of critical GRGs in regulating the progression of HCC, GSEA was conducted using the TCGA sequencing data and the corresponding risk groups. Results showed that pathways with adherens junction, cell cycle, ERBB signaling, Fc gamma receptor-mediated phagocytosis, N-glycan biosynthesis, P53 signaling, ubiquitin-mediated proteolysis, and pathways in cancer were enriched in high-risk groups (Figure 6A), whereas pathways with drug metabolism by cytochrome p450, fatty acid metabolism, glycine, serine, and threonine metabolism, xenobiotics metabolism by cytochrome p450, peroxisome, PPAR signaling, primary bile acid biosynthesis, and retinol metabolism were enriched in the low-risk group (Figure 6B). These results indicated that multiple pathways regulated by GRGs involved in HCC progression, which might provide potential targets for the treatment of HCC.
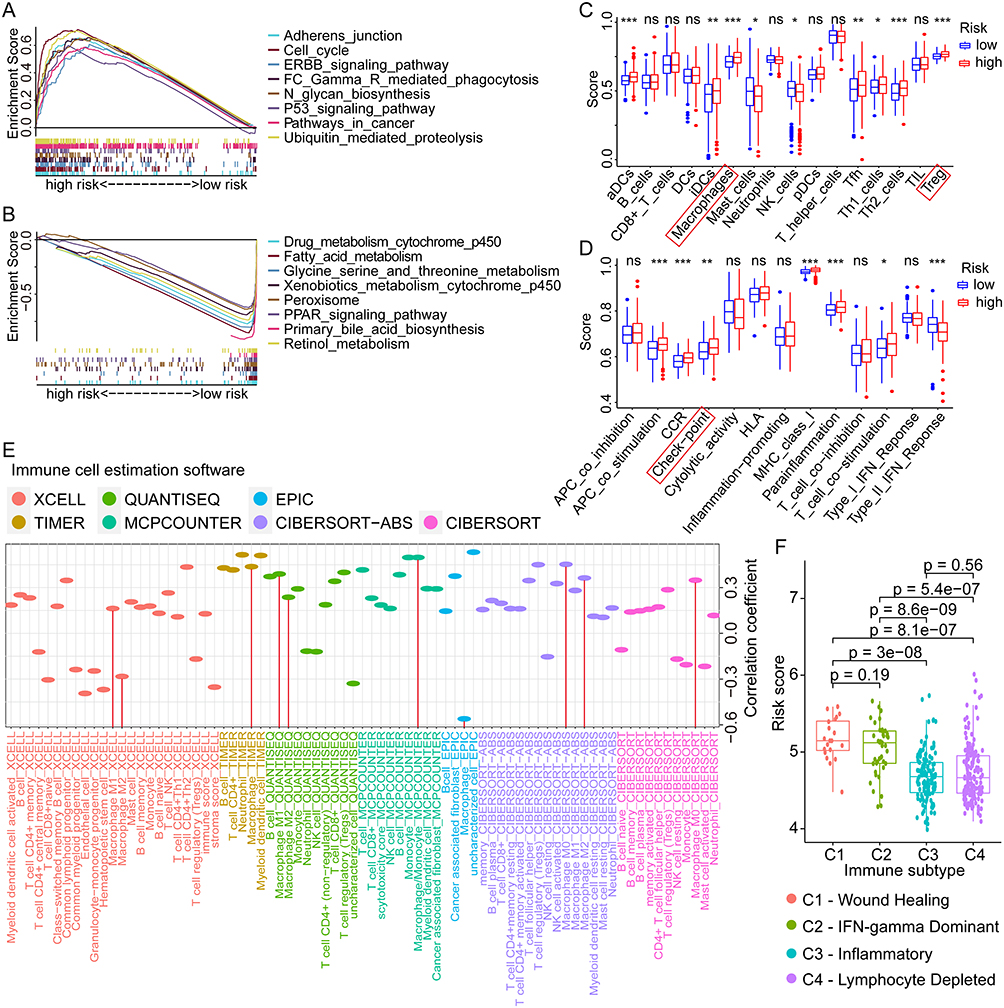 |
Figure 6 GSEA, ssGSEA, and immunological correlation analyses of different risk scores in HCC. (A and B) Enriched pathways in high- and low-risk groups of HCC by GSEA analysis. (C and D) Differential analyses of the immune status and function in high- and low-risk groups by ssGSEA analysis. (E) Correlation analyses between the risk scores and the infiltration levels of various immune cells in HCC. (F) The distribution of risk scores in different immune subtypes of HCC. ns not significant, *p < 0.05, **p < 0.01, ***p < 0.001. Abbreviations: GSEA, gene set enrichment analysis; ssGSEA, Single-sample GSEA; HCC, hepatocellular carcinoma. |
Correlation Between the Risk Score Model and Immune Microenvironment of HCC
To assess the potential impact of GRGs on immune status and function in the HCC tumor microenvironment, we performed the ssGSEA in the TCGA dataset with GRG-based risk groups. As for the immune cells, the estimation scores of gene sets with activated dendritic cells (aDCs, p < 0.001), interdigitating dendritic cells (iDCs, p < 0.01), macrophages (p < 0.001), follicular helper T cells (Tfh, p < 0.01), Th1 cells (p < 0.05), Th2 cells (p < 0.001), and regulatory T cells (Treg, p < 0.001) were higher in high-risk group, while the estimation scores of gene sets with mast cells and NK cell was lower in the high-risk group (all p < 0.05, Figure 6C). As for the immune functions, the estimation scores of gene sets with antigen-presenting cell (APC) co-stimulation (p < 0.001), CC chemokine receptor (CCR, p < 0.001), Check-point (p < 0.01), MHC class I (p < 0.001), para-inflammation (p < 0.001), and T-cell co-stimulation (p < 0.05) were higher in high-risk group, whereas the estimation score of gene set with Type II IFN response (p < 0.001) was lower in high-risk group (Figure 6D). These results indicated the significant role of glycosylation in regulation of HCC immune microenvironment.
Subsequently, we evaluated the correlations between different immune cell infiltration levels and GRG-based risk score in HCC using multiple estimation algorithms with XCELL, TIMER, QUANTISEQ, MCPCOUNTER, EPIC, CIBERSORT-ABS, and CIBERSORT. Results showed significant correlations between many kinds of immune cells (B cells, CD4+ T cells, Tregs, NK cells, and macrophages) and risk score, especially for the macrophage (Figure 6E). Besides, we also compared the differential distribution of risk scores in specific immune subtypes of HCC. Results showed that the mean risk scores in C1 (wound healing) and C2 (IFN-gamma dominant) immune subtypes were significantly higher than that in C3 (inflammatory) and C4 (lymphocyte depleted) subtypes (Figure 6F), which further revealed the important role played by glycosylation in shaping the immune microenvironment of HCC.
Based on the above analysis of immune cells, we would like to further explore whether immune checkpoints, important regulators of the tumor immunosuppressive microenvironment, are also regulated by glycosylation and correlated with GRGs-based risk scores. Therefore, we first compared the expression profiles of PD-1, PD-L1, CTLA4, LAG3, TIGIT, TIM3, and B7-H3 in high- and low-risk groups, and results showed that the expression levels of the seven key immune checkpoint genes were all higher in the high-risk group (all p < 0.05, Figure 7A). There was also a positive correlation between the risk score and these immune checkpoint gene expressions (PD-1, R = 0.35, p =5.8e-12; PD-L1, R = 0.16, p = 0.0027; CTLA4, R = 0.39, p = 7.6e-15; LAG3, R = 0.15, p = 0.0032; TIGIT, R = 0.32, p = 8.8e-10; TIM3, R = 0.44, p < 2.2e-16; B7-H3, R = 0.53, p < 2.2e-16) (Figure 7B).
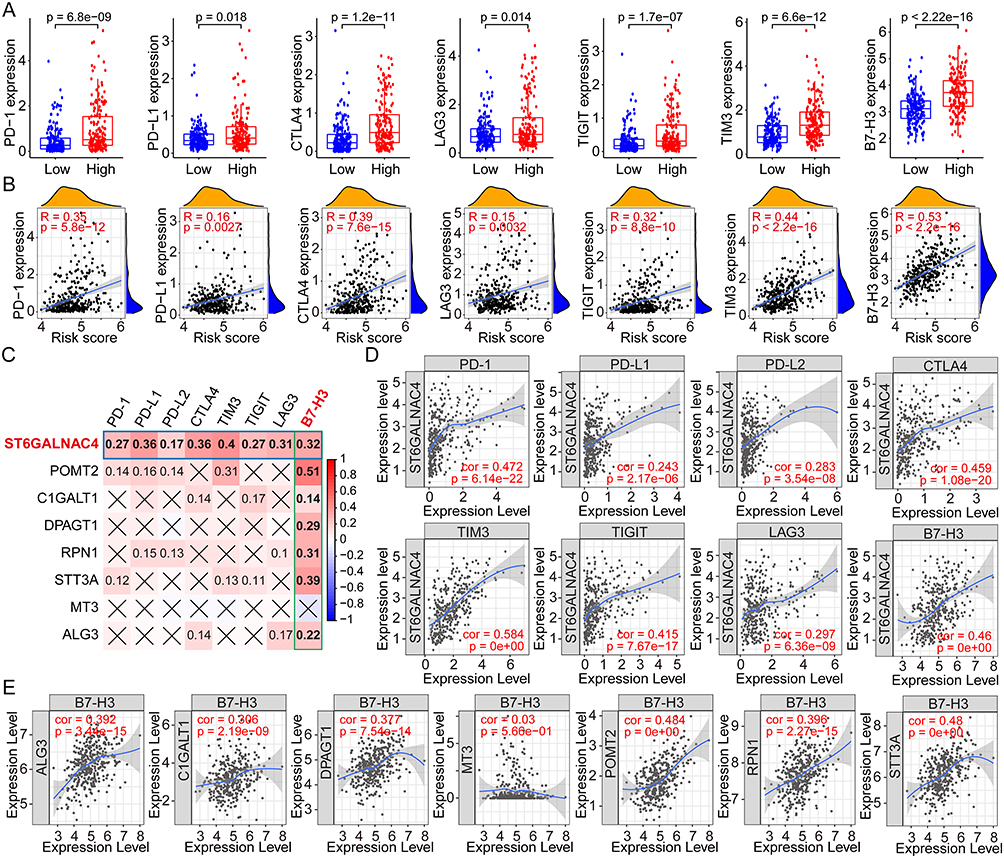 |
Figure 7 Correlation analyses between the risk scores, GRGs, and the immune checkpoint genes in HCC. (A) Differential expressions of immune checkpoint genes in high- and low-risk groups of HCC. (B) Correlation analyses between risk scores and the multiple immune checkpoint gene expressions in HCC. (C) Correlation analyses between the expressions of GRGs and immune checkpoint genes in HCC. (D) Correlation dot plots of ST6GALNAC4 with multiple immune checkpoint genes in HCC from the TIMER database. (E) Correlation dot plots of B7-H3 with GRGs from the TIMER database. Abbreviations: GRGs, glycosylation-related genes; HCC, hepatocellular carcinoma. |
Then, the expression correlations between the critical GRGs and the immune checkpoint genes were evaluated by the Spearman correlation analysis using the TCGA dataset and the results showed in a heatmap (Figure 7C). ST6GALNAC4 was found to be significantly correlated with the expression of all seven immune checkpoint genes, and B7-H3 was found to be positively correlated with the most critical GRGs. We further analyzed the expression correlation between ST6GALNAC4 and immune checkpoint genes using the TIMER database, and the results were similar to our local findings. Considering that the gene expressions in TIMER database were log-transformed, the correlation coefficients were inconsistent with the results from or analyses. Significant correlation was found between ST6GALNAC4 and TIM3 (cor = 0.584), PD-1 (cor = 0.472), B7-H3 (cor = 0.460), CTLA4 (cor = 0.459), and TIGIT (cor = 0.415) (Figure 7D). The correlations between B7-H3 and other critical GRGs were also visualized using the TIMER web tool, and results showed that POMT2 (cor = 0.484) and STT3A (cor = 0.480) presented high correlations with B7-H3 expression (Figure 7E). These results provided new insights into the regulation mechanisms of immune checkpoint gene expressions in the immune microenvironment of HCC.
Correlation Analyses of the GRGs and GRG-Based Risk Score with Drug Sensitivities
Considering that multiple pathways were significantly dysregulated in different risk groups, whether GRGs or GRGs-based risk scores correlate with treatment resistance in HCC patients warrants further investigation. Hence, we performed a differential analysis of the sensitivity of patients in high- and low-risk groups to regular chemotherapeutic and targeted agents using the GDSC database. Results showed that patients in the high-risk group had significantly higher IC50s for sorafenib (p = 3.5e-05), gefitinib (p = 0.0032), and erlotinib (p < 2.22e-16) than those in the low-risk group (Figure 8A), implying that patients in the high-risk group may be less sensitive to the above-mentioned targeted drugs. Similar results were also observed in Methotrexate (p = 4.8e-05), rapamycin (p = 9.2e-10), and temsirolimus (p < 2.22e-16) (Figure 8A). As for Doxorubicin (p = 6.7e-11), gemcitabine (p < 2.22e-16), mitomycin C (p < 2.22e-16), paclitaxel (p = 0.00049), bleomycin (p < 2.22e-16), and etoposide (p = 2.2e-05), lower IC50s were found in the high-risk group (Figure 8A).
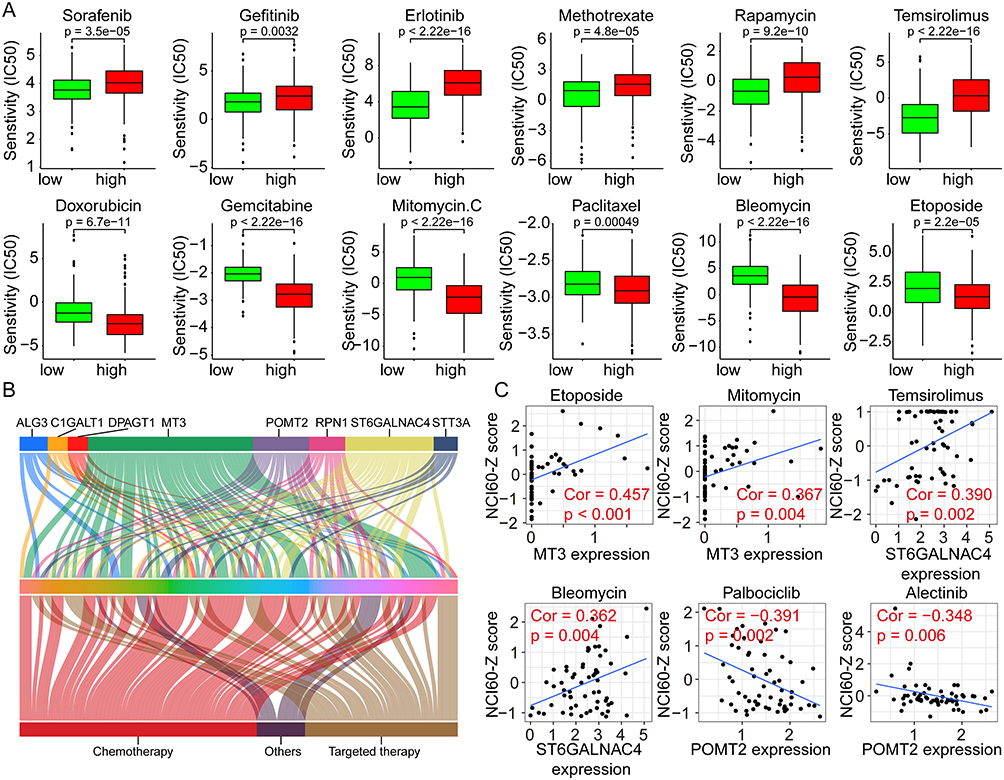 |
Figure 8 Correlation analyses between the risk scores and the drug susceptibilities of HCC. (A) The IC50s of various drugs to HCC in high- and low-risk groups using the GDSC data for analyses. (B) Correlation analyses between the GRGs’ expression and the NCI60-Z scores of various drugs in HCC using the Cellminer data. (C) Representative dot plots showing the correlation between GRGs and drugs with significant coefficients. Abbreviations: GRGs, glycosylation-related genes; HCC, hepatocellular carcinoma. |
In addition, we analyzed the effect of GRG expression levels on drug sensitivities using the Cellminer database and the results showed in Figure 8B. The expression level of MT3 correlated with the sensitivities of 41 drugs, followed by ST6GALNAC4 and POMT2, which correlated with the sensitivities of 22 and 14 drugs, respectively. The representative drugs with high correlation coefficients with MT3, ST6GALNAC4, and POMT2 were etoposide (cor = 0.457) and mitomycin (cor = 0.367), temsirolimus (cor = 0.390) and bleomycin (cor = 0.362), and palbociclib (cor = −0.391) and alectinib (cor = −0.348), respectively (Figure 8C). These results suggested that glycosylation might affect the therapeutic sensitivities of multiple drugs for HCC and could serve as new potential therapeutic targets.
Validation of the Upregulation of ST6GALNAC4 in HCC Tissues and Its Immune Correlations
As one of the critical GRGs, ST6GALNAC4 showed a significant clinical significance and immune correlation in the aforementioned results, which further attracted our attention. First, we evaluated the mRNA expression levels of ST6GALNAC4 in 47 paired HCC and paracancerous tissue samples. Results showed that ST6GALNAC4 was upregulated in 68.1% (n = 32) of HCC samples (Figure 9A), and its mean expression level was also significantly higher than that of paracancerous tissues (p < 0.01) (Figure 9B). ST6GALNAC4 correlated significantly with PD-L1 mRNA expression in HCC tissues (R = 0.342, p = 0.019), while it was less correlated with B7-H3 (R = 0.110, p = 0.461) (Figure 9C and D). In addition, we examined the ST6GALNAC4 protein expression levels in tissue samples and found that six of the eight cases were upregulated in HCC specimens (Figure 9E).
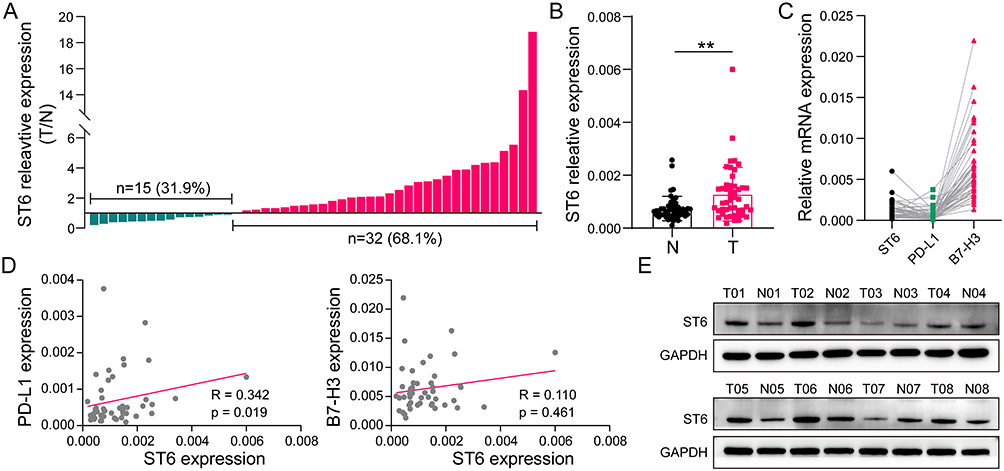 |
Figure 9 Validation of ST6GALNAC4 expression in HCC tissues and its correlation with immune checkpoints. (A) Expression profile of ST6GALNAC4 in 47 HCC tissues compared to paracan-cerous tissues. (B) The mean expression level of ST6GALNAC4 in 47 paired HCC and paracan-cerous tissues (**p < 0.01). (C) The relative expression distribution of ST6GALNAC4, PD-L1, and B7-H3 in HCC tissues. (D) Correlation analyses of ST6GALNAC4 expression with PD-L1 and B7-H3 in HCC tissues. (E) Western blot analysis for ST6GALNAC4 protein expression in HCC and paracancerous tissues. Abbreviations: HCC, hepatocellular carcinoma; PD-L1, programmed cell death-1 ligand 1. |
Knockdown of ST6GALNAC4 Inhibited the Proliferation, Migration, and Invasion of Hepatoma Cells
The role of ST6GALNAC4 in HCC was further evaluated by knocking it down using siRNAs in hepatoma cellular models. After knockdown of ST6GALNAC4, we found that PD-L1 mRNA expression levels were significantly reduced in both Huh7 and LM3 cells (all p < 0.05) (Figure 10A), and flow cytometry (FC) and Western blot (WB) results also indicated that PD-L1 protein levels were also downregulated (Figure 10B and C). B7-H3 mRNA expression levels were also found decreased in Huh7 (all p < 0.05), while were slightly elevated in LM3 (si-ST6GALNAC4-2, p < 0.01) (Figure 10A). Similar findings were shown in the FC and WB results (Figure 10B and C). Therefore, considering the findings in HCC tissues, the correlation between ST6GALNAC4 and PD-L1 deserves further investigation.
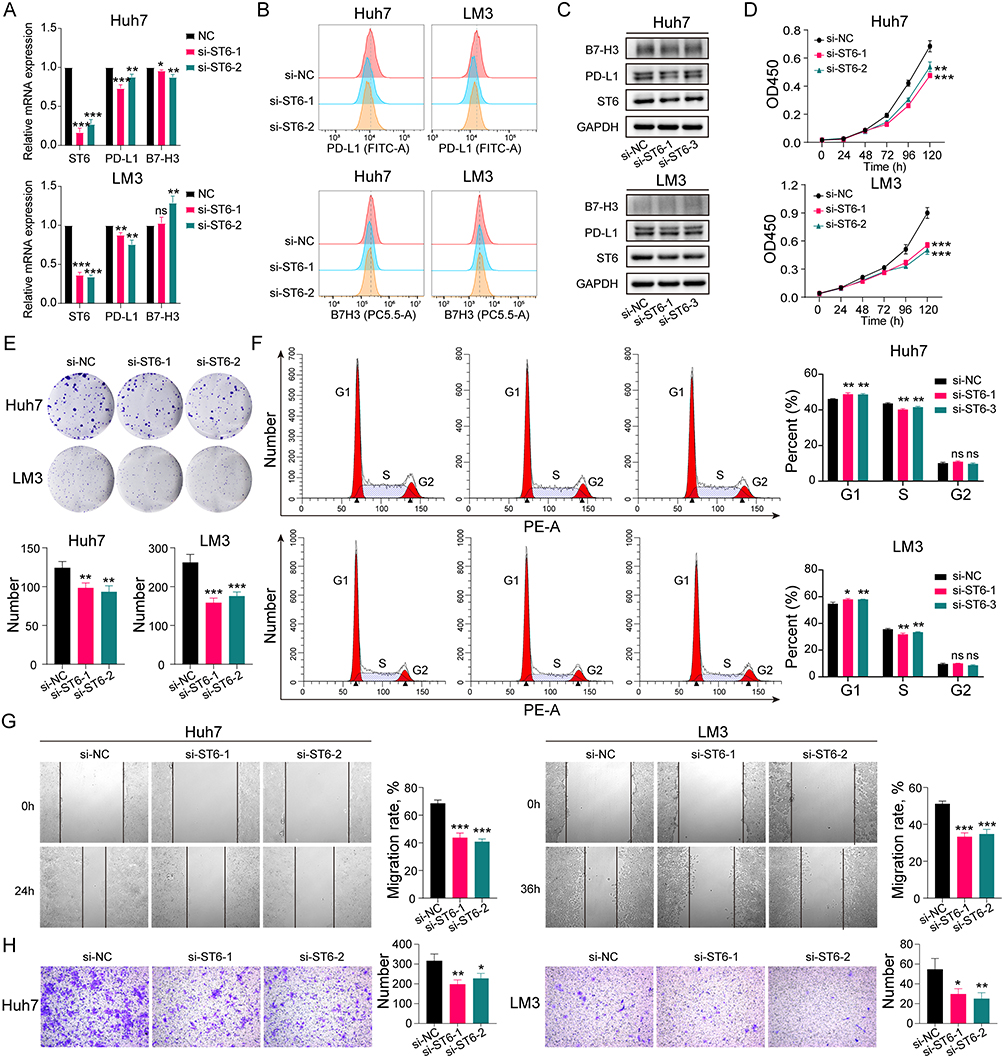 |
Figure 10 Effect of ST6GALNAC4 knockdown on hepatoma cells. (A) Expression of PD-L1 and B7-H3 mRNA in hepatoma cells after ST6GALNAC4 knockdown. (B and C) Flow cytometric and Western blot analyses of PD-L1 and B7-H3 expression in hepatoma cells after ST6GALNAC4 knockdown. (D) CCK-8 analysis of the effect of ST6GALNAC4 knockdown on the proliferative capacity of hepatoma cells. (E and F) Effect of ST6GALNAC4 knockdown on the clone formation ability and cell cycle of hepatoma cells. (G and H) ST6GALNAC4 knockdown inhibited the migration and invasion ability of hepatoma cells. ns not significant, *p < 0.05, **p < 0.01, ***p < 0.001. Abbreviation: PD-L1, programmed cell death-1 ligand 1. |
Furthermore, we found that knockdown of ST6GALNAC4 inhibited the proliferation rate (Figure 10D) and the ability of colony formation (Figure 10E) both for Huh7 and LM3 cells, and led to a G1 phase arrest of the cell cycle in hepatoma cells (Figure 10F). The knockdown of ST6GALNAC4 also inhibited the migration and invasive ability of hepatoma cells (Figure 10G and H). Hence, ST6GALNAC4 may act as a potential drug target for HCC.
Discussion
Glycosylation is a common post-translational modification, and the aberrant homeostasis affects multiple aspects of HCC development, progression, metastasis, and drug resistance.27,28 In addition, glycomics-based studies have identified many novel biomarkers for the early diagnosis and prognosis prediction of HCC, such as core-fucosylated alpha-fetoprotein, α1-antitrypsin, hemopexin, and Golgi proteins 73.29–31 Several studies further interpreted the global glycosylation alterations in serum and tissues of HCC patients, including changed core fucosylation, outer-arm fucosylation, enhanced sialylation, and glycan branching.32 Therefore, intensive investigations on the glycosylation characteristics of HCC are of great importance to reveal the pathogenesis, discover diagnostic and prognostic markers, and develop innovative therapeutic targets.
In this study, we used the transcriptomic data to comprehensively analyze the expression profiles of GRGs in HCC, most of which belong to the encoding genes of various glycosyltransferases and glycosidases. Results revealed the aberrant expression pattern of GRGs in HCC, with most of the differentially expressed GRGs being upregulated (76/87, 87.4%). Further functional and pathway enrichment analyses revealed enhanced activities of multiple glycosyltransferases and significant upregulation of pathways regulating the biosynthesis of N-glycans and O-glycans (mainly with fucosyl and mannose types) in HCC. These results suggested that the overall glycosylation may be enhanced and more active in HCC.
In light of the significant alterations in glycosylation, we further explored the prognostic significance of differentially expressed GRGs in HCC. A total of eight key genes (ALG3, C1GALT1, DPAGT1, MT3, POMT2, RPN1, ST6GALNAC4, and STT3A) were incorporated to construct a novel GRGs-based risk score model for predicting the OS of HCC patients. To our knowledge, this was the first prognostic model based on glycosylated genetic features. The model exhibited excellent predictive power and was validated in another independent dataset.
With GSEA analyses, a number of pathways specifically enriched in high- and low-risk groups were defined, mainly involving cell adhesion, cell cycle, glycan synthesis, Immunomodulation, and drug, fatty acid and amino acid metabolism. Glycosylation has been recognized to be extensively involved in the regulation of antitumor immunity. Expression of lectin-like receptors (SIGLECs, MGLs, and DC-SIGN) on immune cells mediates immunosuppression in response to aberrant tumor-associated glycans in tumor cells.19 Besides, glycan-binding lectins such as galectins could be expressed by multiple tumors and involved in the impairment of T cell effector function, induction of the differentiation of suppressive myeloid cells, and regulation of NK cell activity.33 Interestingly, recent studies have discovered that alterations in glycosylation can also affect the structure and function of immune checkpoint molecules. N-glycosylation of PD-L1 could antagonize the binding of GSK3β thus maintaining its stability and immunosuppressive activity.26 The endoplasmic reticulum-associated N-glycosyltransferase STT3A could catalyze the glycosylation of PD-L1 and thus protect its stability.34 The fucosyltransferase FUT8 could mediate the aberrant glycosylation of B7-H3 and thus stabilize its structure and immunosuppressive function.23 In this study, the GRGs-based risk score was significantly correlated with immune cell infiltration and immune checkpoint gene expression in HCC. Among the eight key GRGs, ST6GALNAC4 showed significant correlation with the expression of multiple immune checkpoint genes, while B7-H3 was significantly associated with the expression of most GRGs. These findings suggested an important regulatory role of glycosylation in the immune microenvironment of HCC, which may provide some insights into the discovery of new targets for immunotherapy augmentation.
ST6GalNAc4 belongs to the GalNAc α2,6-sialyltransferase family which is involved in the catalytic process that regulates the transfer of Neu5Ac residues in the α2-6 linkage to GalNAc residues of O-glycoproteins or glycolipids.35 The ST6GalNAc4 gene was found to be expressed in most cell types including multiple tumor cells, but not in T47D tumor cells and THP monocytes.35 However, only few studies have been conducted to address the role of ST6GALNAC4 in cancer. In thyroid carcinoma, ST6GALNAC4 was found markedly upregulated in tumor tissues, and overexpression of ST6GALNAC4 could enhance the tumorigenic and invasive ability of tumor cells.36 Knockdown of st6galnac4 gene in mouse lung adenocarcinoma cells could inhibit the tumor metastasis.37 In HCC, Zhang et al evaluated the expression of several members of the sialyltransferase family in two types of hepatocellular carcinoma cells, but no expression of ST6GALNAC4 was detected.38 In this study, we found that the expression of ST6ALNAC4 gene was significantly up-regulated in HCC using the transcriptome data and further validated its mRNA and protein expression levels in local HCC samples. We also analyzed the role of ST6ALNAC4 in HCC using in vitro experiments and found that knockdown of ST6ALNAC4 significantly inhibited the proliferation, migration, and invasion ability of hepatoma cells, suggesting the potential of ST6ALNAC4 as a therapeutic target for HCC treatment. In addition, another finding was noticeable regarding ST6GALNAC4. Significant correlations were observed between ST6GALNAC4 and various immune checkpoint genes (PD-1, PD-L1, CTLA4, TIM3, TIGIT, LAG3, and B7-H3) in HCC, which indicated the potential regulatory role of ST6GALNAC4 on the immune microenvironment. In HCC tissues and cells, we found a significant correlation between ST6GALNAC4 and PD-L1 expression, and that knockdown of ST6GALNAC4 decreased the expression of PD-L1. Post-transcriptional modifications are widely involved in the regulation of PD-L1 expression, such as phosphorylation, palmitoylation, ubiquitination and glycosylation.39 Several glycosylation sites have been identified on PD-L1, such as N35, N192, N200 and N219, and these mainly occur as N-glycosylation modifications.40 Glycosylation of PD-L1 can affect not only its binding to PD-1 ligands but also the PD-L1 protein stability, such as the glycosylation modification of N192, N200 and N219 sites.26 Based on this, ST6GALNAC4 may also affect the PD-L1 expression by regulating its glycosylation modification, but the related mechanism remains to be further investigated.
POMT2 is an ER-located member of the protein O-mannosyltransferase family and has been found to be involved in the classical O-mannosylation pathway by regulating O-man biosynthesis in eukaryotes.41 Mutations in the POMT2 gene have also been demonstrated to be strongly associated with severe congenital muscular dystrophy and limb-girdle muscular dystrophy due to the O-glycosylation deficiency of α-dystroglycan.42,43 However, the variation and role of POMT2 in tumor was only found in few studies. Carvalho et al found that enhanced POMT2 expression in gastric cancer cells could reduce the expression of branched N-glycans in E-cadherin and regulated its biological functions.44 Another report found that POMT2 expression was mediated by EZH2 and significantly upregulated in breast cancer.45 In the present study, we first revealed that POMT2 was upregulated in HCC and patients with high POMT2 expression presented worse OS, which indicated significant role of POMT2 in HCC. Notably, we also found that POMT2 was the GRG with the highest correlation coefficient in the risk model with the B7-H3 gene expression in HCC, which further suggested the potential involvement of POMT2 in regulation of immune checkpoints.
Nevertheless, there are some limitations to our study. First, the significance of the GRG-based scoring model in the prognosis of HCC remains to be validated from a large cohort. Secondly, the role and potential mechanisms of ST6GALNAC4 and other critical GRGs in HCC, especially for the regulation of the immune microenvironment, need to be further investigated.
Conclusion
Overall, we characterized the specific expression profiles of GRGs in HCC and screened critical genes for the construction of a novel GRGs-based prognostic risk model. We also revealed the significant correlations between HCC-specific glycosylation gene signature and immune microenvironment and antitumor therapeutic susceptibilities, thus providing new insights into the pathogenesis of HCC and the development of novel therapeutic targets.
Data Sharing Statement
All data used in this study were acquired from The Cancer Genome Atlas (TCGA) and the Gene Expression Omnibus (GEO) portal.
Acknowledgments
The authors are truly grateful to the TCGA and GEO databases for the data sharing policy.
Funding
This work was supported by the Plan on enhancing scientific research in GMU and Guangdong Natural Science Foundation (No. 2015A030313038, 2015A030312013).
Disclosure
The authors report no conflicts of interest in this work.
References
1. Llovet JM, Kelley RK, Villanueva A, et al. Hepatocellular carcinoma. Nat Rev Dis Primers. 2021;7(1):6. doi:10.1038/s41572-020-00240-3
2. Yang JD, Hainaut P, Gores GJ, Amadou A, Plymoth A, Roberts LR. A global view of hepatocellular carcinoma: trends, risk, prevention and management. Nat Rev Gastroenterol Hepatol. 2019;16(10):589–604. doi:10.1038/s41575-019-0186-y
3. Llovet JM, Montal R, Sia D, Finn RS. Molecular therapies and precision medicine for hepatocellular carcinoma. Nat Rev Clin Oncol. 2018;15(10):599–616. doi:10.1038/s41571-018-0073-4
4. Sangro B, Sarobe P, Hervas-Stubbs S, Melero I. Advances in immunotherapy for hepatocellular carcinoma. Nat Rev Gastroenterol Hepatol. 2021;18(8):525–543. doi:10.1038/s41575-021-00438-0
5. Pinter M, Jain RK, Duda DG. The current landscape of immune checkpoint blockade in hepatocellular carcinoma: a review. JAMA Oncol. 2021;7(1):113–123. doi:10.1001/jamaoncol.2020.3381
6. Reily C, Stewart TJ, Renfrow MB, Novak J. Glycosylation in health and disease. Nat Rev Nephrol. 2019;15(6):346–366. doi:10.1038/s41581-019-0129-4
7. Ohtsubo K, Marth JD. Glycosylation in cellular mechanisms of health and disease. CELL. 2006;126(5):855–867. doi:10.1016/j.cell.2006.08.019
8. Moremen KW, Tiemeyer M, Nairn AV. Vertebrate protein glycosylation: diversity, synthesis and function. Nat Rev Mol Cell Biol. 2012;13(7):448–462. doi:10.1038/nrm3383
9. Xu C, Ng DT. Glycosylation-directed quality control of protein folding. Nat Rev Mol Cell Biol. 2015;16(12):742–752. doi:10.1038/nrm4073
10. Smith BAH, Bertozzi CR. The clinical impact of glycobiology: targeting selectins, siglecs and mammalian glycans. Nat Rev Drug Discov. 2021;20(3):217–243. doi:10.1038/s41573-020-00093-1
11. Bard F, Chia J. Cracking the glycome encoder: signaling, trafficking, and glycosylation. Trends Cell Biol. 2016;26(5):379–388. doi:10.1016/j.tcb.2015.12.004
12. Schjoldager KT, Narimatsu Y, Joshi HJ, Clausen H. Global view of human protein glycosylation pathways and functions. Nat Rev Mol Cell Biol. 2020;21(12):729–749. doi:10.1038/s41580-020-00294-x
13. Aebi M. N-linked protein glycosylation in the ER. Biochim Biophys Acta. 2013;1833(11):2430–2437. doi:10.1016/j.bbamcr.2013.04.001
14. Gill DJ, Clausen H, Bard F. Location, location, location: new insights into O-GalNAc protein glycosylation. Trends Cell Biol. 2011;21(3):149–158. doi:10.1016/j.tcb.2010.11.004
15. Thomas D, Rathinavel AK, Radhakrishnan P. Altered glycosylation in cancer: a promising target for biomarkers and therapeutics. Biochim Biophys Acta Rev Cancer. 2021;1875(1):188464. doi:10.1016/j.bbcan.2020.188464
16. Mereiter S, Balmana M, Campos D, Gomes J, Reis CA. Glycosylation in the era of cancer-targeted therapy: where are we heading? Cancer Cell. 2019;36(1):6–16. doi:10.1016/j.ccell.2019.06.006
17. Pinho SS, Reis CA. Glycosylation in cancer: mechanisms and clinical implications. Nat Rev Cancer. 2015;15(9):540–555. doi:10.1038/nrc3982
18. Oliveira-Ferrer L, Legler K, Milde-Langosch K. Role of protein glycosylation in cancer metastasis. Semin Cancer Biol. 2017;44:141–152. doi:10.1016/j.semcancer.2017.03.002
19. RodrIguez E, Schetters STT, van Kooyk Y. The tumour glyco-code as a novel immune checkpoint for immunotherapy. Nat Rev Immunol. 2018;18(3):204–211. doi:10.1038/nri.2018.3
20. Laubli H, Borsig L. Altered cell adhesion and glycosylation promote cancer immune suppression and metastasis. Front Immunol. 2019;10:2120. doi:10.3389/fimmu.2019.02120
21. Rodrigues JG, Balmana M, Macedo JA, et al. Glycosylation in cancer: selected roles in tumour progression, immune modulation and metastasis. Cell Immunol. 2018;333:46–57. doi:10.1016/j.cellimm.2018.03.007
22. Pereira MS, Alves I, Vicente M, et al. Glycans as key checkpoints of T cell activity and function. Front Immunol. 2018;9:2754. doi:10.3389/fimmu.2018.02754
23. Huang Y, Zhang HL, Li ZL, et al. FUT8-mediated aberrant N-glycosylation of B7H3 suppresses the immune response in triple-negative breast cancer. Nat Commun. 2021;12(1):2672. doi:10.1038/s41467-021-22618-x
24. Song X, Zhou Z, Li H, et al. Pharmacologic suppression of B7-H4 glycosylation restores antitumor immunity in immune-cold breast cancers. Cancer Discov. 2020;10(12):1872–1893. doi:10.1158/2159-8290.CD-20-0402
25. Liu K, Tan S, Jin W, et al. N-glycosylation of PD-1 promotes binding of camrelizumab. EMBO Rep. 2020;21(12):e51444. doi:10.15252/embr.202051444
26. Li CW, Lim SO, Xia W, et al. Glycosylation and stabilization of programmed death ligand-1 suppresses T-cell activity. Nat Commun. 2016;7:12632. doi:10.1038/ncomms12632
27. Dai Z, Liu YK, Cui JF, et al. Identification and analysis of altered alpha1,6-fucosylated glycoproteins associated with hepatocellular carcinoma metastasis. Proteomics. 2006;6(21):5857–5867. doi:10.1002/pmic.200500707
28. Kudo T, Nakagawa H, Takahashi M, et al. N-glycan alterations are associated with drug resistance in human hepatocellular carcinoma. Mol Cancer. 2007;6:32. doi:10.1186/1476-4598-6-32
29. Verhelst X, Geerts A, Callewaert N, Van Vlierberghe H. The potential of glycomics as prognostic biomarkers in liver disease and liver transplantation. Acta Gastroenterol Belg. 2019;82(2):309–313.
30. de Oliveira RM, Ornelas Ricart CA, Araujo Martins AM. Use of mass spectrometry to screen glycan early markers in hepatocellular carcinoma. Front Oncol. 2017;7:328. doi:10.3389/fonc.2017.00328
31. Watson ME, Diepeveen LA, Stubbs KA, Yeoh GC. Glycosylation-related diagnostic and therapeutic drug target markers in hepatocellular carcinoma. J Gastrointestin Liver Dis. 2015;24(3):349–357. doi:10.15403/jgld.2014.1121.243.mew
32. Mehta A, Herrera H, Block T. Glycosylation and liver cancer. Adv Cancer Res. 2015;126:257–279. doi:10.1016/bs.acr.2014.11.005
33. Mendez-Huergo SP, Blidner AG, Rabinovich GA. Galectins: emerging regulatory checkpoints linking tumor immunity and angiogenesis. Curr Opin Immunol. 2017;45:8–15. doi:10.1016/j.coi.2016.12.003
34. Chan LC, Li CW, Xia W, et al. IL-6/JAK1 pathway drives PD-L1 Y112 phosphorylation to promote cancer immune evasion. J Clin Invest. 2019;129(8):3324–3338. doi:10.1172/JCI126022
35. Harduin-Lepers A, Stokes DC, Steelant WF, et al. Cloning, expression and gene organization of a human Neu5Ac alpha 2-3Gal beta 1-3GalNAc alpha 2,6-sialyltransferase: hST6GalNAcIV. Biochem J. 2000;352(Pt 1):37–48. doi:10.1042/bj3520037
36. Miao X, Jia L, Zhou H, et al. miR-4299 mediates the invasive properties and tumorigenicity of human follicular thyroid carcinoma by targeting ST6GALNAC4. IUBMB Life. 2016;68(2):136–144. doi:10.1002/iub.1467
37. Reticker-Flynn NE, Bhatia SN. Aberrant glycosylation promotes lung cancer metastasis through adhesion to galectins in the metastatic niche. Cancer Discov. 2015;5(2):168–181. doi:10.1158/2159-8290.CD-13-0760
38. Zhang Y, Zhao W, Zhao Y, He Q. Expression of ST3Gal, ST6Gal, ST6GalNAc and ST8Sia in human hepatic carcinoma cell lines, HepG-2 and SMMC-7721 and normal hepatic cell line, L-02. Glycoconj J. 2015;32(1–2):39–47. doi:10.1007/s10719-014-9569-z
39. Yamaguchi H, Hsu JM, Yang WH, Hung MC. Mechanisms regulating PD-L1 expression in cancers and associated opportunities for novel small-molecule therapeutics. Nat Rev Clin Oncol. 2022;19(5):287–305. doi:10.1038/s41571-022-00601-9
40. Zhou S, Zhu J, Xu J, et al. Anti-tumour potential of PD-L1/PD-1 post-translational modifications. Immunology. 2022;167(4):471–481. doi:10.1111/imm.13573
41. Larsen ISB, Narimatsu Y, Clausen H, Joshi HJ, Halim A. Multiple distinct O-Mannosylation pathways in eukaryotes. Curr Opin Struct Biol. 2019;56:171–178. doi:10.1016/j.sbi.2019.03.003
42. Ostergaard ST, Johnson K, Stojkovic T, et al. Limb girdle muscular dystrophy due to mutations in POMT2. J Neurol Neurosurg Psychiatry. 2018;89(5):506–512. doi:10.1136/jnnp-2017-317018
43. Johnson K, Bertoli M, Phillips L, et al. Detection of variants in dystroglycanopathy-associated genes through the application of targeted whole-exome sequencing analysis to a large cohort of patients with unexplained limb-girdle muscle weakness. Skelet Muscle. 2018;8(1):23. doi:10.1186/s13395-018-0170-1
44. Carvalho S, Oliveira T, Bartels MF, et al. O-mannosylation and N-glycosylation: two coordinated mechanisms regulating the tumour suppressor functions of E-cadherin in cancer. Oncotarget. 2016;7(40):65231–65246. doi:10.18632/oncotarget.11245
45. Kumari K, Das B, Adhya AK, Rath AK, Mishra SK. Genome-wide expression analysis reveals six contravened targets of EZH2 associated with breast cancer patient survival. Sci Rep. 2019;9(1):1974. doi:10.1038/s41598-019-39122-4
 © 2023 The Author(s). This work is published and licensed by Dove Medical Press Limited. The full terms of this license are available at https://www.dovepress.com/terms.php and incorporate the Creative Commons Attribution - Non Commercial (unported, v3.0) License.
By accessing the work you hereby accept the Terms. Non-commercial uses of the work are permitted without any further permission from Dove Medical Press Limited, provided the work is properly attributed. For permission for commercial use of this work, please see paragraphs 4.2 and 5 of our Terms.
© 2023 The Author(s). This work is published and licensed by Dove Medical Press Limited. The full terms of this license are available at https://www.dovepress.com/terms.php and incorporate the Creative Commons Attribution - Non Commercial (unported, v3.0) License.
By accessing the work you hereby accept the Terms. Non-commercial uses of the work are permitted without any further permission from Dove Medical Press Limited, provided the work is properly attributed. For permission for commercial use of this work, please see paragraphs 4.2 and 5 of our Terms.