")
Back to Journals » OncoTargets and Therapy » Volume 13
Identification and Development of Long Non‐coding RNA Associated Regulatory Network in Pancreatic Adenocarcinoma
Authors Zhu W, Gao W , Deng Y, Yu X, Zhu H
Received 27 July 2020
Accepted for publication 30 September 2020
Published 23 November 2020 Volume 2020:13 Pages 12083—12096
DOI https://doi.org/10.2147/OTT.S265036
Checked for plagiarism Yes
Review by Single anonymous peer review
Peer reviewer comments 2
Editor who approved publication: Prof. Dr. Takuya Aoki
Wenjuan Zhu,1,* Wenzhe Gao,2,* Yanyao Deng,3 Xiao Yu,2 Hongwei Zhu2
1Division of Nephrology, The University of Hong Kong-Shenzhen Hospital, Shenzhen, Guangdong, People’s Republic of China; 2Department of Hepatopancreatobiliary Surgery, The Third Xiangya Hospital, Central South University, Changsha, Hunan, People’s Republic of China; 3Department of Neurology, The First Hospital of Changsha, Changsha, Hunan, People’s Republic of China
*These authors contributed equally to this work
Correspondence: Xiao Yu; Hongwei Zhu
Department of Hepatopancreatobiliary Surgery, The Third Xiangya Hospital, Central South University, Changsha, Hunan, People’s Republic of China
Email [email protected]; [email protected]
Background and Aims: Pancreatic adenocarcinoma (PAAD) is the most lethal cancer type around the world. With the in-depth exploration of the function of long non‐coding RNAs (lncRNAs), the competing endogenous RNA (ceRNA) mechanism has shown its potential to partially reveal the pathogenesis of PAAD. This study aimed to construct a lncRNA‐associated ceRNA network and explore ceRNA regulatory axes with experimental and prognostic value in PAAD.
Methods: First, we applied differential expression analysis in the TCGA_PAAD dataset. Then, interaction analysis and survival analysis in multiple RNA interaction databases were conducted to construct a ceRNA network. Finally, a potential regulatory axis was validated using clinical samples and cell lines by quantitative realtime PCR (qRT‐PCR).
Results: A ceRNA network comprising 13 lncRNAs, 96 miRNAs, and 30 mRNAs was successfully constructed. Survival analysis further narrowed this network to five lncRNAs, three miRNAs, and seven mRNAs, which were significantly associated with patients’ overall survival. A potential regulatory axis CASC8-miR-129-5p-TOB1 was further experimentally validated. The expression of these genes was associated with clinicopathological factors and their expression trend was consistent with ceRNA mechanism. Specifically, knockdown of lncRNA-CASC8 led to the overexpression of miR-129-5p and down-regulation of TOB1, while overexpression of CASC8 showed opposite effects.
Conclusion: This novel ceRNA regulatory network could provide new insight into the pathogenesis of PAAD. The new regulatory axis CASC8-miR-129-5p-TOB1 might serve as a potential therapeutic target for patients.
Keywords: pancreatic adenocarcinoma, competing endogenous RNA, long non‐coding RNA, The Cancer Genome Atlas, bioinformatics analysis
Introduction
The incidence of pancreatic cancer (PC) has been increasing rapidly over the past 10 years. What is more serious is its high mortality rate. The 5-year survival rate of PC was only 9% for patients diagnosed from 2009 to 2015 in America, which was the lowest among all malignant diseases.1 It was estimated that there would be 57,600 new PC patients and 47,050 deaths caused by PC in the US in 2020. PC was also the ninth most common cancer in China with the highest mortality, causing 22,919 morbidities and 21,093 deaths in 2015.2 It can be predicted that PC will become the second leading cause of cancer-related death in the future. Pancreatic adenocarcinoma (PAAD) represents more than 95% of all PCs. The clinical diagnosis and treatment for PAAD have been extremely difficult. Fortunately, progress has been made in molecular subtyping of PAAD to provide more clinical evidence and diagnostic clues. In 2016, Bailey et al3 first applied integrated genomic analysis in PAAD to identify 32 recurrently mutated genes aggregating into 10 pathways. Their first try to define four molecular subtypes for PAAD has been confirmed successful and pioneering. In 2019, Collisson et al4 further reviewed the molecular taxonomy of PAAD. They summarized the aberration characteristics of PAAD in the whole genomic level, highlighting the four most commonly mutated genes (KRAS, TP53 CDNK2A, and SMAD4). Furthermore, the concept of putative actionable genome was first proposed by them, including 13 high-frequency mutations that were common and showed value of targeted therapies. However, little has been learned about the functional consequences of these genomic alterations so far. Therefore, how to translate these genetic alterations into results that might explain the pathogenesis of PAAD and how to obtain clinical utility using the omics data, are currently the most important challenges for researchers.
Long non-coding RNAs (lncRNAs) represent a type of non-coding RNAs with a length of more than 200 nucleotides. They are very abundant in mammals. In total, 4–9% of genome sequences can produce lncRNA transcripts.5 Explosive research in recent years indicated that lncRNAs played important roles in carcinogenesis via regulating gene expression in diverse ways,6 of which the most widely studied one was a competitive endogenous RNA (ceRNA) mechanism. By sharing miRNA response elements (MREs), lncRNAs and mRNAs compete against each other, combining with miRNAs, this cytoplasmic endogenous competition could release mRNAs from the degradation of miRNAs and regulate the expression of various mRNAs, significantly affecting the occurrence and development of many diseases including cancers. Moreover, a variety of innovative therapies targeting lncRNAs was proven to have potential tumor therapeutic effects, like transcriptional modification through CRISPR/Cas9 or post-transcriptional silencing through siRNAs.7 Thus, it is very promising that lncRNAs can reveal the detailed mechanisms of tumor genetic regulation at a deeper level.
Fast improvements of lncRNA-related experimental methods and high throughput sequencing technology promoted scientists to elucidate a complete map of human lncRNAs in transcriptome and to explore the function of lncRNAs at the omics level. Many studies have attempted to construct ceRNA regulatory networks by combining omics data from public databases with experimental validation. For example, Liang et al8 constructed a lncRNA-mediated ceRNA network in mesenchymal ovarian cancer (OvCa) by analyzing RNA-seq data in The Cancer Genome Atlas (TCGA) project and detected a lncRNA-PTAR-miR-101-3p-ZEB1 regulatory axis leading to the tumorigenicity and metastasis of OvCa. Similarly, Ye et al9 identified lncRNA-H19 as an oncogene and triggered the miR-193b-MAPK1 axis to promote cell aggressiveness in hepatocellular carcinoma (HCC). With the help of omics data, this kind of research could be more credible than those based on evidence of previous literatures only. In the past few years, multiple ceRNA networks have been established in diverse tumors including cholangiocellular carcinoma,10 gastric cancer,11,12 bladder cancer,13,14 colorectal cancer,15 etc.
In this study, we first analyzed the dysregulated lncRNAs, mRNAs, and miRNAs between pancreatic adenocarcinoma (PAAD) and normal pancreatic tissues utilizing RNA-seq data from the TCGA project. A lncRNA-miRNA-mRNA regulatory network was then constructed by correlation analysis and bioinformatic prediction. Axes with prognostic indicating values for PAAD patients were further extracted through survival analysis. One of the prognostic axes was further confirmed by Quantitative real-time PCR and other cellular functional experiments.
Materials and Methods
Data Retrieval for TCGA_PAAD Cohort
Level-3 RNA-seq data, miRNA-seq data combined with corresponding clinical information of PAAD patients were downloaded using GDC RNA Tools. All data was composed of the following three parts: 1) Gene expression profile data: raw read count derived from RNA-seq was treated using Ht-seq, which was named as gene ID Ensembl (v 90). Gene types included protein_coding, long_non_coding, pseudogene, TEC (To be Experimentally Confirmed), ncRNA, IG (Immunoglobulin gene), etc. After the intersection, a total of 181 samples were obtained, including 177 primary tumors and four normal samples. The expression profilings from TCGA were all performed by Illumina HiSeq_RNASeq and Illumina HiSeq_miRNASeq platforms. mRNAs and lncRNAs were annotated based on “Ensembl 90” annotation, and further translated to gene symbols using R package “org.Hs.eg.db”. RNAs without annotation in this package were excluded. This study followed the TCGA publication guidelines, so there was no need for approval from the local Ethics Committee.
Screening Differentially Expressed lncRNAs and mRNAs
RNA-seq data from the TCGA_PAAD cohort was processed for the next differential expression analysis. Rows of counts per million (CPM) data with NA or a mean count of ≤1 were deleted. The “DESeq2” package in R software was then applied to standardized CPM data to the sample mean and further obtain the differentially expressed RNAs. Fold changes of expression levels |log2FC| >1 and the adjusted P-value<0.01 were considered as a statistically significant difference.
Functional Enrichment Analysis
To explore potential downstream biological processes (BP) and signaling pathways associated with the differentially expressed mRNAs (DEmRNAs), Kyoto Encyclopedia of Genes and Genomes (KEGG) pathway enrichment analysis and gene ontology (GO) enrichment analysis were conducted based on the R/Bioconductor packages “clusterProfilier” and “DOSE”. The biological processes and pathways with a P-value<0.05 were considered as statistically significant.
Development of a ceRNA Network
Three criteria were used to determine the competing endogenous interactions between lncRNA-mRNA pairs: 1) Expression of lncRNA and mRNA must be positively correlated; 2) The lncRNA and mRNA must share binding sites of a significant number of differentially expressed miRNAs (DEmiRNAs); 3) The common shared miRNAs should play similar roles in regulating the expression of lncRNA and mRNA. Based on these criteria, we first applied Pearson correlation analysis to measure the strength of a linear association between DElncRNAs and DEmRNAs, and all the positively correlated pairs (P>0.05) were extracted. Then, the databases starBase v2.0 (Li et al 2014) was used to verify the miRNA-protein coding gene regulating correlation. Meanwhile, the databases miRcode was utilized to confirm the regulatory correlation between miRNAs and lncRNAs. Finally, a lncRNA-miRNA-mRNA network was established based on the above results. The overall research protocol was summarized in the workflow chart shown in Figure 1.
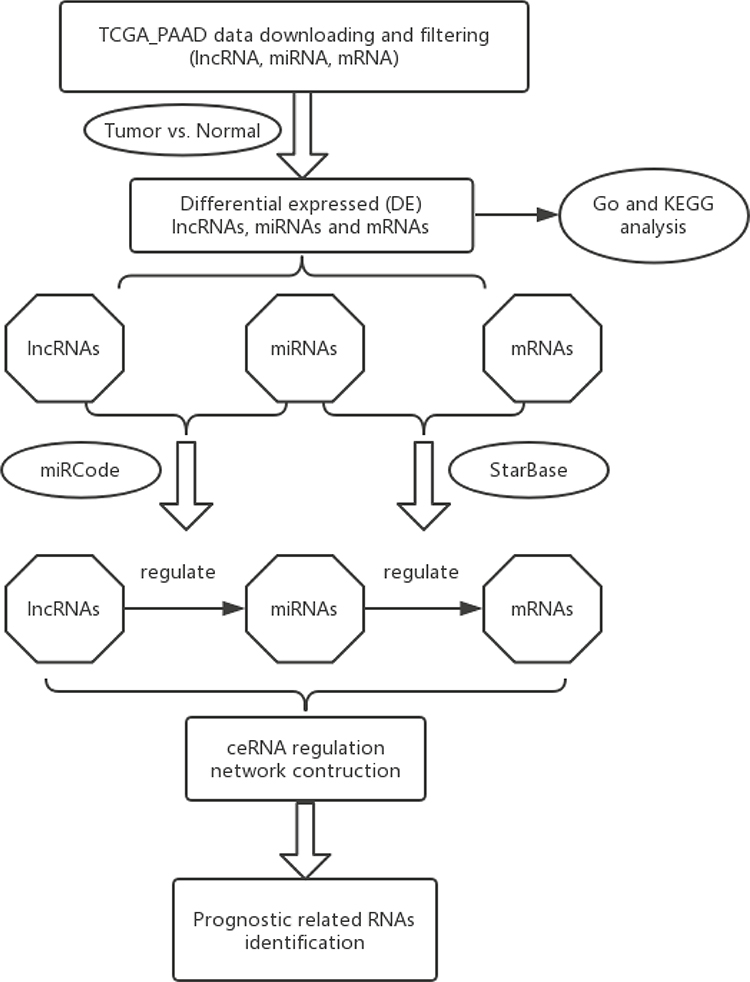 |
Figure 1 Flow chart of comprehensive bioinformatics analysis in the construction of competing endogenous RNA (ceRNA) regulatory network. |
Clinical Samples
A total of 20 pancreatic cancer tissues and adjacent normal tissues were collected from the Department of Hepatopancreatobiliary Surgery, The Third Xiangya Hospital. All tissues were frozen immediately in liquid nitrogen after surgical excision and stored at −80°C. Clinicopathological information was retrieved from the hospital database. Written informed consent was obtained from all patients and the study was approved by the ethics committee of the Third Xiangya Hospital (approval number: 2020-S349).
Cell Culture and Transfection
Human pancreatic ductal cell (HPDE) and pancreatic cancer cell lines (Panc1, CFPAC-1, CAPAN2, SW1990, and BXPC3) were obtained from American Type Culture Collection (ATCC). All cells were cultured in Dulbecco’s modified Eagle’s medium (DMEM) supplemented with 10% fetal bovine serum (FBS) in 5% CO2 atmosphere at 37°C. pcDNA3.1‐CASC8 and si‐CASC8 vectors were synthesized by Genechem (Shanghai, China) and then were transfected into PC cells using Lipofectamine 3000 (Invitrogen).
Quantitative Real‐time PCR
The expression levels of the key genes of the ceRNA regulatory axis were measured by quantitative real‐time PCR (qRT‐PCR). Total RNAs isolated from PC tissues and cell lines by using TRIzol reagent (Invitrogen) and reverse transcription was performed with a Prime Script RT reagent kit (Takara Biotechnology, China). qRT‐PCR reactions were carried out on Applied Biosystems 7500 Real‐time PCR Systems (Thermo Fisher Scientific). Small RNA RNU6 (U6) was used as endogenous control to normalize miRNA, while GAPDH was used for lncRNA and mRNA expression. The relative expression level of the target RNA was calculated by 2−ΔΔCt. In our study, all involved primers were produced by Sangon Biotech (Shanghai, China) and their sequences were as below: CASC8, forward: 5′- GTTCAGTTTCTGCCTGCCTC-3′ and reverse: 5′-TTTATTTGTGCAACAATTC-3′; TOB1, forward: 5′- ATGCCCATAAGTGACCCAGC-3′ and reverse: 5′-GTAGAGCCGAACTTGGTGGC-3′; GAPDH, forward: 5′-GTCTCCTCTGACTTCAACAGCG-3′ and reverse: 5′-ACCACCCTGTTGCTGTAGCCAA-3′; miR-129-5p forward: 5ʹ-CGCTTTTTGCGGTCTGG-3ʹ and reverse: AGTGCAGGGTCCGAGGTATT; U6 snRNA forward: 5ʹ-CTCGCTTCGGCAGCACA-3ʹ, and for the reverse: 5ʹ-AACGCTTCACGAATTTGCGT-3ʹ. MiR-129-5p reverse primer was obtained with the help of the miRcute Plus miRNA qPCR Kit (SYBR Green).
Univariate Survival Analysis and Other Statistical Analysis
Survival analysis for all RNAs in the ceRNA network was performed using “survival” package in R software and Graphpad 8.0 to produce more standard pictures. Kaplan-Meier (KM) analysis divided patients into high-expression and low-expression groups by the median expression level of a certain RNA, then hazard ratio, 95% confidence intervals, and test significance of each gene on overall survival (OS) were reported. A P-value<0.05 was considered statistically significant.
Results
Gene Annotation and Differentially Expressed RNAs in PAAD
A total of 177 samples of PAAD were included from the TCGA database, along with four cases of normal pancreatic tissues for the subsequent differential expression analysis. Results showed that there were 24 differentially expressed (DE) lncRNAs, 31 DEmiRNAs, and 359 DEmRNAs identified in the TCGA_PAAD cohort. Figure 2A exhibited the volcano plot of all differentially expressed genes (DEGs), of which 238 were over-expressed, including 14 lncRNAs, 12 miRNAs, and 212 mRNAs; in the meanwhile, 10 lncRNAs, 19 miRNAs, and 147 mRNAs were defined as down-regulated RNAs in PAAD samples compared with normal tissues.
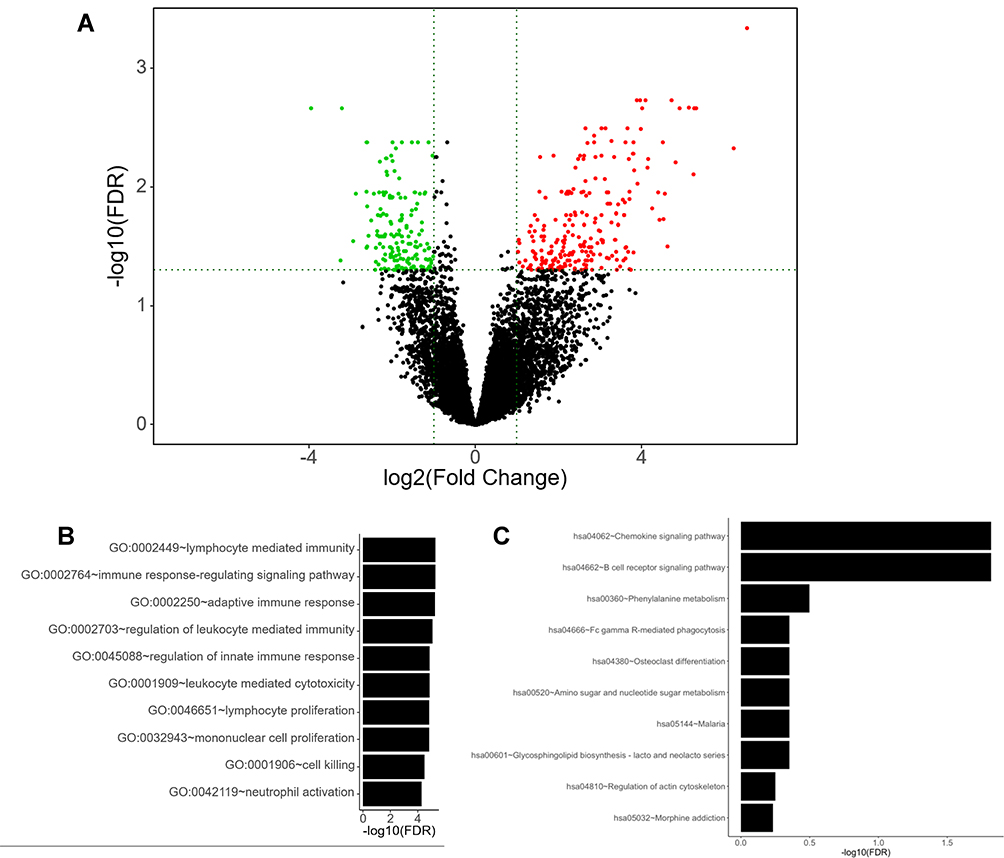 |
Figure 2 Identification of significantly differentially expressed genes (DEGs) in PAAD. (A) Volcano plot showing the DEGs identified from TCGA. The green dots and red dots represent the downregulated and upregulated genes in PAAD samples, respectively. |log2FC| >1 and adj. P-value<0.01 were set as the cut-off criteria. (B–C) Biological function (GO, BP) and pathway (KEGG) analysis for all differentially expressed mRNAs. (B) Top 10 significant functional annotations in GO, BP; (C) Top 10 significant functional annotations in KEGG pathways. |
Gene Ontology and KEGG Pathway Enrichment for Differentially Expressed Genes
Then, we detected which biological processes and signaling pathways the 359 differentially expressed mRNAs mainly enriched. A total of 273 Go terms for Biological Process (BP) were identified as significant terms after GO analysis. The top ten enriched terms for BP are shown in Figure 2B. As indicated, all these items were related to immune system, including innate and adoptive immune pathways instead of the common cancer-related processes. These results surprised us a little. They indicated that a combination of ceRNA mechanism and tumor immune abnormality might bring significant progress to the diagnosis and treatment of PAAD.
Additional results from KEGG pathway analysis also provided further evidence that tumor immune dysfunction might be particularly important in the pathogenesis of ceRNA-dependent PAAD. As shown in Figure 2C, “Chemokine signaling pathway” and “B cell receptor signaling pathway” ranked the top two among the 10 most significantly enriched pathways, both of which were the main regulatory pathways in tumor immunology.
Development of ceRNA Network in PAAD Patients
With the above results extracted from RNA-seq data, our next goal was to establish a lncRNA-miRNA-mRNA ceRNA regulatory network to elucidate the specific role of ceRNA mechanism in the pathogenesis of PAAD. Considering the content of ceRNA theory, we adopted Pearson correlation analysis to detect the expression correlation between all DElncRNAs and DEmRNAs. Results showed that there were 13 lncRNAs and 30 mRNAs, which consisted of 45 relationship pairs with significantly positive correlation (Table 1, Figure 3A-I, and Supplementary Figure S1A-L). Then, miRNA-mRNA and miRNA-lncRNA interactions were validated followed instructions mentioned above and 96 miRNAs were verified as targets for all lncRNA-mRNA pairs. Finally, a ceRNA regulatory network of PAAD comprising 568 edges among 13 DElncRNAs, 96 DEmiRNAs, and 30 DEmRNAs was successfully constructed (Figure 4).
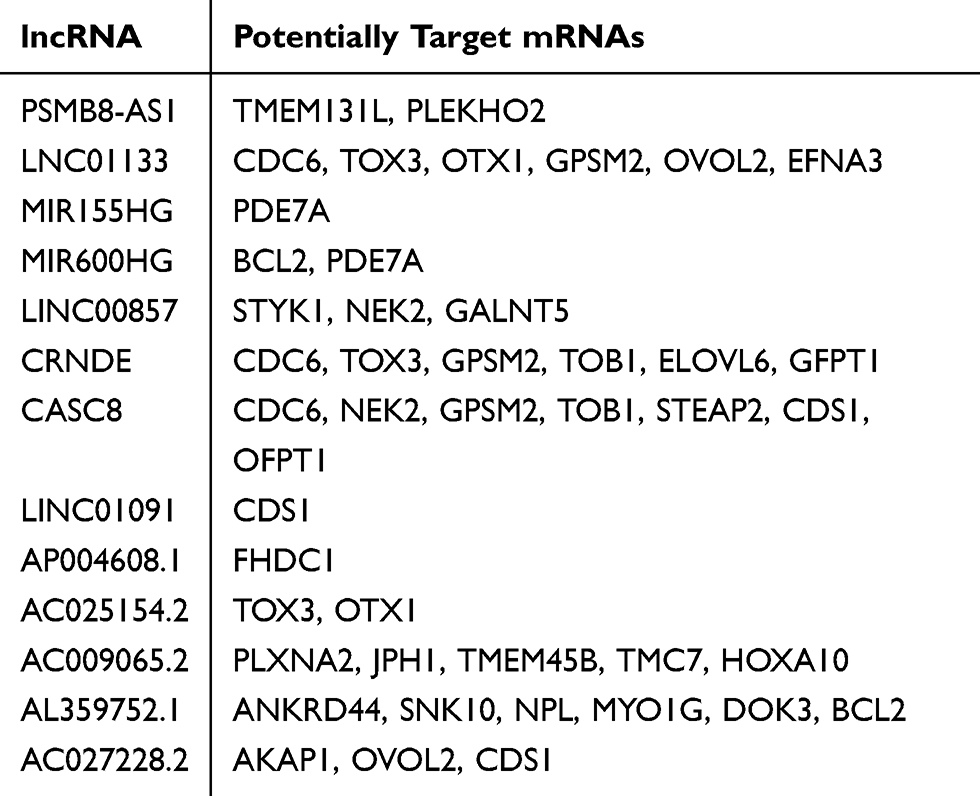 |
Table 1 Differentially Expressed lncRNAs and Their Potential Target mRNAs |
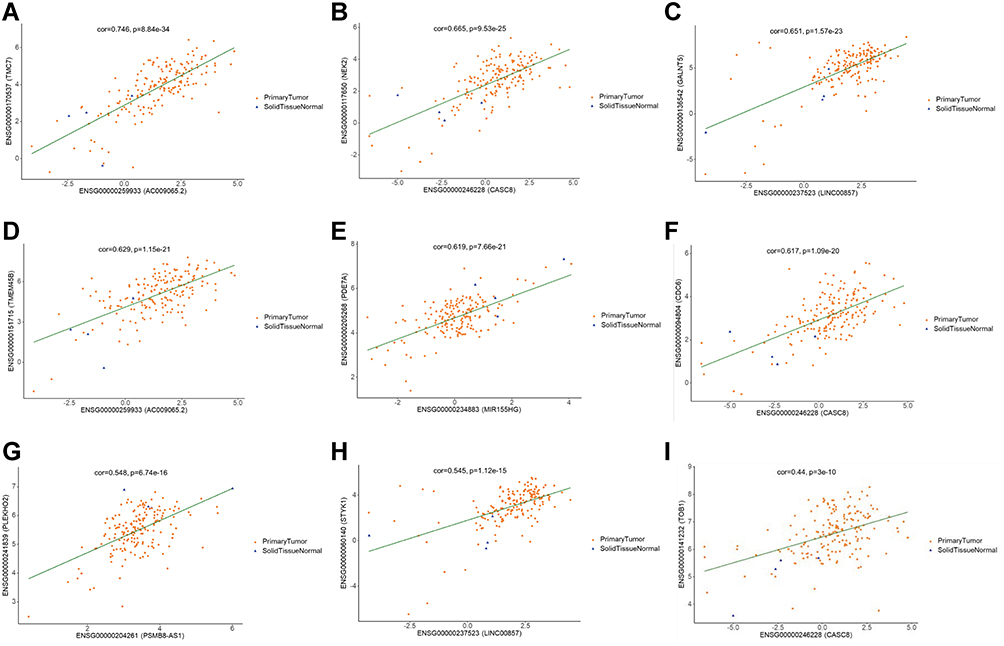 |
Figure 3 Pearson’s correlation analysis on the correlation between the expression level of lncRNAs and mRNAs. (A–I) showed lncRNA-mRNA pairs with relatively higher correlation coefficient. (A) Correlation between lnc-AC009065.2 and TMC7; (B) Correlation between lnc-CASC8 and NEK2; (C) Correlation between lnc-00857 and GALNT5; (D) Correlation between lnc-AC009065.2 and TMEM45B; (E) Correlation between lnc-MIR155HG and PDE7A; (F) Correlation between lnc-CASC8 and CDC6; (G) Correlation between lnc-PSMB8-AS1 and PLEKHO2; (H) Correlation between lnc-00857 and STYK1; (I) Correlation between lnc-CASC8 and TOB1. Partial of other lncRNA-mRNA correlation pairs are shown in Supplementary Figure S1. The “cor” indicated correlation coefficient in this figure. |
 |
Figure 4 The overall lncRNA‐miRNA‐mRNA ceRNA network in PAAD. Blue nodes represent lncRNAs, yellow nodes are miRNAs, and red nodes are mRNAs. Grey edges indicate interactions between RNAs and the size of every node represents the relative number of connected edges. Black borders surrounding the nodes indicates RNAs with prognostic value. |
Further Screening Based on Prognostic and Clinicopathological Characteristics
To further explore clinically significant regulatory axes, Kaplan‐Meier survival analysis was applied to investigate the correlation between expression levels of all included RNAs in the ceRNA network and overall survival (OS) of patients. The results showed that five lncRNAs (CASC8, LINC01133, MIR600HG, AP004608.1, and LINC00857), three miRNAs (hsa-miR-129-5p, hsa-miR-27a-3p, and hsa-miR-199a-5p), and seven mRNAs (TOB1, NEK2, CDC6, GPSM2, OTX1, STYK1, and GALNT5) were significantly correlated with overall survival (P<0.05) (Figures 4 and 5–O).
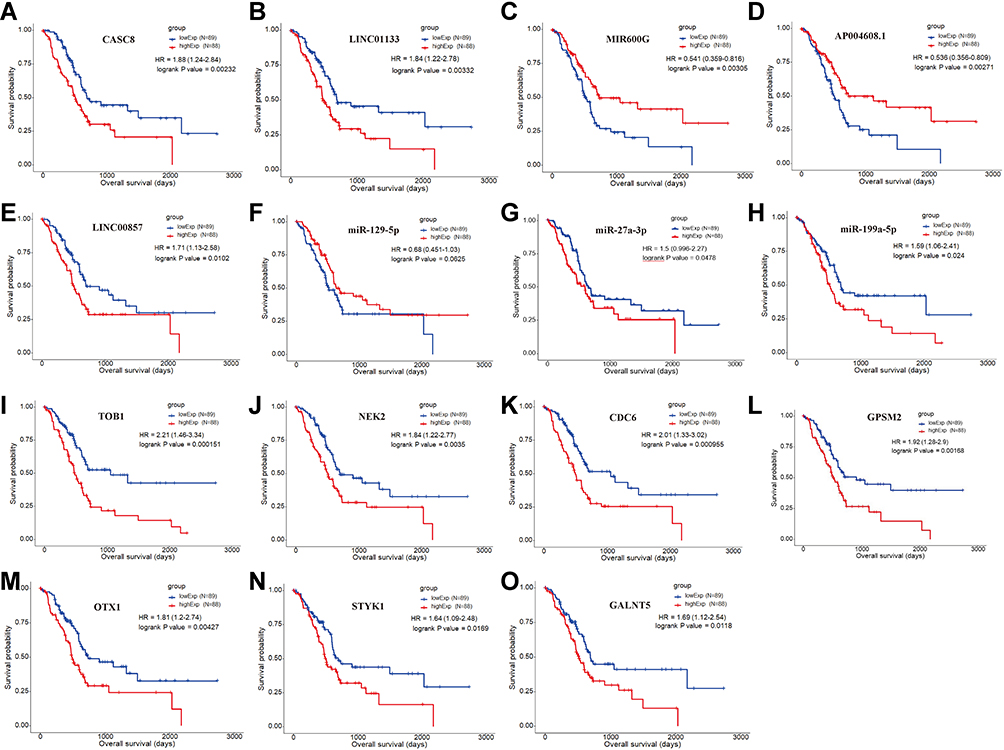 |
Figure 5 Kaplan‐Meier curve of RNAs that were significantly associated with overall survival (OS) of PAAD patients. (A–E) Five lncRNAs that were associated with patients’ OS, including (A) CASC8, (B) LINC01133, (C) MIR600G, (D) AP004608.1, and (E) LNC00857. (F–H) Three miRNAs that were associated with patients’ OS, including (F) miR-129-5p, (G) miR-27a-3p, and (H) miR-199a-5p. (I–O) Seven mRNAs that were associated with patients’ OS, including (I) TOB1, (J) NEK2, (K) CDC6, (L) GPSM2, (M) OTX1, (N) STYK1, and (O) GALNT5. |
Acquisition of Valuable Regulatory Axes and Confirmation of miRNA Recognition Elements
Combining ceRNA network and survival analysis, we built a new smaller regulatory network that was included in the total ceRNA network and possessed prognostic value at the same time (Figure 6A). Finally, six axes were identified as candidates for experimental verification. In order to further elucidate the possibility of its regulatory effect through the ceRNA mechanism, miRNA-recognition elements (MREs) of these six axes and their location in human genome (UCSC, GRCh37/hg19 assembly) are listed in Figure 6B-G.
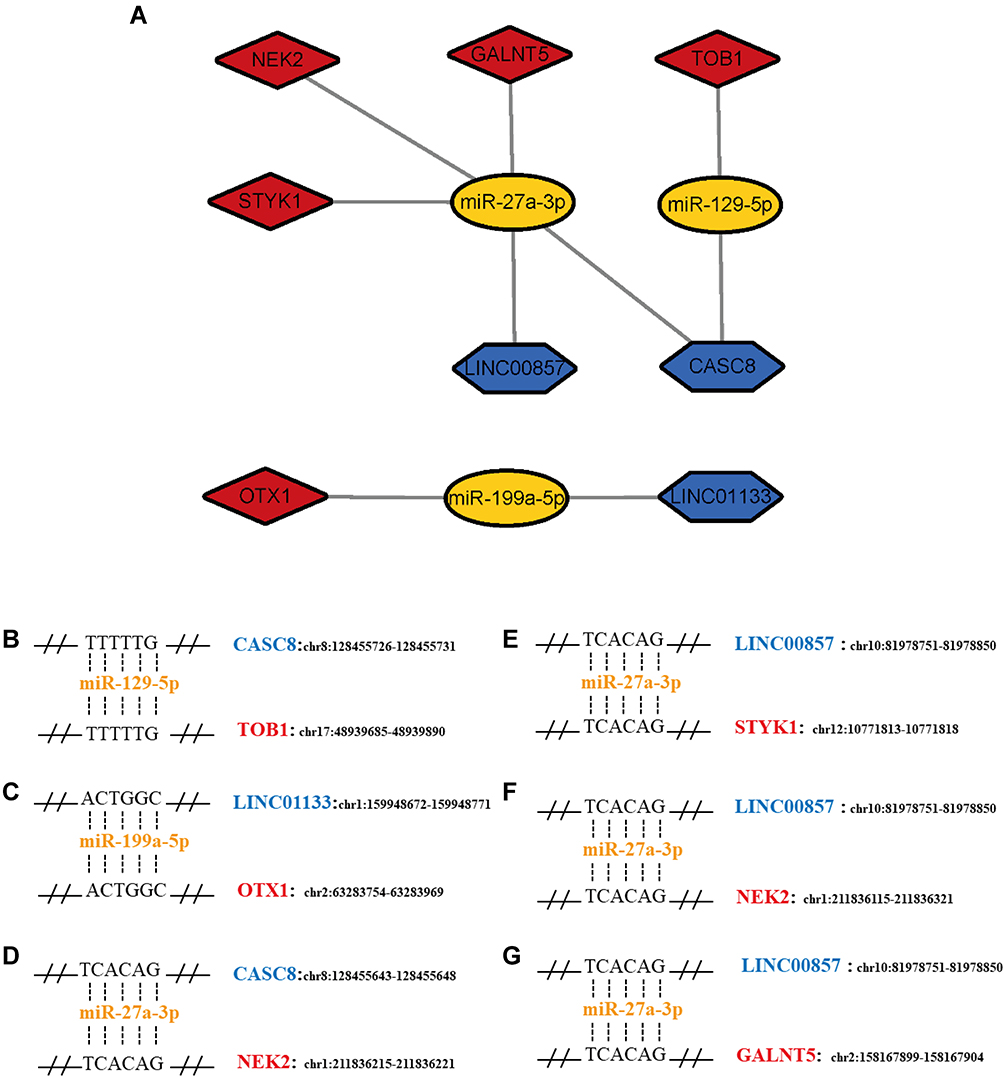 |
Figure 6 (A) The sub‐network of RNAs related to patients’ prognosis. (B–G) miRNA recognition elements (MREs) in lncRNAs and mRNAs related to prognosis and their position in human genome. Blue means lncRNAs, while yellow and red indicate miRNAs and mRNAs, respectively. |
Experimental Validation of CASC8-miR-129-5p-TOB1 Axis
We chose CASC8-miR-129-5p-TOB1 as the object of further experimental verification. It should be noted that the other five axes still had the value of experimental research. First, we utilized clinical data from the TCGA_PAAD cohort to explore the relationship between the expression of these RNAs and patient’s clinicopathological performance. Results showed that patients with TOB1 up-regulation had a significantly increased frequency of lymph node metastasis (P=0.049). Correspondingly, patients with low expression of miR-129-5p tended to have higher pathological stage (P=0.027) (Table 2). These results showed that experimental research on this axis possessed potential clinical significance.
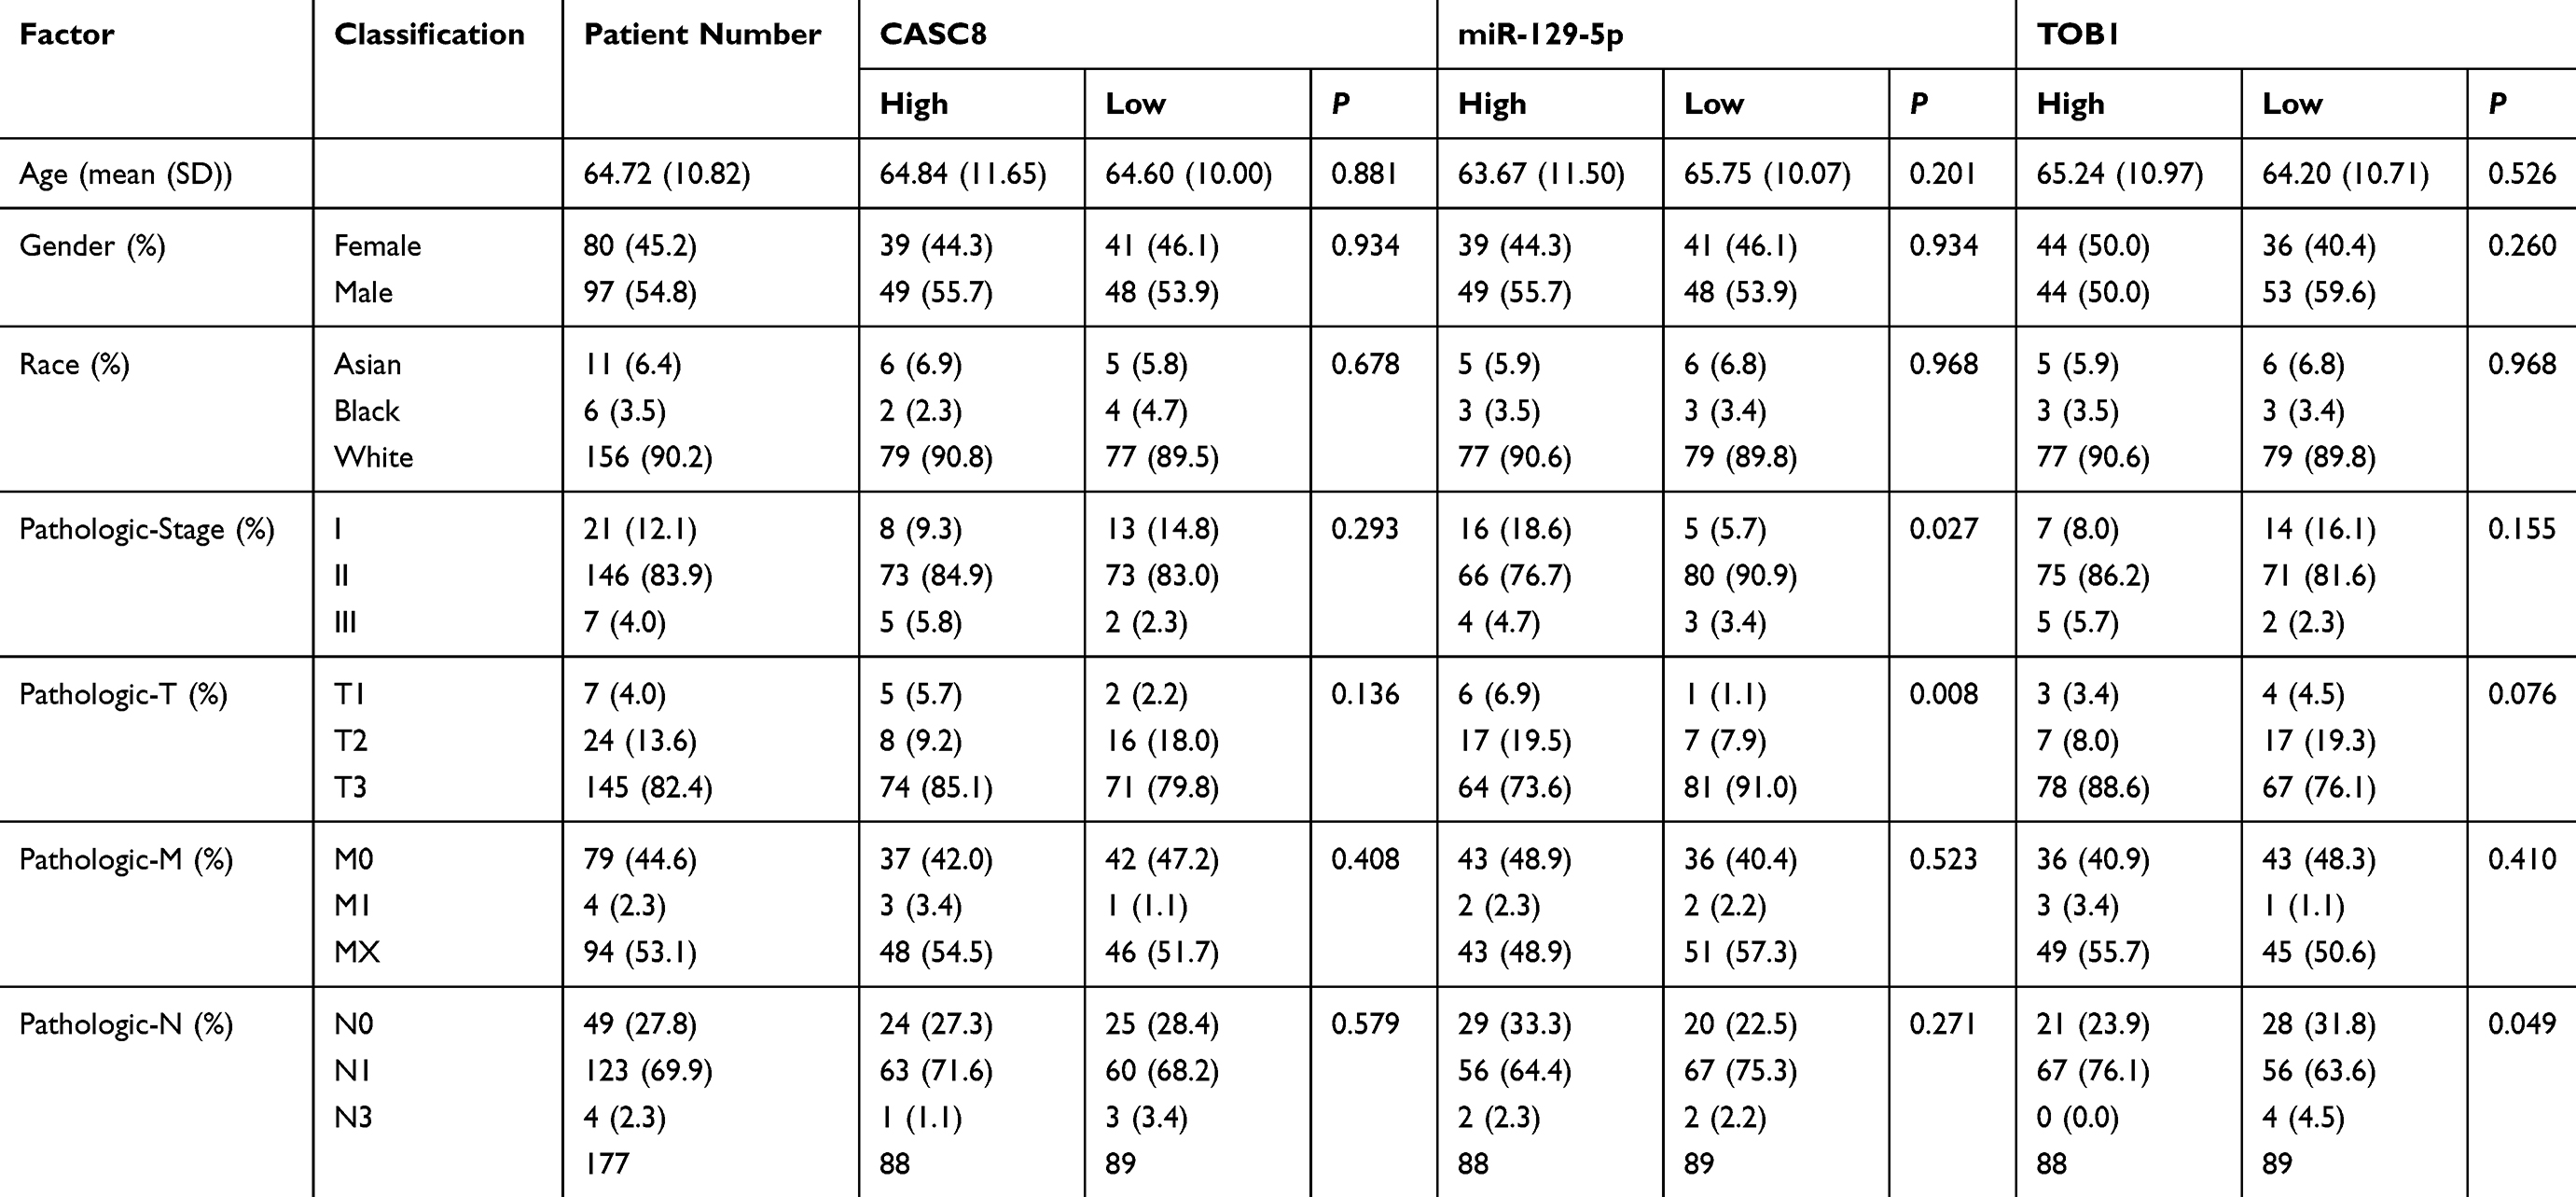 |
Table 2 Correlation Between CASC8, miR‐129-5p, and TOB1 mRNA Expression Levels and the Clinicopathological Factors of 177 PAAD Patients in the TCGA_PAAD Cohort |
The expression levels of CASC8, miR‐129a-5p, and TOB1 were then investigated in 16 paired PAAD and adjacent non‐tumor tissue samples by qRT‐PCR (Figure 7A-C). Results were consistent with our bioinformatic forecast: the expression of lncRNA-CASC8 and TOB1 was significantly upregulated in PAAD samples compared to in adjacent normal tissues, while the expression of miR-129a-5p was significantly down-regulated. Furthermore, expression status of lncRNA-CASC8 was detected in PAAD cell lines (Figure 7D). Results indicated that BXPC3 showed the highest expression level and Panc-1 had the lowest. Moreover, the expression levels of lncRNA-CASC8 in all PAAD cell lines were significantly higher than that in normal pancreatic ductal epithelium cells (HPDE cell line) (Figure 7D).
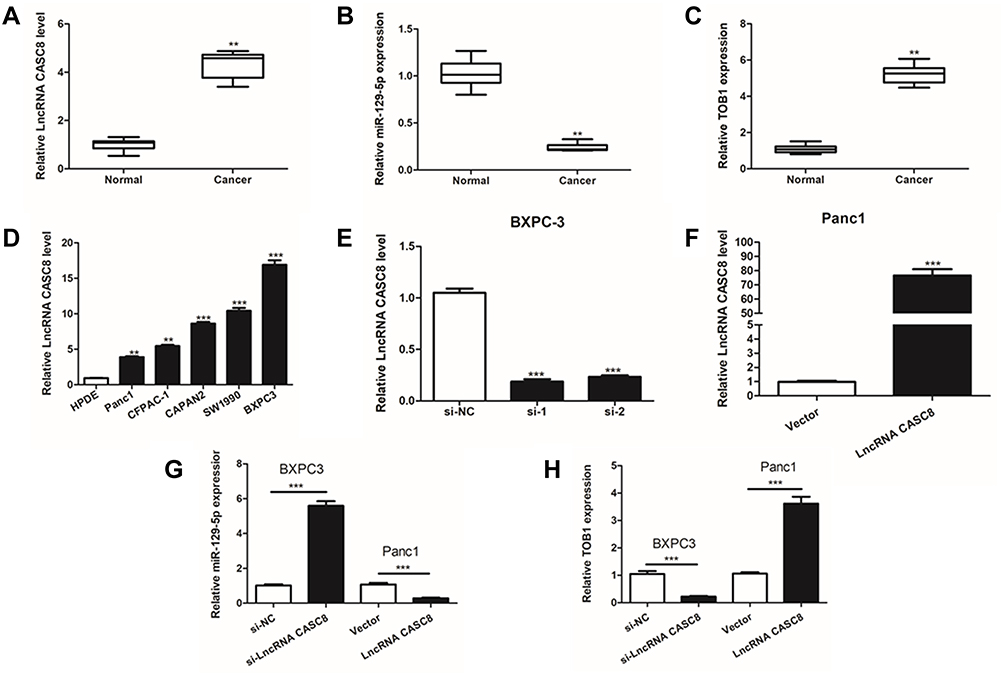 |
Figure 7 Experimental validation of CASC8-miR-129-5p-TOB1 axis. (A–C) The expression of CASC8 and TOB1 was significantly increased in PAAD tissues, while miR‐129-5p expression was significantly decreased in PAAD compared with normal tissues. (D) The expression level of CASC8 was significantly increased in PAAD cell lines compared with HPDE, normal pancreatic acinar cell line of mice in vitro. (E-F) The effects of knockdown and overexpression of CASC8 were measured by qRT‐PCT in BXPC-3 and Panc-1 cells respectively. (G-H) The expression level of miR-129-5p and TOB-1 after knockdown or overexpression of CASC8 in BXPC-3 and Panc-1 cells. (**P<0.01, ***P<0.001). |
Then, BXPC3 and Panc-1 were chosen to perform subsequent knockdown or overexpression experiments, respectively (Figure 7E and F). After successful transfection of pcDNA3.1‐CASC8 and si‐CASC8 vectors, the expression alterations of miR-129a-5p and TOB1 mRNA were measured by qRT-PCR. Notably, miR‐129a-5p expression was significantly increased after CASC8 knockdown in BXPC3 cells and decreased after CASC8 overexpression in Panc-1 cells (Figure 7G). Consistently, TOB1 expression was inhibited in BXPC3 cells with CASC8 knockdown and promoted in Panc-1 cells with CASC8 overexpression (Figure 7H).
Discussion
With the rapid development of next-generation sequencing technology in the past few decades, the research of tumor molecular pathology has officially entered the era of omics. Scientists are required to combine big data analysis, biological experiments, and clinical information together to study the pathogenesis of cancers. TCGA project has provided such a high-quality platform for researchers.16,17 At present, TCGA has included genome sequences, transcriptome sequences, DNA methylation information, copy number alteration, and clinical information of more than 11,000 patients of 30 kinds of cancers, allowing researchers to download them for free in diverse ways.18,19 In this study, we utilized PAAD transcriptome data from this convenient source to perform differential expression analysis for all documented lncRNAs, mRNAs, and miRNAs, these results were stable and reliable. However, we had to admit that limitations still could not be ignored. First, TCGA_PAAD cohort with 181 patients was relatively small than other cancer types like breast cancer or lung cancer. Besides, the number of normal pancreas controls we included was also small. These shortcomings could only be remedied by further development of these public databases in the future.
To further explore the biological significance of these differentially expressed RNAs, pathway analysis including GO and KEGG were further applied. Results indicated that these DERNAs were significantly enriched in immune-related processes, including chemokine signaling, lymphocyte response, and pathways of leukocytes.20 PAAD microenvironment contains many immune components, including interstitial cells, inflammatory cells and cytokines, which compose a complex network, promoting tumor growth and invasion.21 Given that PAAD is resistant to almost all traditional treatments, a concordant combination of various immunotherapies including targeting the stroma and reversing suppressive immune reactions by monoclonal antibodies or T-reg cells deletion, have become the most promising non-surgical way to extend the survival of PAAD patients.22 Our research highlighted the importance of PAAD immunology. In-depth exploration of the regulatory mechanism of ceRNAs for PAAD immunity might further improve the existing tumor immunotherapy strategies.
The ceRNA mechanism has been the most popular research direction in the past few years. It was widely agreed that this kind of research was “difficult to design, but easy to implement”. Combining bioinformatic methods to screen sequencing data with traditional molecular biology experiments provided scientists a comprehensive way to design projects with both biological significance and potential clinical value. In this study, we followed our own-designed protocol for establishing a reliable ceRNA network. This protocol followed several basic disciplines. First, a lncRNA and a mRNA must be positively related, this obeyed the basic hypothesis of ceRNA mechanism, that was, a sufficient amount of lncRNAs could competitively bind miRNAs that should have been bound to mRNAs, releasing mRNAs from the post-transcriptional inhibition of miRNA. Second, the lncRNA-mRNA pair must share plenty of binding sites for different miRNAs, which was a requirement for sequence homology and conservation, this brought a higher likelihood that a lncRNA-mRNA pair would be co-regulated by miRNAs, increasing the credibility of the ceRNA network. Third, the common shared miRNAs should have the same regulatory effect on the lncRNA and mRNA, ensuring that the competitive relationship between the lncRNA and mRNA was based on the same molecular mechanism. It was these disciplines that guaranteed us to build the most reliable ceRNA network. Currently there are few studies focusing on ceRNA regulatory networks in PAAD. Considering that lncRNAs are not the only one kind of non-coding RNAs that can function as ceRNAs, we hope to build a more complete ceRNA network containing all kinds of non-coding RNAs that potentially work as ceRNAs in the future.
In this study, five potential DElncRNAs correlated with prognosis were discovered, which were CASC8, LINC01133, MIR600HG, AP004608.1, and LINC00857. Among all DElncRNAs, lncRNA CASC8 overexpression correlated most significantly with worse prognosis of PAAD patients. Therefore, we chose it as the object of subsequent experimental verification. CASC8 has the full name of cancer susceptibility 8. Its expression was first identified to be correlated with increased cancer susceptibility. Multiple research proved that single-nucleotide polymorphisms (SNPs) of CASC8 are associated with the development, progression, and chemotherapy resistance of neoplastic diseases. These studies were reviewed in a meta-analysis published by Cui et al23 in 2018; they confirmed that two common SNPs of CASC8, rs10505477 (T>C) and rs7837328 (G>A), were related to the risk of multiple kinds of cancers including lung cancer, colorectal cancer, gastric cancer, and prostate cancer, etc. However, the mechanism by which CASC8 influenced cancer susceptibility is still unknown. So far, few researchers have currently explored its function in cancers. In addition to discovering that CASC8 was significantly highly expressed in PAAD and was related to poor prognosis, our study also demonstrated experimentally that knockdown of CASC8 could promote the expression of miR-129-5p and inhibit the expression of TOB1 and vice versa. This was the first attempt to explore the molecular function of CASC8 in PAAD and to study the mechanism of CASC8 as a ceRNA. For the other four potential lncRNAs, we believed that they possessed the value of follow-up mechanism research as well. To our knowledge, no research related to MIR600HG and AP004608.1 has been published so far and there are only a few studies focusing on the mechanism of LINC00857 in cancers. As for LINC01133, Zhang et al24 have reported a LINC01133/miR-216a-5p/TPT1/mTORC1 ceRNA axis that regulated tumorigenesis of PAAD. We hoped to further complement the in-depth mechanism experiments for all of these potential lncRNAs in the future.
As we obtained four prognostic ceRNA regulatory axes in our study, we had to choose only one of them for experimental validation and that was the lnc-CASC8-miR-129-5p-TOB1 axis. TOB1 is the abbreviation of translator of ERBB2, 1. It encodes a member of the transducer of erbB-2/B-cell translocation gene protein family. 3ʹUTR sequence of TOB1 gene was identified as a novel candidate of high frequency mutation sites in pan-cancers by Rheinbay et al.25 TOB1 protein was previously thought to be a tumor suppressor that showed anti-proliferative properties to inhibit cancer cell growth. For instance, Guo et al26 found that miR-371-3p could promote progression of gastric cancer by targeting and inhibiting the expression of TOB1. In 2015, Lee et al27 reviewed the anti-tumor mechanism of TOB1 in detail. TOB1 was associated with the reduction of both cyclin D1 and cyclin-dependent kinase (CDK) expressions and the induction of CDK inhibitors. However, some studies in recent years started to question this statement that TOB1 always performed as a tumor suppressor. Li et al28 found that TOB1 predominantly bound with β-catenin and activated Wnt/β-catenin signaling, which in turn enhanced TOB1 expression, forming a positive feedback loop to promote cell proliferation of colon cancer. Besides, Zhang et al29 found that TOB1 depletion selectively promoted G1 phase arrest and sensitivity to AKT and mammalian target of rapamycin (mTOR) inhibitors in estrogen-independent breast cancer cells. Results in our study suggested that TOB1 was a cancer promoter in PAAD as well. Its high expression was related to poorer prognosis of PAAD patients. These results might inspire follow-up researchers to further explore the pathogenesis of TOB1 regulation in tumors.
Conclusion
In this study, a ceRNA regulatory network was successfully developed utilizing RNA-seq data from the TCGA_PAAD cohort and RNA interaction databases by identifying differentially expressed lncRNAs, miRNAs, and mRNAs. After combination with results of survival analysis, we discovered six regulatory axes that might play a pivotal role in the carcinogenesis and development of PAAD. Further experimental preliminary validated CASC8-miR-129-5p-TOB1 axis. However, this regulatory axis still required further research to fully elucidate their biological functions and to confirm the ceRNA mechanisms.
Acknowledgments
This research was supported by National Natural Science Foundation of China (No. 81873589 and 81570585) and Science and Technology Project of Changsha, Hunan, China (No. kq2004146).
Disclosure
The authors report no conflicts of interest in this work.
References
1. Siegel RL, Miller KD, Jemal A. Cancer statistics, 2020. CA Cancer J Clin. 2020;70(1):7–30.
2. Chen W, Zheng R, Baade PD, et al. Cancer statistics in China, 2015. CA Cancer J Clin. 2016;66(2):115–132.
3. Bailey P, Chang DK, Nones K, et al. Genomic analyses identify molecular subtypes of pancreatic cancer. Nature. 2016;531(7592):47–52. doi:10.1038/nature16965
4. Collisson EA, Bailey P, Chang DK, Biankin AV. Molecular subtypes of pancreatic cancer. Nat Rev Gastroenterol Hepatol. 2019;16(4):207–220. doi:10.1038/s41575-019-0109-y
5. Rinn JL, Chang HY. Genome regulation by long noncoding RNAs. Annu Rev Biochem. 2012;81:145–166. doi:10.1146/annurev-biochem-051410-092902
6. Lin C, Yang L. Long noncoding RNA in cancer: wiring signaling circuitry. Trends Cell Biol. 2018;28(4):287–301. doi:10.1016/j.tcb.2017.11.008
7. Arun G, Diermeier SD, Spector DL. Therapeutic targeting of long non-coding RNAs in cancer. Trends Mol Med. 2018;24(3):257–277. doi:10.1016/j.molmed.2018.01.001
8. Liang H, Yu T, Han Y, et al. LncRNA PTAR promotes EMT and invasion-metastasis in serous ovarian cancer by competitively binding miR-101-3p to regulate ZEB1 expression. Mol Cancer. 2018;17(1):1–13. doi:10.1186/s12943-018-0870-5
9. Ye Y, Guo J, Xiao P, et al. Macrophages-induced long noncoding RNA H19 up-regulation triggers and activates the miR-193b/MAPK1 axis and promotes cell aggressiveness in hepatocellular carcinoma. Cancer Lett. 2020;469:310–322. doi:10.1016/j.canlet.2019.11.001
10. Xu W, Yu S, Xiong J, Long J, Zheng Y, Sang X. CeRNA regulatory network-based analysis to study the roles of noncoding RNAs in the pathogenesis of intrahepatic cholangiocellular carcinoma. Aging (Albany NY). 2020;12(2):1047. doi:10.18632/aging.102634
11. Qi M, Yu B, Yu H, Li F. Integrated analysis of a ceRNA network reveals potential prognostic lncRNAs in gastric cancer. Cancer Med. 2020;9(5):1798–1817. doi:10.1002/cam4.2760
12. Zhang H, Huang H, Xu X, et al. LncRNA HCG11 promotes proliferation and migration in gastric cancer via targeting miR-1276/CTNNB1 and activating Wnt signaling pathway. Cancer Cell Int. 2019;19:350. doi:10.1186/s12935-019-1046-0
13. Zhao D, Peng Q, Wang L, et al. Identification of a six-lncRNA signature based on a competing endogenous RNA network for predicting the risk of tumour recurrence in bladder cancer patients. J Cancer. 2020;11(1):108. doi:10.7150/jca.35801
14. Wang J, Zhang C, Wu Y, He W, Gou X. Identification and analysis of long non-coding RNA related miRNA sponge regulatory network in bladder urothelial carcinoma. Cancer Cell Int. 2019;19:327. doi:10.1186/s12935-019-1052-2
15. Pan H, Pan J, Song S, Ji L, Lv H, Yang Z. Identification and development of long non‐coding RNA‐associated regulatory network in colorectal cancer. J Cell Mol Med. 2019;23(8):5200–5210. doi:10.1111/jcmm.14395
16. Tomczak K, Czerwińska P, Wiznerowicz M. The Cancer Genome Atlas (TCGA): an immeasurable source of knowledge. Contemporary Oncol. 2015;19:A68–77.
17. Zhang Y, Wang K, Zhao Z, et al. ADAR3 expression is an independent prognostic factor in lower-grade diffuse gliomas and positively correlated with the editing level of GRIA2. Cancer Cell Int. 2018;18:196. doi:10.1186/s12935-018-0695-8
18. Wang Z, Jensen MA, Zenklusen JC. A practical guide to the cancer genome atlas (TCGA). In: Statistical Genomics Springer. 2016;111–141.
19. Liu G, Zeng H, Zhang C, Xu J. Identification of a six-gene signature predicting overall survival for hepatocellular carcinoma. Cancer Cell Int. 2019;19:138. doi:10.1186/s12935-019-0858-2
20. Shang J, Song Q, Yang Z, et al. Analysis of PD-1 related immune transcriptional profile in different cancer types. Cancer Cell Int. 2018;18:218. doi:10.1186/s12935-018-0712-y
21. Zheng L, Xue J, Jaffee EM, Habtezion A. Role of immune cells and immune-based therapies in pancreatitis and pancreatic ductal adenocarcinoma. Gastroenterology. 2013;144(6):1230–1240. doi:10.1053/j.gastro.2012.12.042
22. Fan J-Q, Wang M-F, Chen H-L, Shang D, Das JK, Song J. Current advances and outlooks in immunotherapy for pancreatic ductal adenocarcinoma. Mol Cancer. 2020;19(1):1–22. doi:10.1186/s12943-020-01151-3
23. Cui Z, Gao M, Yin Z, Yan L, Cui L. Association between lncRNA CASC8 polymorphisms and the risk of cancer: a meta-analysis. Cancer Manag Res. 2018;10:3141. doi:10.2147/CMAR.S170783
24. Zhang J, Gao S, Zhang Y, et al. MiR-216a-5p inhibits tumorigenesis in Pancreatic Cancer by targeting TPT1/mTORC1 and is mediated by LINC01133. Int J Biol Sci. 2020;16(14):2612–2627. doi:10.7150/ijbs.46822
25. Rheinbay E, Nielsen MM, Abascal F, et al. Analyses of non-coding somatic drivers in 2658 cancer whole genomes. Nature. 2020;578(7793):102–111. doi:10.1038/s41586-020-1965-x
26. Guo H, Ji F, Zhao X, et al. MicroRNA-371a-3p promotes progression of gastric cancer by targeting TOB1. Cancer Lett. 2019;443:179–188. doi:10.1016/j.canlet.2018.11.021
27. Lee HS, Kundu J, Kim RN, Shin YK. Transducer of erbb2. 1 (tob1) as a tumor suppressor: A mechanistic perspective. Int J Mol Sci. 2015;16(12):29815–29828. doi:10.3390/ijms161226203
28. Li D, Xiao L, Ge Y, et al. High expression of Tob1 indicates poor survival outcome and promotes tumour progression via a Wnt positive feedback loop in colon cancer. Mol Cancer. 2018;17(1):1–6. doi:10.1186/s12943-018-0907-9
29. Zhang Y-W, Nasto RE, Varghese R, et al. Acquisition of estrogen independence induces TOB1-related mechanisms supporting breast cancer cell proliferation. Oncogene. 2016;35(13):1643–1656. doi:10.1038/onc.2015.226
 © 2020 The Author(s). This work is published and licensed by Dove Medical Press Limited. The full terms of this license are available at https://www.dovepress.com/terms.php and incorporate the Creative Commons Attribution - Non Commercial (unported, v3.0) License.
By accessing the work you hereby accept the Terms. Non-commercial uses of the work are permitted without any further permission from Dove Medical Press Limited, provided the work is properly attributed. For permission for commercial use of this work, please see paragraphs 4.2 and 5 of our Terms.
© 2020 The Author(s). This work is published and licensed by Dove Medical Press Limited. The full terms of this license are available at https://www.dovepress.com/terms.php and incorporate the Creative Commons Attribution - Non Commercial (unported, v3.0) License.
By accessing the work you hereby accept the Terms. Non-commercial uses of the work are permitted without any further permission from Dove Medical Press Limited, provided the work is properly attributed. For permission for commercial use of this work, please see paragraphs 4.2 and 5 of our Terms.