")
Back to Journals » International Journal of Nanomedicine » Volume 15
Hypoxia-Targeting Multifunctional Nanoparticles for Sensitized Chemotherapy and Phototherapy in Head and Neck Squamous Cell Carcinoma
Authors Song C , Tang C, Xu W , Ran J, Wei Z, Wang Y, Zou H, Cheng W, Cai Y , Han W
Received 3 October 2019
Accepted for publication 9 January 2020
Published 20 January 2020 Volume 2020:15 Pages 347—361
DOI https://doi.org/10.2147/IJN.S233294
Checked for plagiarism Yes
Review by Single anonymous peer review
Peer reviewer comments 2
Editor who approved publication: Dr Linlin Sun
Chuanhui Song, 1, 2,* Chuanchao Tang, 1, 2,* Wenguang Xu, 2 Jianchuan Ran, 1, 2 Zheng Wei, 1, 3 Yufeng Wang, 1, 2 Huihui Zou, 1, 2 Wei Cheng, 4 Yu Cai, 1 Wei Han 1, 2
1Central Laboratory of Stomatology, Nanjing Stomatological Hospital, Medical School of Nanjing University, Nanjing 210008, People’s Republic of China; 2Department of Oral and Maxillofacial Surgery, Nanjing Stomatological Hospital, Medical School of Nanjing University, Nanjing 210008, People’s Republic of China; 3Pediatric Dentistry, Nanjing Stomatology Hospital, Medical School of Nanjing University, Nanjing 210008, People’s Republic of China; 4Department of Oral Implantology, Nanjing Stomatological Hospital, Medical School of Nanjing University, Nanjing 210008, People’s Republic of China
*These authors contributed equally to this work
Correspondence: Wei Cheng
Department of Oral Implantology, Nanjing Stomatological Hospital, Medical School of Nanjing University, No. 30 Zhongyang Road, Nanjing 210008, People’s Republic of China
Tel +86-025-83620238
Email [email protected]
Wei Han
Department of Oral and Maxillofacial Surgery, Nanjing Stomatological Hospital, Medical School of Nanjing University, No 30 Zhongyang Road, Nanjing 210008, People’s Republic of China
Tel +86-025-83620349
Email [email protected]
Purpose: Chemotherapy in head and neck squamous cell carcinoma (HNSCC) has many systemic side effects, as well as hypoxia-induced chemoresistance. To reduce side effects and enhance chemosensitivity are urgently needed.
Methods: We synthesized a drug delivery system (named CECMa NPs) based on cisplatin (CDDP) and metformin (chemotherapeutic sensitizer), of which chlorin e6 (Ce6) and polyethylene glycol diamine (PEG) were synthesized as the shell, an anti-LDLR antibody (which can target to hypoxic tumor cells) was modified on the surface to achieve tumor targeting.
Results: The NPs possessed a great synergistic effect of chemotherapy and phototherapy. After laser stimulation, both CDDP and metformin can be released in situ to achieve anti-tumor effects. Meanwhile, PDT and PTT triggered by a laser have anticancer effects. Furthermore, compared with free cisplatin, CECMa exhibits less systemic toxicity with laser irradiation in the xenograft mouse tumor model.
Conclusion: CECMa effectively destroyed the tumors via hypoxia targeting multimodal therapy both in vitro and in vivo, thereby providing a novel strategy for targeting head and neck squamous cell carcinoma.
Keywords: cisplatin, metformin, chlorin e6, head and neck squamous cell carcinoma, nano-delivery
Introduction
Head and neck squamous cell carcinoma ranks as the sixth most common cancer worldwide,1 and due to its special disease site and complex anatomy of the head and neck region, surgery alone might not be sufficient to radically resect the tumor, which invades important organs such as the brain, eyeballs, and carotid arteries.2 Thus, other modalities such as chemotherapy were applied for efficient treatment.3 Advance in chemotherapy has rapidly progressed in recent years,4,5 but a main obstacle in the clinic was chemoresistance during treatment.6 Patients might benefit from chemotherapy,7 as the tumor may shrink at the beginning of treatment, but tumor recurrence and chemoresistance often occur.8 To date, numerous reports have elucidated the importance of the tumor microenvironment in chemoresistance.9 Moreover, chemotherapeutic drugs are non-targeting, which is a double-edged sword in that they kill both cancer and normal cells, leading to severe systemic toxicity.10 Some strategies such as adding a chemosensitizer greatly reduce the dosage of chemotherapeutic drugs, resulting in synergistic effects.11,12 Thus, researchers are working hard to improve the effectiveness and efficacy of chemotherapy by using multi-drug combinations. Recently, our group reported that metformin, a drug that is routinely used for treating diabetic patients, can enhance sensitivity to tumor therapy by inhibiting tumor hypoxia induced by nuclear factor-kappa B signaling and enhancing chemotherapeutic drug efficacy.13 However, additional studies are required to determine the best drug ratio to use.
Nanotechnology-based drug delivery systems (DDSs) are a research hotspot in recent years,14–16 which can carry multiple drugs and transfer them into tumors by passive targeting due to damaged or immature tumor vessels, a phenomenon named the enhanced permeability and retention (EPR) effect.17,18 However, efforts are still being made to improve active targeting by fully exploring the tumor features.19–22 Currently, the most commonly used active targeting ligands include transferrin,23 folic acid,24 and Arg-Gly-Asp.25,26 Unfortunately, these ligands are not specific to head and neck cancer and do not target the core area of tumors, namely, the hypoxic region, which is widely regarded as the main contributor of chemoresistance.27 To identify specific markers of the tumor core area, tumor samples were collected and analyzed by quantitative PCR (qPCR), chromatin immunoprecipitation assay, and bioinformatics analysis. The data were validated in different cohorts. Our previous work revealed that the low-density lipoprotein receptor (LDLR) might be a specific head and neck cancer marker in hypoxic regions. The overexpression of LDLR increases malignancy, specifically chemoresistance. Thus, antibodies against LDLR might be useful for modifying nanoparticles and greatly increasing active targeting to the head and neck cancer tumor core area.
In our study, we successfully developed a strategy for actively targeting drugs to the hypoxic tumor region, which co-deliver of cisplatin (CDDP) and metformin. Considering our previous work, chlorin e6 (Ce6) and polyethylene glycol diamine (PEG) were employed to synthesize the amphiphilic molecule, and Ce6-PEG, CDDP, and metformin were formed into nanoparticles (NPs) by self-assembly. Subsequently, anti-LDLR was modified on the NP surface to form the final product Ce6-PEG-CDDP-metformin (CECMa). CompuSyn software was applied to explore the interaction between CDDP and metformin under both hypoxic and normoxic conditions, respectively. The most suitable drug ratio was determined by the strongest synergistic effect. As an excellent photosensitizer, Ce6 in CECMa can be applied in various studies for optical imaging, photothermal therapy (PTT), as well as photodynamic therapy (PDT). After laser stimulation, both CDDP and metformin can be released in situ to achieve anti-tumor effects. Meanwhile, PDT and PTT triggered by a laser can have anti-cancer effects (Scheme 1). The NPs in our study effectively destroyed the tumors via targeted multimodal therapy in vitro and in vivo, thereby providing a novel strategy for targeting hypoxia in cancer therapy.
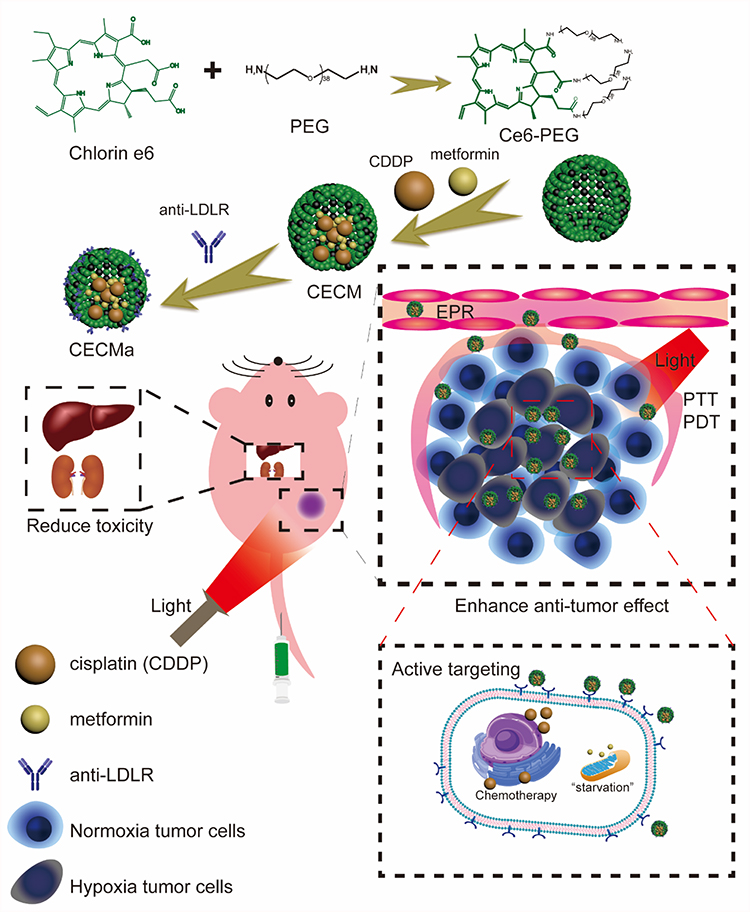 |
Scheme 1 Schematic illustration of the synthesis of CECMa NPs, followed by intravenous injection of the NPs into tumor-bearing mice. Ce6-PEG was prepared by conjugating the amine-functionalized NH2-PEG-NH2 with activated Ce6, which acted as a shell of the NPs. Then Ce6-PEG, CDDP, and metformin formed core-shell structured NPs through self-assembly. Furthermore, the hypoxic targeting ligand anti-LDLR was conjugated to the NP surface to obtain the final product (CECMa). After intravenous injection, the NPs passively targeted the tumor sites based on the EPR effect, and their active targeting ability was due to the anti-LDLR modified on the surface of NPs. Phototherapy can be achieved after laser irradiation; meanwhile, NPs can release CDDP and metformin in situ to achieve anti-tumor effects. |
Materials and Methods
Materials
All initial reagents were obtained commercially and used as received. 1-ethyl-3-(3-(dimethylamino) propyl) carbodiimide (EDC), dimethyl sulfoxide (DMSO) and sulfo-NHS (N-hydroxysulfosuccinimide), and Ce6 were obtained from Adamas-beta (Shanghai, China). NH2-mPEG-NH2(2k) was obtained from ToYong Bio Co., Ltd. (Shanghai, China). Singlet Oxygen Sensor Green (SOSG) was purchased from Molecular Probes (Eugene, USA). Trypsin-EDTA (0.25%) was from New Cell & Molecular Biotech Co., Ltd. (Suzhou, China). PI, DAPI, CCK-8, RPMI-1640 culture medium, DMEM/F12 culture medium, and DMEM were from KeyGEN BioTECH (Jiangsu, China). The DCFH-DA Kit was from Beyotime (Shanghai, China). Human head and neck squamous cells, HSC3, CAL27, SCC4, and FaDu, were purchased from the Type Culture Collection of the Chinese Academy of Sciences (Shanghai, P. R. China).
Clinical Samples
Tumor samples and adjacent normal samples of HNSCC patients were acquired from the Biobank of Nanjing Stomatological Hospital approved by the Ethics Committee of Nanjing Stomatological Hospital. Formalin-fixed, paraffin-embedded (FFPE) HNSCC samples were also obtained from the Biobank of Nanjing Stomatological Hospital. All pathological sections were reviewed by a pathologist for the identification of lymph node metastasis status of HNSCC patients.
Quantitative Real-Time PCR of HIF-1 Signaling Pathway Genes
Total RNA was obtained from HNSCC patients’ frozen specimens using TRIZOL Reagent following protocol. A PrimeScript RT Master Mix kit (Takara) was used to RNA reverse transcribed. Followed the instructions, a quantitative real-time PCR was performed on an ABI7500 PCR system. The expression of a total of 88 genes from the HIF-1 signaling pathway was detected.
Cell Culture Experiment
HSC3, CAL27, SCC4 cells were cultured and maintained in DMEM supplemented with 10% fetal bovine serum (FBS, Biological Industries), 80µg/mL streptomycin, and 80 U/mL penicillin, NaHCO3, 4.5 mg/mL glucose, and 0.584g/L L-Glutamine at 37 °C (5% CO2/20% O2, normoxia or 5% CO2/1% O2, hypoxia). FaDu cells were cultured and maintained in MEM supplemented with 10% fetal bovine serum (FBS, Biological Industries), 80µg/mL streptomycin, and 80 U/mL penicillin, NaHCO3, 4.5 mg/mL glucose, and 0.584g/L L-Glutamine at 37 °C (5% CO2/20% O2, normoxia or 5% CO2/1% O2, hypoxia).
Cell Migration Assay
Transwell inserts chambers (8-μm, Corning, USA) were used for migration assays. HSC3, CAL27, and SCC4 cells were seeded in serum-free media on the top chamber about 5 × 10³ cells per well, separately. DMEM culture medium (20% FBS, 800ul/well) was added into the bottom chamber. After incubated for 48 h at 37°C in 5% CO2 with 21% O2 or 1% O2, migrated cells were fixed in 4% paraformaldehyde and stained with 0.1% crystal violet for quantifying.
Sphere Formation Assay
1×10³ cells per well were cultured in serum-free DMEM/F12 culture medium containing 20 ng/mL epidermal growth factor, 10 ng/mL basic fibroblast growth factor, 1% streptomycin, and penicillin, and 2% B-27™ Supplement (50X) in ultralow attachment well plates (Corning, USA) at 37°C with 21% O2 or 1% O2 for 14 days. Sphere formation was assessed after 14 days (minimum of 50 cells in a spheroid).
Quantitative Real-Time PCR for Cells
According to the manufacturer’s instructions, total RNA was extracted using the Trizol Reagent. A Nanodrop spectrophotometer (Thermo Scientific) was used to detect the RNA quantity and quality. Then the RNA was reverse into cDNA using the PrimeScript RT Master Mix kit, according to the manufacturer’s instructions, and the expression of LDLR, Nanog, Oct4, and Sox2 was measured using SYBR Green PCR Master Mix on an ABI7500 PCR system.
Western Blot
After cultured under hypoxic or normoxic conditions, cells were harvested and lysed for 15 min using a modified RIPA buffer. Protein extracts were loaded onto a sodium dodecyl sulfate-polyacrylamide (SDS) gel, electrophoresed, and transferred to a polyvinylidene difluoride membrane. After blocking with 5% separated milk, protein bands were probed with primary antibodies at 4 °C overnight, followed by alkaline phosphatase-linked secondary antibody incubation for 1 hr at room temperature. Beta-actin was used as a loading control.
Synthesis and Characterization
By conjugating the amine-functionalized NH2-mPEG-NH2 with activated Ce6, Ce6-PEG was prepared. Briefly, 17 mg Ce6 was mixed with 15 mg EDC and 15 mg sulfo-NHS in 4 mL anhydrous DMSO for 1 h at room temperature. After that, 120 mg NH2-mPEG-NH2 in 4 mL DMSO was added (molar ratio of NH2-mPEG-NH2: Ce6: EDC: NHS = 4:2:5:5). The above solution was dialyzed against water by a 1 kDa cut-off after reacting for 24 h at room temperature and then lyophilized to gain Ce6-PEG nanoparticals (CE NPs). Ce6-PEG-coated CDDP and metformin were self-assembled. Briefly, the Ce6-PEG was re-dispersed into methanol, and the CDDP and metformin were dissolved into chloroform to clear. A vacuum rotary steam was used to dry the mixture to obtain the final product CECM, which was then redispersed for conjugation with the anti-LDLR antibody. The Ce6-PEG was reacted with NPs: anti-LDLR (0.5 mg/mL) antibody: EDC·HCl in a ratio of 1:10:4000 in borate saline buffer (BBS) under continuous stirring for 2 hrs at room temperature. The final products were dispersed in PBS after centrifugation and washed with PBS twice. For folic acid (FA) modified, 5 mg FA was dissolved in 10 mL PBS added with EDC⋅HCl (10 mg) and NHS (6 mg), and the solution was constant stirring for 4 hrs at room temperature. Then the obtained CECM NPs in 10 mL water was added stirred at room temperature for another 24 hrs. The CECM-FA NPs were collected by centrifugation and washed with PBS. The size and geometry of CECM and CECMa were characterized by TEM (JEM-200CX; JEOL, Tokyo, Japan). The polymer intermolecular structure was characterized using an FTIR spectrometer (Nexus 870; Nicolet, Madison, WI, USA). UV-vis-NIR spectra were gained using the PerkinElmer Lambda 750 UV-vis-NIR spectrophotometer.
Drug Release Performances
The solution was added to a dialysis bag, and dialysis was performed with 200 mL ddH2O, with or without laser irradiation (660 nm, 1 W·cm−2). At predetermined time points, 1 mL sample was taken to analyze by inductively coupled plasma mass spectrometry.
In vitro PTT and PTD Detection
The CECMa solution (1,0.75, 0.5, 0.25 mmol/L) was irradiated by a 660 nm laser (1 W·cm−2), or 1 mmol/L at 1, 0.75, and 0.5 W·cm−2. The solution’s temperature was monitored using a thermometer (FLIR C3, FLIR Systems, Inc., Wilsonville, OR, USA). SOSG was used to assess singlet oxygen generation. The solutions of CECM and CECMa were mixed with SOSG in water (SOSG, 1μm) and illuminated with a 660nm laser (1 W·cm−2) for 0–18 min. The fluorescence of SOSG was detected at 530 nm at each selected time point.
Cellular Uptake
3 × 10⁴ HSC3 cells were added in the cell culture dish (35mm, NEST Biotechnology, Jiangsu, China). After 24 hrs, the cells were incubated with CECMa (equiv. [CDDP] = 5 μM) in the dark for 0,1, 2, 4, 6, 8, and 12 hrs. After that, the cells were washed with PBS 3 times and fixed in 4% paraformaldehyde for 20 min. Pictures of cells were taken by the Nikon Digital Eclipse A1 Plus microscope (Tokyo, Japan) after stained with DAPI. To detect the differential uptake and efficacy with or without LDLR targeting, cells incubation with CECM or CECMa for 2 hrs under normoxia and hypoxia were conduction. ImageJ software was utilized to analyze the fluorescence intensity.
In vitro PDT and PTT Tests
To assess the viability of HSC3 and FaDu cells after different treatments, 2×10³ cells were added into 96-well plates per well and cultured for the next 24 hrs, separately. And CDDP, metformin, CDDP+metformin, CECM, or CECMa were added to each well, irradiated by a 660 nm laser (1 W·cm−2) after 4 hrs for 5 min, followed by incubation for an additional 4 hrs, after which the cell viability was estimated with the CCK-8 assay. The incubation time was determined by the cellular uptake results. The co-staining of Calcein-AM/PI and flow cytometry were used to verify the synergistic effects of photo/chemotherapy caused by CECMa. For Calcein-AM/PI staining, the cells were incubated with Calcein-AM (4 μM)/PI (4 μM) solution for 15 min, and then being imaged under the Nikon Digital Eclipse A1 Plus microscope with green/red fluorescent exciters after washed with PBS for 3 times. For flow cytometry, HSC3 cells were seeded into 6-well plates. Cells were administered with different treatments after adhesion. Followed the manufacturer’s instruction, apoptotic cells were quantified by Annexin-V and PI co-staining.
Detection of Intracellular ROS
The Reactive Oxygen Species Assay Kit (Beyotime) was utilized to examine the cellular production of 1O2 according to the protocol. HSC3 cells were plated in the cell culture dish (35mm, NEST Biotechnology, Jiangsu, China). After adhesion, different solutions were added to wells and followed by incubation for an additional 4 hrs. Then DCFH-DA (2,7-Dichlorodi -hydrofluorescein diacetate) probe with serum-free media was added to the wells, and the cells were irradiated by a 660 nm laser (1 W·cm−2) after 30 min. Cells were fixed in 4% paraformaldehyde after washing 3 times with PBS, then stained with DAPI before imaging.
Hemolysis Assay
Hemolysis assay was conducted using mice red blood cells (RBCs). The different concentrations of CECMa were mixed the cell solution of the RBCs for 3 hrs following RBCs isolated. The hemoglobin releasing in the supernatant was determined by measuring the absorbance of solutions at 540 nm.
Xenograft Tumor Mouse Model
To establish the tumor xenograft animal models, Balb/c male nude mice (6 weeks old, average body weight: 22 g, Nanjing Biomedical Research Institute of Nanjing University, Nanjing, China) were subcutaneously injected in the bottom back with 5 × 10⁶ HSC3 cells/mouse. All animal experiments complied with national and international guidelines. Institutional Review Board approval was obtained from Nanjing Stomatological Hospital Ethics Committee.
In vivo Thermal Imaging
After the tumor volume reached about 150 mm3, CECMa (corresponding to 10 mg/kg CDDP) was intratumorally injected into the mice. After 4 hrs, the thermal imaging was measured by an infrared camera (FLIR, C3) at different time points following a 660 nm laser (1 W·cm−2) irradiation.
In vivo Antitumor Evaluation
When the tumor size reached approximately 150 mm3, the HSC3 tumor-bearing mice were divided into seven groups (four animals per group): saline only, free CDDP only, metformin only, CDDP+metformin, CE NPs + laser, CECMa only, and CECMa + laser. The entire tumor was irradiated by a 660 nm laser (1 W·cm−2, 10 min). The treatment was repeated twice a week, and the tumor volume was measured every 2 days following treatment.
Histological Staining
The major organs were dissected from HSC3-bearing mice after different treatments. The tissues were embedded in the paraffin cassettes after dehydration and stained with H&E, Ki-67, Hsp70, and γ-H2AX. Then histology imaging was observed with a microscope.
Statistical Analysis
All experimental results are presented with mean ± SD. as indicated by GraphPad Prism 7.0. Statistical differences were calculated using Student’s t-test and the considered statistical significance was p < 0.05.
Ethics Statement
Institutional review board approval was obtained from Nanjing Stomatological Hospital Ethics Committee (approval number, 2016NL-016[KS]). All animal experiments and experimental protocols were in accordance with the Animal Care and Use Committee of the Medical School of Nanjing University.
Results and Discussion
LDLR Is Upregulated in HNSCC Hypoxia Tumor Environment
Head and neck squamous cell carcinoma (HNSCC) cell lines were used to evaluate the biological functions under hypoxia or normoxia. As shown in Figure 1, compared with controls, HNSCC cells in hypoxic conditions showed much higher migration potential than normoxia (Figure 1A and B). In addition, hypoxia appeared to be correlated with the size and the number of spheres (Figure 1C and D). Under hypoxia condition for 2 days, the expression of genes and protein which related stemness was assessed in HNSCC cells, and the results showed that under hypoxia the expression of stemness genes including Nanog, Oct4, and Sox2 upregulated (Figure 1E). The results showed that hypoxia could improve sphere formation, raise the expression of stemness genes, indicating that hypoxia may enhance HNSCC cell stemness which is in accordance with our previous research.13 In clinical practice, the lymph node metastasis is one of the most important factors affecting the prognosis of HNSCC patients. So, we used RNA from tumor patients with or without lymph node metastasis to detect the differential genes involved in the HIF-1 pathway. In preliminary screening, LDLR was identified as the only dysregulated mRNA that could distinguish between metastatic and non-metastatic tumor patients through a cohort of patients (Figure S1 and S2). To further validate the relationship between hypoxia condition and LDLR expression at the cellular level, the tumor cells were cultured under artificial hypoxic or normoxic conditions, after that, Western blotting was utilized to show that hypoxia could elevate the expression of LDLR (Figure 1F). Taken together, this suggests that LDLR was correlated with lymph node metastasis of tumor closely and could be a potential marker to achieve hypoxia targeting in head and neck cancer. In view of the bioinformatical screening and validation, we aim to achieve the targeting of hypoxic regions through targeting LDLR, with the purpose to achieve the damage of stem-like cells, prevent metastasis and reduce recurrence risk.
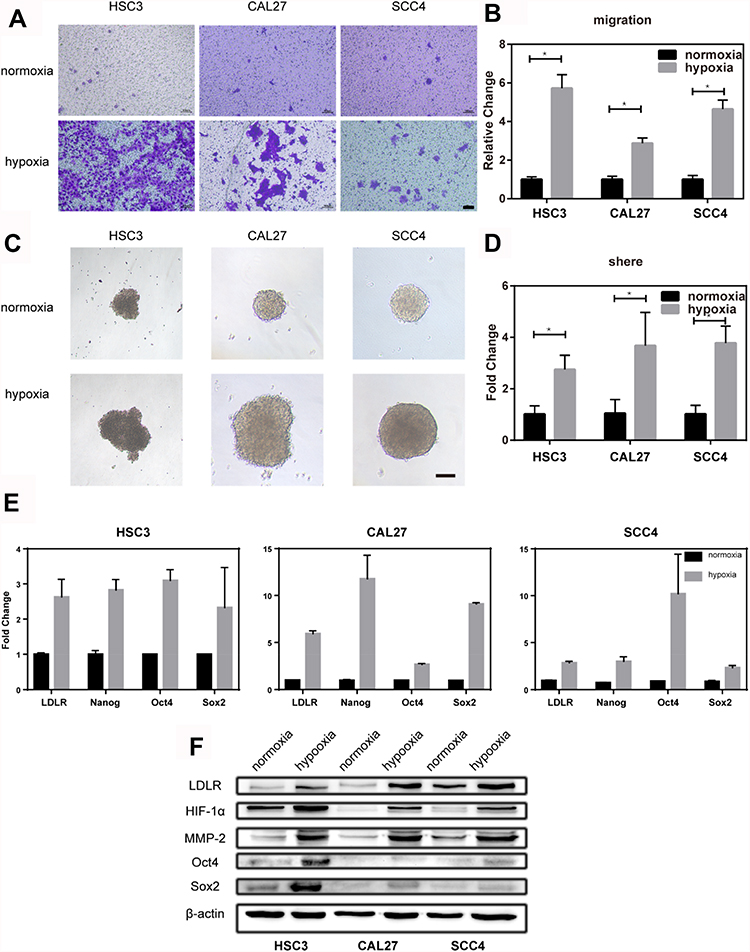 |
Figure 1 Stem cell-like properties induced by hypoxia in HNSCC cells. (A) Representative photographs of cell migration assays of HSC3, CAL27, and SCC4 cells under hypoxia. (B) Statistical analysis of cell migration assays. (C) Representative photographs of sphere formation of HSC3, CAL27, and SCC4 cells under hypoxia. (D) Statistical analysis of sphere formation experiments. (E) RT-PCR results of genes including LDLR, Nanog, Oct4, and Sox2 in HSC3, CAL27, and SCC4 cells under hypoxia. (F) Western blot results of protein including LDLR, HIF-1α, MMP-2, Oct4, and Sox2 in HSC3, CAL27, and SCC4 cells under hypoxia. *Indicates P < 0.05. |
To Determine the Optimal Concentration Ratio of the Drug
To obtain the most suitable ratio of co-delivery drugs, we measured the synergistic effects of the mixture of CDDP and metformin on HSC3 and FaDu human head and neck squamous cells under hypoxic and normoxic environments, respectively. A series of CDDP and metformin mixtures were prepared with a certain amount of CDDP add with different amounts of metformin to yield metformin/CDDP ratios in the range of 1:5 to 1:100. Then we utilized every mixture as an origin concentration, from which a series of dilutions were made (Figure 2A and B, Figure S3 and S4). Under the hypoxic environment, human head and neck squamous cells show resistance to chemotherapeutic drugs. As under the same CDDP concentration, two kinds of tumor cells under hypoxia have higher survival rates. While after combined application with metformin, the therapeutic effect of chemotherapeutic drugs has been enhanced. All samples with different treatments were used to carry on cell viability experiments, and CompuSyn software was utilized to study the interactions between CDDP and metformin. As shown in Figure 2C, a strong synergistic effect was observed when the drug ratio was 1:10, irrespective of whether the environment was hypoxic. Thus, this ratio was used for nano drug system synthesis and subsequent experiments.
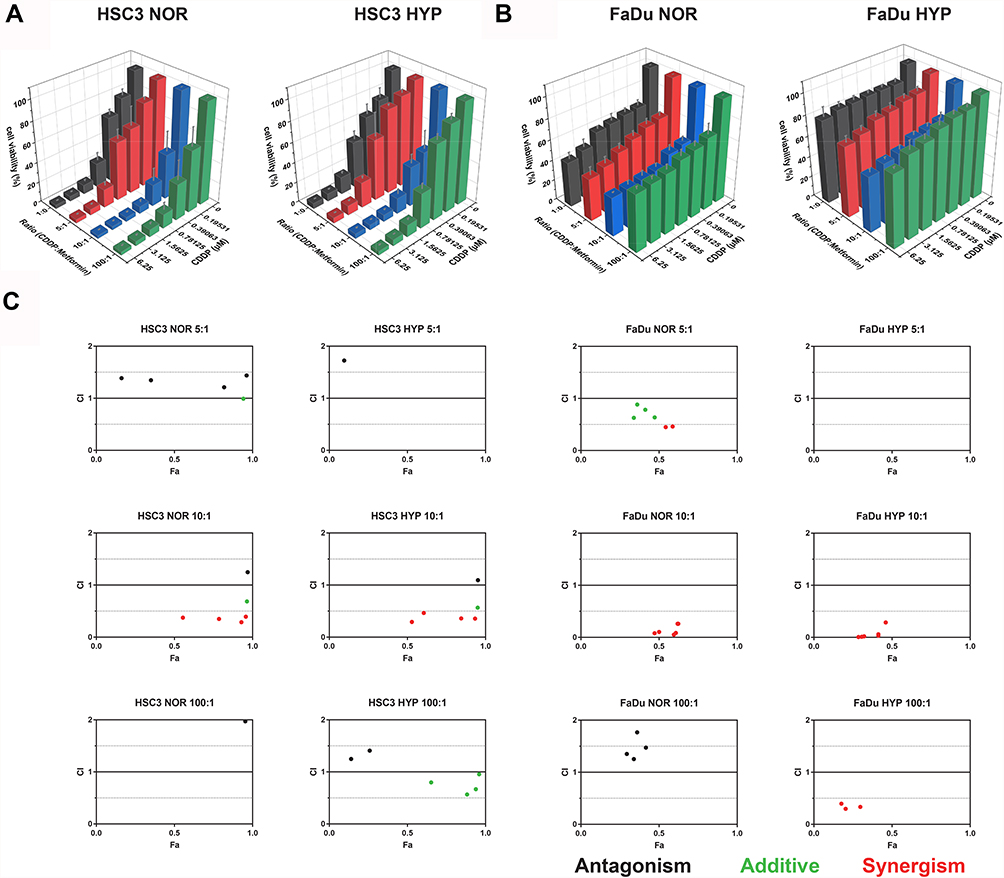 |
Figure 2 CI of different ratios of CDDP and metformin in HSC3 and FaDu cells under hypoxic and normoxic environments. The CI was calculated at a CDDP: metformin mass ratio of 5:1, 10:1 and 100:1. (A, B) Cell growth rate. (C) CI of combination. Error bars represent the mean ± SD. The CI quantitatively depicts synergism (CI < 0.5), additive effect (0.5 < CI < 1), or antagonism (CI > 1). The color intensity shows the average of CI (red, synergism; green, additive; black, antagonism). Abbreviation: Fa, fraction affected. |
Synthetic Nanoparticles (NPs) Have the PDT and PTT
To gain the goal of targeted drug delivery to the hypoxic regions of tumors, a self-screening tumor hypoxia marker (LDLR) was taken as a targeting ligand. Its monoclonal antibody was modified on the NPs surface to achieve active targeting. Ce6-conjugated NH2-PEG-NH2 (Ce6-PEG) was prepared by conjugating the amine-functionalized NH2-PEG-NH2 with activated Ce6, which acted as a shell of the NPs. Then CDDP and metformin were added at a ratio of 1:10. Through self-assembly, Ce6-PEG, CDDP, and metformin formed core-shell structured NPs, with a chemotherapy drug core and a photosensitizer shell. Next, the hypoxic targeting ligand anti-LDLR was conjugated to the NP surface to obtain the final product (CECMa). Transmission electron microscopy (TEM) showed that the CECM had a uniform diameter of approximately 130 nm (Figure 3A), which decreased to approximately 120 nm when modified with anti-LDLR (Figure 3B), possibly due to the longer stirring time. And after 2 weeks of storage, the dynamic light scattering (DLS) results showed that their particle size did not change significantly (Figure S5). Fourier transform infrared analysis was conducted to determine the chemical composition of CECMa NPs. As observed, CECMa had prominent, characteristic absorption of about 3272 cm−1, attributable to the absorption of CDDP (Figure 3C). Moreover, the infrared spectrum confirmed the formation of the amide bond between Ce6 and PEG. The PTT and photochemical properties of the CECMa NPs were further investigated. Figure 3D shows the thermometric curves of the different concentrations of NPs solution under laser irradiation (660 nm, 1 W·cm−2). At every concentration, the NPs solutions’ temperature rapidly increased and reached a platform within about 6 min, indicating rapid photothermal conversion of our NPs, so making the NPs as an attractive photothermal partial. Along with the laser power density increases, the higher temperature obtained (Figure 3E). Singlet oxygen sensor green (SOSG) was utilized to detect the generation of singlet oxygen (1O2) to evaluate the photochemical effect of CECMa NPs. As shown in Figure 3F, the intensity of SOSG (530 nm) increased with irradiation time, indicating a huge capacity of 1O2 generation. Moreover, it was approximately equal to that of CECM under the same conditions, which means that the addition of targeting ligand did not affect its 1O2 production ability. The absorption peak and fluorescence peak corresponding to Ce6 appeared in the curve of the CECM and CECMa, which means that the CECM and CECMa had a fluorescence intensity similar to that of Ce6 (Figure 3G). In addition, CDDP showed a stronger ability to be released under laser irradiation (Figure 3H). In all, these results demonstrated that CDDP, metformin, and PEG-Ce6 could self-assemble to form regular nanostructures, providing the possibility for the next in vitro and in vivo experiments due to PTT and PDT abilities. Moreover, with laser irradiation, CECMa can release much more CDDP to kill tumor cells, which means that the CECMa can achieve the so-called laser-triggering drug release.
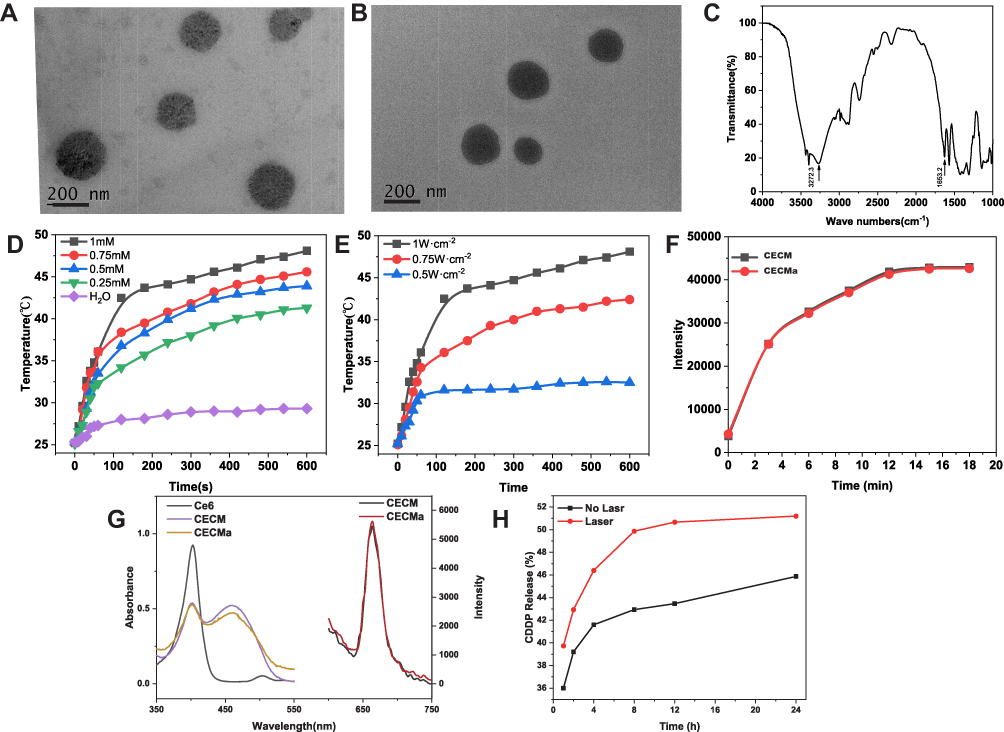 |
Figure 3 Characterization of CECMa. (A) The TEM image of CECM. (B) The TEM image of CECMa. (C) Fourier transform infrared (FTIR) image of CECMa. (D) PTT heating curves of the different concentrations of CECMa solutions under 660 nm laser irradiation. (E) PTT heating curves of the CECMa solutions (1 mM) under different 660 nm laser at different power for 10 min. (F) PTD profiles of CECM and CECMa solutions in PBS (1 mM). The intensity of SOSG under 525 nm after received different 660 nm laser irradiations (1 W·cm−2). (G) UV-vis-NIR profiles of Ce6, CECM, and CECMa and the fluorescence emission of CECM and CECMa. (H) Release curve of CDDP from CECMa with or without laser irradiation (1 W·cm−2). |
The Ligand Enhances the Intake of Cells
To investigate the cellular uptake and intracellular distribution of CECMa, laser scanning confocal microscopy (LSCM) was utilized to detect the cellular fluorescence. As a composition of NPs, Ce6 had red fluorescence, and the nucleus was stained with DAPI (blue). Figure 4A shows the confocal images of NPs after a 0–12 hrs incubation, separately. The intracellular fluorescence intensity of Ce6 increased along with incubation time for 12 hrs (Figure 4B). Furthermore, the fluorescence intensity reached a maximum at 4 hrs incubation. Notably, NPs were mostly located in the cytoplasm, because the red fluorescent signal was mainly in a specific region. In addition, tumor cells under hypoxia indeed uptakes more NPs than under normoxia condition (Figure S6). The diffusion of NPs into the tumor tissue is also an important factor for tumor cell damage under hypoxia, where located at the core of the solid tumor.27,28 Hence, the penetrating ability of NPs was explored using 3D spheroid tumor models under hypoxia to simulate the microenvironment faced by the CECMa in tumor tissue.29 Folic acid (FA) was used as a usual ligand to achieve tumor targeting, so we compared the efficiency of both aiming to choose a better one. FA modified CECM, the red fluorescence was detected just around the tumor spheroid, suggesting that the NPs with FA modified only had a weak ability to penetrate into tumors. Nevertheless, abundant red fluorescent signals were observed from the around to the middle of the tumor cells spheroid for CECMa, clearly supporting the penetration ability and hypoxia-targeting (Figure 4C and Figure S7). Such improved cellular uptake ability and tumor penetrate indicated our NPs can be used for tumor treatment.
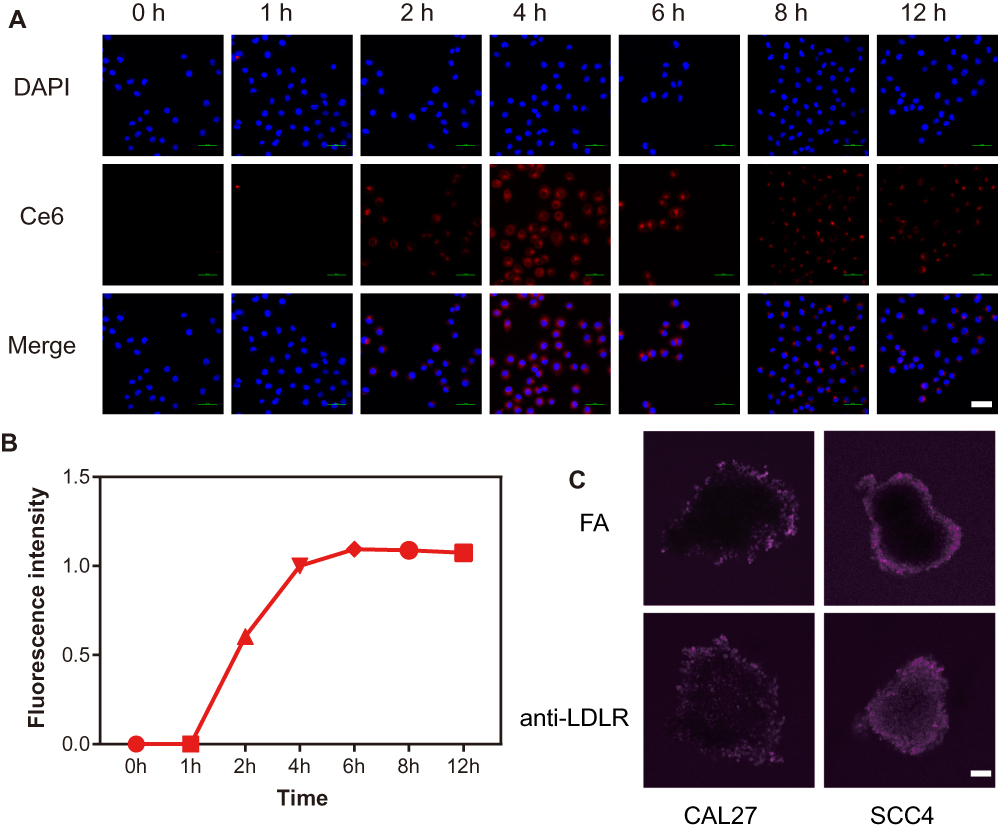 |
Figure 4 Cellular uptake and subcellular localization of CECMa. (A) Confocal fluorescence microscopic images of HSC3 cells incubated with CECMa. Cell nuclei were stained by DAPI. Scale bar: 50μm (B) Quantitative analysis of cellular fluorescence intensity. (C) CLSM images of CAL27 and SCC4 3D multicellular spheroids treated with NPs modified by FA or anti-LDLR. Scale bar: 100 μm. |
In vitro Study of Photodynamic-Enhanced Chemotherapy
The Cell Counting Kit-8 (CCK-8) toxicity assay was utilized to assess the in vitro phototherapeutic efficiency of NPs. As shown in Figure 5A, CDDP and metformin indeed had synergistic effects. CECMa exhibited better anticancer efficiency, which may due to the enhanced intracellular uptake given by the PEGed-Ce6 shell. Upon irradiation, NPs exhibited apparent anticancer activity against both HSC3 and FaDu cells (Figure 5A and Figure S8A). To assess the apoptosis and necrosis of the cells after different treatments, an apoptosis assay with an analysis of Annexin V and PI was performed. The results showed that metformin alone did not affect cell viability, whereas treatment with NPs or CDDP with metformin-induced cell apoptosis to a relatively small degree. But when HSC3 cells treated with NPs, after laser irradiation, the proportion of apoptosis remarkably increased (Figure 5B). The phototherapeutic effects of NPs were also distinguishable by Calcein-AM and PI co-staining. The control group or metformin group cells all survived. In contrast, after laser irradiation, much more red fluorescence can be detected for cells with NPs, and almost no living cells were observed following NP treatment (Figure 5C). These results were in great agreement with those results of flow cytometry analysis and the CCK-8 assay, and other research.20 Moreover, intracellular levels of reactive oxygen species (ROS) were detected using the DCFH-DA probe30 to study the enhanced eliminate on the target cancer cells. As shown in Figure 5D, under irradiation, CECMa-treated HSC3 cells generated a much more green fluorescent signal, suggesting a high level of ROS. Taken together, our results showed that CECMa could not only produce 1O2 but also enhance anti-cancer activity under laser irradiation.
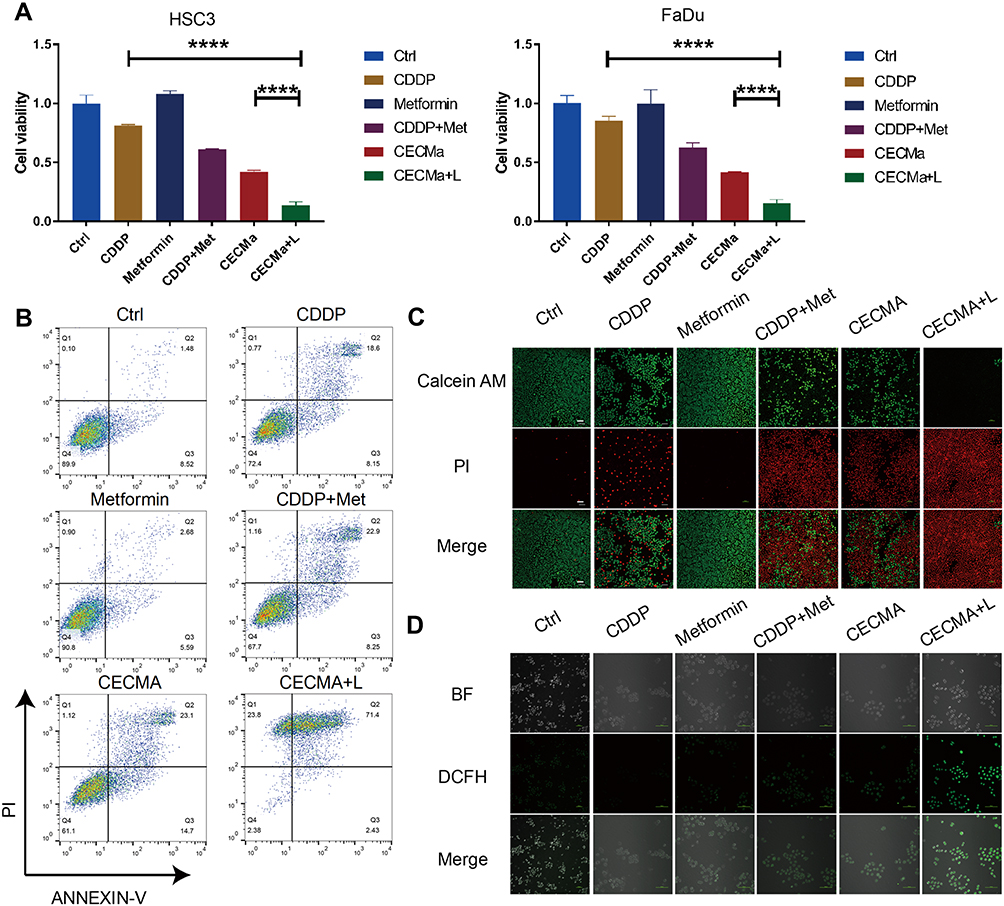 |
Figure 5 In vitro combined cancer PTT of CECMa. (A) Relative cell viability of HSC3 cells and FaDu cells incubated with a different agent in the dark or under irradiation with a 660 nm laser (1 W·cm−2, 10 min). (B) Flow cytometry showing the apoptosis of HSC3 cells under different conditions. (C) Fluorescence images of Calcein-AM and PI co-staining cancer cells with different treatments. Scale bar: 50 μm. (D) DCFDA fluorescence images of HSC3 cells incubated with different treatments, with excitation at 488 nm. Scale bar: 100 μm. Statistically significant differences were analyzed using Student’s t-test. ****P < 0.0001. Abbreviation: n. s., no significance. |
In vivo Study of Photodynamic-Enhanced Chemotherapy
We estimated if the enhanced PTT and chemotherapy of NPs could extend to the xenograft tumor model. The hemolysis test showed that there was no obvious hemolysis in mouse red blood cells (RBCs) with NPs treatment for 3 hrs, which meant the fine biocompatibility of the NPs (Figure 6A). At 4 hrs following injection, the temperature changes in the tumor sites were monitored with/without laser irradiation. The CECMa-injected tumor sites exhibited a temperature rise to about 46°C after 8 min of laser irradiation (Figure 6B), which enabled to ablate the tumor cells, while the surrounding normal tissue showed no obvious change. Otherwise, the tumor temperature did not show any significant changes with phosphate-buffered saline injection (Figure 6B). These results demonstrated the efficient PTT conversion ability of CECMa upon laser excitation in vivo. When the tumor volume was about 150 mm,3 HSC3 tumor-bearing mice were divided into seven groups to receive different disposes of saline only, free CDDP only, metformin only, CDDP+metformin, CE NPs + laser, CECMa only, and CECMa+laser. The tumor volumes of the control, as well as parallel groups, have gradually grown over time. However, the CECMa+laser group showed remarkable success in tumor elimination (Figure 6D and E and Figure S8B). These results showed the combined anticancer efficiency of PDT, PTT, and chemotherapy, which is consistent with the previous research.31 Moreover, hematoxylin and eosin (H&E) staining of the tumor after treatment showed that saline, metformin, and CDDP groups displayed cells without remarkable necrotic regions (Figure 6F). However, obvious necrotic areas were observed in the tumor tissue of the CECMa + laser group. In addition, mouse body weight increased slightly and consistently, did not show much difference between groups during treatment (Figure 6C), indicating negligible toxic effects in vivo. To further identify the proliferation potential of tumors with different treatments, tumor sections were stained with the Ki-67 marker. As shown in Figure 6G, the tumor cells in the control group stained strongly positive. In contrast, tumors in NPs + laser irradiation group showed lower Ki-67 staining, indicating that the proliferation ability of tumor cells was significantly weak. CDDP reportedly destroyed cancer cells by inducing DNA damage. To determine the level of DNA damage in xenografts, we measured the expression level of gamma-H2A histone family X (γ-H2AX), a marker of DNA double-strand breaks. As shown in Figure 6H, γ-H2AX was expressed in a scattered manner after CDDP treatment. γ-H2AX showed relatively higher expression when in combination with metformin. Furthermore, tumors treated with NPs after laser irradiation showed a very high level of γ-H2AX, indicating that there were significantly high levels of DNA double-strand breaks. Staining of heat shock protein 70 (Hsp 70) (Figure 6I), a molecular marker of heat stress, also showed that tumors treated with CECMa after laser irradiation could achieve PTT therapy. This tumor immunohistochemical results confirmed that CECMa and laser irradiation group exhibited the highest inhibition efficacy. Together, these results confirmed that CECMa may play as a desirable candidate for tumor-targeting drug delivery, which could significantly enhance cancer therapeutic effects with phototherapy and chemotherapy.
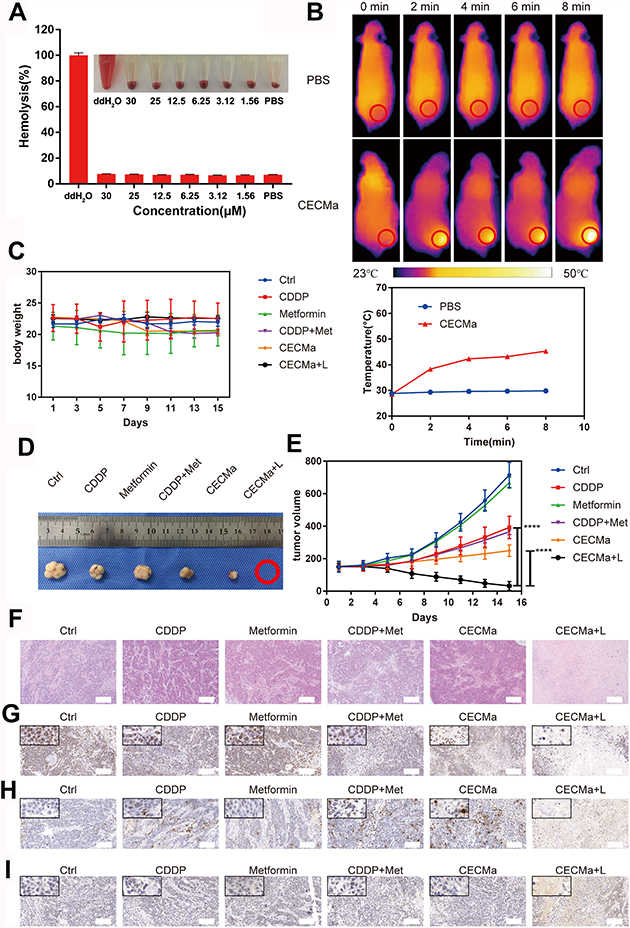 |
Figure 6 In vivo photothermal imaging and phototherapy of CECMa in tumor-bearing mice. (A) Hemolysis assay of RBCs treated with water, PBS, and different concentrations of CECMa for 3 h. Inset: Photographs of corresponding solutions after centrifugation. (B) Representative thermal images of tumor-bearing mice treated with PBS and CECMa at a different time of irradiation. Circles indicate the location of tumors and the tumor temperature changes based on the thermal imaging data. (C) Bodyweight of EMT6 tumor-bearing mice. (D) Images of tumors harvested at the end of treatment. (E) Tumor growth curves of the different groups of tumor-bearing mice after treatment. Error bars represent the standard error of the mean of four mice per group. Statistical significance indifference was analyzed using a paired Student’s t-test, ****P < 0.0001. (E) Comparison of the tumor mass at the end of treatment. Micrographs of H&E- (F), Ki-67- (G), γ-H2AX- (H), and HSP70- (I) stained tumors harvested from mice treated with different treatments. Statistically significant differences were analyzed using Student’s t-test: ****P < 0.0001. Scale bar: 200 μm. |
NPs Reduce the Systemic Toxicity of Chemotherapy
Considering that the injected nano-drug can leak into the circulation system as well as may prominently accumulate in body organs, major organs were collected after the experiment. Obvious damage or inflammation was not observed, suggesting good biocompatibility for CECMa. However, the kidneys tissue in the CDDP group showed much more swelling, as well as inflammatory cell infiltration compared with the control and CECMa groups (Figure 7A). In addition, we evaluate liver and renal functions after different treatments. RBC, WBC and platelet count remained nearly unchanged (Figure 7B). We detected liver function by measuring total protein, alanine aminotransferase, and aspartate transaminase levels, and detected renal function by assaying blood urea nitrogen and creatinine levels (Figure 7C). The levels of these metrics exhibited only slight changes compared with PBS. The active and passive targeting characteristics of NPs reduced the regular damage caused by CDDP to normal tissues and major organs. Therefore, we can expect the possible clinical translation of these NPs in the future, due to their low toxicity and biocompatibility.
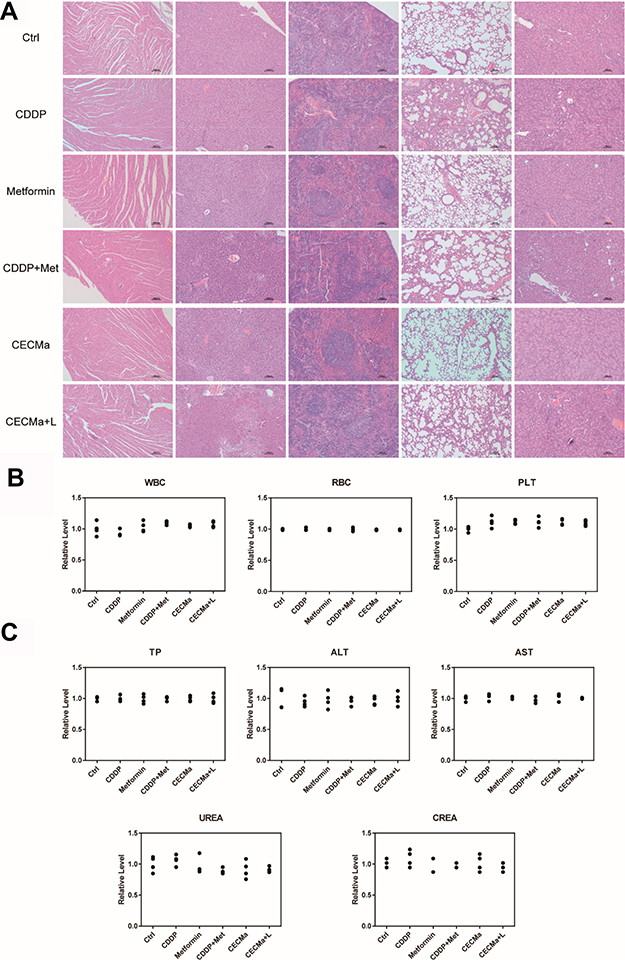 |
Figure 7 Biocompatibility evaluation after different treatments. (A) H&E-stained histological images of major organs collected after the different treatments. (B, C) Serum biochemical study and hematology assay after the different treatments. |
Conclusions
In summary, we used photosensitizers as delivery materials and targeted the delivery of drugs through tumor hypoxia markers. The light-triggered the in situ release of drug and phototherapy effects. This nano-drug delivery system improved the therapeutic effects on tumors and reduced the systemic toxicity of chemotherapy drugs in vivo experiments and may have great prospects in clinical transformation.
Acknowledgments
The work was supported by Jiangsu Provincial Key Research and Development Plan (BE2017741), Nanjing Foundation for Development of Science and Technology (2017sc512031), Jiangsu Provincial Natural Science Foundation (BK20180136, BK20180138), Nanjing Cancer Clinical Medical Center, the Project of Invigorating Health Care through Science, Technology and Education Jiangsu Provincial Medical Youth Talent (QNRC2016121) and the Fundamental Research Funds for the Central Universities (021414380442).
Disclosure
The authors report no conflicts of interest in this work.
References
1. Siegel RL, Miller KD, Jemal A. Cancer statistics, 2016. CA Cancer J Clin. 2016;66(1):7–30. doi:10.3322/caac.21332
2. Hinni ML, Ferlito A, Brandwein‐Gensler MS, et al. Surgical margins in head and neck cancer: a contemporary review. Head Neck. 2013;35(9):1362–1370. doi:10.1002/hed.23110
3. Zhang P, Liu J, Li W, Li S, Han X. Lactoferricin B reverses cisplatin resistance in head and neck squamous cell carcinoma cells through targeting PD-L1. Cancer Med. 2018. doi:10.1002/cam4.1529
4. Ou D, Blanchard P, Rosellini S, et al. Predictive and prognostic value of CT based radiomics signature in locally advanced head and neck cancers patients treated with concurrent chemoradiotherapy or bioradiotherapy and its added value to Human Papillomavirus status. Oral Oncol. 2017;71:150–155. doi:10.1016/j.oraloncology.2017.06.015
5. Espeli V, Zucca E, Ghielmini M, et al. Weekly and 3-weekly cisplatin concurrent with intensity-modulated radiotherapy in locally advanced head and neck squamous cell cancer. Oral Oncol. 2012;48(3):266–271. doi:10.1016/j.oraloncology.2011.10.005
6. Qiao Y, Zhang C, Li A, et al. IL6 derived from cancer-associated fibroblasts promotes chemoresistance via CXCR7 in esophageal squamous cell carcinoma. Oncogene. 2018;37(7):873–883. doi:10.1038/onc.2017.387
7. Bernad IP, Trufero JM, Urquizu LC, et al. Activity of weekly paclitaxel−cetuximab chemotherapy in unselected patients with recurrent/metastatic head and neck squamous cell carcinoma: prognostic factors. Clin Transll Oncol. 2017;19(6):769–776. doi:10.1007/s12094-016-1604-z
8. Liu A, Zhu J, Wu G, et al. Antagonizing miR-455-3p inhibits chemoresistance and aggressiveness in esophageal squamous cell carcinoma. Mol Cancer. 2017;16(1):106. doi:10.1186/s12943-017-0669-9
9. Jo Y, Choi N, Kim K, Koo H-J, Choi J, Kim HN. Chemoresistance of cancer cells: requirements of tumor microenvironment-mimicking in vitro models in anti-cancer drug development. Theranostics. 2018;8(19):5259. doi:10.7150/thno.29098
10. Ferreira JA, Peixoto A, Neves M, et al. Mechanisms of cisplatin resistance and targeting of cancer stem cells: adding glycosylation to the equation. Drug Resist Updates. 2016;24:34–54. doi:10.1016/j.drup.2015.11.003
11. Sahra IB, Le Marchand-brustel Y, Tanti J-F, Bost F. Metformin in cancer therapy: a new perspective for an old antidiabetic drug? Mol Cancer Ther. 2010;9(5):1092–1099. doi:10.1158/1535-7163.MCT-09-1186
12. Skinner HD, McCurdy MR, Echeverria AE, et al. Metformin use and improved response to therapy in esophageal adenocarcinoma. Acta Oncol (Madr). 2013;52(5):1002–1009. doi:10.3109/0284186X.2012.718096
13. Han S, Xu W, Wang Z, et al. Crosstalk between the HIF-1 and Toll-like receptor/nuclear factor-κB pathways in the oral squamous cell carcinoma microenvironment. Oncotarget. 2016;7(25):37773–37789. doi:10.18632/oncotarget.9329
14. Oh SS, Lee BF, Leibfarth FA, et al. Synthetic aptamer-polymer hybrid constructs for programmed drug delivery into specific target cells. J Am Chem Soc. 2014;136(42):15010–15015. doi:10.1021/ja5079464
15. Wang Y, Wang K, Zhao J, et al. Multifunctional mesoporous silica-coated graphene nanosheet used for chemo-photothermal synergistic targeted therapy of glioma. J Am Chem Soc. 2013;135(12):4799–4804. doi:10.1021/ja312221g
16. Beik J, Khademi S, Attaran N, et al. A nanotechnology-based strategy to increase the efficiency of cancer diagnosis and therapy: folate-conjugated gold nanoparticles. Curr Med Chem. 2017;24(39):4399–4416. doi:10.2174/0929867324666170810154917
17. Hoare T, Santamaria J, Goya GF, et al. A magnetically triggered composite membrane for on-demand drug delivery. Nano Lett. 2009;9(10):3651–3657. doi:10.1021/nl9018935
18. Muhamad N, Plengsuriyakarn T, Nabangchang K. Application of active targeting nanoparticle delivery system for chemotherapeutic drugs and traditional/herbal medicines in cancer therapy: a systematic review. Int J Nanomedicine. 2018;13:3921–3935. doi:10.2147/IJN.S165210
19. Beik J, Khateri M, Khosravi Z, et al. Gold nanoparticles in combinatorial cancer therapy strategies. Coord Chem Rev. 2019;387:299–324. doi:10.1016/j.ccr.2019.02.025
20. Alamzadeh Z, Beik J, Pirhajati Mahabadi V, et al. Ultrastructural and optical characteristics of cancer cells treated by a nanotechnology based chemo-photothermal therapy method. J Photochem Photobiol B. 2019;192:19–25. doi:10.1016/j.jphotobiol.2019.01.005
21. Shakeri-Zadeh A, Kamrava SK, Farhadi M, Hajikarimi Z, Maleki S, Ahmadi A. A scientific paradigm for targeted nanophotothermolysis; the potential for nanosurgery of cancer. Lasers Med Sci. 2014;29(2):847–853. doi:10.1007/s10103-013-1399-x
22. Mirrahimi M, Khateri M, Beik J, et al. Enhancement of chemoradiation by co-incorporation of gold nanoparticles and cisplatin into alginate hydrogel. J Biomed Mater Res B. 2019;107(8):2658–2663. doi:10.1002/jbm.b.34356
23. Israel LL, Braubach O, Galstyan A, et al. A combination of tri-leucine and angiopep-2 drives a polyanionic polymalic acid nanodrug platform across the blood-brain barrier. ACS Nano. 2019;13(2):1253–1271. doi:10.1021/acsnano.8b06437
24. Qiao H, Chen X, Chen E, et al. Folated pH-degradable nanogels for the simultaneous delivery of docetaxel and an IDO1-inhibitor in enhancing cancer chemo-immunotherapy. Biomater Sci. 2019;7(7):2749–2758. doi:10.1039/C9BM00324J
25. Hatley RJD, Barrett TN, Slack RJ, et al. The design of potent, selective and drug-like RGD αvβ1 small-molecule inhibitors derived from non-RGD α4β1 antagonists. Chem Med Chem. 2019;14(14):1315–1320. doi:10.1002/cmdc.201900359
26. Ding N, Zou Z, Sha H, et al. iRGD synergizes with PD-1 knockout immunotherapy by enhancing lymphocyte infiltration in gastric cancer. Nat Commun. 2019;10(1):1336. doi:10.1038/s41467-019-09296-6
27. Singh SR, Rameshwar P, Siegel P. Targeting tumor microenvironment in cancer therapy. Cancer Lett. 2016;380(1):203–204. doi:10.1016/j.canlet.2016.04.009
28. William RW, Michael PH. Targeting hypoxia in cancer therapy. Nat Rev Cancer. 2011;11(6):393. doi:10.1038/nrc3064
29. Liming W, Qiang S, Xin W, et al. Using hollow carbon nanospheres as a light-induced free radical generator to overcome chemotherapy resistance. J Am Chem Soc. 2015;137(5):1947–1955. doi:10.1021/ja511560b
30. Karunakaran SC, Babu PS, Madhuri B, et al. In vitro demonstration of apoptosis mediated photodynamic activity and NIR nucleus imaging through a novel porphyrin. ACS Chem Biol. 2012;8(1):127–132. doi:10.1021/cb3004622
31. Mirrahimi M, Abed Z, Beik J, et al. A thermo-responsive alginate nanogel platform co-loaded with gold nanoparticles and cisplatin for combined cancer chemo-photothermal therapy. Pharmacol Res. 2019;143:178–185. doi:10.1016/j.phrs.2019.01.005
 © 2020 The Author(s). This work is published and licensed by Dove Medical Press Limited. The full terms of this license are available at https://www.dovepress.com/terms.php and incorporate the Creative Commons Attribution - Non Commercial (unported, v3.0) License.
By accessing the work you hereby accept the Terms. Non-commercial uses of the work are permitted without any further permission from Dove Medical Press Limited, provided the work is properly attributed. For permission for commercial use of this work, please see paragraphs 4.2 and 5 of our Terms.
© 2020 The Author(s). This work is published and licensed by Dove Medical Press Limited. The full terms of this license are available at https://www.dovepress.com/terms.php and incorporate the Creative Commons Attribution - Non Commercial (unported, v3.0) License.
By accessing the work you hereby accept the Terms. Non-commercial uses of the work are permitted without any further permission from Dove Medical Press Limited, provided the work is properly attributed. For permission for commercial use of this work, please see paragraphs 4.2 and 5 of our Terms.