")
Back to Archived Journals » Hypoxia » Volume 7
Hypoxia Suppresses High Fat Diet-Induced Steatosis And Development Of Hepatic Adenomas
Authors Sweeney NW, Gomes CJ, De Armond R, Centuori SM , Parthasarathy S, Martinez JD
Received 29 May 2019
Accepted for publication 1 September 2019
Published 21 October 2019 Volume 2019:7 Pages 53—63
DOI https://doi.org/10.2147/HP.S217569
Checked for plagiarism Yes
Review by Single anonymous peer review
Peer reviewer comments 2
Editor who approved publication: Prof. Dr. Dörthe Katschinski
Nathan W Sweeney,1 Cecil J Gomes,1 Richard De Armond,2 Sara M Centuori,3 Sairam Parthasarathy,2 Jesse D Martinez3,4
1Cancer Biology Graduate Interdisciplinary Program, University of Arizona, Tucson, AZ, USA; 2University of Arizona Health Sciences Center for Sleep and Circadian Sciences, Division of Pulmonary, Allergy, Critical Care, and Sleep Medicine, Department of Medicine, University of Arizona, Tucson, AZ, USA; 3University of Arizona Cancer Center, University of Arizona, Tucson, AZ, USA; 4Department of Cellular and Molecular Medicine, Cell and Molecular Medicine, University of Arizona, Tucson, AZ, USA
Correspondence: Jesse D Martinez
University of Arizona Cancer Center, 1515 N. Campbell Avenue, Tucson, AZ 85724, USA
Tel +1520-626-4250
Email [email protected]
Purpose: Nonalcoholic fatty liver disease (NAFLD) is considered the most common form of silent liver disease in the United States and obesity is associated with increased risk of NAFLD. Obstructive sleep apnea (OSA) which is common in obese individuals is associated with a greater incidence of NAFLD, which in turn, increases the risk for hepatocellular carcinoma (HCC). It is unclear how obesity, OSA and NAFLD interrelate nor how they collectively contribute to an increased risk for developing HCC.
Patients and methods: Male BALB/c mice were exposed to diethylnitrosamine and phenobarbital followed by 48 weeks of either standard chow diet (chow), chow with hypoxia, high-fat diet, or a combination of hypoxia and high-fat diet. We noninvasively monitored tumor development using micro-CT imaging. We tracked the total weight gained throughout the study. We evaluated liver histology, fat accumulation, carbonic anhydrase 9 (CA9) and hypoxia-inducible factor 1-alpha (HIF-1α) expression, as well as, serum aspartate aminotransferase (AST) and alanine aminotransferase (ALT).
Results: A high-fat diet without hypoxia led to the development of obesity that induced hepatic steatosis and promoted tumorigenesis. Animals on a high-fat diet and that were also exposed to hypoxia had lower total weight gain, lower steatosis, lower serum AST and ALT levels, and fewer number of hepatic adenomas than a high-fat diet without hypoxia.
Conclusion: These findings suggest that hypoxia abrogates obesity, hepatic steatosis, and hepatic tumorigenesis related to a high-fat diet.
Keywords: hypoxia, diet, high fat, fatty liver
Introduction
Primary liver cancer is the second most common cause of cancer-related mortality globally and the seventh most common cause of cancer-related deaths in the United States.1 Incidence rates of hepatocellular carcinoma (HCC), the most common form (70–90%) of liver cancer, has nearly tripled over the past three decades.2 One factor that may account for the increasing incidence of HCC is obesity. Large scale epidemiological analyses have confirmed a strong link between an increase in liver cancer and obesity.3,4 A body-mass index (kg/m2) of ≥30.0 is significantly associated with higher rates of cancer-related deaths, including liver cancer.5
One co-morbidity associated with obesity is obstructive sleep apnea (OSA), a state of chronic intermittent hypoxia. OSA has been linked to liver disease, primarily nonalcoholic fatty liver disease (NAFLD) as well as increased cancer mortality6–8 and the chronic hypoxia caused by OSA can alter hepatic lipid metabolism and induce pathological changes in the liver that predispose to HCC.9,10 NAFLD occurs when excess fat is stored in the liver. NAFLD has become an important public health problem because of its high prevalence and potential progression to severe liver diseases, such as non-alcoholic steatohepatitis (NASH), cirrhosis, and liver failure.11,12 Diet-induced obesity (DIO) and hypoxia individually increase hepatic lipid accumulation, an essential characteristic of NAFLD, thereby creating a fertile soil for liver carcinogenesis.13,14 In HCC, hypoxia-inducible factor 1-alpha (HIF-1α) was consistently found to be overexpressed in tumor tissue.15 Hypoxia-induced HIF-1α signaling, exacerbates lipogenic pathways, accelerating NAFLD development which may give rise to HCC.13
Here we investigated both the independent and combined effect of hypoxia and a high-fat diet on the development of HCC. Our hypoxia model was induced by altering the fractional concentration of inspired oxygen within a computer-regulated sealed chamber in the absence of obesity and thus allowed us to investigate the individual and combined effects of diet-inducted obesity and hypoxia on the risk for developing HCC. We simulated chronic hypoxia (involving a combination of both intermittent and persistent hypoxia exposure) in order to simulate the hypoxia pattern in patients with severe OSA and obesity-hypoventilation syndrome. We found that mice injected with the carcinogen, diethylnitrosamine, and fed a high-fat diet developed liver steatosis and accelerated development of hepatocellular adenomas when compared to all other treatment groups – high fat with hypoxia, hypoxia alone, and normoxia with standard chow. Unexpectedly, we showed that hypoxia abated the effect of a high-fat diet on weight gain. Our results suggest that steatosis induced by a high-fat diet was a strong promoter of liver tumorigenesis and that hypoxia suppressed the many detrimental effects of high-fat diet on the liver including suppression of liver tumorigenesis. Finally, steatosis-related tumor development strongly correlated to HIF-1α mRNA and HIF-1α protein expression levels and may serve as a novel early therapeutic target.
Materials And Methods
Mouse Model And Tissue Collection
Hepatocarcinogenesis was induced as reported previously.16 At 28 days of age, mice were randomly assigned to either control or one of the four treatment groups. Age and gender-matched groups of mice without carcinogens or treatment were included in the study as additional controls. Mice were housed in an IACUC compliant facility with a 12 hr day/night light cycle and had access to standard mouse chow and water ad libitum. Mice were euthanized with CO2 gas 48 weeks post-initiation of treatment exposure. Immediately after euthanasia whole blood was collected by cardiac puncture and livers were harvested, washed in sterile saline, observed for gross pathology, photographed, and halved. Half of the liver was fixed in 10% formalin and embedded in paraffin, while the other half was snap frozen. All animal studies were approved by the Institutional Animal Care and Use Committee at the University of Arizona.
Nutritional Treatment
Diet-induced obesity groups were fed a high fat diet (Envigo, TD 06414) while all other mice were fed a standard chow diet (Envigo, 7013 NIH-31). All were maintained on the respective diet for the duration of the study.
Hypoxia Exposure
During the 12 hr light cycle, mice in the hypoxia groups were exposed to a combination of intermittent and persistent hypoxia. Intermittent hypoxia consisted of 10 cycles per hour for 3 hrs (ranging from 20.95% FiO2 to 9% FiO2), followed by 6 hrs of persistent hypoxia (9% O2), then another 3 hrs of intermittent hypoxia. The O2 concentration control was maintained by a computer-regulated flow of gas circulated through a sealed commercially designed chamber (OxyCycler A44XO, BioSpherix). During the 12 hr dark cycle, mice in the hypoxia groups were exposed to normoxia in the animal facility outside the chambers. A control normoxia group was exposed to a continuous flow of room air. Hypoxia exposure was continuously monitored and recorded via internal oxygen sensors built into the computer-regulated Oxycycler device and periodically cross-verified with external oxygen sensors (ISO-OXY-2, World Precision Instruments). Normoxia and hypoxia treatments were maintained for the duration of the study.
Micro-CT Set-Up, Acquisition, And Analysis
Microt-CT imaging and analysis was carried out as described and previously performed.17
Biochemical Assays
Serum ALT and AST were measured by the University Animal Care Pathological Services at The University of Arizona using the DRI-CHEM 7000 Chemistry Analyzer (Heska).
Quantitative Real-Time PCR
Total RNA was isolated from tissue using kits and manufacturer protocols. Additional detail on qPCR is provided in an online data supplement.
Immunohistochemistry Staining And Analysis
Histological preparations were done by the University of Arizona Tissue Acquisition and Cellular/Molecular Analysis Shared Resource (TACMASR). Pathological interpretation and scoring were performed by an experienced veterinary pathologist (D. Besselsen) blinded to the experimental design and sample group assignment. For more detail, see online data supplement.
Statistics
Statistical significance was determined using a repeated measures 2-way ANOVA to compare means of multiple groups. Differences among groups were carried out by the Mann–Whitney U-test. Ranking correlations were done using Spearman’s test. Data are expressed as mean ± SEM, and a P value of ≤0.05 was considered statistically significant.
Results
Hypoxia Suppresses The Weight Gain Induced By A High-Fat Diet
In order to test for an interaction between OSA-related hypoxia, steatosis and liver tumorigenesis we utilized mice as our model system. However, mice are not naturally prone to develop OSA even in the presence of obesity in part due to their upper airway anatomy. Therefore, in order to expose mice to hypoxia patterns that mimic OSA, mice were housed in hypoxia chambers during the light cycle every day for the duration of the experiment as described in Methods. In order to ensure that our hypoxia treatments successfully achieved hypoxia in the liver, we examined the expression of carbonic anhydrase 9 (CA9), a well-established marker of hypoxia, in liver sections from control and treatment animals.18–20 Sequential liver sections were immunohistochemically stained for CA9 and analyzed (Figure 1A). Image analysis of the resulting slides showed that the three experimental groups (D+P+Hx, D+P+HF, D+P+Hx+Hf) exhibited a marked increase in CA9 staining suggesting that our protocol achieved hypoxia in the livers of mice exposed to hypoxia (Figure 1B). Unexpectedly we also saw an increase in CA9 staining of obese animals that were fed the high-fat diet.
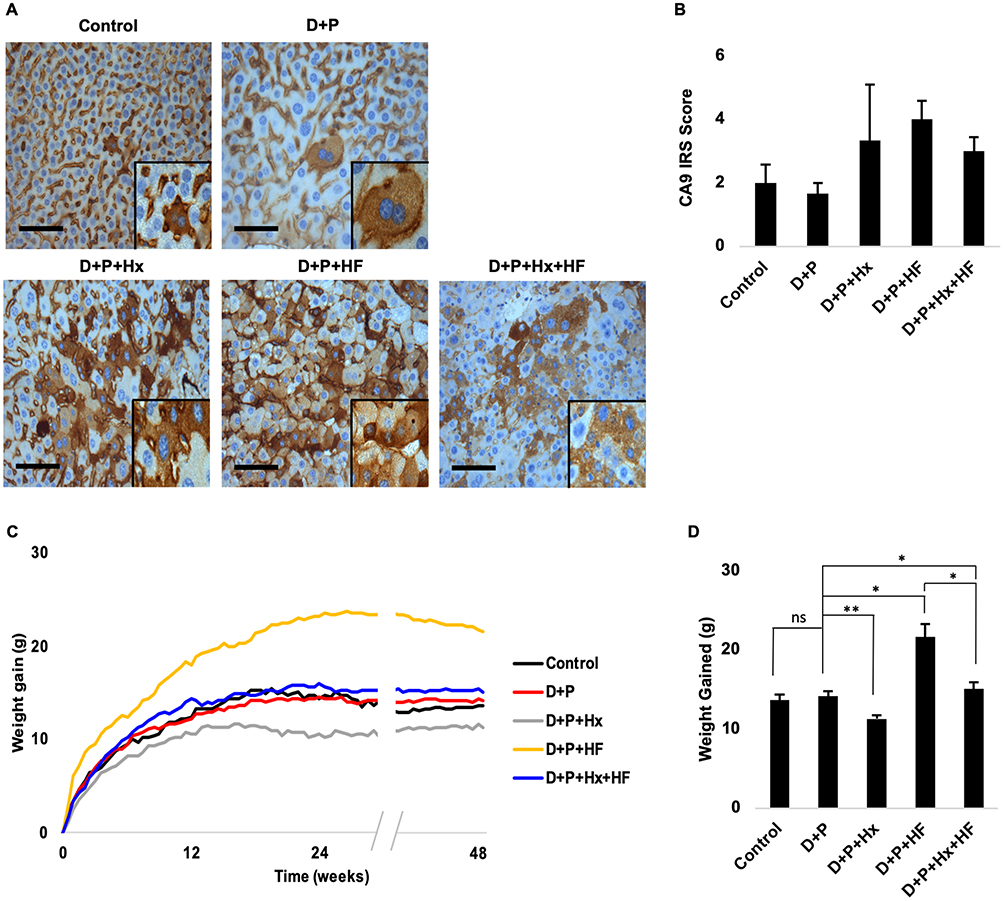 |
Figure 1 Male Balb/C mice were exposed to diethylnitrosamine and phenobarbital (D+P), or additionally exposed to hypoxia (D+P+Hx), given a high-fat diet (D+P+HF), or both hypoxia and a high-fat diet (D+P+Hx+HF) for 48 weeks. Control animals were left untreated. Weights of the animals were determined twice weekly. (A) Liver sections from control and treatment mice were immunostained with an anti-carbonic anhydrase antibody (CA9). (B) The extent of the staining in panel A was determined by the average immunoreactivity scoring (IRS) score for each of the groups. Each bar represents the mean ± s.e. Scale bar; 100 µm. (C) The average weight of the animals for control and each of the treatment groups over 48 weeks is shown. (D) Average weight gained at 48 weeks. Asterisks indicate a significant difference between the indicated group and D+P (*p ≤ 0.05, **p ≤ 0.01). N ≥ 4 mice per group. Abbreviation: ns, not significant. |
Because our hypothesis suggested that obesity is an important factor in liver tumorigenesis, we examined the weights of animals in our study which is graphed in Figure 1C. As can be seen mice in the two control groups, untreated (control) and carcinogen treated only (D+P) showed weight gain that plateaued around 12 weeks. Most animals attained a final weight gain of 11 to 14 grams (Figure 1D). As expected, weights of the animals on the high-fat diet (D+P+HF) continued to increase until about week 24. After that, the weight of these animals remained steady for the duration of the experiment. The average final weight gain of these animals was about 22 grams or about 8–10 grams more than the maximum weight of the control animals (Figure 1D). This weight gain was significantly greater than the animals in the control group D+P (p ≤ 0.05). Importantly, these animals attained obesity around week 22 which according to the Mouse Phenome Database is defined as two standard deviations above the average gross body weight of control mice. Surprisingly, weight gain of combination treatment animals (high fat + hypoxia, D+P+Hx+HF) did not follow the same trajectory. Instead weight gain in these animals was similar to the control groups (Figure 1C). Weight gain maximized at around 12 weeks and the final weight gain of these animals was about 12–15 grams (Figure 1D). This weight gain was significantly less than the high-fat diet group (D+P+HF; p < 0.05) which suggested that hypoxia could suppress weight gain induced by a high-fat diet. One potential explanation for this is that the combination group animals simply ate less food. To examine this, we measured food intake for both the high-fat group (D+P+HF) and the combination group (D+P+HF+Hx) over a period of several weeks. The results, graphed in Figure E1 (see online data supplement), show that the combination group consumed more food than did the high-fat only group (p ≤ 0.01). Hence, the reduced weight gain of the animals in the combination group could not be explained by reduced calorie intake. That hypoxia can suppress weight gain was further supported by the result that weight gain by the hypoxia only treated animals (D+P+Hx) was also less than the control groups (Figure 1C and D, p ≤ 0.01). Collectively our data show that animals on the high-fat diet attained obesity at around week 22 and this effect was suppressed when combined with hypoxia.
Micro-CT Images Reveal Tumor Burden In D+P+HF And D+P+H+HF Mice
We examined tumorigenesis in the groups in several ways. In the first method micro-computed tomography (CT) was used to quantify the tumors in each of the groups noninvasively. Micro-CT analysis performed at 48 weeks showed that out of the five groups the D+P+HF and D+P+Hx+HF groups had suspicious liver lesions (Figure 2A). Gross pathology examination of the livers taken at harvest time revealed liver lesions in all groups, although to varying degrees, except for control animals (Figure 2B and see Figure E2 in the online data supplement). Importantly, animals in the high-fat diet showed significantly greater numbers of liver lesions in gross pathology of all types and sizes when compared to the control group (p < 0.01) (see Figure E2 in the online data supplement). Next, we followed Thoolen et al for histological assessment of the liver tissue sections stained with hematoxylin and eosin (H&E) which enabled us to histologically classify the sections into four morphological types; normal liver tissue without liver lesions; hepatocellular foci of cellular alteration (foci); hepatocellular adenoma; and hepatocellular carcinoma (Figure 2C).21 We also examined the liver sections for markers of hepatic steatosis including microvesicular and macrovesicular steatosis; representative examples are shown in the D+P+HF and D+P+Hx+HF groups in Figure 2C. Histological analysis was used to determine the number of hepatocellular foci, adenomas, and carcinomas per mouse in control, D+P, D+P+Hx, D+P+HF, and D+P+Hx+HF mice after 48-weeks on study (Figure 3). Control mice exhibited no hepatic lesions of any kind. D+P mice had hepatocellular foci, but neither adenomas nor carcinomas were detected. Furthermore, hepatocellular foci were significantly greater in D+P+HF when compared to D+P+Hx+HF groups (p < 0.05). Adenomas were detected in the D+P+Hx, D+P+HF, and D+P+Hx+HF groups. The largest number of adenomas were seen in the D+P+HF group which was significantly greater than in either the D+P or D+P+Hx groups (p ≤ 0.01 and p ≤ 0.05, respectively). Taken together, these suggest that the effects of hypoxia can counteract the deleterious effect of a high-fat diet. Nevertheless, only one carcinomatous lesion developed in the entire experiment involving 20 animals and it was detected in the D+P+Hx+HF group.
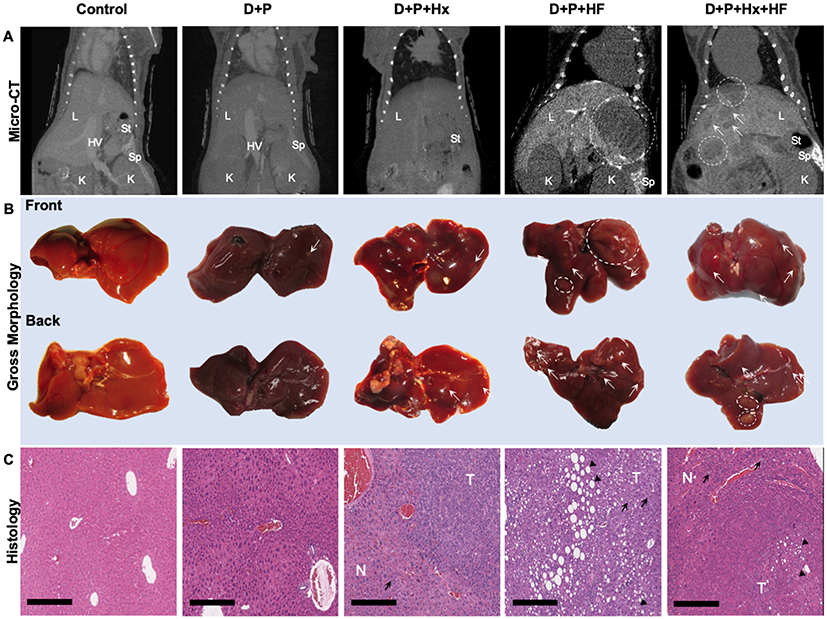 |
Figure 2 Liver tumor development was monitored using several methods. (A) Representative micro-CT images of mouse livers at 48 weeks on control, D+P, D+P+Hx, D+P+HF, and D+P+Hx+HF mice are shown. (B) The mice were euthanized at 48 weeks and the livers harvested. Pictures of gross morphology of the livers, front and back are shown for representative mice from each group. Dashed circles indicate grossly observed liver abnormalities >3mm. White arrows point to abnormalities <3mm in size. (C) A portion of the liver shown in panel B was fixed, embedded, and stained with hematoxylin and eosin (H&E). Images of stained sections from the liver of representative mice from each of the groups are shown. Magnification is 10x, and the scale bar represents 300 µm. Black arrowheads show macro- and microvesicular fatty change. Black arrows show diffused hyperplasia lipofuscin-laden kupffer cells. Abbreviations: L, liver; HV, hepatic vein; St, stomach; Sp, spleen; K, kidney; T, tumor; N, normal. |
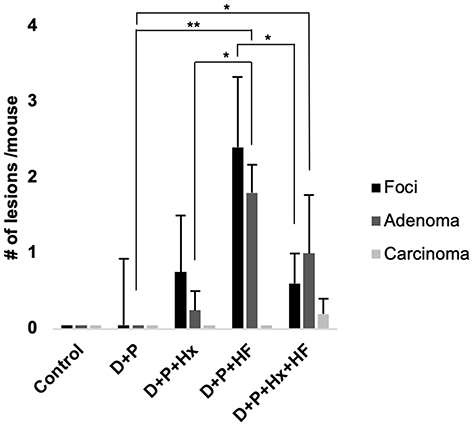 |
Figure 3 The average number of lesions per mouse was determined by histology. The bars depict the average number of foci of altered hepatocytes (foci, black bars), hepatocellular adenoma (adenoma, dark gray bars) and hepatocellular carcinoma (carcinoma, light gray bars) per mouse for control and each treatment group. Asterisks indicate a significant difference in the average number of adenomas between D+P and D+P+HF (**p <0.01) and D+P and D+P+Hx+HF (*p <0.05). N ≥ 3 mice per group. |
Increased Liver Fat Accumulation Positively Correlates With Hepatocellular Adenoma Formation
Our observation that the largest number of adenomas occurred in the D+P+HF group prompted us to quantify the extent of fat deposits in the liver and then to test whether fat accumulation could predict the development of adenomas. We quantified the average percent fat accumulation for each group by analyzing whole liver H&E stained slides as described in materials and methods. The results (Figure 4A) show that average percent liver fat accumulation for the D+P+HF group was significantly higher than the D+P group (p < 0.05) and was greater than the D+P+Hx+HF group indicating that fat accumulation was most prevalent in the livers of the D+P+HF animals. Consistent with this, we observed a greater incidence of microvesicular and macrovesicular steatosis in the livers of D+P+HF compared to all other groups (data not shown). We then tested whether the percent liver fat correlated with the development of hepatocellular adenomas and found a strong correlation between the two (r=0.7504; p < 0.001) (Figure 4B). Thus, a high-fat diet correlates with the development of hepatocellular adenomas.
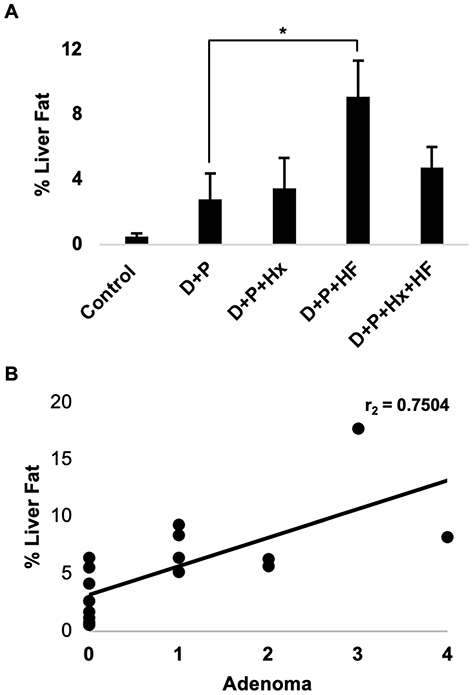 |
Figure 4 The percent of fat in the liver was determined from H&E stained liver sections for each of the groups as described in the materials and methods. (A) The bars depict the average percent liver fat accumulation for each of the groups. The asterisk indicates a statistical difference between D+P and D+P+HF (p <0.05). Error bars show standard error. (B) The percent liver fat was compared with the number of adenomas for all of the animal groups combined, and a Spearman’s rank correlation coefficient test was performed. The line depicts the correlation between the percent liver fat and the number of liver adenomas per animal (r=75, p=<0.001, n=17). *p<0.05. |
An HF Diet Increases The Presence Of Liver Injury-Associated Enzymes
Given the prevalence of hepatic lesions in some of the treatment groups we suspected that some of the groups might be experiencing liver damage. Two enzymes, aspartate aminotransferase (AST) and alanine aminotransferase (ALT), are well-known markers of liver injury and useful surrogate measures of NAFLD in humans. Hence, we sought to evaluate the state of the liver of the animals in our experimental groups by analyzing serum samples for AST and ALT. We found that serum levels of both AST and ALT tended to increase in both D+P+HF and D+P+Hx+HF groups relative to D+P (Figure 5A and D). When we compared AST and ALT serum levels with percent liver fat, we found a strong correlation between both enzymes and percent liver fat (p < 0.01) (Figure 5B and E) suggesting that the increase in liver fat, and therefore steatosis, resulted in hepatocellular injury. These results prompted us to test whether serum enzyme levels could predict adenoma formation. While we found a significant correlation between AST and hepatocellular adenomas (p < 0.05) we found no significant correlation between serum ALT levels and adenoma formation (Figure 5C and F). Taken together these results indicate that the steatosis caused by the highfat diet leads to hepatocellular injury and release of AST and ALT but that the degree of hepatocellular injury is only weakly associated with the development of liver adenomas.
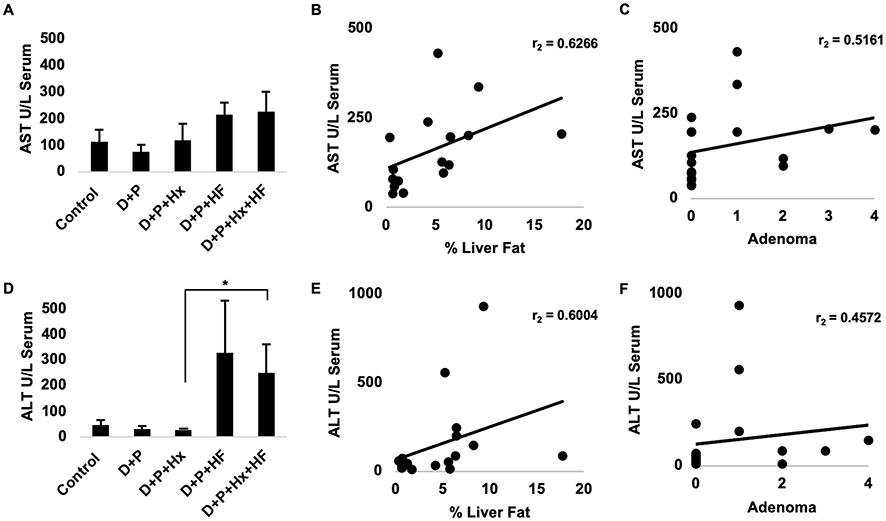 |
Figure 5 At 48 weeks mice were sacrificed. Whole blood was collected from control, D+P, D+P+Hx, D+P+HF, and D+P+Hx+HF mice, via cardiac puncture. Serum was separated from the whole blood and analyzed for the levels of alanine aminotransferase (ALT) and aspartate aminotransferase (AST). (A) Graphs the units per liter of serum. Each bar represents the average AST for all the animals in each of the groups. Error bar represents the standard error. (B) Data for AST levels and percent liver fat were pooled for all of the animals, and the levels of AST were compared with the percent liver fat using Spearman’s rank correlation coefficient test (r=0.63, p=<0.01, n=17). (C) A similar test for the correlation between serum AST levels and the number of adenomas per mouse was conducted also using the Spearman’s rank correlation coefficient test (r=0.52, p=<0.05, n=18). (D) The average serum levels of ALT in units per liter serum for each of the animal groups is depicted. Error bars represent the standard error. An asterisk indicates a statistically significant difference between groups (p <0.05). (E) Data for ALT serum levels and percent liver fat were pooled for all of the animals and the levels of ALT compared with the percent liver fat using Spearman’s rank correlation coefficient test (r=0.6, p=<0.02, n=17). (F) The graph shows a Spearman’s rank correlation coefficient test of ALT serum levels and the number of adenomas per animal (r=0.46, p=not significant, n=18). *p<0.05. |
HIF-1α Positively Correlates With Both Fat Accumulation And Adenoma Formation
Hypoxia is an initiator of several molecular processes that drive tumor development. For example, hypoxia-inducible factor 1-alpha (HIF-1α), a master regulator of hypoxic response, is overexpressed in HCC and has been identified as a pharmacological target for cancer prevention. We quantified HIF-1α expression in the livers of our test animals using qRT-PCR. The levels of HIF-1α in the D+P, D+P+Hx, and the D+P+HF+HF group showed levels of HIF-1a expression similar to each other (Figure 6A). Surprisingly, we found the highest increase of liver HIF-1α expression levels in the D+P+HF group which was significantly greater than either the hypoxia only (D+P+Hx) or the combination group (D+P+Hx+HF) (p ≤ 0.05). We verified our qRT-PCR results by analyzing VEGF (Figure 6B), a downstream target of HIF-1α, confirming our qRT-PCR findings of HIF-1α.
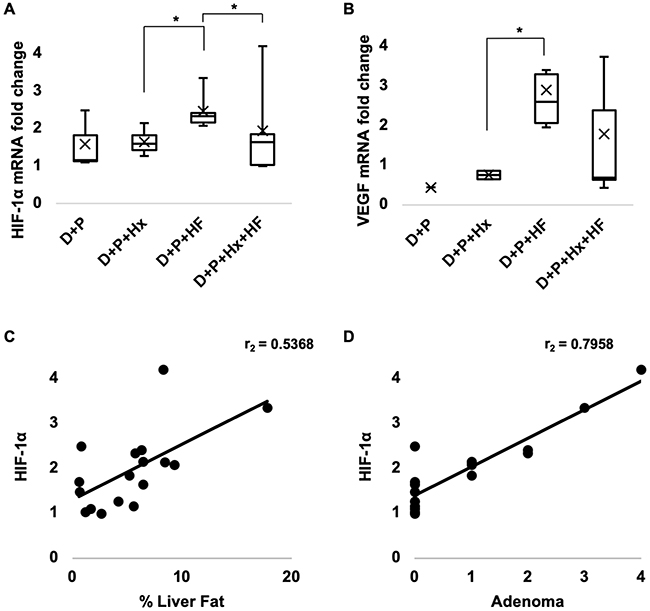 |
Figure 6 HIF-1α mRNA expression was analyzed for control, D+P, D+P+Hx, D+P+HF, and D+P+Hx+HF mice using qRT-PCR. (A) Box plots depict the fold change calculated using the 2−(ΔΔCt) method and normalized to GAPDH for each of the groups (n ≥3 mice per group). (B) Downstream target, VEGF (n ≥1 mouse per group). Asterisks indicate a significant difference between compared groups (*p ≤ 0.05). (C) HIF-1α expression levels were compared with the percentage of liver fat using Spearman’s rank correlation coefficient test (r=0.54, p=<0.05, n=17). (D) Similarly, HIF-1α expression levels compared with the average number of adenomas developed per mouse using Spearman’s rank correlation coefficient test (r=0.80, p=<0.001, n=17). |
These observations suggested that HIF-1α expression could be activated by the steatosis induced by the high-fat diet. To test this, we assessed the correlation between HIF-1α expression and percent liver fat and found a significant correlation between the two (p < 0.05) (Figure 6C). Next, we tested for and found a strong correlation between HIF-1α expression and the number of hepatocellular adenomas (p < 0.001) that developed in the test mice (Figure 6D). These results suggest that liver fat accumulation (steatosis) leads to increased expression of HIF-1α and that it promotes hepatocellular adenoma development.
Discussion
In this study, we examined the interaction between hypoxia (OSA), steatosis and hepatic tumorigenesis. Our initial intent was to determine whether hypoxia and obesity could act synergistically to enhance liver tumorigenesis. However, we encountered an unexpected issue that revealed a surprisingly complex relationship between these three factors. Our comparative obesity group of animals was placed on a high-fat diet in order to observe the effects that this had on the liver. As expected, these animals developed steatosis that was detected as fatty deposits throughout the liver and markers for liver damage became elevated. Importantly, this coincided with a significant increase in the number of liver adenomas suggesting that liver tumorigenesis was enhanced by steatosis.
In contrast, the combination group, fed a high-fat diet and also exposed to hypoxia, showed an unexpected lack of weight gain and did not become obese. Instead, the kinetics of weight gain and the final average weight of these animals was the same as the control and carcinogen only animals suggesting that hypoxia counteracted the weight gain caused by the high-fat diet. This lack of weight gain could not be explained by the animals eating less chow because measuring chow intake for animals in this group showed that they were eating significantly more than the high-fat diet group (Figure 1E). Importantly, other markers of liver dysfunction were also suppressed in the combination group. The livers of these animals showed fewer fatty deposits, and a reduction in the frequency of adenomas compared to the high-fat only animals suggesting that hypoxia could suppress the detrimental effects of a high-fat diet. That hypoxia suppressed the effects of a high-fat diet is supported by two additional observations. First, animals in the hypoxia only group (D+P+Hx) showed weights that were significantly less than the average weights of animals in the control groups. Second, we found that animals that were already obese from a high-fat diet and that were then transitioned to the hypoxia regimen lost weight after the transition until the average weights of these animals were the same as the control groups (data not shown). Thus, hypoxia not only suppresses the effects of a high-fat diet but can reverse its effects. This parallels findings in humans in that abrogation of hypoxia (by treating OSA) leads to weight gain in meta-analysis of studies assessing weight gain following treatment initiation for OSA with positive airway pressure therapy.22
We saw a similar relationship between the high-fat diet and hypoxia concerning liver tumorigenesis. The greatest number of liver adenomas occurred in the high-fat group (D+P+HF) while the other groups showed significantly fewer adenomas suggesting that hypoxia suppresses the development of adenomas that are associated with obesity and steatosis.
Although we observed numerous adenomas in the experimental groups only one carcinoma developed which occurred in a combination group animal even though significantly fewer adenomas developed in this group. We cannot draw conclusions from a single observation. However, it raises the intriguing possibility that neoplastic progression of adenomas in the liver is promoted by the combination of hypoxia with a high-fat diet. Further emphasizing hypoxia as a tumor promoter.23 It is evident that fat metabolism in these animals has been altered by hypoxia which manifested as reduced weight gain and the lack of fat accumulation in the liver. If correct, then it may be that neoplastic progression of adenomas is promoted by the altered lipid metabolism that occurs when hypoxia is combined with a high-fat diet.
Hypoxia-inducible factors are key transcriptional regulators that become activated in response to low oxygen levels in tissues and stimulate angiogenesis.24 Hence, we expected to see a stronger relationship between HIF-1a levels and hypoxia. However, recent evidence indicates that hypoxia-inducible factors also may promote hepatic lipid accumulation.25–27 Interestingly, we found that the highest levels of HIF-1a occurred in the high-fat group suggesting that lipid accumulation, in addition to hypoxia, stimulates HIF-1a expression. Unexpectedly, we found that combining a high-fat diet with hypoxia led to reduced HIF-1a expression compared to high fat only. This could be caused by the hypoxia suppressed fat accumulation which would be consistent with the notion that fat accumulation promotes HIF-1a expression. Alternatively, it may be that steatosis creates an “endogenous hypoxic” microenvironment near the pericentral hepatocytes which lead to an increase in the expression of HIF-1α.
Conclusion
Collectively our results suggest that hypoxia may be beneficial at least as it relates to a high-fat diet and the damage caused by fat accumulation in the liver (steatosis). This effect is not without precedent as it has been observed that individuals residing at high-altitude where they experience reduced oxygen leads to body weight reduction without physical exercise.28,29 However, it should be noted that the combination of a high-fat diet with hypoxia also resulted in an advanced neoplasm even though markers of liver damage were reduced. It seems evident that lipid metabolism in the combination group is abnormal. Hence, the abnormal metabolic environment created by this combination may not be beneficial with regard to liver tumorigenesis.
Ethics Approval And Informed Consent
All applicable Institutional Animal Care and Use Committee (IACUC, #13-431 and #07-029) guidelines at the University of Arizona for the care and use of animals were followed.
Data Availability
All data generated or analyzed during this study are available from the corresponding author on reasonable request.
Acknowledgments
This work was funded by a grant from the National Institute of Health (CA184920) to JDM. NWS and CJG were supported on T32 T32CA009213. SMC was supported by minority supplements T32CA009213-32S1 and R01CA129688-03S1. The research in this manuscript was directly supported by the Experimental Mouse Shared Resource and the Cancer Imaging Shared Resource at the University of Arizona Cancer Center all of which are funded by the National Cancer Institute Cancer Center Support Grant P30CA023074. We would like to give a special thanks to the Experimental Mouse Shared Resource at the University of Veterinary Pathologist David Besselsen, DVM, Ph.D.
Author Contributions
NWS, CJG, and RDA: tended the mice which involved 12 hr time points 7-days a week for 48-weeks; NWS: collected all of the data; NWS and SMC: participated in the statistical analysis of the data; NWS, CJG, SMC, and JDM: participated in the interpretation of the results; NWS: drafted the manuscript; SMC, SP, and JDM: critically reviewed the manuscript; all authors read and approved the final manuscript. All authors contributed to data analysis, drafting or revising the article, gave final approval of the version to be published, and agree to be accountable for all aspects of the work.
Disclosure
SP reports grants from NIH/NHLBI, grants from Patient Centered Outcomes Research Institute, grants from US Department of Defense, grants from NIH (National Cancer Institute) NCI, grants from Johrei Institute, personal fees from American Academy of Sleep Medicine, non-financial support from National Center for Sleep Disorders Research of the NIH (NHLBI), personal fees from UpToDate Inc., grants from Younes Sleep Technologies, Ltd., personal fees from Vapotherm, Inc., personal fees from Merck, Inc., grants from Philips-Respironics, Inc., personal fees from Philips-Respironics, Inc., personal fees from Bayer, Inc., grants from Merck, Inc, grants from NIH/NIMHD, grants from American Academy of Sleep Medicine Foundation, grants from Merck, Inc., grants from Jazz Pharmaceuticals, outside the submitted work. In addition, SP has a patent UA 14-018 U.S.S.N. 61/884,654; PTAS 502570970 (home breathing device) issued. JDM reports grants from National Institutes of Health (USA), during the conduct of the study. The authors report no other conflicts of interest in this work.
References
1. Torre LA, Siegel RL, Ward EM, Jemal A. Global cancer incidence and mortality rates and trends–an update. Cancer Epidemiol Biomarkers Prev. 2016;25(1):16–27. doi:10.1158/1055-9965.EPI-15-0578
2. Alkhouri N, Dixon LJ, Feldstein AE. Lipotoxicity in nonalcoholic fatty liver disease: not all lipids are created equal. Expert Rev Gastroenterol Hepatol. 2009;3(4):445–451. doi:10.1586/egh.09.32
3. Basen-Engquist K, Chang M. Obesity and cancer risk: recent review and evidence. Curr Oncol Rep. 2011;13(1):71–76. doi:10.1007/s11912-010-0139-7
4. Cao Y. Adipocyte and lipid metabolism in cancer drug resistance. J Clin Invest. 2019;129(8):3006–3017. doi:10.1172/JCI127201
5. Calle EE, Rodriguez C, Walker-Thurmond K, Thun MJ. Overweight, obesity, and mortality from cancer in a prospectively studied cohort of U.S. adults. N Engl J Med. 2003;348(17):1625–1638. doi:10.1056/NEJMoa021423
6. Lee W, Nagubadi S, Kryger MH, Mokhlesi B. Epidemiology of obstructive sleep apnea: a population-based perspective. Expert Rev Respir Med. 2008;2(3):349–364. doi:10.1586/17476348.2.3.349
7. Campos-Rodriguez F, Martinez-Garcia MA, Martinez M, et al. Association between obstructive sleep apnea and cancer incidence in a large multicenter spanish cohort. Am J Respir Crit Care Med. 2013;187(1):99–105. doi:10.1164/rccm.201209-1671OC
8. Corey KE, Misdraji J, Gelrud L, et al. Obstructive sleep apnea is associated with nonalcoholic steatohepatitis and advanced liver histology. Dig Dis Sci. 2015;60(8):2523–2528. doi:10.1007/s10620-015-3650-8
9. Suzuki T, Shinjo S, Arai T, Kanai M, Goda N. Hypoxia and fatty liver. World J Gastroenterol. 2014;20(41):15087–15097. doi:10.3748/wjg.v20.i41.15087
10. Iwamoto H, Abe M, Yang Y, et al. Cancer lipid metabolism confers antiangiogenic drug resistance. Cell Metab. 2018;28(1):104–117.e5. doi:10.1016/j.cmet.2018.05.005
11. Fabbrini E, Sullivan S, Klein S. Obesity and nonalcoholic fatty liver disease: biochemical, metabolic, and clinical implications. Hepatology. 2010;51(2):679–689. doi:10.1002/hep.23280
12. Dixon JB, Bhathal PS, O ’brien PE. Liver, pancreas, and biliary tract nonalcoholic fatty liver disease: predictors of nonalcoholic steatohepatitis and liver fibrosis in the severely obese. Gastroenterology. 2001;121(1):91–100. doi:10.1053/gast.2001.25540
13. Drager LF, Li J, Reinke C, Bevans-Fonti S, Jun JC, Polotsky VY. Intermittent hypoxia exacerbates metabolic effects of diet-induced obesity. Obesity. 2011;19(11):2167–2174. doi:10.1038/oby.2011.240
14. Calzadilla Bertot L, Adams LA. The natural course of non-alcoholic fatty liver disease. Int J Mol Sci. 2016;17:5. doi:10.3390/ijms17050774
15. Huang G-W, Yang L-Y, Lu W-Q. Expression of hypoxia-inducible factor 1alpha and vascular endothelial growth factor in hepatocellular carcinoma: impact on neovascularization and survival. World J Gastroenterol. 2005;11(11):1705–1708. doi:10.3748/wjg.v11.i11.1705
16. Klaunig JE, Pereira MA, Ruch RJ, Weghorst CM. Dose-response relationship of diethylnitrosamine-initiated tumors in neonatal Balb/c mice: effect of phenobarbital promotion. Toxicol Pathol. 1988;16(3):381–385. doi:10.1177/019262338801600310
17. Sweeney N, Marchant S, Martinez JD. Intraperitoneal injections as an alternative method for micro-CT contrast enhanced detection of murine liver tumors. Biotechniques. 2019;66(5):214–217. doi:10.2144/btn-2018-0162
18. Kaanders JH, Wijffels KI, Marres HA, et al. Pimonidazole binding and tumor vascularity predict for treatment outcome in head and neck cancer. Cancer Res. 2002;62(23):7066–7074.
19. Olive PL, Aquino-Parsons C, MacPhail SH, et al. Carbonic anhydrase 9 as an endogenous marker for hypoxic cells in cervical cancer. Cancer Res. 2001;61(24):8924–8929.
20. Casillas AL, Toth RK, Sainz AG, et al. Hypoxia-inducible PIM kinase expression promotes resistance to antiangiogenic agents. Clin Cancer Res. 2018;24(1):169–180. doi:10.1158/1078-0432.CCR-17-1318
21. Thoolen B, Maronpot RR, Harada T, et al. Proliferative and nonproliferative lesions of the rat and mouse hepatobiliary system. Toxicol Pathol. 2010;38:5–81. doi:10.1177/0192623310386499
22. Drager LF, Brunoni AR, Jenner R, Lorenzi-Filho G, Bensenor IM, Lotufo PA. Effects of CPAP on body weight in patients with obstructive sleep apnoea: a meta-analysis of randomised trials. Thorax. 2015;70(3):258–264. doi:10.1136/thoraxjnl-2014-205361
23. Yoon DW, So D, Min S, et al. Accelerated tumor growth under intermittent hypoxia is associated with hypoxia-inducible factor-1-dependent adaptive responses to hypoxia. Oncotarget. 2017;8(37):61592–61603. doi:10.18632/oncotarget.18644
24. Krock BL, Skuli N, Simon MC. Hypoxia-induced angiogenesis: good and evil. Genes Cancer. 2011;2(12):1117–1133. doi:10.1177/1947601911423654
25. Mesarwi OA, Shin M-K, Bevans-Fonti S, et al. Hepatocyte hypoxia inducible factor-1 mediates the development of liver fibrosis in a mouse model of nonalcoholic fatty liver disease. PLoS One. 2016;11(12):e0168572. doi:10.1371/journal.pone.0168572
26. Shin M-K, Drager LF, Yao Q, et al. Metabolic consequences of high-fat diet are attenuated by suppression of HIF-1α. Ye J, ed. PLoS One. 2012;7(10):e46562. doi:10.1371/journal.pone.0046562
27. Ju C, Colgan SP, Eltzschig HK. Hypoxia-inducible factors as molecular targets for liver diseases. J Mol Med (Berl). 2016;94:613. doi:10.1007/S00109-016-1408-1
28. Lippl FJ, Neubauer S, Schipfer S, et al. Hypobaric hypoxia causes body weight reduction in obese subjects. Obesity. 2010;18(4):675–681. doi:10.1038/oby.2009.509
29. Palmer BF, Clegg DJ. Ascent to altitude as a weight loss method: the good and bad of hypoxia inducible factor activation. Obesity (Silver Spring). 2014;22(2):311–317. doi:10.1002/oby.20499
 © 2019 The Author(s). This work is published and licensed by Dove Medical Press Limited. The full terms of this license are available at https://www.dovepress.com/terms.php and incorporate the Creative Commons Attribution - Non Commercial (unported, v3.0) License.
By accessing the work you hereby accept the Terms. Non-commercial uses of the work are permitted without any further permission from Dove Medical Press Limited, provided the work is properly attributed. For permission for commercial use of this work, please see paragraphs 4.2 and 5 of our Terms.
© 2019 The Author(s). This work is published and licensed by Dove Medical Press Limited. The full terms of this license are available at https://www.dovepress.com/terms.php and incorporate the Creative Commons Attribution - Non Commercial (unported, v3.0) License.
By accessing the work you hereby accept the Terms. Non-commercial uses of the work are permitted without any further permission from Dove Medical Press Limited, provided the work is properly attributed. For permission for commercial use of this work, please see paragraphs 4.2 and 5 of our Terms.