")
Back to Journals » International Journal of General Medicine » Volume 14
Hypoxia-Related Gene-Based Signature Can Evaluate the Tumor Immune Microenvironment and Predict the Prognosis of Colon Adenocarcinoma Patients
Authors He X, Ding J, Cheng X, Xiong M
Received 19 October 2021
Accepted for publication 1 December 2021
Published 16 December 2021 Volume 2021:14 Pages 9853—9862
DOI https://doi.org/10.2147/IJGM.S343216
Checked for plagiarism Yes
Review by Single anonymous peer review
Peer reviewer comments 2
Editor who approved publication: Dr Scott Fraser
Xiaobo He,1 Jianfeng Ding,1 Xiao Cheng,2 Maoming Xiong1
1Department of General Surgery, First Affiliated Hospital of Anhui Medical University, Hefei, Anhui, 230022, People’s Republic of China; 2Ningbo Diagnostic Pathology Center Department of Pathology, Ningbo, Zhejiang, 315021, People’s Republic of China
Correspondence: Maoming Xiong Email [email protected]
Background: Colon adenocarcinoma (COAD) is a common gastrointestinal tumor and often occurs in the left colon with a poor prognosis. The progression of COAD is closely related to the tumor microenvironment, especially the hypoxia. Currently, few studies have reported the correlation between hypoxia-related genes and the prognosis of COAD patients. Furthermore, we constructed a prognostic model using four hypoxia-related genes to predict the prognosis of COAD patients.
Methods: The mRNA expression profiles and corresponding clinicopathological data were downloaded from The Cancer Genome Atlas (TCGA) and Gene Expression Omnibus (GEO). The string online analysis tool was used to construct a protein–protein interaction network (PPI) of hypoxia-related genes. Kaplan–Meier curve was used to analyze the relationship of hypoxia risk score and the overall survival of COAD patients, and the receiver operating characteristic (ROC) curve was used to assess the reliability.
Results: We screened out four hypoxia genes, including TKTL1 (transketolase like 1), SLC2A3 (solute carrier family 2 member 3), ALDOB (aldolase, fructose-bisphosphate B) and ENO3 (enolase 3), which were used to construct a hypoxia risk model to predict the overall survival of COAD patients. Besides, we also found that the hypoxia risk score was correlated with the immunosuppression of tumor microenvironment.
Conclusion: The model we constructed with four survival-related hypoxia genes, including TKTL1, SLC2A3, ALDOB and ENO3, could be used to predict the overall survival of COAD patients with high stability.
Keywords: bioinformatic analysis, hypoxia risk model, tumor microenvironment, colon adenocarcinoma, prognosis
Introduction
Colon adenocarcinoma (COAD) is a common type of malignant gastrointestinal tumor that occurs more in the left colon. The incidence of COAD in Asia was increasing rapidly in the past ten years, and patients with COAD usually have a poor prognosis due to recurrence.1,2 According to a WHO report in 2018, 1.8 million COAD cases were diagnosed and accounted for 10.2% of all cancer cases.3 More and more studies have reported the role of hypoxia in tumor formation and progression. According to a study by Liu et al, hypoxia promoted the invasiveness and angiogenesis of colon cancer by upregulating the Orai1 expression.4 Hypoxia also enhanced the ability of tumor metastasis by changing the composition of extracellular matrix, such as HIF1 (Hypoxia-inducible factor 1), P4HA2 (prolyl 4-hydroxylase α-subunit isoform 2), and PLOD1 (procollagen-lysine 2-oxoglutarate 5-dioxygenase 1).5–7 Moreover, hypoxia regulated anticancer drug resistance, apoptosis, autophagy and epithelial-mesenchymal transition of cancer cells by activating hypoxia-related genes. According to a report, hypoxia decreased chemotherapeutic sensitivity of colon cancer by upregulating MDR1 (multidrug resistance 1) expression.8 Similarly, hypoxia inhibited DNA-damage-induced cell apoptosis by antagonizing the function of CEP-1, the homolog of the tumor suppressor p53.9
Hypoxia-induced immunosuppression and immune escape of cancer cells have aroused wide attention. Previous research revealed that immune cells (including T cells and natural killer cells) were inhibited or in a nonfunctional state under a hypoxic microenvironment.10,11 Hypoxia also caused immunosuppression by inhibiting the function of CD4+ effector T cell and increasing the amount of suppressive cells (regulatory T cells and tumor-associated macrophages) or cytokines (IL-10, TGFB1, and ARG1).12,13 Some immune genes in the tumor microenvironment, such as SLC10A2 (solute carrier family 10 member 2), CXCL3 (CX-C motif chemokine ligand 3) and IGHV5-51 (immunoglobulin heavy variable 5–51), could be used to predict the prognosis of tumor patients.14 Besides, hypoxia regulated the amount of immune cells and the expression of immune genes. Hence, hypoxia could trigger the immunosuppression of tumor microenvironment, and it is necessary to construct a prognostic model using hypoxia-related genes.
With the development of various online databases, including TCGA (https://portal.gdc.cancer.gov/), GEO (https://www.ncbi.nlm.nih.gov/geo/) and TIP (http://biocc.hrbmu.edu.cn/TIP/), we can use large amounts of data to obtain reliable analysis results. In this study, we constructed a hypoxia risk model with four survival-related hypoxia genes to reflect the immune microenvironment and predict the prognosis of COAD patients. Shortly, this model may guide clinicians to formulate more appropriate therapies and improve the overall survival of COAD patients.
Materials and Methods
Datasets
The RNA-seq transcriptome data and corresponding clinicopathological data of 437 COAD patients were downloaded from TCGA (https://portal.gdc.cancer.gov/) as a train set, and the consistent data of 177 COAD patients were downloaded from GEO (GSE17536) as a validation set. Hypoxia gene set and tumor immune gene set were downloaded from GSEA (https://www.gsea-msigdb.org/gsea/index.jsp) and TIP (http://biocc.hrbmu.edu.cn/TIP/), respectively.
Construction of Protein–Protein Interaction (PPI) Network
STRING database (https://string-db.org/; August 20th, 2021) was used to construct a protein–protein interaction network with hypoxia-related genes. Then the R programming language was utilized to calculate the number of each node’s (each node represents a hypoxia gene) interconnections and the result was shown in a bar plot. The more interconnections a gene had, the more likely that this gene was a critical hypoxia-related gene.
Filtration of Prognosis-Related Hypoxia Genes
Information including the expression of hypoxia genes, the survival status, and survival time of COAD patients were extracted from the datasets we downloaded. The survival package of R programming language was used for univariate Cox analysis and multivariate Cox analysis to identify the prognosis-related hypoxia genes. P<0.05 was considered statistically significant.
Establishment of a Risk Model
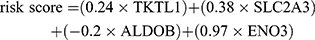
The hypoxia genes screened out by univariate Cox analysis and multivariate Cox analysis were used to constitute a risk model. The formula to calculate the risk score was:

In this formula, n was the number of hypoxia genes we screened out;  was the sequence number of each hypoxia gene; Expi and Coei represented the expression quantity and its corresponding multivariable Cox regression coefficient of each hypoxia gene.
Analysis on the Relationship of the Risk Score and Patients’ Overall Survival
All COAD patients were divided into the high-hypoxia-risk group and low-hypoxia-risk group according to the median value of hypoxia risk score in both train set and validation set. Then, the survival package and survminer package of R programming language were utilized to perform univariate Cox analysis and multivariate Cox analysis to confirm the risk score as an independent risk factor for OS (overall survival) in COAD. Kaplan–Meier analysis was also conducted to compare the OS in two groups. Finally, a ROC curve was generated to assess the risk model’s accuracy and reliability in predicting the prognosis of COAD patients.
Gene Set Enrichment Analysis (GSEA)
To further verify the differential expression of the hypoxia gene set in the high-risk group and the low-risk group of the two sets, GSEA was performed to evaluate the enrichment of hallmark gene sets (h.all.v7.2.symbols.gmt). The gene set permutation was conducted 1000 times for this analysis.
Infiltration of Immune Cells and Expression of Related Immune Genes
As an online analytic tool, CIBERSORT (https://cibersort.stanford.edu/) could be used to provide the proportions of the various cells in a mixed cell population with RNA-seq transcriptome data.15 So, we used CIBERSORT to acquire the infiltration of various immune cells in high-risk group and low-risk group. The limma package of R programming language was used to compare the expression of immune genes in two groups.
Results
Preliminary Filtration of Hypoxia-Related Genes Using PPI
We downloaded the hypoxia-related gene set from Gene Set Enrichment Analysis (hallmark-hypoxia), which contained 200 hypoxia-related genes. Then these genes were used to constitute a protein–protein interaction network (PPI) with the STRING online database (https://string-db.org/) to screen out the essential genes (Figure 1A). In this network, each node represented a hypoxia-related gene. If two genes are connected, there is some interaction between them. Fifty genes with the highest interaction levels were preserved and shown in a histogram (Figure 1B). The more connections a hypoxia gene had, the more likely it was a critical hypoxia gene.
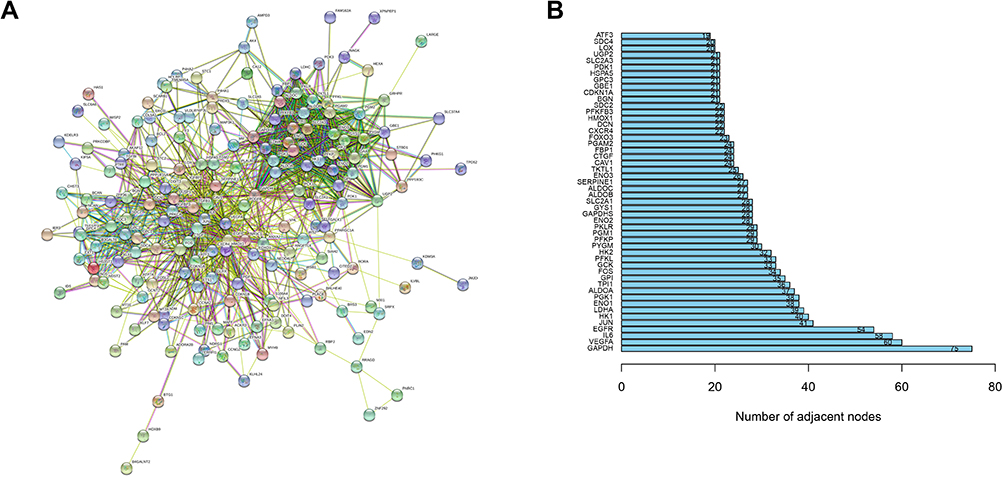 |
Figure 1 Preliminary filtration of hypoxia-related essential genes using PPI. (A) The protein–protein interaction network constructed with 200 hypoxia-related genes; (B) the 50 genes with the highest interaction levels. |
Identifying Prognosis-Related Hypoxia Genes Using Univariate and Multivariate Cox Analysis
We extracted the patients’ survival time, survival status, and the expression of the 50 hypoxia genes with the highest interaction levels. The survival package of R programming language was used to conduct univariate and multivariate Cox analysis in the train set. According to the result of univariate Cox analysis, six hypoxia genes, including TKTL1, SERPINE1, ALDOB, ENO2, SLC2A3, and ENO3, were found to be closely related to the survival of COAD patients (Figure 2A). Moreover, the result of multivariate Cox analysis indicated that four hypoxia genes, including TKTL1, ALDOB, SLC2A, and ENO3, could act as an independent prognostic factor for COAD patients (Figure 2B). So, the four hypoxia genes were utilized to constitute a risk model to predict COAD patients’ survival.
 |
Figure 2 Identifying prognosis-related hypoxia genes using univariate and multivariate Cox analysis. (A) The univariate Cox analysis result of 50 hypoxia genes; (B) the multivariate Cox analysis result of 50 hypoxia genes. |
Using Four Prognosis-Related Hypoxia Genes to Construct a Risk Model That Could Predict the Survival of COAD Patients
The correlation analysis of 4 prognosis-related hypoxia genes was conducted before constructing a risk model. As is shown in Figure 3A, the four genes had a poor correlation with each other. This feature enabled them to exclude each other’s influence in the process of calculating the hypoxia risk score and constitute a more accurate risk model. According to the multivariable Cox regression coefficients of 4 genes calculated by the R programming language, we gained the risk score formula:
 The COAD patients in 2 sets were divided into the high-risk group and the low-risk group, respectively, referring to the median value of risk score (Figure 3B). Furthermore, we found that the expression of the four hypoxia genes was significantly different in two groups (Figure 3C). To further identify the prognostic value of hypoxia risk score in COAD patients, we conducted the univariate and multivariate Cox analysis of patients’ age, gender, TNM stage, and hypoxia risk score. The results indicated that the hypoxia risk score could be used as an independent prognostic factor to predict COAD patients’ survival (Figure 3D and E).
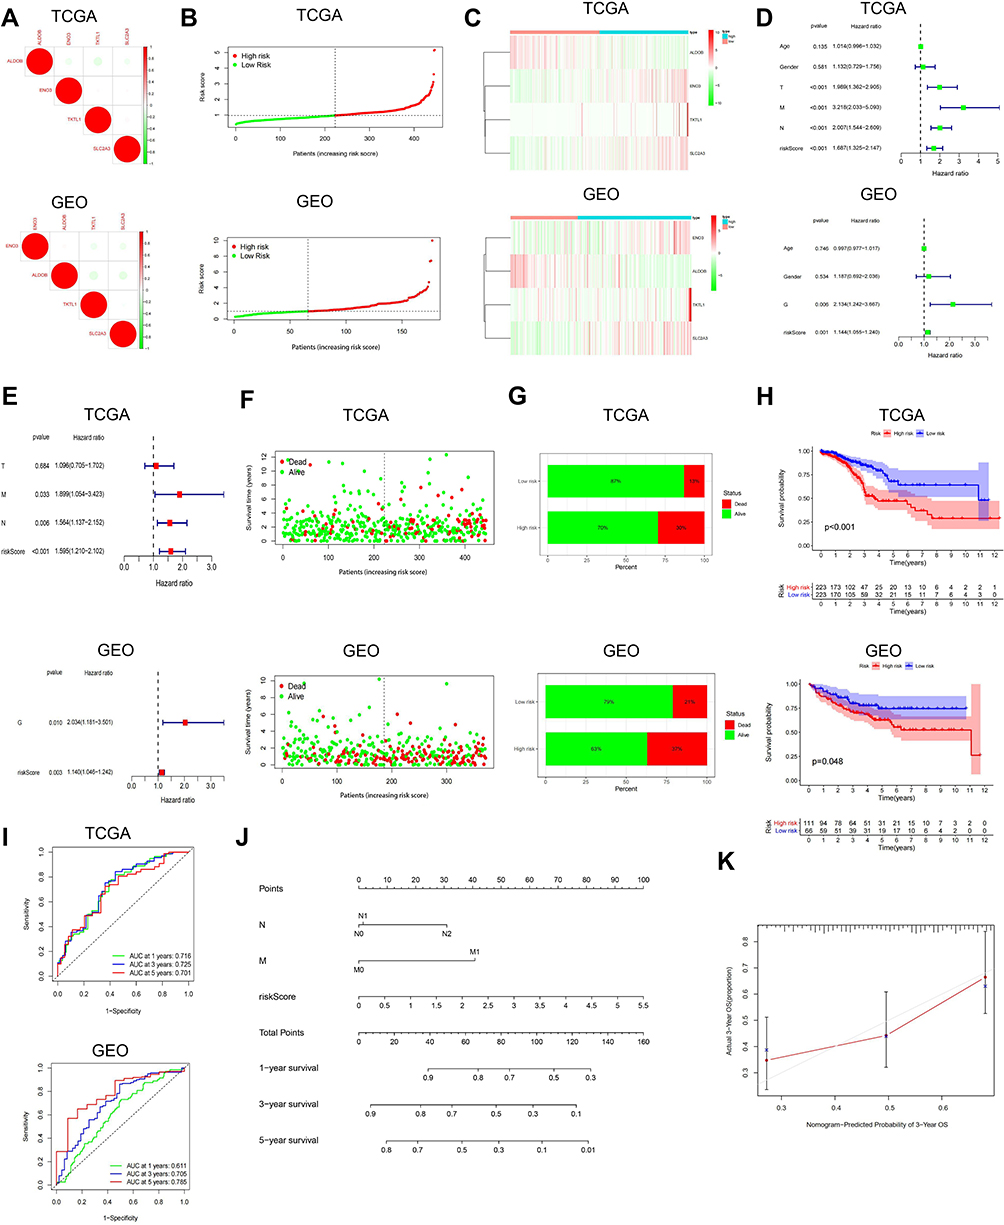 |
Figure 3 Using four prognosis-related hypoxia genes to construct a risk model that can predict the survival of COAD patients. (A) The correlation analysis of four prognosis-related hypoxia genes; (B) patients were divided into a high-risk group and a low-risk group according to the median risk score; (C) the expression of the four hypoxia genes in two groups; (D and E) the univariate and multivariate Cox analysis of patients’ clinical parameters and hypoxia risk score; (F and G) the mortality of COAD patients in two groups; (H) Kaplan-Meier overall survival curves for two groups based on the risk score; (I) ROC curves reveal the high predictive value of our model to predict the survival rate of patients at 1 year, 3 years and 5 years; (J) a nomograph to more directly predict COAD patients’ survival rate based on N stage, M stage and the risk score; (K) a calibration of the nomograph to evaluate the reliability. |
Our results also showed that COAD patients’ mortality in the high-risk group was higher than that in the low-risk group (Figure 3F and G). Moreover, we performed a Kaplan–Meier analysis to reflect the prognostic value of the risk score straightly. The result showed that the high-hypoxia-risk score was correlated with the poor prognosis of COAD patients (Figure 3H). To assess the risk model’s reliability, the received operating characteristic (ROC) curve was performed and the result confirmed the high predictive value of our model. The area under the ROC curve (AUC) was 0.716 at 1-year, 0.725 at 3-years, 0.701 at 5-years in the TCGA train set, and was 0.611 at 1-year, 0.705 at 3-years 0.785 at 5-years in the GEO test set, respectively (Figure 3I). On these bases, we developed a nomograph to more directly predict COAD patients’ survival rate based on the result of multivariate Cox analysis (N stage, M stage, and the risk score) (Figure 3J). A calibration of the nomograph was also conducted to indicate the high reliability (Figure 3K).
Identifying Hypoxia-Related Signaling Pathways with GSEA
We used GSEA to confirm the hypoxia-related signaling pathways activated in the high-risk group. Our result showed that the signaling pathways that promoted the proliferation, metastasis, and anti-apoptosis of the tumor were significantly activated in the high-risk group. These signaling pathways included hypoxia, EMT (epithelial-mesenchymal transition), angiogenesis, KRAS, and NF-kB (Figure 4). Normalized enrichment score (NES) >1 and nominal p-value (NOM p-Val) <0.05 were considered significant gene sets.
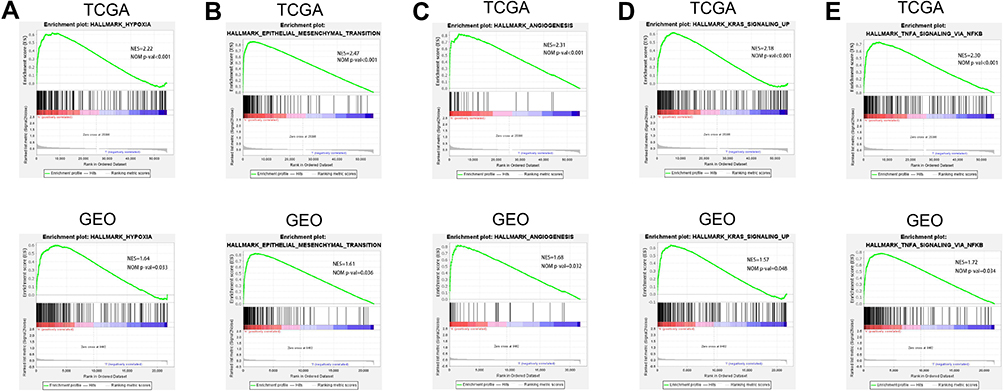 |
Figure 4 Identifying hypoxia-related signaling pathways with GSEA. (A–E) Signaling pathways including hypoxia, EMT, angiogenesis, KRAS, and NF-kB, were significantly activated in the high-risk group. |
The High Hypoxia Risk Score Was Correlated with an Immunosuppressive Microenvironment
Hypoxia and immunosuppression were both characteristics of the tumor microenvironment, and we investigated the relationship between them. We downloaded immune gene signatures (including 22 immune cells) from TIP database (http://biocc.hrbmu.edu.cn/TIP/), and CIBERSORT was used to assess the infiltration of 22 immune cells in the tumor microenvironment (Figure 5A). By analyzing the different infiltration of immune cells in the tumor microenvironment, we found that some immunosuppressive cells, including rested NK cells and neutrophils, had a significantly higher infiltration degree in COAD patients with high hypoxia risk score (Figure 5B and C). Moreover, most immune genes related to the rested NK cells and neutrophils (CXCL5, CXCL6, CXCL8, CXCL9, CXCL10, CCL4, CCL5), were also upregulated in the high-hypoxia-risk group (Figure 5D and E). Besides, the expression of many negative regulatory genes for immune cells in the tumor immune microenvironment, such as MICA and LAG3, was also significantly higher in the high-hypoxia-risk group (Figure 5F).
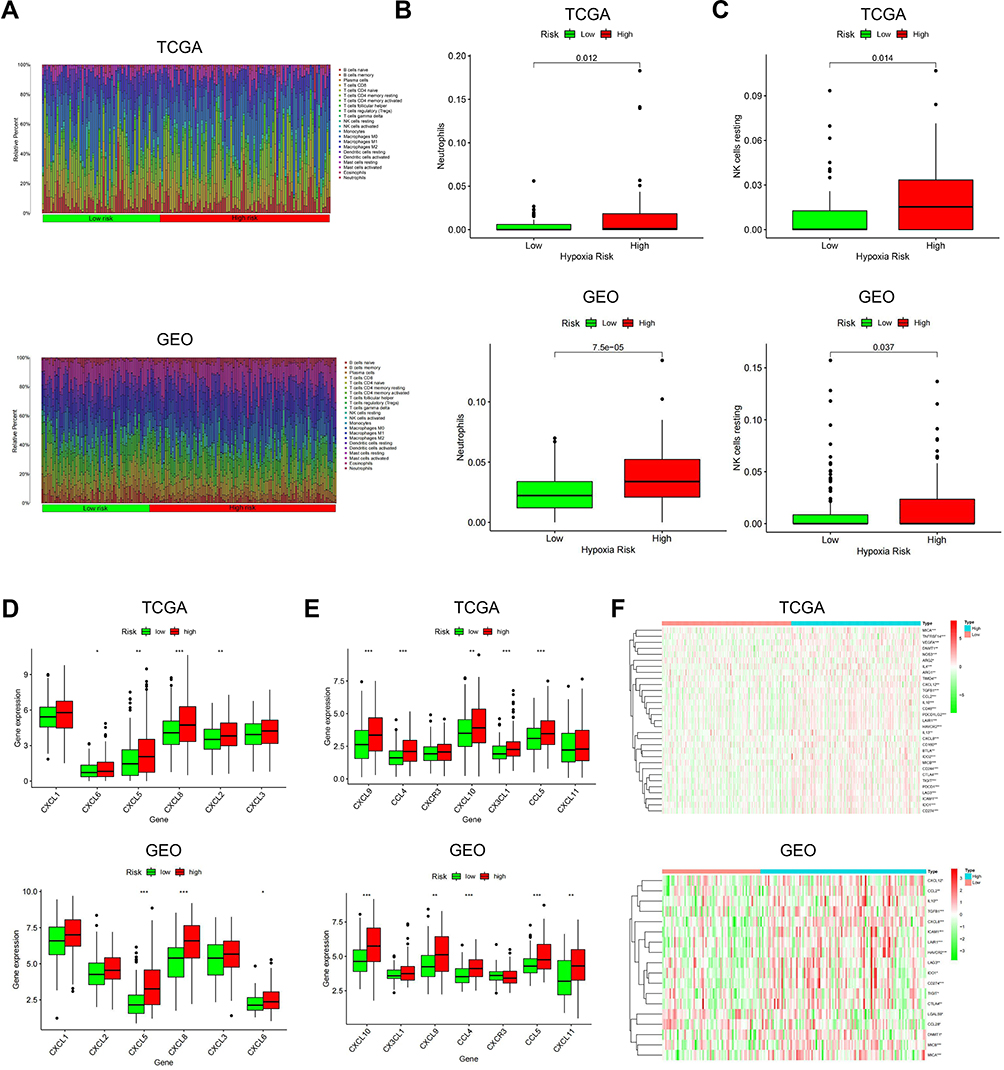 |
Figure 5 The high hypoxia risk score was correlated with an immunosuppressive microenvironment. (A) The infiltration of 22 immune cells in the tumor microenvironment; (B and C) the rested NK cell and neutrophils have a significantly higher infiltration degree in COAD patients with high hypoxia risk score; (D and E) the expression of immune genes related to the rested NK cell and neutrophils in two groups; (F) the expression of negatively regulatory genes for immune cells in two groups. *Represents P < 0.05; **Represents P < 0.01; ***Represents P < 0.001. |
Based on previous studies, hypoxia could also stimulate the expression of immune checkpoints in the tumor microenvironment. Immune checkpoints, including PD1, PD-L1, CTLA4, and TIM-3, played an essential role in COAD progression. Furthermore, our results also found that the expression of PD1, PD-L1, CTLA4, and TIM-3 was positively correlated with the hypoxia risk score of COAD patients (Figure 6).
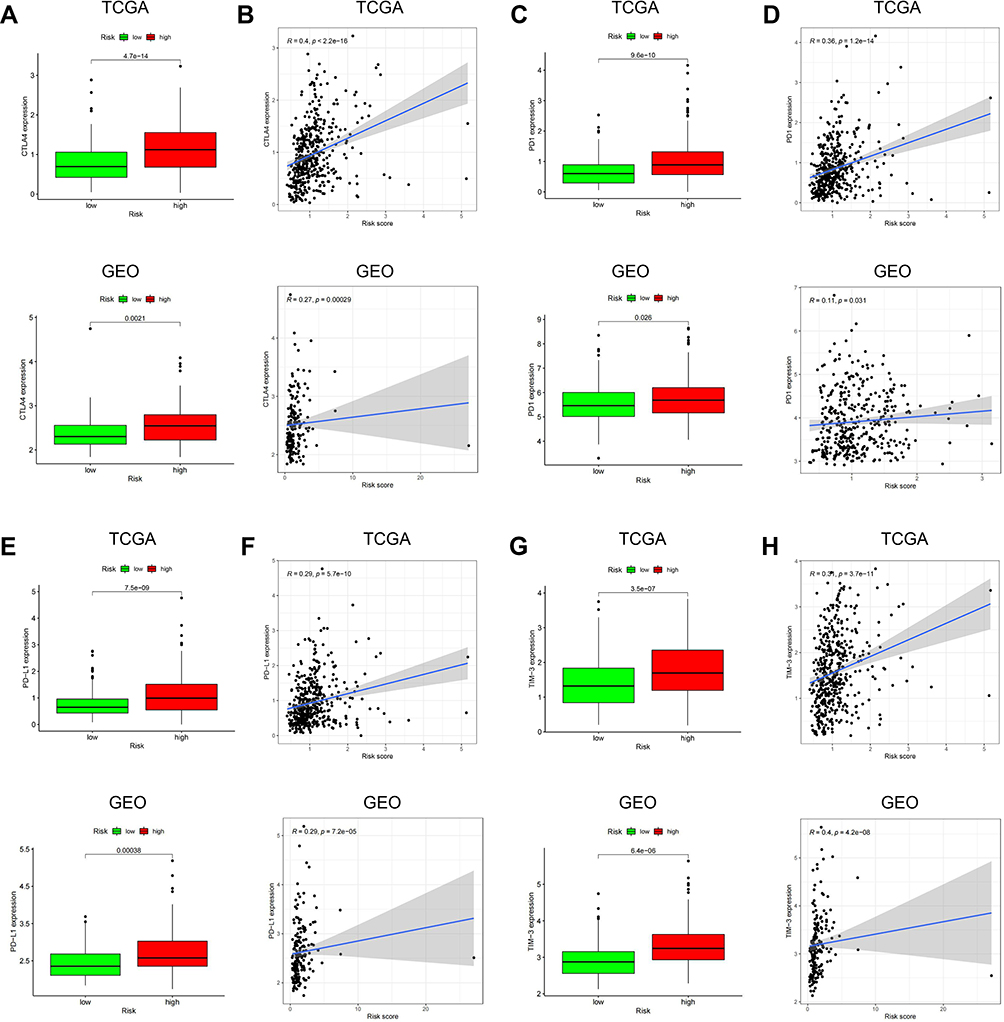 |
Figure 6 The expression of immune checkpoints (CTLA4, PD-1, PD-L1, and TIM-3) was correlated with the risk score in two groups. (A and B) CTLA4 was significantly upregulated in the high-risk group and its overexpression was positively correlated with the hypoxia risk score; (C and D) PD-1 was significantly upregulated in the high-risk group and its overexpression was positively correlated with the hypoxia risk score; (E and F) PD-L1 was significantly upregulated in the high-risk group and its overexpression was positively correlated with the hypoxia risk score; (G and H) TIM-3 was significantly upregulated in the high-risk group and its overexpression was positively correlated with the hypoxia risk score. |
Discussion
More and more evidence identified the role of hypoxia in promoting the proliferation, migration and metastasis of malignant tumors through different mechanisms.4,16,17 The results of our study indicated that hypoxia could lead to tumor microenvironment immunosuppression by upregulating immunosuppressive cell infiltration, immunosuppressive genes and immune checkpoints. Moreover, the hypoxia risk score could act as an independent prognostic factor for COAD patients in our study, what was consistent with the results of other studies.18 The hypoxia risk model constructed in this study included four hypoxia-related genes (TKTL1, SLC2A3, ALDOB, and ENO3), and all of them were significantly upregulated in the high-risk group. As a gene that could be overexpressed by hypoxia and HIF-1α in the tumor microenvironment, TKTL1 promoted a more malignant phenotype. Besides, tumor cells acquired the ability of chemoresistance and radioresistance through the overexpression of TKTL1. Moreover, the knockdown of TKTL1 augmented the apoptosis of tumor cells by elevating intracellular ROS level.19 SLC2A3, also known as GLUT3, could affect tumor aggressiveness under hypoxic conditions.20 ALDOB was also known as fructose-bisphosphate aldolase, and its downregulation was associated with the poor prognosis of patients with gastric cancer.21 ENO3, a key enzyme in the glycolytic pathway, was confirmed to be correlated with the prognosis of COAD patients.22
Substantial studies indicated that hypoxia might lead to immunosuppression in the tumor microenvironment.23 Hypoxia suppressed the immune response through multiple pathways: some negatively regulatory factors might affect the differentiation and survival of dendritic cells, inhibit the activation of effector T cells, such as VEGF;24 IL-4 and IL-10 that were induced by hypoxia could convert TAMs to M2 type, and this process contributed to the immune evasion and tumor progression;25 regulatory T cells (rested dendritic cell, rested NK cell, neutrophils) that were known to suppress immune response increased, and effector T cells (M1-like macrophage, activated NK cell, activated CD4 T cell) that were known to enhance the anti-tumor immune response decreases.23 Consistent with this evidence, our results indicated that immunosuppressive cells or cytokines were significantly higher in the high-hypoxia-risk group, such as rested NK cells, neutrophils, VEGF and IL-10.
Immune checkpoints (PD1, PD-L1, CTLA-4, TIGIT, TIM-3) sufficiently inhibited T cells’ activation, thereby resulting in immunosuppression of the tumor microenvironment.26,27 Existed evidence verified that the expression of PD-L1 on macrophages and MDSCs was upregulated to protect tumor cells from the attack by activated immune cells.28,29 In our study, immune checkpoints, including PD-1, PD-L1, CTLA4, and TIM-3, were also upregulated in the high-hypoxia-risk group. Besides, hypoxia played a crucial role in radioresistance and chemoresistance by enhancing the expression of HIF-1.30,31 On the one hand, HIF-1 might upregulate the downstream genes, which were involved in the proliferation, angiogenesis and metabolism of cancer cells; on the other hand, tumor cells might evade apoptosis by the upregulation of MDM2 (a negative regulator of p53) mediated by HIF-1 under hypoxic conditions.32,33
In this study, we established a hypoxia risk model that effectively predicted the prognosis of COAD patients with high reliability. Hence, the model could be utilized to help clinicians provide individualized treatment for COAD patients. However, our study still has some limitations: Firstly, more independent cohorts should be involved to further confirm the results; Secondly, some functional experiments and hypoxia mice model should also be conducted to make our results more reliable; Finally, more relevant research need to be carried out to better elucidate the role of hypoxia-related genes in cancer progression.
Conclusion
This study constructed a hypoxia risk model with four hypoxia-associated genes, including TKTL1, SLC2A3, ALDOB and ENO3, that could assess the tumor immune microenvironment and predict the overall survival of COAD patients. The high hypoxia risk score was correlated with tumor microenvironment immunosuppression and the poor prognosis of COAD patients. Given the adverse effect of the hypoxic microenvironment on the prognosis, we may develop hypoxia-target drugs for COAD patients based on the four hypoxia genes screened out in this study.
Abbreviations
COAD, colon adenocarcinoma; TCGA, The Cancer Genome Atlas; GEO, Gene Expression Omnibus; TIP, tracking tumor immunophenotype; OS, overall survival; ROC, received operating characteristic; PPI, protein–protein interaction; GSEA, gene set enrichment analysis; PD-1, programmed cell death 1; PD-L1, programmed cell death 1 ligand 1; CTLA4, cytotoxic T-lymphocyte associated protein 4; TIM-3, hepatitis A virus cellular receptor 2; HIF, hypoxia-induced factor.
Ethics Approval and Consent to Participate
This study was approved by Biomedical Research Ethics Committee of the First Affiliated Hospital of Anhui Medical University.
Author Contributions
Xiaobo He and Jianfeng Ding: the writing of the original manuscript and methodology; Xiao Cheng: software and data analysis; Maoming Xiong: revision of the original manuscript. All authors made a significant contribution to the work reported, whether that is in the conception, study design, execution, acquisition of data, analysis and interpretation, or in all these areas; took part in drafting, revising or critically reviewing the article; gave final approval of the version to be published; have agreed on the journal to which the article has been submitted; and agree to be accountable for all aspects of the work.
Funding
This work was supported by grants from the key research and development program of Anhui Province (201904a07020045).
Disclosure
The authors declare that no competing or conflicting interests exist.
References
1. Kostic AD, Chun E, Robertson L, et al. Fusobacterium nucleatum potentiates intestinal tumorigenesis and modulates the tumor-immune microenvironment. Cell Host Microbe. 2013;14(2):207–215. PubMed PMID: 23954159; PubMed Central PMCID: PMCPMC3772512. doi: 10.1016/j.chom.2013.07.007
2. Papagiorgis PC, Zizi AE, Tseleni S, Oikonomakis IN, Nikiteas NI. The pattern of epidermal growth factor receptor variation with disease progression and aggressiveness in colorectal cancer depends on tumor location. Oncol Lett. 2012;3(5):1129–1135. PubMed PMID: 22783405; PubMed Central PMCID: PMCPMC3389629. doi:10.3892/ol.2012.621
3. Bray F, Ferlay J, Soerjomataram I, Siegel RL, Torre LA, Jemal A. Global cancer statistics 2018: GLOBOCAN estimates of incidence and mortality worldwide for 36 cancers in 185 countries. CA Cancer J Clin. 2018;68(6):394–424. PubMed PMID: 30207593. doi:10.3322/caac.21492
4. Liu X, Wan X, Kan H, et al. Hypoxia-induced upregulation of Orai1 drives colon cancer invasiveness and angiogenesis. Eur J Pharmacol. 2018;832:1–10. PubMed PMID: 29753044. doi:10.1016/j.ejphar.2018.05.008
5. Liu M, Zhong J, Zeng Z, et al. Hypoxia-induced feedback of HIF-1alpha and lncRNA-CF129 contributes to pancreatic cancer progression through stabilization of p53 protein. Theranostics. 2019;9(16):4795–4810. PubMed PMID: 31367258; PubMed Central PMCID: PMCPMC6643431. doi: 10.7150/thno.30988
6. Gilkes DM, Bajpai S, Wong CC, et al. Procollagen lysyl hydroxylase 2 is essential for hypoxia-induced breast cancer metastasis. Mol Cancer Res. 2013;11(5):456–466. PubMed PMID: 23378577; PubMed Central PMCID: PMCPMC3656974. doi: 10.1158/1541-7786.MCR-12-0629
7. Gilkes DM, Bajpai S, Chaturvedi P, Wirtz D, Semenza GL. Hypoxia-inducible factor 1 (HIF-1) promotes extracellular matrix remodeling under hypoxic conditions by inducing P4HA1, P4HA2, and PLOD2 expression in fibroblasts. J Biol Chem. 2013;288(15):10819–10829. PubMed PMID: 23423382; PubMed Central PMCID: PMCPMC3624462. doi:10.1074/jbc.M112.442939
8. Chen J, Ding Z, Peng Y, et al. HIF-1alpha inhibition reverses multidrug resistance in colon cancer cells via downregulation of MDR1/P-glycoprotein. PLoS One. 2014;9(6):e98882. PubMed PMID: 24901645; PubMed Central PMCID: PMCPMC4047061. doi: 10.1371/journal.pone.0098882
9. Rohwer N, Dame C, Haugstetter A, et al. Hypoxia-inducible factor 1alpha determines gastric cancer chemosensitivity via modulation of p53 and NF-kappaB. PLoS One. 2010;5(8):e12038. PubMed PMID: 20706634; PubMed Central PMCID: PMCPMC2919384. doi: 10.1371/journal.pone.0012038
10. Cubillos-Zapata C, Avendano-Ortiz J, Hernandez-Jimenez E, et al. Hypoxia-induced PD-L1/PD-1 crosstalk impairs T-cell function in sleep apnoea. Eur Respir J. 2017;50(4):1700833. PubMed PMID: 29051270. doi: 10.1183/13993003.00833-2017
11. Chambers AM, Matosevic S. Immunometabolic dysfunction of natural killer cells mediated by the hypoxia-CD73 axis in solid tumors. Front Mol Biosci PubMed PMID: 31396523; PubMed Central PMCID: PMCPMC6668567. 2019;6:60. doi:10.3389/fmolb.2019.00060
12. Westendorf AM, Skibbe K, Adamczyk A, et al. Hypoxia enhances immunosuppression by inhibiting CD4+ effector T cell function and promoting treg activity. Cell Physiol Biochem. 2017;41(4):1271–1284. PubMed PMID: 28278498. doi: 10.1159/000464429
13. Terry S, Buart S, Chouaib S. Hypoxic stress-induced tumor and immune plasticity, suppression, and impact on tumor heterogeneity. Front Immunol 2017;8:1625. PubMed PMID: 29225600; PubMed Central PMCID: PMCPMC5705542. doi:10.3389/fimmu.2017.01625
14. Chen S, Cao GD, Wei W, et al. Prediction and identification of immune genes related to the prognosis of patients with colon adenocarcinoma and its mechanisms. World J Surg Oncol. 2020;18(1):146. PubMed PMID: 32600423; PubMed Central PMCID: PMCPMC7325073. doi: 10.1186/s12957-020-01921-9
15. Newman AM, Liu CL, Green MR, et al. Robust enumeration of cell subsets from tissue expression profiles. Nat Methods. 2015;12(5):453–457. PubMed PMID: 25822800; PubMed Central PMCID: PMCPMC4739640. doi: 10.1038/nmeth.3337
16. He C, Wang L, Zhang J, Xu H. Hypoxia-inducible microRNA-224 promotes the cell growth, migration and invasion by directly targeting RASSF8 in gastric cancer. Mol Cancer. 2017;16(1):35. PubMed PMID: 28173803; PubMed Central PMCID: PMCPMC5297251. doi:10.1186/s12943-017-0603-1
17. Yang H, Geng YH, Wang P, et al. Extracellular ATP promotes breast cancer invasion and epithelial-mesenchymal transition via hypoxia-inducible factor 2alpha signaling. Cancer Sci. 2019;110(8):2456–2470. PubMed PMID: 31148343; PubMed Central PMCID: PMCPMC6676128. doi: 10.1111/cas.14086
18. Jubb AM, Buffa FM, Harris AL. Assessment of tumour hypoxia for prediction of response to therapy and cancer prognosis. J Cell Mol Med. 2010;14(1–2):18–29. PubMed PMID: 19840191; PubMed Central PMCID: PMCPMC3837600. doi:10.1111/j.1582-4934.2009.00944.x
19. Heller S, Maurer GD, Wanka C, et al. Gene suppression of Transketolase-Like Protein 1 (TKTL1) sensitizes glioma cells to hypoxia and ionizing radiation. Int J Mol Sci. 2018;19(8):2168. PubMed PMID: 30044385; PubMed Central PMCID: PMCPMC6121283. doi: 10.3390/ijms19082168
20. Starska K, Forma E, Jozwiak P, et al. Gene and protein expression of glucose transporter 1 and glucose transporter 3 in human laryngeal cancer-the relationship with regulatory hypoxia-inducible factor-1alpha expression, tumor invasiveness, and patient prognosis. Tumour Biol. 2015;36(4):2309–2321. PubMed PMID: 25412955; PubMed Central PMCID: PMCPMC4428538. doi: 10.1007/s13277-014-2838-4
21. He J, Jin Y, Chen Y, et al. Downregulation of ALDOB is associated with poor prognosis of patients with gastric cancer. Onco Targets Ther. 2016;9:6099–6109. PubMed PMID: 27785057; PubMed Central PMCID: PMCPMC5065259. doi:10.2147/OTT.S110203
22. Pan X, Wu H, Chen G, Li W. Prognostic value of enolase gene family in colon cancer. Med Sci Monit PubMed PMID: 32703926; PubMed Central PMCID: PMCPMC7401828. 2020;26:e922980. doi:10.12659/MSM.922980
23. Kumar V, Gabrilovich DI. Hypoxia-inducible factors in regulation of immune responses in tumour microenvironment. Immunology. 2014;143(4):512–519. PubMed PMID: 25196648; PubMed Central PMCID: PMCPMC4253499. doi:10.1111/imm.12380
24. Elia AR, Cappello P, Puppo M, et al. Human dendritic cells differentiated in hypoxia down-modulate antigen uptake and change their chemokine expression profile. J Leukoc Biol. 2008;84(6):1472–1482. PubMed PMID: 18725395. doi: 10.1189/jlb.0208082
25. Murdoch C, Giannoudis A, Lewis CE. Mechanisms regulating the recruitment of macrophages into hypoxic areas of tumors and other ischemic tissues. Blood. 2004;104(8):2224–2234. PubMed PMID: 15231578. doi:10.1182/blood-2004-03-1109
26. Barsoum IB, Hamilton TK, Li X, et al. Hypoxia induces escape from innate immunity in cancer cells via increased expression of ADAM10: role of nitric oxide. Cancer Res. 2011;71(24):7433–7441. PubMed PMID: 22006996. doi: 10.1158/0008-5472.CAN-11-2104
27. Noman MZ, Chouaib S. Targeting hypoxia at the forefront of anticancer immune responses. Oncoimmunology. 2014;3(12):e954463. PubMed PMID: 25964858; PubMed Central PMCID: PMCPMC4353170. doi:10.4161/21624011.2014.954463
28. Noman MZ, Janji B, Hu S, et al. Tumor-promoting effects of myeloid-derived suppressor cells are potentiated by hypoxia-induced expression of miR-210. Cancer Res. 2015;75(18):3771–3787. PubMed PMID: 26206559. doi: 10.1158/0008-5472.CAN-15-0405
29. Damgaci S, Ibrahim-Hashim A, Enriquez-Navas PM, Pilon-Thomas S, Guvenis A, Gillies RJ. Hypoxia and acidosis: immune suppressors and therapeutic targets. Immunology. 2018;154(3):354–362. PubMed PMID: 29485185; PubMed Central PMCID: PMCPMC6002221. doi:10.1111/imm.12917
30. Moeller BJ, Dewhirst MW. HIF-1 and tumour radiosensitivity. Br J Cancer. 2006;95(1):1–5. PubMed PMID: 16735998; PubMed Central PMCID: PMCPMC2360497. doi:10.1038/sj.bjc.6603201
31. Rohwer N, Cramer T. Hypoxia-mediated drug resistance: novel insights on the functional interaction of HIFs and cell death pathways. Drug Resist Updat. 2011;14(3):191–201. PubMed PMID: 21466972. doi:10.1016/j.drup.2011.03.001
32. Liu L, Ning X, Sun L, et al. Hypoxia-inducible factor-1 alpha contributes to hypoxia-induced chemoresistance in gastric cancer. Cancer Sci. 2008;99(1):121–128. PubMed PMID: 17953712. doi: 10.1111/j.1349-7006.2007.00643.x
33. Ruan K, Song G, Ouyang G. Role of hypoxia in the hallmarks of human cancer. J Cell Biochem. 2009;107(6):1053–1062. PubMed PMID: 19479945. doi:10.1002/jcb.22214
 © 2021 The Author(s). This work is published and licensed by Dove Medical Press Limited. The full terms of this license are available at https://www.dovepress.com/terms.php and incorporate the Creative Commons Attribution - Non Commercial (unported, v3.0) License.
By accessing the work you hereby accept the Terms. Non-commercial uses of the work are permitted without any further permission from Dove Medical Press Limited, provided the work is properly attributed. For permission for commercial use of this work, please see paragraphs 4.2 and 5 of our Terms.
© 2021 The Author(s). This work is published and licensed by Dove Medical Press Limited. The full terms of this license are available at https://www.dovepress.com/terms.php and incorporate the Creative Commons Attribution - Non Commercial (unported, v3.0) License.
By accessing the work you hereby accept the Terms. Non-commercial uses of the work are permitted without any further permission from Dove Medical Press Limited, provided the work is properly attributed. For permission for commercial use of this work, please see paragraphs 4.2 and 5 of our Terms.