")
Back to Journals » International Journal of General Medicine » Volume 14
Hyperuricemia and Its Associated Factors Among Adult Staff Members of the Ethiopian Public Health Institute, Ethiopia
Authors Molla MD , Bekele A, Melka DS, Teklemariam MD , Challa F , Ayelign B , Shibabaw T , Akalu Y , Geto Z
Received 24 February 2021
Accepted for publication 29 March 2021
Published 20 April 2021 Volume 2021:14 Pages 1437—1447
DOI https://doi.org/10.2147/IJGM.S308158
Checked for plagiarism Yes
Review by Single anonymous peer review
Peer reviewer comments 3
Editor who approved publication: Dr Scott Fraser
Meseret Derbew Molla,1 Abebe Bekele,2 Daniel Seifu Melka,3,4 Maria Degef Teklemariam,3 Feyissa Challa,2 Birhanu Ayelign,5 Tewodros Shibabaw,1 Yonas Akalu,6 Zeleke Geto7
1Department of Biochemistry, School of Medicine, College of Medicine and Health Sciences, University of Gondar, Gondar, Ethiopia; 2Ethiopian Public Health Institute, Addis Ababa, Ethiopia; 3Department of Medical Biochemistry, College of Health Sciences, Addis Ababa University, Addis Ababa, Ethiopia; 4Department of Biochemistry, Division of Biomedical Sciences, University of Global Health Equity, Kigali, Rwanda; 5Department of Immunology and Molecular Biology, School of Biomedical and Laboratory Sciences, College of Medicine and Health Sciences, University of Gondar, Gondar, Ethiopia; 6Department of Physiology, School of Medicine, College of Medicine and Health Sciences, University of Gondar, Gondar, Ethiopia; 7Department of Biomedical Science, School of Medicine, College of Medicine and Health Science, Wollo University, Desse, Ethiopia
Correspondence: Meseret Derbew Molla; Zeleke Geto Tel +251 918331617
; Tel +251 912785918
Email [email protected]; [email protected]
Background: Hyperuricemia is related not only to an increased risk of gouty arthritis but also to an increased risk of cardiovascular diseases, resistant hypertension, insulin resistance and progression of type 2 diabetes mellitus. However, to the best of our knowledge, the prevalence of hyperuricemia and its associated factors have rarely been assessed in Ethiopian populations. Therefore, this study aimed to determine the prevalence of hyperuricemia and its associated factors among adult staff members of the Ethiopian Public Health Institute.
Methods: An institution-based cross-sectional study was conducted from July 1 to October 28, 2018. A total of 402 study participants were selected using a simple random sampling technique. An interviewer-administered questionnaire was used to collect the data. A blood sample of approximately 5 mL was collected from each study participant after overnight fasting through standardized methods for biochemical tests, and analyses were carried out with an automated COBAS 6000 analyzer. Data analysis was performed by SPSS version 20 software. The factors associated with the outcome variable were identified by bivariable and multivariable logistic regression analyses, and a p value < 0.05 was used to declare statistical significance.
Results: The mean age of the study participants was 37.13± 10.5 (mean ± SD), and 51.5% of the participants were male. The overall prevalence of hyperuricemia (> 5.7 mg/dL for females and > 7 mg/dL for males) was found to be 31.0%. The multivariable logistic analysis revealed that age (AOR=1.59, 95% CI 1.01– 2.78), sex (AOR=1.66, 95% CI 1.02– 2.70), cigarette smoking (AOR=2.05, 95% CI 1.01– 4.19) and serum low-density lipoprotein (LDL) (AOR=1.70, 95% CI 1.01– 2.87) were significantly associated with hyperuricemia.
Conclusion: The prevalence of hyperuricemia was relatively high compared to similar studies. Early screening for hyperuricemia in the general population, especially in those who are smokers, of older age and with high serum LDL levels, is vital to control its adverse effects at an early stage.
Keywords: adults, associated factors, uric acid, hyperuricemia
Introduction
Hyperuricemia is the state of having an abnormally elevated serum uric acid level. Under normal metabolic processes, uric acid is the end product of purine degradation and metabolism. The final two steps in purine metabolism comprise its catalysis by xanthine oxidoreductase, which converts hypoxanthine to xanthine, and then to uric acid.1 At physiological pH, uric acid or its monoanion, urate, is considered to be without any physiological value and is excreted via urination.2 However, owing to different factors, which could be genetic or acquired, purine metabolism can be disrupted and result in an abnormal increase in serum uric acid level (hyperuricemia).3,4 Clinically, knowing the prevalence of hyperuricemia is becoming an important concern for physicians owing to its strong association with gout and metabolic syndrome (MS). Besides, hyperuricemia may not be symptomatic until the late stages, and may be diagnosed after complications such as uremia and gout.5 In support of this, a 5-year follow-up study reported that 18.8% of asymptomatic hyperuricemic patients progressed into gout.6 The reason for this progression is that a high level of uric acid in the circulation results in an accumulation of monosodium urate crystals in peripheral joints and soft tissues, which, in turn, leads to the development of gout.7 Therefore, hyperuricemia may be taken as an independent risk factor for the development of gout; however, a study showed that only half of hyperuricemic patients could have the potential to develop gout.8 About 1–2% of the world’s population are affected by gout, which is one of the most common chronic musculoskeletal diseases.9
Moreover, several studies have reported that there is a strong association between hyperuricemia and the incidence and progression of MS, chronic kidney disease and cardiovascular diseases (CVDs).10–19 Even in healthy populations, there is a strong association between elevated serum uric acid level and MS. Previous studies also revealed that if hyperuricemia has progressed to gout, the chance of developing MS is very high.20,21 Although the pathological role of elevated uric acid on MS is not completely understood, controlling the level of blood uric acid acts as a focal issue for high-risk asymptomatic individuals in the prediction of MS.22,23 Hyperuricemia is also positively associated with the incidence of insulin resistance and progression of type 2 diabetes mellitus.23–25 One study, conducted on elderly participants, stated that undiagnosed hyperuricemia is a strong risk factor for resistant hypertension (>140/90 mmHg) despite appropriate therapeutic approach and lifestyle modification.5 In addition, other research indicated that the chance of developing coronary or cerebrovascular disease associated with hypertension was three- to five-fold higher in hypertensive patients with hyperuricemia compared to non-hyperuricemic hypertensive patients.26
Globally, the prevalence and incidence rate of hyperuricemia have steadily increased over time.27 In 2004, the global prevalence of hyperuricemia was 5–30% across different populations.28 More recent figures on the global prevalence of hyperuricemia and its associated factors do not appear to be available, but several lines of national and regional data have been reported regarding this issue. The prevalence of hyperuricemia differs across different nations. For example, the age-standardized prevalence of hyperuricemia is 11.4% in the general population of the Republic of Korea,29 10.6% in a Thai population,30 12.1% in urban Izmir, Turkey,31 24.4% in a Bangkok population,32 13.7% in healthy adults in northern and northeastern China,33 25% in middle-aged, urban Chinese men34 and 24% in the sub-Himalayan region in north India.35 The incidence and prevalence of MS and gout have become major public health problems around the globe; however, their underlying causes, such as hyperuricemia, have not been clearly addressed. Furthermore, in developing countries, especially in sub-Saharan Africa, the prevalence of hyperuricemia and its associated factors have been infrequently studied. To the best of our knowledge, in Ethiopia, there has been only a limited number of studies on this issue. Therefore, this study aimed to determine the prevalence of hyperuricemia and its associated factors among adult staff members of the Ethiopian Public Health Institute (EPHI), Ethiopia. We hope that the findings of the study will provide input for clinicians as well as researchers. Furthermore, they may be useful for interventional plans to reduce metabolic disorders associated with hyperuricemia.
Methods
Study Setting and Design
An institution-based cross-sectional study was conducted from July 1 to October 28, 2018 among EPHI staff members. The study was conducted at the Ethiopian Public Health Institute (EPHI), which is located in Addis Ababa, the capital city of Ethiopia. The EPHI has been a well-known research institute in the country since 1995.
Study Participants and Sample Size Determination
The source population of the study was all adult staff members of the EPHI who had worked for a duration of >6 months, while staff members aged >18 years and who were present in the institution during the data collection period were taken as the study population. Of these, pregnant women and mothers in the postpartum period, sick individuals and individuals who were taking medications with known effects on purine metabolism, such as allopurinol, adenine, D-ribose and uridine, were excluded from the study.
A single population proportion formula was used to calculate the sample size of the study, n = Z2 p (1 − p)/d2, where Z is the Z score at 95% confidence interval = 1.96; p, prevalence = 50% (0.5); and d, marginal error = 5% (0.05). Thus, n = (1.96)2 0.5 (1 – 0.5)/(0.05)2 = 384. Considering a 5% non-response rate, the final total sample size of the study was 402. Study participants were selected using a simple random sampling technique.
Data Collection Procedure
The data were collected using a pretested interviewer-administered questionnaire. The questionnaires were prepared based on related literature in an international language (English), then translated into the local language (Amharic) to simplify the data collection and translated back to English to check their consistency. The questionnaire covered socio-demographic characteristics (sex, age, marital status and educational status), behavioral characteristics such as alcohol drinking, cigarette smoking, chat chewing and physical activity status, and clinical data, including a medically confirmed history of CVDs, hypertension, diabetes mellitus and kidney stone. The parts of the questionnaire designed to assess alcohol drinking, cigarette smoking and chat chewing status, as well as medically confirmed self-reported history of CVDs, hypertension, diabetes mellitus and kidney stone, were prepared with yes or no questions. Moreover, the participants were asked about the type, duration and frequency of alcohol drinking, cigarette smoking and chat chewing activities. Finally, alcohol drinking was defined as the intake of any type of alcohol beverage, such as beer, wine or locally prepared alcoholic beverages, more than once per week in the past year, regardless of the amount, whereas those who drank less than once per week in the past year or never drink alcoholic products were taken as non-drinkers.36 Smokers were defined as those who practiced smoking cigarettes during the past year, regardless of the amount, while those who had never smoked in their lifetime or who had been smokers prior to the last year were taken as non-smokers. Chat chewers were defined in a similar way to smokers.37
Physical activity was assessed according to World Health Organization (WHO) steps, by which any movement of the body produced by skeletal muscle, which requires energy expenditure, was taken as physical activity. Thus, physical activity was categorized into three levels: vigorous, moderate and inadequate or poor physical activity. A vigorous-intensity activity was defined as any activity that causes a large increase in breathing or heart rate (eg, running, carrying or lifting heavy loads, digging or construction work) that continues for at least 30 minutes for a minimum of three days per week. Moderate-intensity activity was defined as any activity that causes a small increase in breathing or heart rate (brisk walking or carrying light loads) that continues for at least 30 minutes for at least 3 days per week, or 5 or more days of these activities for at least 20 minutes per day or ≥3 days of vigorous-intensity activity per week for at least 20 minutes per day. Low-level (sedentary) physical activity was defined as an individual having physical activity that does not meet any of these criteria.38
Anthropometric Measurements,
Physical parameters such as height, weight and blood pressure were measured using the WHO recommended standards.38 The weight of each participant was measured in kilograms wearing light clothes and no shoes, and height was measured in centimeters using a height board, without shoes and in an upright position. Accordingly, body mass index (BMI) was calculated as the weight in kilograms divided by height in meters squared (m2). Then, overweight was defined as a BMI between 24.9 and 30 kg/m2, and BMI ≥30 kg/m2 was taken as obesity.39 Blood pressure was measured after a minimum rest of 5 minutes, or 30 minutes for those who had drunk hot drinks such as coffee, with a sphygmomanometer at the midpoint of the left arm. The blood pressure was measured twice with an interval of 5 minutes, and the average value was taken as the true value. Then, hypertension was defined as a systolic/diastolic blood pressure ≥140/90 mmHg or current use of antihypertensive drugs or a medically confirmed self-reported history of hypertension.40 Diabetes mellitus was defined based on WHO guidelines, fasting blood sugar ≥126 mg/dL, a medically confirmed self-reported history of diabetes or current use of antidiabetic drugs.38
Blood Sample Collection Procedure and Biochemical Analysis
A 5 mL blood sample was collected aseptically from each study participant after overnight fasting using a serum separator tube (SST). Blood samples were collected using an aseptic/sterile technique. The blood samples were allowed to clot in the tube at room temperature for 30 minutes, and then were centrifuged at 3000 rpm for 7 minutes using a Rotanta 960 centrifuge in thermostable conditions. Separated serum was transferred to sterile 1.5 mL Nunc tubes labeled with the study code, and kept frozen at −20°C until being transported to the National References Laboratory for Clinical Chemistry, EPHI, for laboratory analysis. Biochemical parameters, such as serum uric acid level, fasting blood glucose and lipid profile tests, were analyzed by an automated COBAS 6000 analyzer. The cut-off points of the biochemical tests were taken according to the reference cut-off points of the COBAS 6000 analyzer. For instance, the outcome of the study (hyperuricemia) was diagnosed based on the reference cut-off point of the COBAS 6000 analyzer, which is >5.7 mg/dL for females and >7 mg/dL for males, and values below these cut-off points were taken as normal serum uric acid levels for the respective sexes.41
Quality Assurance
To achieve quality, training was provided for data collectors and supervisors. The training session included the objective of the study, data collection process, laboratory analysis and ethical issues. To evaluate the general approachability and feasibility of the questionnaires, a pretest was carried out using 10% of the sample size at St. Paul’s Hospital Millennium Medical College before running the actual data. The overall quality of laboratory analysis was maintained by strictly following the manufacturers’ instructions and standard operational procedure (SOP) in the preanalytic, analytic and postanalytic stages of laboratory services. The supervisors and investigators were strictly monitored data and sample collectors. To catch any errors, the collected data were double-checked for completeness, consistency, accuracy and clarity on a daily basis.
Statistical Analysis
Data analysis was performed using SPSS version 20 software. Descriptive data analysis was conducted and results were presented as frequency and percentage. Both binary and multivariable logistic regression analyses were performed to identifyfactors associated with hyperuricemia. Variables in the bivariable analysis with p<0.2 were candidates for the final analysis in the multivariable logistic regression model. In multivariable logistic regression, variables with p<0.05 were declared statistically significant. The Hosmer and Lemeshow goodness-of-fit test was performed.
Results
Socio-Demographic and Behavioral Characteristics of the Study Participants
In total, 402 study participants were enrolled. Of these, 400 participants completed the study. Just over half, 206 (51.5%), of the participants were male. The majority, 316 (79%), of the participants were aged 45 years or younger; thus, the mean ± SD age of the participants was 37.13±10.49 years. Most of the participants, 241 (60.3%) and 268 (67.0%), were married and educated up to college level and above, respectively. Regarding the behavioral status of the participants, 39 (9.8%), 266 (66.5%) and 63 (15.6%) were cigarette smokers, alcohol consumers and chat chewers, respectively. Besides, 119 (29.8%) of the participants performed vigorous physical activity and the majority, 260 (65%), of the participants were categorized as taking part in moderately intense physical activities (Table 1).
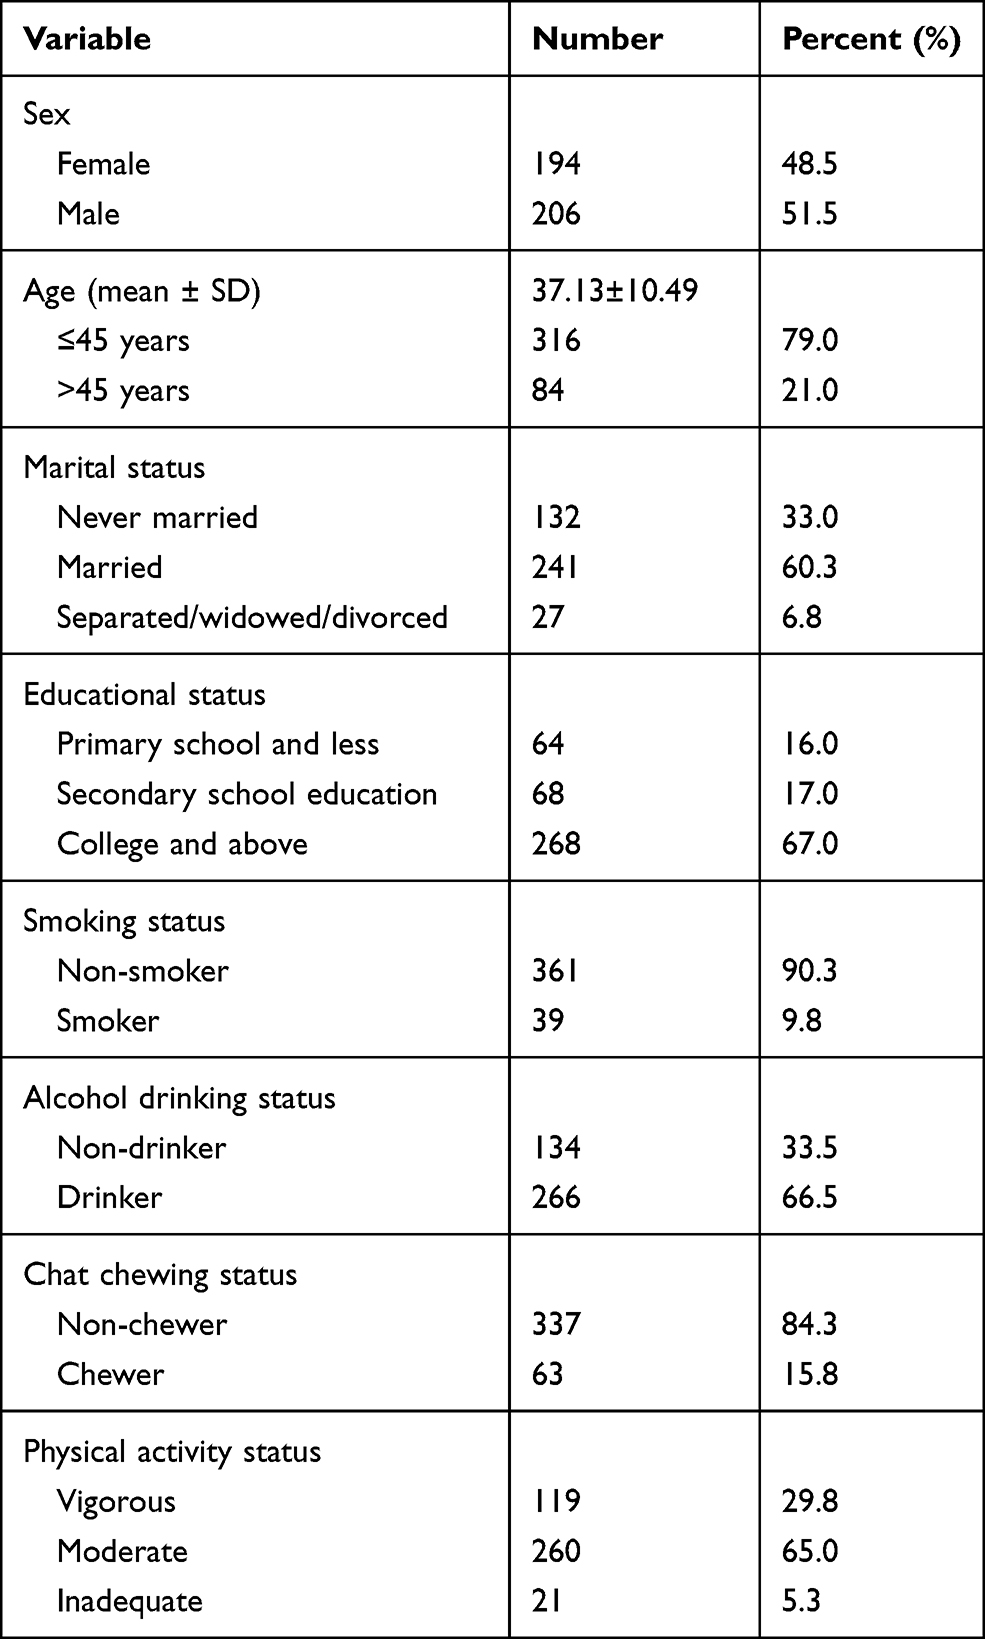 |
Table 1 Socio-Demographic and Behavioral Characteristics of the Study Participants, Addis Ababa, Ethiopia, 2018 (n=400) |
Clinical and Biochemical Characteristics of the Participants
Of the total participants, 122 (31.8%) and 32 (8.3%) were overweight and obese, respectively. Moreover, 72 (18%) and 13 (3.3%) of the participants had hypertension and diabetes mellitus, respectively, whereas 26 (6.5%) and 22 (5.5%) of the participants had clinically confirmed self-reported history of kidney stone and CVDs, respectively. Concerning the biochemical analysis, 84 (21%), 116 (29%) and 103 (25.8%) of the participants had abnormal elevations of serum triglyceride, cholesterol and low-density lipoprotein (LDL), respectively. Besides, a significant number of the participants, 162 (40.5%), had a low level of serum HDL. The mean ± SD values of estimated glomerular filtration rate (eGFR) according to the Modification of Diet in Renal Disease (MDRD) and Chronic Kidney Disease Epidemiology Collaboration (CKD-EPI) equations were 132.47±27.42 mL/min/1.73 m2 and 130.99±23.24 mL/min/1.73 m2, respectively. None of the study participants was defined as having chronic kidney disease (eGFR <60 mL/min/1.73 m2), regardless of the equations used (Table 2).
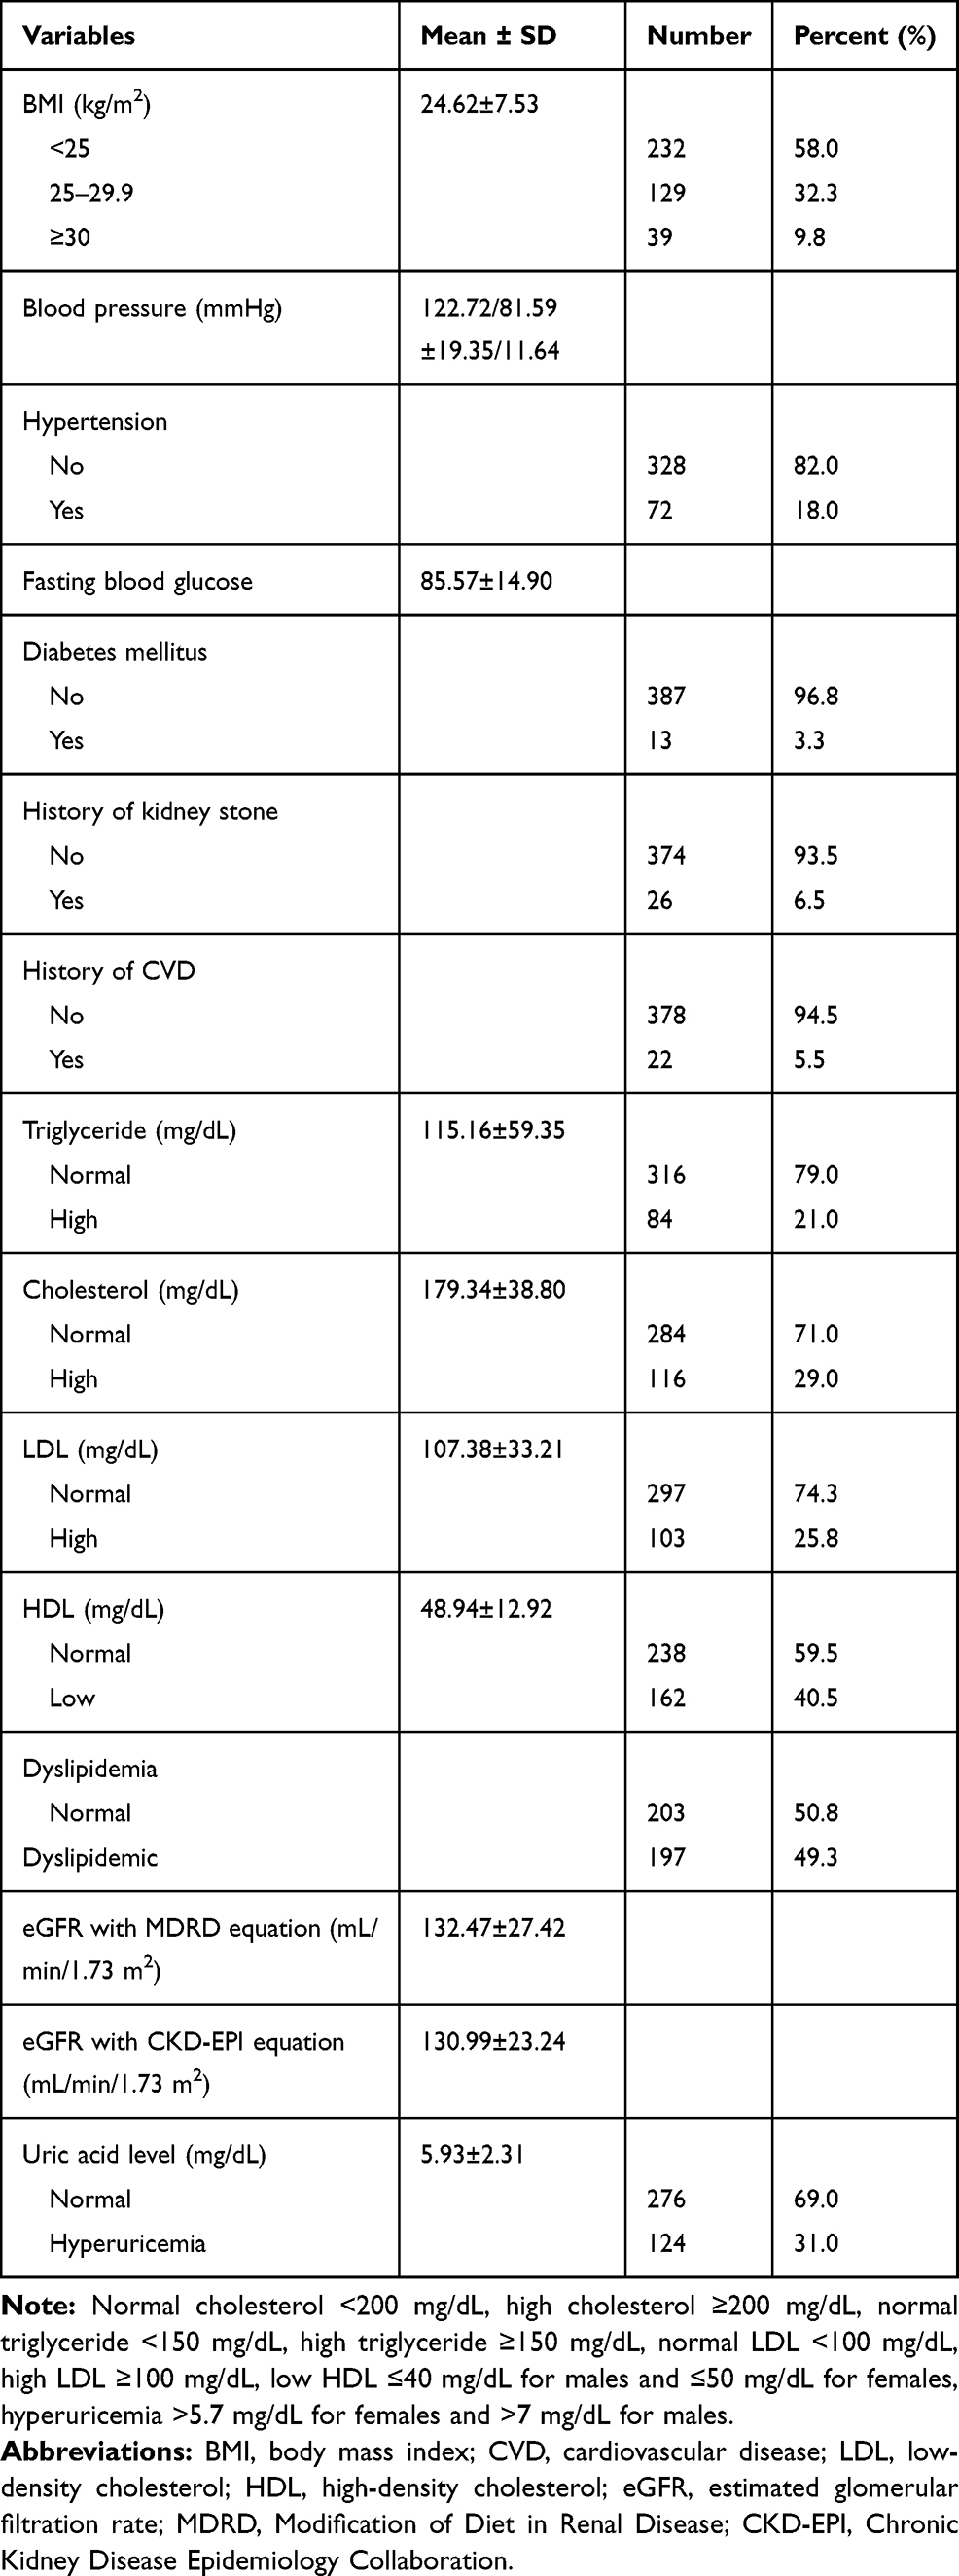 |
Table 2 Clinical and Biochemical Characteristics of the Study Participants, Addis Ababa, Ethiopia, 2018 (n=400) |
Prevalence of Hyperuricemia Among the Participants
A total of 124 hyperuricemia cases with an overall prevalence of 31% (95% CI 26.5–35.8) was found in the present study. Of these, about 78 (62.9%) of male participants and 46 (37.1%) of female participants were found to be hyperuricemic. The mean ± SD uric acid level of the study participants was 5.93±2.31 mg/dL (Table 2).
Factors Associated With Hyperuricemia
The multivariable logistic regression analysis revealed that sex, age, cigarette smoking status and serum LDL level were significantly associated with hyperuricemia. The odds of having hyperuricemia were 1.66 times (AOR=1.66, 95% CI 1.02–2.70) higher among male participants than females. The probability of having hyperuricemia was 1.59 times (AOR=1.59, 95% CI 1.01–2.78) higher in elderly respondents than in younger participants. The odds of having hyperuricemia were 2.05 times (AOR=2.05, 95% CI 1.01–4.19) higher in cigarette smokers than non-smokers. The odds of having hyperuricemia were 1.70 times (AOR=1.70, 95% CI 1.01–2.87) higher in participants who had high serum LDL levels than in those who had normal serum LDL levels (Table 3).
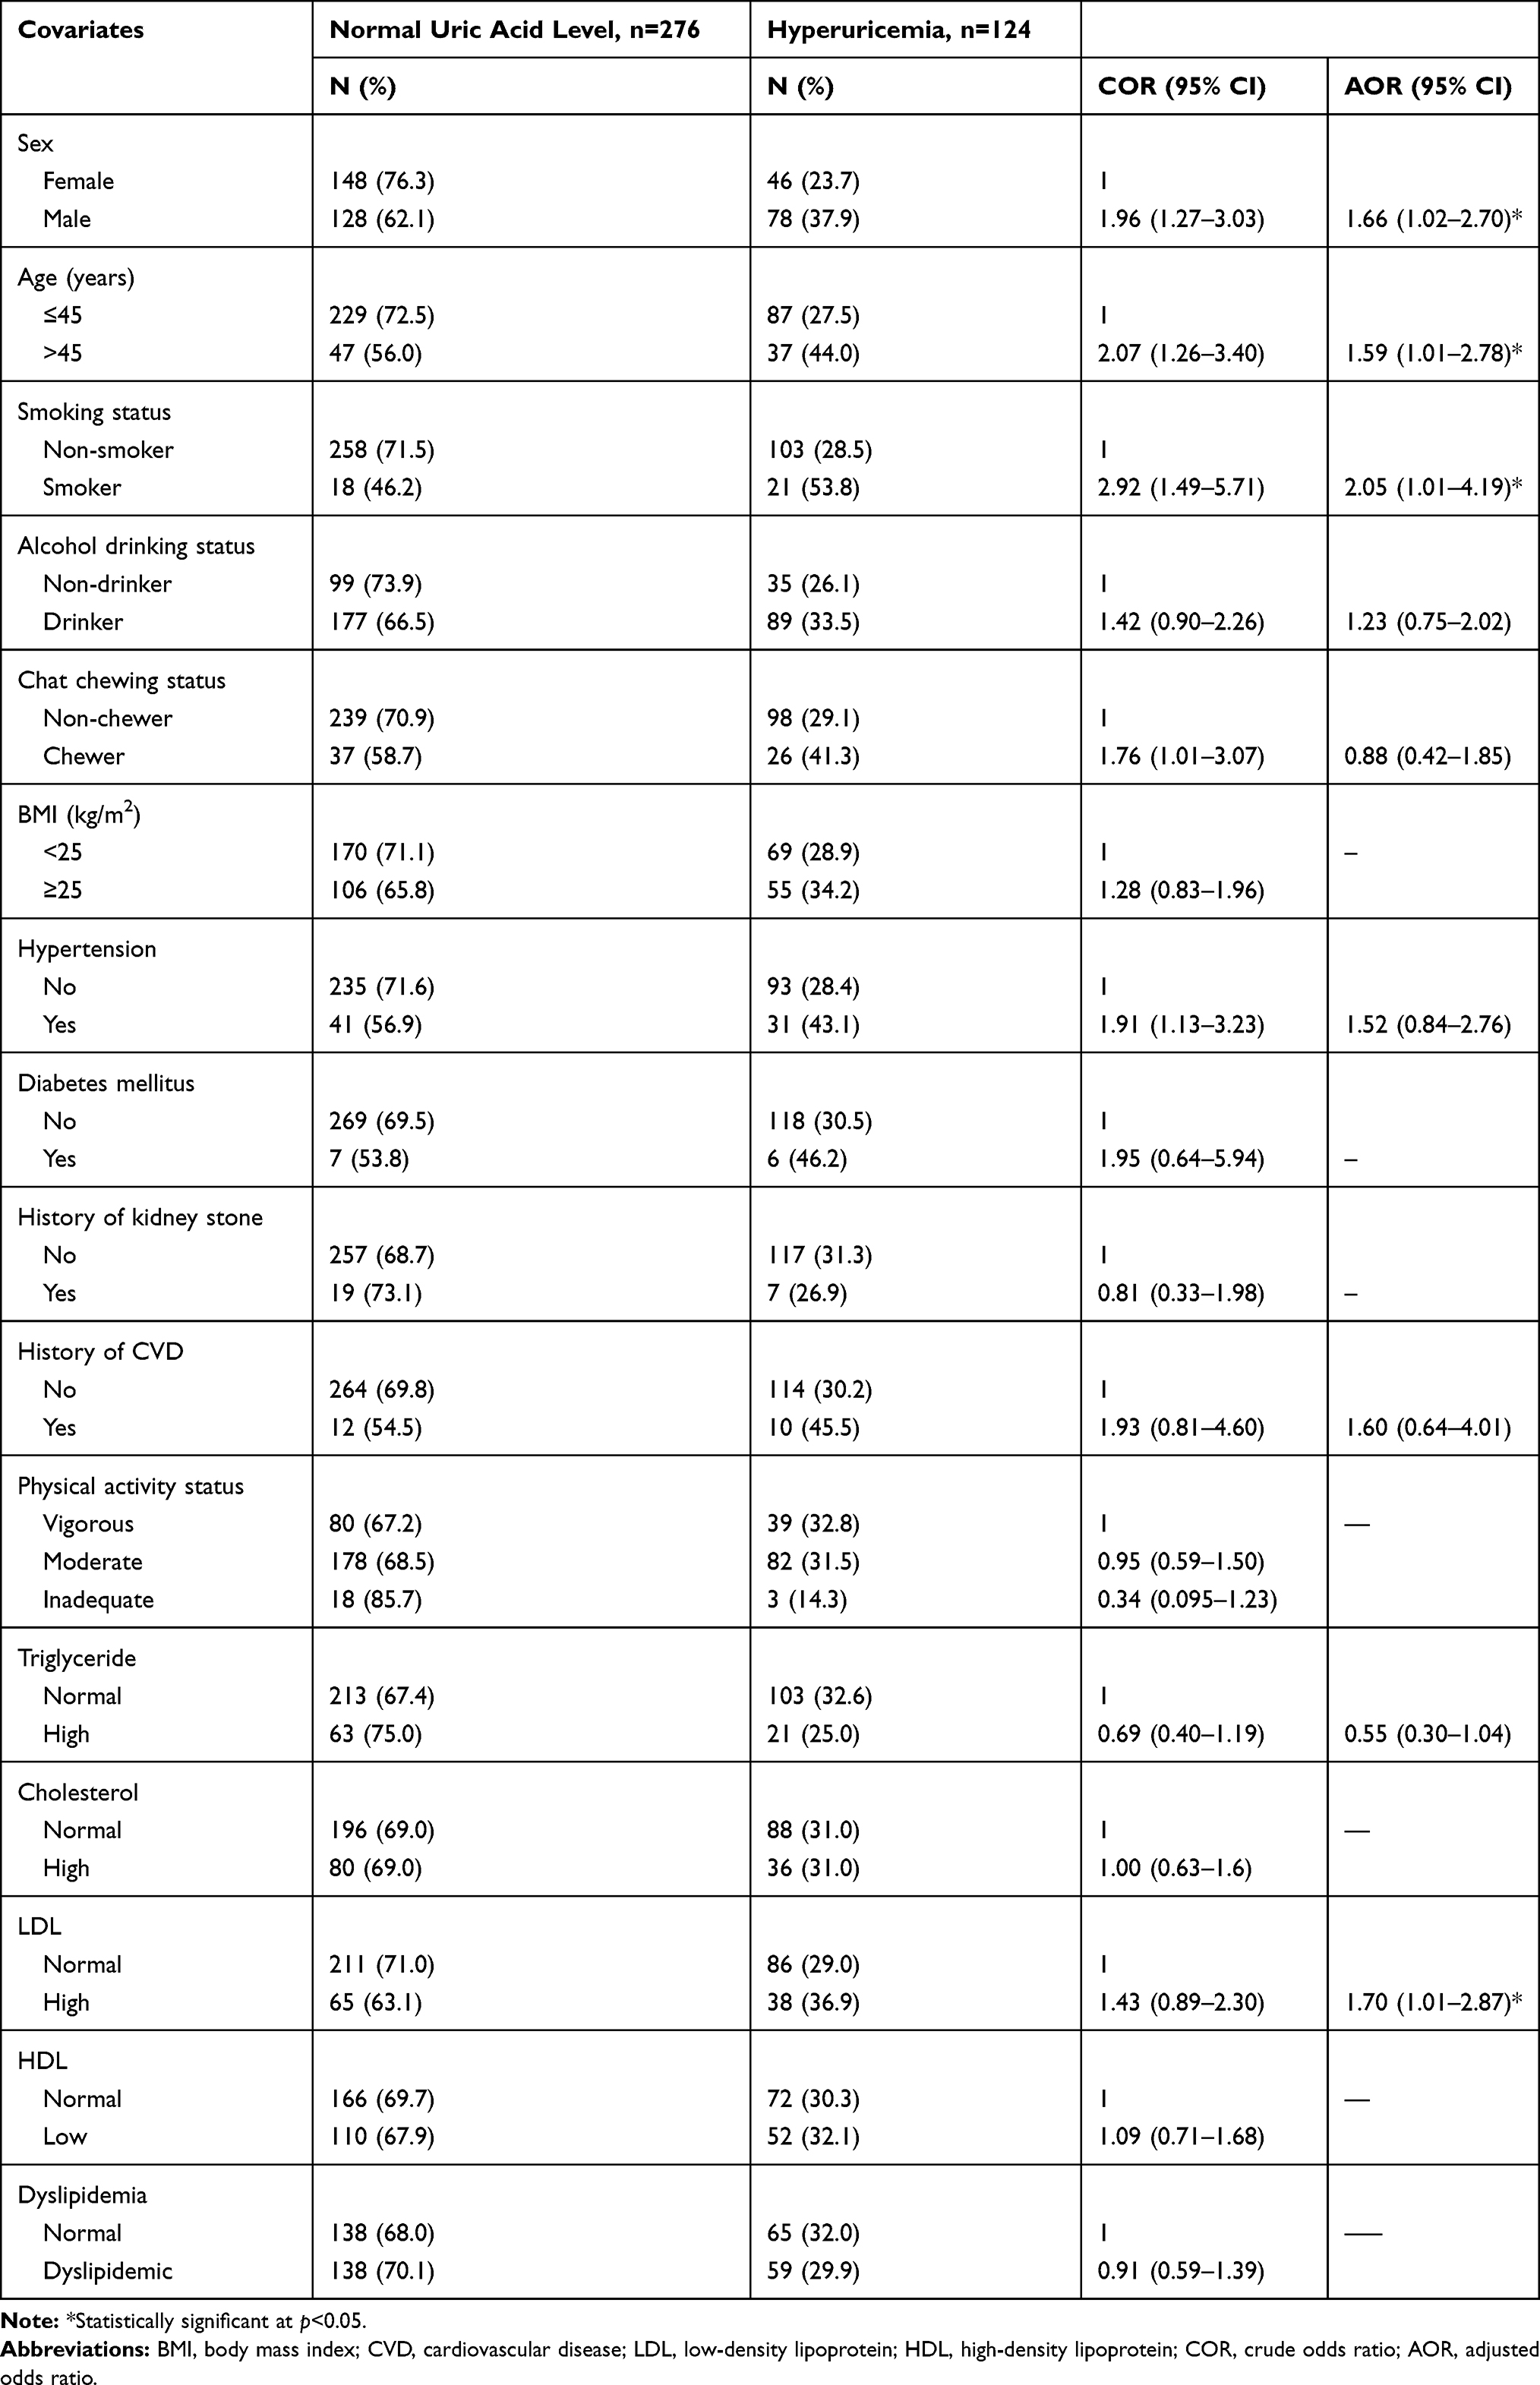 |
Table 3 Factors Associated With Hyperuricemia in the Study Participants, Addis Ababa, Ethiopia, 2018 (n=400) |
Discussion
This study assessed the hidden burden of hyperuricemia and its associated factors among adult staff members of the EPHI, Ethiopia.
The prevalence of hyperuricemia was found to be 31% (95% CI 26.5–35.8). This figure is in line with studies conducted in western China (27.9%)42 and Taiwan (30.6%)43 and in males of developing countries (35.2%).7 On the other hand, the finding of our study is lower than in a study on South Indian adult patients with stable coronary artery disease (46.5%).44 However, the prevalence of hyperuricemia in this study is higher than in studies conducted with Black Africans (25%),45 in a rural northeast Chinese population (10.9%),46 in middle-aged, urban Chinese men (25%),34 and in populations from the sub-Himalayan region in North India (24%),47 Republic of Korea (11.4%),29 Italy (6.3%)48 and Eastern Europe(25%).49 These discrepancies may be due to differences in ethnic background and study populations. The discrepancies may also be due to differences in study settings, as the current study was conducted only among EPHI staff members who worked in a sitting position for a prolonged time; this may increase the prevalence of hyperuricemia because individuals who spend a prolonged time sitting at work are at high risk of acquiring the risk factors of chronic diseases, such as sedentary lifestyle.50 Thus, in turn, increases the chance of developing metabolic disorders, including abnormal elevation of serum uric acid levels.46,51 Variations in the findings could also be due to dietary variation, endogenous synthesis and degradation ratio, or purine metabolism of the study participants.52
In the current study, sex, age, cigarette smoking and serum LDL level were found to be significantly associated with hyperuricemia. Accordingly, male participants were 1.66 times more likely to have hyperuricemia compared with female individuals. This finding is consistent with studies conducted in Nigeria,53 China54 and India,55 which revealed that males have a higher risk of hyperuricemia. The higher likelihood of hyperuricemia in males than females may be due to the action of sex hormones, in that the female sex hormone estrogen helps in the excretion of uric acid and could have the ability to maintain blood uric acid levels.56,57 Besides, the risk of exposure to environmental and dietary factors that aid the synthesis of purine is higher in males than females, which may also contribute to the production of more uric acid owing to regulatory activity of purine metabolism, which further results in the release of high levels of uric acid into the circulation.58,59 In addition, males may also be more likely to take part in alcohol drinking activities compared to females, and alcoholic products have the ability to activate the expression of ATP binding cassette transporter subfamily G member 2 (ABCG2). The activation of ABCG2 stimulates the reabsorption of urate in the renal ductal tube, which, in turn, results in an increased serum uric acid level.60,61
In this study, the odds of having hyperuricemia were 1.59 times higher among participants who were aged >45 years than in younger participants. In line with the current study, hyperuricemia was found to be significantly associated with older age in studies conducted on female participants in a rural northeast Chinese population46 and in a Taiwanese population.62 A possible reason for the increased odds of hyperuricemia in older age may be due to changes in renal function and body composition. After the age of 40, kidney function decreases by 10% for every 10-year increase in age, leading to impaired excretion of uric acid, which may, in turn, result in the accumulation of uric acid in the blood.63 Furthermore, during aging, predisposing factors for hyperuricemia and crystal deposition, such as aging of joints, osteoarthritis and prolonged overloading of joints due to being overweight, become more prevalent. Therefore, the burden of having hyperuricemia may be increased.64
In the present study, the odds of having hyperuricemia among cigarette smokers were 2.05 times higher than for non-cigarette-smoking participants, which is supported by other, similar studies.65–67 One possible explanation for the increase in serum uric acid levels following cigarette smoking could be the deleterious effects of smoking on renal function and structure due to the production of reactive oxygen species. The toxic effect of cigarette smoking on renal cells can lead to the reduction of renal function and structural impairment, which further results in a decrease in uric acid excretion and an increase in serum uric acid level.68,69 The protective role of uric acid against oxidative molecules may be another possible reason, because cigarette smoking generates oxidative molecules such as reactive oxygen species in the body, and to overcome the metabolic stress more uric acid will be produced.1 Uric acid is the most abundant aqueous antioxidant, accounting for up to 60% of serum free radical scavenging capacity, and it is an important intracellular free radical scavenger during metabolic stress, including cigarette smoking.70,71 Antioxidants are believed to play an important role in resisting oxidative damage, by scavenging the oxidants resulting from free radicals in the cigarette or produced in the body as a result of ingredients in the cigarette.72 Therefore, the compensatory overproduction of uric acid may have contributed to the increased uric acid level.
Furthermore, the probability of having hyperuricemia was 1.70 times higher in participants with high serum LDL levels than in those who had normal serum LDL levels. This is consistent with the findings of previous studies conducted in different regions of the world.73–76 The possible reason for the high chance of hyperuricemia among participants with higher serum LDL levels than normal may be due to the coincidence of common risk factors such as cigarette smoking, unhealthy diet and environmental factors.77 Besides, the disturbances to metabolic processes in individuals with a high level of serum LDL may also have contributed to the production of high levels of uric acid. Even though the mechanisms linking dyslipidemia and hyperuricemia are not fully understood, it is hypothetically proposed that the synthesis of triglycerides and cholesterol will need NADPH as a reducing molecule for the fatty acid synthase complex and HMG-CoA reductase enzyme, respectively, which may result in an increase in uric acid production secondary to the up-regulation of the pentose phosphate pathway.78 In conclusion, we found that hyperuricemia was highly prevalent and statistically associated with older age, male sex, cigarette smoking and high serum LDL levels. Therefore, early screening to detect hyperuricemia could have advantages for the general population, to overcome the complications of hyperuricemia and to control it at an early stage.
Limitations
The main limitation of this study was its inability to assess the dietary habits of the participants, which are believed to be one of the factors associated with hyperuricemia. We were also unable to display participants on antihypertensive therapy in the multivariate model analysis. The number of participants was also relatively smell.
Abbreviations
CVD, cardiovascular disease; MS, metabolic syndrome; BMI, body mass index; LDL, low-density lipoprotein; HDL, high-density lipoprotein.
Data Sharing Statement
All data and material are available within the manuscript.
Ethics Approval and Consent to Participate
This study was conducted in accordance with the Declaration of Helsinki. Ethical approval was obtained from the Addis Ababa University, Biochemistry Department Ethics and Research Committee (DRERC) (protocol number M.Sc. 09/18, meeting number DRERC 08/18). Written informed consent was obtained from each study participant before running the study. Participants were informed that they had the full right to withdraw from the study at any time without justifying their reason. The results of the study participants were kept confidentially.
Acknowledgments
The authors would like to thank the Ethiopian Public Health institute and the staff members for their efforts in making this work a reality.
Author Contributions
All authors made substantial contributions to conception and design, acquisition of data, or analysis and interpretation of data; took part in drafting the article or revising it critically for important intellectual content; agreed to submit to the current journal; gave final approval of the version to be published; and agree to be accountable for all aspects of the work.
Funding
We did not receive any grants from a funding agency.
Disclosure
The authors report no conflicts of interest for this work.
References
1. Glantzounis G, Tsimoyiannis E, Kappas A, et al. Uric acid and oxidative stress. Curr Pharm Des. 2005;11:4145–4151. doi:10.2174/138161205774913255
2. Becker BF. Towards the physiological function of uric acid. Free Radic Biol Med. 1993;14:615–631. doi:10.1016/0891-5849(93)90143-I
3. Robinson P, Taylor W, Merriman T. Systematic review of the prevalence of gout and hyperuricaemia in Australia. Intern Med J. 2012;42:997–1007. doi:10.1111/j.1445-5994.2012.02794.x
4. George C, Minter DA. Hyperuricemia. StatPearls [Internet]. StatPearls Publishing; 2019.
5. Mazza A, Lenti S, Schiavon L, et al. Asymptomatic hyperuricemia is a strong risk factor for resistant hypertension in elderly subjects from general population. Biomed Pharmacother. 2017;86:590–594. doi:10.1016/j.biopha.2016.11.104
6. Lin K-C, Lin H, Chou P. The interaction between uric acid level and other risk factors on the development of gout among asymptomatic hyperuricemic men in a prospective study. J Rheumatol. 2000;27:1501–1505.
7. Conen D, Wietlisbach V, Bovet P, et al. Prevalence of hyperuricemia and relation of serum uric acid with cardiovascular risk factors in a developing country. BMC Public Health. 2004;4:9. doi:10.1186/1471-2458-4-9
8. Liote F, Pascart T. From hyperuricaemia to gout: what are the missing links? Nat Rev Rheumatol. 2018;14:448–449. doi:10.1038/s41584-018-0040-6
9. Smith E, March L. Global prevalence of hyperuricemia: a systematic review of population-based epidemiological studies: abstract number: 2236. Arthritis Rheumatol. 2015;67:2690–2692.
10. Abbasian M, Ebrahimi H, Delvarianzadeh M, et al. Association between serum uric acid (SUA) levels and metabolic syndrome (MetS) components in personnel of Shahroud University of Medical Sciences. Diabetes Metab Syndr. 2016;10:132–136. doi:10.1016/j.dsx.2016.01.003
11. Acevedo A, Benavides J, Chowdhury M, et al. Hyperuricemia and cardiovascular disease in patients with hypertension. Conn Med. 2016;80:85–90.
12. Avula NR, Shenoy D. Evaluation of association of hyperuricaemia with metabolic syndrome and insulin resistance. J Clin Diagn Res. 2016;10:OC32. doi:10.7860/JCDR/2016/22182.9113
13. Yadav D, Lee ES, Kim HM, et al. Hyperuricemia as a potential determinant of metabolic syndrome. J Lifestyle Med. 2013;3:98.
14. Maloberti A, Giannattasio C, Bombelli M, et al. Hyperuricemia and risk of cardiovascular outcomes: the experience of the URRAH (Uric Acid Right for Heart Health) project. High Blood Pressure Cardiovasc Prev. 2020;27:121–128. doi:10.1007/s40292-020-00368-z
15. Haque T, Rahman S, Islam S, et al. Assessment of the relationship between serum uric acid and glucose levels in healthy, prediabetic and diabetic individuals. Diabetol Metab Syndr. 2019;11:1–8.
16. Waheed YA, Yang F, Sun D. The role of asymptomatic hyperuricemia in the progression of chronic kidney disease CKD and cardiovascular diseases CVD. Korean J Intern Med. 2020. doi:10.3904/kjim.2020.340
17. Ali N, Miah R, Hasan M, et al. Association between serum uric acid and metabolic syndrome: a cross-sectional study in Bangladeshi adults. Sci Rep. 2020;10:1–7.
18. Lee C-L, Tsai SF, Mildner M, Matiasek J, Elbe-Bürger A. Association between mortality and serum uric acid levels in non-diabetes-related chronic kidney disease: an analysis of the National Health and Nutrition Examination Survey, USA, 1999–2010. Sci Rep. 2020;10:1–8. doi:10.1038/s41598-019-56847-4
19. Ali N, Mahmood S, Islam F, et al. Relationship between serum uric acid and hypertension: a cross-sectional study in Bangladeshi adults. Sci Rep. 2019;9:1–7.
20. Johnson RJ, Nakagawa T, Sanchez-Lozada LG, et al. Sugar, uric acid, and the etiology of diabetes and obesity. Diabetes. 2013;62:3307–3315. doi:10.2337/db12-1814
21. Zhu Y, Hu Y, Huang T, et al. High uric acid directly inhibits insulin signalling and induces insulin resistance. Biochem Biophys Res Commun. 2014;447:707–714. doi:10.1016/j.bbrc.2014.04.080
22. Yang T, Chu C-H, Bai C-H, et al. Uric acid level as a risk marker for metabolic syndrome: a Chinese cohort study. Atherosclerosis. 2012;220:525–531. doi:10.1016/j.atherosclerosis.2011.11.014
23. Nakanishi N, Okamoto M, Yoshida H, et al. Serum uric acid and risk for development of hypertension and impaired fasting glucose or Type II diabetes in Japanese male office workers. Eur J Epidemiol. 2003;18:523–530. doi:10.1023/A:1024600905574
24. Tsouli SG, Liberopoulos EN, Mikhailidis DP, et al. Elevated serum uric acid levels in metabolic syndrome: an active component or an innocent bystander? Metabolism. 2006;55:1293–1301. doi:10.1016/j.metabol.2006.05.013
25. Dehghan A, Van Hoek M, Sijbrands EJ, et al. High serum uric acid as a novel risk factor for type 2 diabetes. Diabetes Care. 2008;31:361–362. doi:10.2337/dc07-1276
26. Verdecchia P, Schillaci G, Reboldi G, et al. Relation between serum uric acid and risk of cardiovascular disease in essential hypertension: the PIUMA study. Hypertension. 2000;36:1072–1078. doi:10.1161/01.HYP.36.6.1072
27. Wallace KL, Riedel AA, Joseph-Ridge N, et al. Increasing prevalence of gout and hyperuricemia over 10 years among older adults in a managed care population. J Rheumatol. 2004;31:1582–1587.
28. Vázquez-Mellado J, Hernández EA, Burgos-Vargas R. Primary prevention in rheumatology: the importance of hyperuricemia. Best Pract Res Clin Rheumatol. 2004;18:111–124. doi:10.1016/j.berh.2004.01.001
29. Kim Y, Kang J, Kim G-T. Prevalence of hyperuricemia and its associated factors in the general Korean population: an analysis of a population-based nationally representative sample. Clin Rheumatol. 2018;37:2529–2538. doi:10.1007/s10067-018-4130-2
30. Lohsoonthorn V, Dhanamun B, Williams MA. Prevalence of hyperuricemia and its relationship with metabolic syndrome in Thai adults receiving annual health exams. Arch Med Res. 2006;37:883–889. doi:10.1016/j.arcmed.2006.03.008
31. Sari I, Akar S, Pakoz B, et al. Hyperuricemia and its related factors in an urban population, Izmir, Turkey. Rheumatol Int. 2009;29:869–874. doi:10.1007/s00296-008-0806-2
32. Uaratanawong S, Suraamornkul S, Angkeaw S, et al. Prevalence of hyperuricemia in Bangkok population. Clin Rheumatol. 2011;30:887–893. doi:10.1007/s10067-011-1699-0
33. Qiu L, Cheng X-Q, Wu J, et al. Prevalence of hyperuricemia and its related risk factors in healthy adults from Northern and Northeastern Chinese provinces. BMC Public Health. 2013;13:664. doi:10.1186/1471-2458-13-664
34. Villegas R, Xiang Y-B, Cai Q, et al. Prevalence and determinants of hyperuricemia in middle-aged, urban Chinese men. Metabol Syndr Related Disord. 2010;8:263–270. doi:10.1089/met.2009.0084
35. Raina S, Agarwal VK, Kapoor D, et al. Hypertension as determinant of hyperuricemia: a case control study from the Sub-Himalayan Region in North India. J Assoc Physicians India. 2018;66:14–18.
36. Greenfield TK, Kerr WC. Alcohol measurement methodology in epidemiology: recent advances and opportunities. Addiction. 2008;103:1082–1099. doi:10.1111/j.1360-0443.2008.02197.x
37. Tesfaye F, Byass P, Wall S, et al. Peer reviewed: Association of Smoking and Khat (Catha edulis Forsk) use with high blood pressure among adults in Addis Ababa, Ethiopia, 2006. Prev Chronic Dis. 2008;5.
38. Riley L, Guthold R, Cowan M, et al. The World Health Organization STEPwise approach to noncommunicable disease risk-factor surveillance: methods, challenges, and opportunities. Am J Public Health. 2016;106:74–78. doi:10.2105/AJPH.2015.302962
39. World Health Organization. Defining the problem of overweight and obesity. World Health Organization Obesity: preventing and managing the global epidemic: report of a Who Consultation Geneva. 2000. 241–243.
40. Parati G, Stergiou G, O’Brien E, et al. European Society of Hypertension practice guidelines for ambulatory blood pressure monitoring. J Hypertens. 2014;32:1359–1366. doi:10.1097/HJH.0000000000000221
41. Thefeld W, Hoffmeister H, Busch E-W, et al. Normalwerte der Serumharnsäure in Abhängigkeit von Alter und Geschlecht mit einem neuen enzymatischen Harnsäurefarbtest. Deutsche medizinische Wochenschrift (1946). 1973;98:380–384. doi:10.1055/s-0028-1106819
42. Shen Y, Wang Y, Chang C, et al. Prevalence and risk factors associated with hyperuricemia among working population at high altitudes: a cross-sectional study in Western China. Clin Rheumatol. 2019;38:1375–1384. doi:10.1007/s10067-018-4391-9
43. Lin S-D, Tsai D-H, Hsu S-R. Association between serum uric acid level and components of the metabolic syndrome. J Chin Med Assoc. 2006;69:512–516. doi:10.1016/S1726-4901(09)70320-X
44. Patil S, Vijayaraghavan G, Kartha C. Prevalence and determinants of hyperuricemia in South Indian adult patients with stable coronary artery disease. J Pract Cardiovasc Sci. 2019;5:191. doi:10.4103/jpcs.jpcs_48_19
45. Moulin SR, Baldo MP, Souza JB, et al. Distribution of serum uric acid in black Africans and its association with cardiovascular risk factors. J Clin Hypertens. 2017;19:45–50. doi:10.1111/jch.12863
46. Yu S, Yang H, Guo X, et al. Prevalence of hyperuricemia and its correlates in rural Northeast Chinese population: from lifestyle risk factors to metabolic comorbidities. Clin Rheumatol. 2016;35:1207–1215. doi:10.1007/s10067-015-3051-6
47. Raina S, Agarwal VK, Kapoor D, et al. Hypertension as determinant of hyperuricemia: a case control study from the Sub-Himalayan Region in North India. J Assoc Physicians India. 2018;66:14.
48. Maloberti A, Qualliu E, Occhi L, et al. Hyperuricemia prevalence in healthy subjects and its relationship with cardiovascular target organ damage. Nutr Metabol Cardiovasc Dis. 2021;31:178–185. doi:10.1016/j.numecd.2020.08.015
49. Redon P, Maloberti A, Facchetti R, et al. Gender-related differences in serum uric acid in treated hypertensive patients from central and east European countries: findings from the blood pressure control rate and cardiovascular risk profile study. J Hypertens. 2019;37:380–388. doi:10.1097/HJH.0000000000001908
50. Van Mechelen W. A physically active lifestyle–public health’s best buy? Br J Sports Med. 1997;31:264. doi:10.1136/bjsm.31.4.264
51. Cui L, Meng L, Wang G, et al. Prevalence and risk factors of hyperuricemia: results of the Kailuan cohort study. Modern Rheumatol. 2017;27:1066–1071. doi:10.1080/14397595.2017.1300117
52. Zgaga L, Theodoratou E, Kyle J, et al. The association of dietary intake of purine-rich vegetables, sugar-sweetened beverages and dairy with plasma urate, in a cross-sectional study. PLoS One. 2012;7:e38123. doi:10.1371/journal.pone.0038123
53. Ewenighi C, Dimkpa U, Ezeugwu U, et al. Prevalence of hyperuricemia and its risk factors in healthy male adults from Abakaliki metropolis, Nigeria. J Mol Pathophysiol. 2015;4:94–98. doi:10.5455/jmp.20150915011842
54. Liu L, Lou S, Xu K, et al. Relationship between lifestyle choices and hyperuricemia in Chinese men and women. Clin Rheumatol. 2013;32:233–239. doi:10.1007/s10067-012-2108-z
55. Mundhe SA, Mhasde DR. The study of prevalence of hyperuricemia and metabolic syndrome in type 2 diabetes mellitus. Int J Adv Med. 2016;3:241–249. doi:10.18203/2349-3933.ijam20160655
56. Sumino H, Ichikawa S, Kanda T, et al. Reduction of serum uric acid by hormone replacement therapy in postmenopausal women with hyperuricaemia. Lancet. 1999;354:650. doi:10.1016/S0140-6736(99)92381-4
57. Hak AE, Choi HK. Menopause, postmenopausal hormone use and serum uric acid levels in US women–the Third National Health and Nutrition Examination Survey. Arthritis Res Ther. 2008;10:R116. doi:10.1186/ar2519
58. Gordon T, Kannel WB. Drinking and its relation to smoking, BP, blood lipids, and uric acid: the Framingham Study. Arch Intern Med. 1983;143:1366–1374. doi:10.1001/archinte.1983.00350070086016
59. Miao Z, Li C, Chen Y, et al. Dietary and lifestyle changes associated with high prevalence of hyperuricemia and gout in the Shandong coastal cities of Eastern China. J Rheumatol. 2008;35:1859–1864.
60. Li Z, Guo X, Liu Y, et al. The relation of moderate alcohol consumption to hyperuricemia in a rural general population. Int J Environ Res Public Health. 2016;13:732. doi:10.3390/ijerph13070732
61. Choi HK, Curhan G. Beer, liquor, and wine consumption and serum uric acid level: the Third National Health and Nutrition Examination Survey. Arthritis Care Res. 2004;51:1023–1029. doi:10.1002/art.20821
62. Lee M-S, Lin S-C, Chang H-Y, et al. High prevalence of hyperuricemia in elderly Taiwanese. Asia Pac J Clin Nutr. 2005;14(3).
63. Menè P, Punzo G. Uric acid: bystander or culprit in hypertension and progressive renal disease? J Hypertens. 2008;26:2085–2092. doi:10.1097/HJH.0b013e32830e4945
64. Kuzuya M, Ando F, Iguchi A, et al. Effect of aging on serum uric acid levels: longitudinal changes in a large Japanese population group. J Gerontol a Biol Sci Med Sci. 2002;57:M660–M664. doi:10.1093/gerona/57.10.M660
65. Kim S-K, Choe J-Y. Association between smoking and serum uric acid in Korean population: data from the seventh Korea national health and nutrition examination survey 2016. Medicine. 2019;98. doi:10.1097/MD.0000000000014507
66. Kim JA, Chun EJ, Lee MS, et al. Relationship between amount of cigarette smoking and coronary atherosclerosis on coronary CTA in asymptomatic individuals. Int J Cardiovasc Imaging. 2013;29:21–28. doi:10.1007/s10554-013-0224-8
67. Abdulnaby NK, Sayed AO, Shalaby NM. Predictive value of serum uric acid in hospitalized adolescents and adults with acute asthma. Ther Clin Risk Manag. 2016;12:1701. doi:10.2147/TCRM.S116188
68. El-Safty IA, Gadallah M, Shouman AE, et al. Subclinical nephrotoxicity caused by smoking and occupational silica exposure among Egyptian industrial workers. Arch Med Res. 2003;34:415–421. doi:10.1016/S0188-4409(03)00077-8
69. Baggio B, Budakovic A, Dalla Vestra M, et al. Effects of cigarette smoking on glomerular structure and function in type 2 diabetic patients. J Am Soc Nephrol. 2002;13:2730–2736. doi:10.1097/01.ASN.0000032422.81130.68
70. Waring SW, Webb DJ, Maxwell SR. Systemic uric acid administration increases serum antioxidant capacity in healthy volunteers. J Cardiovasc Pharmacol. 2001;38:365–371. doi:10.1097/00005344-200109000-00005
71. Waring W. Uric acid: an important antioxidant in acute ischaemic stroke. QJM. 2002;95:691–693. doi:10.1093/qjmed/95.10.691
72. Mouhamed DH, Ezzaher A, Neffati F, et al. Effect of cigarette smoking on plasma uric acid concentrations. Environ Health Prev Med. 2011;16:307–312. doi:10.1007/s12199-010-0198-2
73. Peng T-C, Wang -C-C, Kao T-W, et al. Relationship between hyperuricemia and lipid profiles in US adults. Biomed Res Int. 2015;2015. doi:10.1155/2015/127596
74. Ali N, Rahman S, Islam S, et al. The relationship between serum uric acid and lipid profile in Bangladeshi adults. BMC Cardiovasc Disord. 2019;19:42. doi:10.1186/s12872-019-1026-2
75. Liu F, Du G-L, Song N, et al. Hyperuricemia and its association with adiposity and dyslipidemia in Northwest China: results from cardiovascular risk survey in Xinjiang (CRS 2008–2012). Lipids Health Dis. 2020;19:1–12. doi:10.1186/s12944-020-01211-z
76. Son M, Seo J, Yang S. Association between dyslipidemia and serum uric acid levels in Korean adults: Korea National Health and Nutrition Examination Survey 2016–2017. PLoS One. 2020;15:e0228684. doi:10.1371/journal.pone.0228684
77. Li NF, Wang HM, Yang J, et al. Serum uric acid is associated with metabolic risk factors for cardiovascular disease in the Uygur population. Appl Physiol Nutr Metabol. 2009;34:1032–1039. doi:10.1139/H09-101
78. Ali N, Perveen R, Rahman S, et al. Prevalence of hyperuricemia and the relationship between serum uric acid and obesity: a study on Bangladeshi adults. PLoS One. 2018;13:e0206850. doi:10.1371/journal.pone.0206850
 © 2021 The Author(s). This work is published and licensed by Dove Medical Press Limited. The full terms of this license are available at https://www.dovepress.com/terms.php and incorporate the Creative Commons Attribution - Non Commercial (unported, v3.0) License.
By accessing the work you hereby accept the Terms. Non-commercial uses of the work are permitted without any further permission from Dove Medical Press Limited, provided the work is properly attributed. For permission for commercial use of this work, please see paragraphs 4.2 and 5 of our Terms.
© 2021 The Author(s). This work is published and licensed by Dove Medical Press Limited. The full terms of this license are available at https://www.dovepress.com/terms.php and incorporate the Creative Commons Attribution - Non Commercial (unported, v3.0) License.
By accessing the work you hereby accept the Terms. Non-commercial uses of the work are permitted without any further permission from Dove Medical Press Limited, provided the work is properly attributed. For permission for commercial use of this work, please see paragraphs 4.2 and 5 of our Terms.