")
Back to Journals » International Journal of Chronic Obstructive Pulmonary Disease » Volume 12
Hyperinflated lungs compress the heart during expiration in COPD patients: a new finding on dynamic-ventilation computed tomography
Authors Xu Y , Yamashiro T , Moriya H, Tsubakimoto M, Tsuchiya N, Nagatani Y, Matsuoka S, Murayama S
Received 5 July 2017
Accepted for publication 27 September 2017
Published 26 October 2017 Volume 2017:12 Pages 3123—3131
DOI https://doi.org/10.2147/COPD.S145599
Checked for plagiarism Yes
Review by Single anonymous peer review
Peer reviewer comments 3
Editor who approved publication: Dr Richard Russell
Supplementary video 1 for a 39-year-old male current smoker without airflow limitation underwent dynamic-ventilation CT for preoperative analysis of parietal pleural adhesions caused by a benign rib tumor.
Views: 15246
Yanyan Xu,1,2 Tsuneo Yamashiro,1 Hiroshi Moriya,3 Maho Tsubakimoto,1 Nanae Tsuchiya,1 Yukihiro Nagatani,4 Shin Matsuoka,5 Sadayuki Murayama1
On behalf of the ACTIve Study Group
1Department of Radiology, Graduate School of Medical Science, University of the Ryukyus, Nishihara, Japan; 2Department of Radiology, China-Japan Friendship Hospital, Beijing, People’s Republic of China; 3Department of Radiology, Ohara General Hospital, Fukushima, Japan; 4Department of Radiology, Shiga University of Medical Science, Otsu, Japan; 5Department of Radiology, St Marianna University School of Medicine, Kawasaki, Japan
Purpose: The aims of this study were to evaluate dynamic changes in heart size during the respiratory cycle using four-dimensional computed tomography (CT) and to understand the relationship of these changes to airflow limitation in smokers.
Materials and methods: A total of 31 smokers, including 13 with COPD, underwent four-dimensional dynamic-ventilation CT during regular breathing. CT data were continuously reconstructed every 0.5 s, including maximum cross-sectional area (CSA) of the heart and mean lung density (MLD). Concordance between the cardiac CSA and MLD time curves was expressed by cross-correlation coefficients. The CT-based cardiothoracic ratio at inspiration and expiration was also calculated. Comparisons of the CT indices between COPD patients and non-COPD smokers were made using the Mann–Whitney test. Spearman rank correlation analysis was used to evaluate associations between CT indices and the forced expiratory volume in 1 s (FEV1.0) relative to the forced vital capacity (FVC).
Results: Cardiac CSA at both inspiration and expiration was significantly smaller in COPD patients than in non-COPD smokers (P<0.05). The cross-correlation coefficient between cardiac CSA and MLD during expiration significantly correlated with FEV1.0/FVC (ρ=0.63, P<0.001), suggesting that heart size decreases during expiration in COPD patients. The change in the cardiothoracic ratio between inspiration and expiration frames was significantly smaller in COPD patients than in non-COPD smokers (P<0.01).
Conclusion: Patients with COPD have smaller heart size on dynamic-ventilation CT than non-COPD smokers and have abnormal cardiac compression during expiration.
Keywords: heart, COPD, computed tomography, ventilation, emphysema
Introduction
COPD is a heterogeneous disorder with significant extrapulmonary effects that contribute to disease severity.1–5 Obstruction of expiratory airflow and loss of lung elasticity lead to lung hyperinflation and elevated intrathoracic pressure, causing various cardiovascular sequelae.6–8 Increased intrathoracic pressure reduces venous return and thus reduces right ventricular output.9–13 Furthermore, hyperinflation is associated with reduced ventricular filling, reduced stroke volume, and lower cardiac output.14–18 In addition, Watz et al15 found that severe COPD is associated with smaller cardiac size on echocardiography.
It has previously been reported that, in patients with severe COPD or emphysema, the heart appears narrowed on chest radiography.19 However, dynamic changes in heart size throughout the respiratory cycle are unknown. Tomita et al20 reported that the cardiac cross-sectional area (CSA) is significantly larger on expiratory computed tomography (CT) than on inspiratory CT in patients without severe airflow limitation and that the increase in heart size from the inspiratory to expiratory phase is correlated with the degree of expiration and the upward movement of the diaphragm. Patients with COPD have increased intrathoracic pressure during expiration,21 which is tightly correlated with decreased venous return, decreased cardiac transmural filling pressure, and decreased cardiac output.7–18 Furthermore, both decreased compliance of the pulmonary parenchyma and increased pulmonary vascular resistance due to hyperinflation can reduce cardiac output.22,23 In addition, respiratory muscle insufficiency, including flattened diaphragms due to pulmonary hyperinflation, can reduce the inward recoil forces of the thoracic cage and thereby decrease cardiovascular pumping action in patients with COPD.24,25
Based on these observations and physiological theories, we hypothesized that changes in heart size throughout the respiratory cycle would differ between COPD patients and non-COPD subjects and that these differences would correlate with the severity of COPD (ie, airflow limitation). Recently, 320-row and 256-row multi-detector CT scanners have been developed that can continuously scan the thorax under normal breathing conditions, allowing visualization of thoracic respiratory movements.26,27 Although dynamic-ventilation CT cannot cover the entire lung (≤160 mm in the z-axis), continuous mean lung density (MLD) values of the scanned lung can be obtained. A strong correlation between MLD and lung volume has previously been reported.28,29 Thus, changes in MLD reflect pulmonary ventilation movements and can be used as an index of ventilation status.
The aims of this study were 1) to compare changes in heart size during the respiratory cycle in smokers with and without COPD using four-dimensional dynamic-ventilation CT and 2) to evaluate abnormal cardiac movements during ventilation in patients with COPD and determine the association of these abnormalities with the severity of obstructive lung disease.
Materials and methods
This retrospective study was approved by the institutional review board at Ohara General Hospital. Dynamic-ventilation CT was performed as part of routine clinical care at Ohara Medical Center, based on the need to observe parietal pleural invasion/adhesion by resectable thoracic neoplasms or to monitor excessive dynamic airway collapse in COPD patients. Based on the Ethical Guidelines for Medical and Health Research Involving Human Subjects, enacted by the Ministry of Health, Labor and Welfare of the Japanese Government, the institutional review board at Ohara General Hospital waived written informed consent from enrolled patients for this retrospective study. All CT data and patient information were anonymized and stored for analyses. This study was also arranged as part of the Area-detector Computed Tomography for the Investigation of Thoracic Diseases (ACTIve) Study, an ongoing multicenter research alliance in Japan.
Subjects
A total of 46 subjects underwent both conventional and dynamic-ventilation CT scans. After previewing the dynamic-ventilation CT images, 15 patients were excluded from the study due to insufficient cardiac scanning fields (cranial scanning field settings). Ultimately, 31 smokers (15 ex-smokers and 16 current smokers; five females and 26 males; mean age 72±10 years) were included in the study (Table 1). All subjects had undergone spirometry and chest CT scans at Ohara Medical Center at the Ohara General Hospital. None of the patients had a diagnosis of heart failure. Among the 31 subjects, 13 had previously been included in a different research study.27 The results presented in this study do not overlap with the results presented in the previous report.
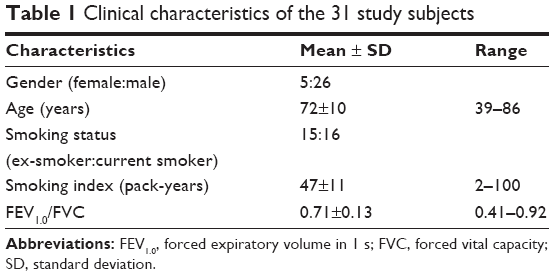 | Table 1 Clinical characteristics of the 31 study subjects |
CT scans
All patients were scanned on a 320-row CT scanner (Aquilion ONE; Toshiba Medical Systems, Otawara, Japan) for both conventional (static) and dynamic-ventilation CT studies. Dynamic scanning was performed at a fixed point without bed movement (non-helical scanning), resulting in fluoroscopic images of 160 mm in length.26,27 Scanning and reconstruction parameters for the dynamic-ventilation CT were as follows: tube current =40 mA (n=27) or 20 mA (n=4); tube voltage =120 kVp; rotation time =0.35 s; total scanning time =4.5–6.5 s; scanning field of view (FOV) =320 (medium, n=12) or 400 mm (large, n=19); imaging FOV =320 mm; collimation =0.5 mm; slice thickness =1 mm; reconstruction kernel = FC15 (for mediastinum); reconstruction interval =0.5 s/frame (total 9–13 frames); reconstruction method = half reconstruction. Scan data were converted to CT images using an iterative reconstruction method (adaptive iterative dose reduction using three-dimensional processing [AIDR3D], mild setting). Before the dynamic-ventilation scan, patients were coached on continuous deep breathing. Radiologic technologists monitored patients’ respiratory movements and confirmed that expiratory movement from the peak inspiratory phase to the peak expiratory phase was included during the scanning. Radiation dose assessment for dynamic-ventilation CT was as follows: for CT scans with a tube current of 40 mA, the dose–length product (DLP) value for a single rotation was 20.4 mGy·cm (medium FOV) or 22.5 mGy·cm (large FOV). For adjusted CT scans with a tube current of 20 mA, the DLP value for a single rotation was 10.2 mGy·cm (medium FOV) or 11.3 mGy·cm (large FOV). The total estimated radiation exposure for dynamic-ventilation CT scans of 4.5–6.5 s varied from 2.7 to 6.1 mSv (mean 5.3 mSv).
A conventional static chest CT was also performed using helical scanning to image the entire thorax. Parameters for the conventional chest CT were as follows: tube currents = automatic exposure control (AEC); tube voltage =120 kVp; scanning method = helical scanning; rotation time =0.35 s; beam pitch =0.828; imaging FOV =320 mm; collimation = 0.5 mm ×80 rows; slice thickness =1 mm; reconstruction kernel = FC17 (for mediastinum); iterative reconstruction = AIDR3D (mild setting).
Image analysis: continuous lung density measurement
Using commercially available software (Lung Volume Measurement; Toshiba Medical Systems), the MLD was measured automatically in each frame, and a time curve for the MLD on the dynamic-ventilation scans was created. The peak inspiratory frame was defined as the lowest MLD on the time curve, and the peak expiratory frame was defined as the highest MLD. Thus, the expiratory phase was defined as occurring during the peak inspiratory to peak expiratory frames on the MLD curve.
Image analysis: continuous measurement of cardiac CSA
At each frame of the dynamic-ventilation CT, the cardiac CSA was measured semi-automatically by research software that had the same function as the CT scanner console. Based on a previously published method,20 the following process was repeated in each subject: first, a threshold was set using Hounsfield units (HU) to exclude the pericardial fat pad (from 0 to 300 HU); second, at each time frame, all images that contained the heart were identified and the maximum cardiac CSA was determined; third, the boundary of the heart was traced and the maximum cardiac CSA was recorded.
The CSAs measured at the peak inspiratory and peak expiratory frames were labeled as CSAinsp and CSAexp.
Image analysis: CT-based cardiothoracic ratio (CTR) measurement
Employing the same research software used for the cardiac CSA measurements, the maximum transverse cardiac diameter and the maximum transverse diameter of the lungs on the peak inspiratory and peak expiratory frames were manually measured.
Similar to previous studies that calculated the CT-based CTR,20,30 the CTR was defined as the maximum transverse cardiac diameter divided by the maximum transverse lung diameter. For each patient, inspiratory CTR, expiratory CTR, and the difference between inspiratory and expiratory CTR (ΔCTR = expiratory CTR − inspiratory CTR) were obtained.
Image analysis: emphysema and lung volume measurement on conventional chest CT
On the conventional helical CT scans, an emphysema measurement was performed using commercially available software (Lung Volume Measurement). The percent low attenuation volume (LAV%, <−950 HU) and the lung volume of the entire lung were automatically obtained.
Spirometry
All subjects performed spirometry, including forced expiratory volume in 1 s (FEV1.0) and forced vital capacity (FVC), according to the American Thoracic Society standards.5 The spirometric values of the study participants are summarized in Table 1. Spirometry was performed within 15 days of the chest CT. Based on the criteria by the American Thoracic Society, 13 subjects were diagnosed with COPD. The other 18 smokers did not meet the criteria for COPD (non-COPD smokers).
Statistical analysis
Continuous variables are expressed as mean ± standard deviation. Comparisons of continuous variables, including CT indices of COPD patients versus non-COPD smokers, were made by the Mann–Whitney test. Cross-correlation coefficients (CCCs; −1≤ R ≤1) were calculated between the MLD and cardiac CSA time curves. If the two time curves had similar shapes and directions over time, the coefficient approached 1.26,27 Thus, if the cardiac CSA became larger during expiration (ie, during MLD increase), the CCC contained some positive values. Spearman rank correlation analysis was used to evaluate the associations between CT indices and FEV1.0/FVC. A P-value of <0.05 was considered significant. All statistical analyses were performed using JMP 12.0 software (SAS Institute Inc., Cary, NC, USA).
Results
CT indices from conventional helical CT
The LAV% was significantly larger in COPD patients than in non-COPD smokers (P<0.001; Table 2), and significantly correlated with FEV1.0/FVC (ρ=−0.78, P<0.0001). Lung volume, particularly the value adjusted for by the body surface area,31 was significantly larger in COPD patients than in non-COPD smokers, suggesting that the lungs were hyperinflated in COPD patients.
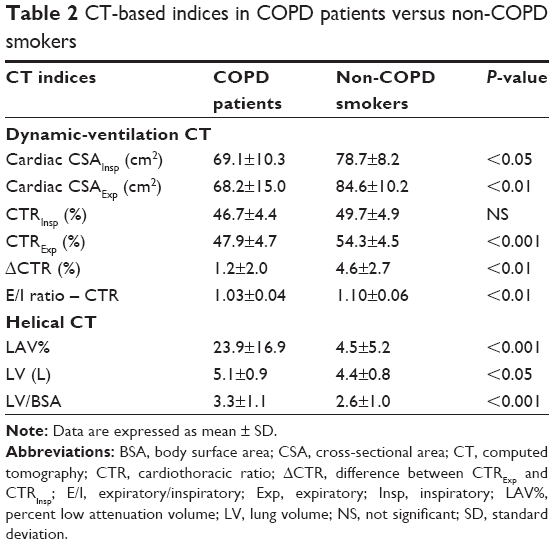 | Table 2 CT-based indices in COPD patients versus non-COPD smokers |
Maximum cardiac CSA on peak inspiratory and expiratory frames
On the maximum cardiac CSA time curve, the CSA was significantly smaller in COPD patients than in non-COPD patients on both the peak inspiratory and peak expiratory frames (P<0.05; Table 2). Interestingly, the mean value of the maximum cardiac CSA slightly decreased from the peak inspiratory to the peak expiratory frame in COPD patients (69.1 cm2 at inspiration, 68.2 cm2 at expiration), whereas it increased in non-COPD smokers (Figures 1 and 2). The expiratory/inspiratory ratio of the maximum cardiac CSA demonstrated a moderate correlation with FEV1.0/FVC (ρ=0.55, P<0.01), suggesting that a smaller maximum cardiac CSA on the peak expiratory frame correlated with more severe airflow limitation.
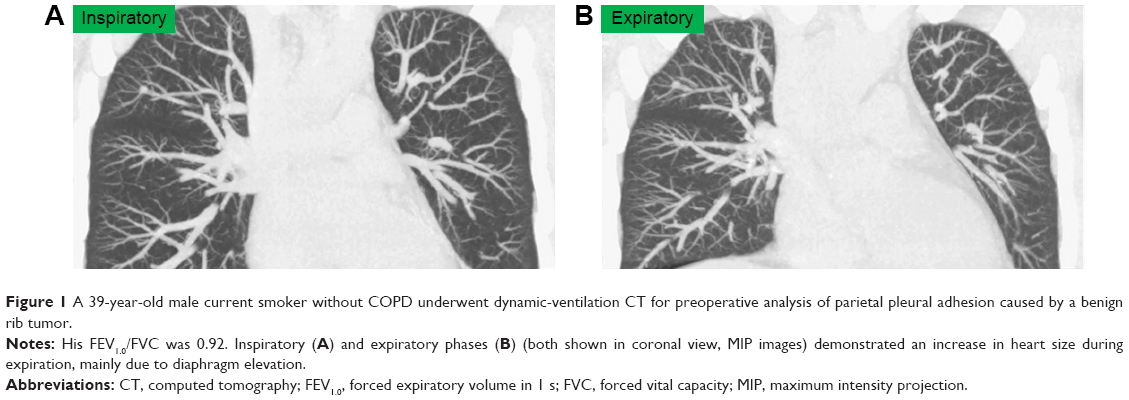 | Figure 1 A 39-year-old male current smoker without COPD underwent dynamic-ventilation CT for preoperative analysis of parietal pleural adhesion caused by a benign rib tumor. |
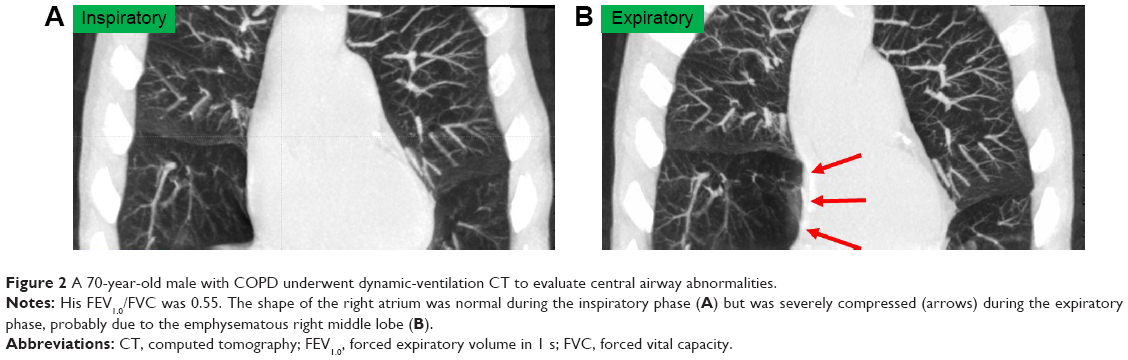 | Figure 2 A 70-year-old male with COPD underwent dynamic-ventilation CT to evaluate central airway abnormalities. |
CCC between the maximum cardiac CSA and MLD time curves
The CCC between the maximum cardiac CSA and MLD time curves during the entire cycle (9–13 frames) significantly correlated with FEV1.0/FVC (ρ=0.56, P<0.01), suggesting that subjects with increasing heart size during expiration/decreasing heart size during inspiration have less airflow limitation. Interestingly, the CCC between the maximum cardiac CSA and MLD time curves during the expiratory frames only (5–12 frames) demonstrated a higher correlation with FEV1.0/FVC (ρ=0.63, P<0.001) than the CCC during the entire cycle. Nine of 13 (69%) patients with COPD demonstrated a negative CCC during the expiratory phase, suggesting that these patients had a decreasing heart size during expiration, in contrast to normal physiological phenomena (Table 3, Figure 3, Videos S1 and S2).
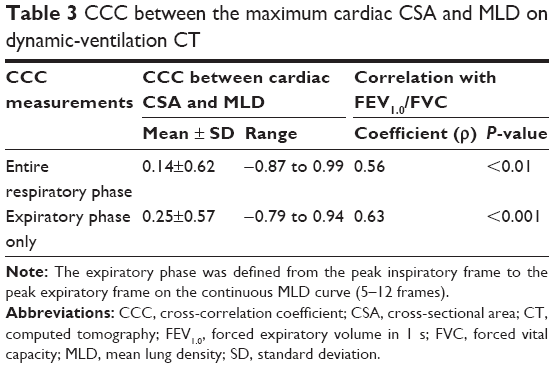 | Table 3 CCC between the maximum cardiac CSA and MLD on dynamic-ventilation CT |
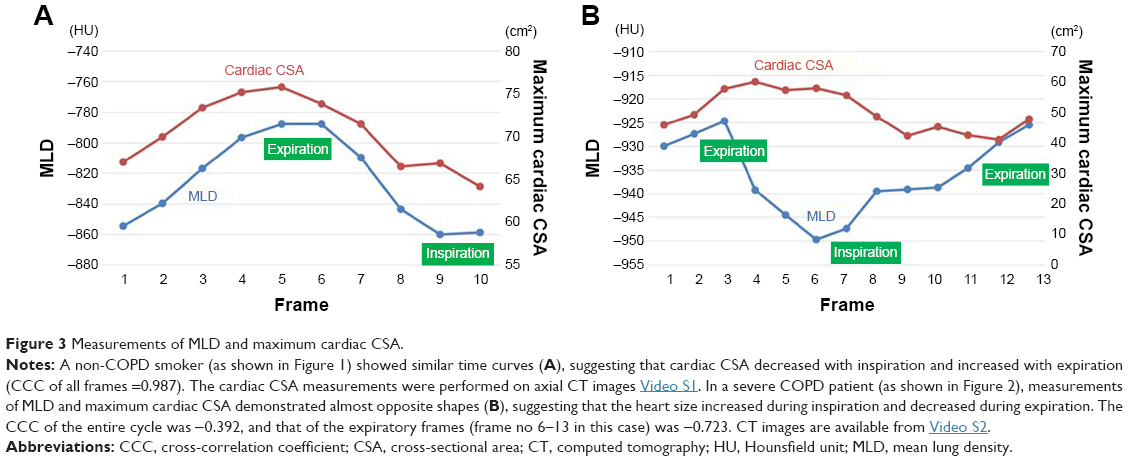 | Figure 3 Measurements of MLD and maximum cardiac CSA. |
CT-based CTR measurements
Although inspiratory CTR was not significantly different between COPD patients and non-COPD smokers, expiratory CTR and ΔCTR were significantly smaller in COPD patients than in non-COPD smokers (Table 4). Both expiratory CTR and ΔCTR demonstrated significant correlations with FEV1.0/FVC (ρ=0.58–0.59, P<0.001; Table 4).
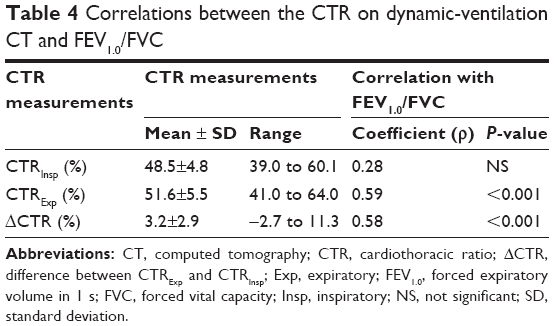 | Table 4 Correlations between the CTR on dynamic-ventilation CT and FEV1.0/FVC |
Discussion
In this study, we found that 1) the maximum cardiac CSA was significantly smaller in patients with COPD than in non-COPD smokers on the peak inspiratory/expiratory frames on dynamic-ventilation CT, 2) the expiratory/inspiratory ratio of the CSA correlated with airflow limitation, 3) the maximum cardiac CSA often decreased during expiration in COPD patients, in contrast to normal physiological movements, and 4) this contrasting pattern of respiratory changes in heart size and respiratory movements of the lung correlated with airflow limitation. The observations described earlier can be briefly summarized as follows: in COPD patients, the heart size is smaller throughout the ventilation cycle, the change in the heart size between the peak inspiratory and peak expiratory phases is smaller in non-COPD subjects, and abnormal cardiac compression (reduction in heart size) during expiration is frequently observed in COPD patients and does not occur in non-COPD subjects. These data suggest that, in COPD patients, respiratory lung movements have an abnormal influence on cardiac motion and may be related to impaired cardiac function in patients with COPD. When observing the dynamic-ventilation CT of severe COPD patients in this study, we frequently noticed that severe emphysematous lower lung regions, which would have extensive air trapping, did not decrease in volume and directly compressed the heart during expiration (Figure 2 and Video S2), which was in contrast to non-COPD subjects. Although this study did not assess cardiac output, these findings may improve our understanding of depressed cardiac function in patients with COPD and help create a comprehensive cardiopulmonary model of COPD.
Although no previous publications have used dynamic-ventilation CT to observe heart size, “small heart in severe emphysema or COPD” has been observed in previous studies using different imaging modalities, including echocardiography, radiography, and magnetic resonance imaging (MRI).9–11,15,32,33 The smaller heart size in patients with COPD is associated with lung hyperinflation. In patients with COPD, lung hyperinflation is caused by a decrease in the elastic recoil of the lung parenchyma and dynamic air trapping during successive breaths. Lung hyperinflation leads to greater end-expiratory lung volume and increased intrathoracic pressure.14–16,34 Increased intrathoracic pressure decreases venous return to the heart, which decreases cardiac preload, and impairs the compliance of the intrathoracic vascular bed.9–11,16,17 Furthermore, external compression from hyperinflated lungs increases end-diastolic pressure.10,15,35 Consequently, cardiac size and function is compromised in patients with COPD and/or severe emphysema.
Previous studies of heart size in COPD patients have been based on static images during a single respiratory phase, or on cardiac imaging without assessment of the respiratory cycle. Little attention has been paid to dynamic cardiac changes during the respiratory cycle, or the influence of ventilation phase on heart size, in patients with COPD. In the current study, we used dynamic-ventilation CT to demonstrate that smokers without obvious airflow limitation have an incremental change in heart size during expiration, consistent with previous reports of non-COPD patients.20 In subjects without airflow limitation, a rapid reduction in intrathoracic pressure during inspiration leads to an increase in venous return and an increase in right-sided cardiac volume. Meanwhile, reduced pulmonary venous return due to blood pooling in the lung parenchyma causes a reduction in left-sided cardiac volume.36 In contrast, in subjects with significant airflow limitation, intrathoracic pressure rapidly increases during expiration, leading to increased left-sided cardiac volume and decreased right-sided cardiac volume. In addition, ventricular interdependence may cause changes in cardiac volume.37,38 The complex geometric changes of the cardiac chambers make it difficult to speculate about the exact change in cardiac volume during ventilation. However, changes in heart size may also be explained by chest wall movement: during inspiration, the ribcage expands and the diaphragm moves downward, which stretches the pericardium in the craniocaudal direction, leading to a “thinner” heart shape on radiography and reconstructed coronal CT images.20 Lung inflation during inspiration might also restrict the transverse movement of the heart. In contrast, during expiration, the diaphragm moves upward, slightly compressing the heart in the craniocaudal direction, resulting in a “pear-shaped” heart with a larger cardiac CSA than during inspiration.20 Hence, in subjects without airflow limitation (ie, without lung hyperinflation), the cardiac CSA decreases during inspiration and increases during expiration.
While this physiological phenomenon was observed in non-COPD smokers in the current study, the situation appeared to be very different in patients with COPD. In these patients, the maximum cardiac CSA frequently decreased during expiration and the heart size was smaller during expiration than during inspiration. Although it is difficult to speculate about the pathophysiological mechanisms that underlie this observation, several factors may lead to paradoxical cardiac movement during expiration in patients with COPD. One factor is increased intrathoracic pressure, particularly during expiration.21,39 Changes in intrathoracic pressure influence juxtacardiac pressure,18 which may, in turn, change cardiac morphology. Intrathoracic pressure is greatly elevated during expiration in COPD patients21 and may impair cardiac filling by reducing venous return to the thorax and by physically compressing the heart and pulmonary vessels.10,19 A second factor is decreased compliance of the pulmonary parenchyma and increased pulmonary vascular resistance due to hyperinflation.22,23 Decreased compliance of pulmonary tissue decreases lung distortion during ventilation, and increased vascular resistance reduces pulmonary venous return during expiration, resulting in decreased heart expansion during expiration. A third factor is the combination of hyperinflated lungs and a flattened diaphragm. Although COPD patients exhale by increasing their intrathoracic pressure, the hyperinflated lungs do not rapidly change size. The combination of elevated intrathoracic pressure and hyperinflated lungs may result in direct compression of the heart. Furthermore, the dysfunctional, flattened diaphragm in patients with severe COPD does not move upward/downward during ventilation, which may prevent the “physiological” increase in heart size that is normally caused by diaphragm elevation during expiration. Finally, exaggerated ribcage motion during expiration may affect heart size. Overall, these factors may explain the reduction in cardiac CSA during expiration that we observed in patients with severe COPD.
This study has several limitations. First, pulmonary function was only assessed using spirometric values, and other functional parameters, such as plethysmography and diffusion capacity, were not included. Second, cardiopulmonary exercise data were not evaluated in this study. Third, we did not evaluate cardiac function. Fourth, esophageal pressure, which is often used as an index of intrathoracic pressure, was not measured. Fifth, the study population was small. Sixth, the dynamic-ventilation CT could not scan the entire thorax. Although MLD is a reliable method for estimating lung volume, true respiratory changes in lung volume could not be measured. Sixth, cardiac performance might be influenced by body position,6 and our measurements were obtained in the supine position only. Finally, the influence of heat rate on cardiac CSA was not assessed. In some patients, the maximum cardiac CSA time curve was uneven due to heartbeat. Our future studies will address each of these issues.
Conclusions
We used dynamic-ventilation CT to determine that heart size is significantly smaller in patients with COPD than in non-COPD smokers. Heart size decreased during expiration in most patients with COPD, which is in contrast to the non-COPD population. Dynamic-ventilation CT that exclusively observes respiratory motions of the lung and heart may provide further knowledge regarding cardiovascular dysfunction in COPD.
Acknowledgments
The authors greatly thank Mr Shun Muramatsu (Ohara Medical Center) for his great help in scanning patients. The authors also thank Mr Shinsuke Tsukagoshi and Mr Tatsuya Kimoto (Toshiba Medical Systems) for their technical support. The advice from Dr Sunghee Shin (Division of Cardiology, Inha University College of Medicine, Republic of Korea) is greatly appreciated. The ACTIve Study Group currently consists of the following institutions: Ohara General Hospital, Fukushima, Japan (Kotaro Sakuma, MD; Hiroshi Moriya, MD, PhD); Saitama International Medical Center, Saitama Medical University, Hidaka, Japan (Fumikazu Sakai, MD, PhD); Kanagawa Cardiovascular and Respiratory Center, Yokohama, Japan (Tae Iwasawa, MD, PhD); Shiga University of Medical Science, Otsu, Japan (Yukihiro Nagatani, MD; Norihisa Nitta, MD; Kiyoshi Murata, MD); Osaka University, Suita, Japan (Masahiro Yanagawa, MD, PhD; Osamu Honda, MD, PhD; Noriyuki Tomiyama, MD, PhD); Osaka Medical College, Takatsuki, Japan (Mitsuhiro Koyama, MD, PhD); Tenri Hospital, Tenri, Japan (Yuko Nishimoto, MD; Satoshi Noma, MD, PhD); Kobe University, Kobe, Japan (Yoshiharu Ohno, MD, PhD); University of the Ryukyus, Nishihara, Japan (Tsuneo Yamashiro, MD; Maho Tsubakimoto, MD; Nanae Tsuchiya, MD, PhD; Yanyan Xu, MD; Sadayuki Murayama, MD, PhD). University of the Ryukyus, Ohara General Hospital, and Shiga University of Medical Science receive a research grant from Toshiba Medical Systems.
Disclosure
Yanyan Xu receives a scholarship (Sasagawa scholarship) from the Japan China Medical Association. Tsuneo Yamashiro receives a research grant from the Japan Society for the Promotion of Science (Kakenhi-16K19837). The other authors report no conflicts of interest in this work.
References
Mannino DM. The natural history of chronic obstructive pulmonary disease. Pneumonol Alergol Pol. 2011;79(2):139–143. | ||
Sin DD, Man SF. Chronic obstructive pulmonary disease as a risk factor for cardiovascular morbidity and mortality. Proc Am Thorac Soc. 2005;2(1):8–11. | ||
Roversi S, Fabbri LM, Sin DD, Hawkins NM, Agustí A. Chronic obstructive pulmonary disease and cardiac diseases. An urgent need for integrated care. Am J Respir Crit Care Med. 2016;194(11):1319–1336. | ||
Falk JA, Kadiev S, Criner GJ, Scharf SM, Minai OA, Diaz P. Cardiac disease in chronic obstructive pulmonary disease. Proc Am Thorac Soc. 2008;5(4):543–548. | ||
Vestbo J, Hurd SS, Agusti AG, et al. Global strategy for the diagnosis, management, and prevention of chronic obstructive pulmonary disease: GOLD executive summary. Am J Respir Crit Care Med. 2013;187(4):347–365. | ||
Robotham JL. Cardiovascular disturbances in chronic respiratory insufficiency. Am J Cardiol. 1981;47(4):941–949. | ||
Cournand A, Motley HL, Werko L, Richards DW. Physiological studies of the effects of intermittent positive pressure breathing on cardiac output in man. Am J Physiol. 1948;152(1):162–174. | ||
Cournand A, Motley HL, Werko L. Mechanism underlying cardiac output change during intermittent positive pressure breathing (IPP). Fed Proc. 1947;6(1 pt 2):92. | ||
Hutsebaut J, Scano G, Garcia-Herreros P, Degré S, De Coster A, Sergysels R. Hemodynamic characteristics in chronic obstructive lung disease as related to cardiac size. Respiration. 1981;41(1):25–32. | ||
Jörgensen K, Müller MF, Nel J, Upton RN, Houltz E, Ricksten SE. Reduced intrathoracic blood volume and left and right ventricular dimensions in patients with severe emphysema: an MRI study. Chest. 2007;131(4):1050–1057. | ||
Yamada T, Takeda J, Satoh M, Koyama K, Hashiguchi S, Yokoi M. Effect of positive end-expiratory pressure on left and right ventricular diastolic filling assessed by transoesophageal Doppler echocardiography. Anaesth Intensive Care. 1999;27(4):341–345. | ||
Izumi S, Moriyama K, Kobayashi S, et al. Phasic venous return abnormality in chronic pulmonary diseases: pulsed Doppler echocardiography study. Intern Med. 1994;33(6):326–333. | ||
Whittenberger JL, McGregor M, Berglund E, Borst HG. Influence of state of inflation of the lung on pulmonary vascular resistance. J Appl Physiol. 1960;15:878–882. | ||
Barr RG, Bluemke DA, Ahmed FS, et al. Percent emphysema, airflow obstruction, and impaired left ventricular filling. N Engl J Med. 2010;362(3):217–227. | ||
Watz H, Waschki B, Meyer T, et al. Decreasing cardiac chamber sizes and associated heart dysfunction in COPD: role of hyperinflation. Chest. 2010;138(1):32–38. | ||
Tschernko EM, Gruber EM, Jaksch P, et al. Ventilatory mechanics and gas exchange during exercise before and after lung volume reduction surgery. Am J Respir Crit Care Med. 1998;158(5 pt 1):1424–1431. | ||
Jörgensen K, Houltz E, Westfelt U, Nilsson F, Scherstén H, Ricksten SE. Effects of lung volume reduction surgery on left ventricular diastolic filling and dimensions in patients with severe emphysema. Chest. 2003;124(5):1863–1870. | ||
Takata M, Mitzner W, Robotham JL. Influence of the pericardium on ventricular loading during respiration. J Appl Physiol. 1990;68(4):1640–1650. | ||
Collins J. Diseases of the airways. In: Juhl JH, Crummy AB, Kuhlman JE, editors. Paul and Juhl’s Essentials of Radiologic Imaging. 7th ed. Philadelphia: Lippincott-Raven Publishers; 1998:937–954. | ||
Tomita H, Yamashiro T, Matsuoka S, Matsushita S, Kurihara Y, Nakajima Y. Changes in cross-sectional area and transverse diameter of the heart on inspiratory and expiratory chest CT: correlation with changes in lung size and influence on cardiothoracic ratio measurement. PLoS One. 2015;10(7):e0131902. | ||
Nigro CA, Prieto JE, Kleinert MM, Rhodius EE. Effect of inhaled salbutamol on dynamic intrinsic positive end-expiratory pressure in spontaneously breathing patients with stable severe chronic obstructive pulmonary disease. Med Sci Monit. 2005;11(11):181–185. | ||
Wrobel JP, Thompson BR, Williams TJ. Mechanisms of pulmonary hypertension in chronic obstructive pulmonary disease: a pathophysiologic review. J Heart Lung Transplant. 2012;31(6):557–564. | ||
Harris P, Segel N, Green I, Housley E. The influence of the airways resistance and alveolar pressure on the pulmonary vascular resistance in chronic bronchitis. Cardiovasc Res. 1968;2(1):84–92. | ||
Sciurba FC, Rogers RM, Keenan RJ, et al. Improvement in pulmonary function and elastic recoil after lung-reduction surgery for diffuse emphysema. N Engl J Med. 1996;334(17):1095–1099. | ||
Similowski T, Yan S, Gauthier AP, Macklem PT, Bellemare F. Contractile properties of the human diaphragm during chronic hyperinflation. N Engl J Med. 1991;325(13):917–923. | ||
Yamashiro T, Tsubakimoto M, Nagatani Y, et al. Automated continuous quantitative measurement of proximal airways on dynamic ventilation CT: initial experience using an ex vivo porcine lung phantom. Int J Chron Obstruct Pulmon Dis. 2015;10(1):2045–2054. | ||
Yamashiro T, Moriya H, Tsubakimoto M, Matsuoka S, Murayama S. Continuous quantitative measurement of the proximal airway dimensions and lung density on four-dimensional dynamic-ventilation CT in smokers. Int J Chron Obstruct Pulmon Dis. 2016;11(1):755–764. | ||
Yamashiro T, Matsuoka S, Bartholmai BJ, et al. Collapsibility of lung volume by paired inspiratory and expiratory CT scans: correlations with lung function and mean lung density. Acad Radiol. 2010;17(4):489–495. | ||
Kundu S, Gu S, Leader JK, et al. Assessment of lung volume collapsibility in chronic obstructive lung disease patients using CT. Eur Radiol. 2013;23(6):1564–1572. | ||
Gollub MJ, Panu N, Delaney H, et al. Shall we report cardiomegaly at routine computed tomography of the chest? J Comput Assist Tomogr. 2012;36(1):67–71. | ||
Du Bois D, Du Bois EF. A formula to estimate the approximate surface area if height and weight be known 1916. Nutrition. 1989;5(5):303–311. | ||
Hellebrandová L, Chlumský J, Vostatek P, Novák D, Rýznarová Z, Bunc V. Airflow limitation is accompanied by diaphragm dysfunction. Physiol Res. 2016;65(3):469–479. | ||
Wigh RE. On defining microcardia: application in pulmonary emphysema. South Med J. 1978;71(2):150–154. | ||
De Troyer A. Effect of hyperinflation on the diaphragm. Eur Respir J. 1997;10(3):708–713. | ||
Camiciottoli G, Diciotti S, Bigazzi F, et al. Is intrathoracic tracheal collapsibility correlated to clinical phenotypes and sex in patients with COPD? Int J Chron Obstruct Pulmon Dis. 2015;10(1):843–852. | ||
Guyton AC. Textbook of Medical Physiology. 5th ed. Philadelphia: WB Saunders; 1976. | ||
Taylor RR, Covell JW, Sonnenblick EH, Ross J. Dependence of ventricular distensibility on filling of the opposite ventricle. Am J Physiol. 1967;213(3):711–718. | ||
Janicki JS, Weber KT. The pericardium and ventricular interaction, distensibility, and function. Am J Physiol. 1980;238(4):H494–H503. | ||
Yamauchi Y, Kohyama T, Jo T, Nagase T. Dynamic change in respiratory resistance during inspiratory and expiratory phases of tidal breathing in patients with chronic obstructive pulmonary disease. Int J Chron Obstruct Pulmon Dis. 2012;7(1):259–269. |
 © 2017 The Author(s). This work is published and licensed by Dove Medical Press Limited. The full terms of this license are available at https://www.dovepress.com/terms.php and incorporate the Creative Commons Attribution - Non Commercial (unported, v3.0) License.
By accessing the work you hereby accept the Terms. Non-commercial uses of the work are permitted without any further permission from Dove Medical Press Limited, provided the work is properly attributed. For permission for commercial use of this work, please see paragraphs 4.2 and 5 of our Terms.
© 2017 The Author(s). This work is published and licensed by Dove Medical Press Limited. The full terms of this license are available at https://www.dovepress.com/terms.php and incorporate the Creative Commons Attribution - Non Commercial (unported, v3.0) License.
By accessing the work you hereby accept the Terms. Non-commercial uses of the work are permitted without any further permission from Dove Medical Press Limited, provided the work is properly attributed. For permission for commercial use of this work, please see paragraphs 4.2 and 5 of our Terms.