")
Back to Journals » OncoTargets and Therapy » Volume 13
Hsa-MiR-590-3p Promotes the Malignancy Progression of Pancreatic Ductal Carcinoma by Inhibiting the Expression of p27 and PPP2R2A via G1/S Cell Cycle Pathway
Authors Shi X, Sheng W, Jia C, Tang J, Dong M
Received 12 May 2020
Accepted for publication 3 September 2020
Published 29 October 2020 Volume 2020:13 Pages 11045—11058
DOI https://doi.org/10.2147/OTT.S260499
Checked for plagiarism Yes
Review by Single anonymous peer review
Peer reviewer comments 2
Editor who approved publication: Dr Federico Perche
Xiaoyang Shi, Weiwei Sheng, Chao Jia, Jingtong Tang, Ming Dong
Department of General Surgery, Gastrointestinal Surgery, The First Hospital, China Medical University, Shenyang 110001, People’s Republic of China
Correspondence: Ming Dong Email [email protected]
Objective: To investigate the effect of miR-590-3p on the malignant biological behavior of pancreatic cancer, and to explore the target genes and pathways directly affected by miR-590-3p, to provide new therapeutic ideas and targets for the study of the diagnosis and treatment of pancreatic cancer.
Methods: We used qRT-PCR to measure miR-590-3p expression quantities. We used cell cycle, CCK-8, clonal formation to verify the change of proliferation capacity of PC cells. We used transwell assay to detect the migration and invasion of PC cells. We used the bioinformatics tool TargetScan (http://www.targetscan.org) to identify the possible target genes of miR-590-3p. Immunohistochemistry revealed the clinicopathological significance of PPP2R2A, p27 and miR-590-3p in the expression of pancreatic cancer. Western blot was used to detect the expression changes of PPP2R2A, p27 and G1/S cell cycle pathway-related proteins CDK2, cyclinE2 and p21 after transfection of mimics and inhibitors of miR-590-3p.
Results: According to our study, hsa-miR-590-3p expression was significantly higher in PC tissues than that in paired normal pancreas, which was associated with PC tumor size (P=0.042) and preoperative CA19-9 level (P=0.046) of PC patients. Its overexpression promoted PC cell proliferation, invasion and migration following with the p27 and PPP2R2A protein downregulation in Capan-2, PANC-1 and BxPC-3 cells, and vice versa. Bioinformatics analysis and dual-luciferase reporter assay further confirmed that p27 and PPP2R2A were direct target genes of miR-590-3p. The negative relationship of miR-590-3p with p27 and PPP2R2A was also observed in PC tissues.
Conclusion: MiR-590-3p promotes the proliferation, migration and invasion of pancreatic cancer cells. MiR-590-3p directly downregulated p27 and PPP2R2A and via the G1/S cell cycle pathway to promote the development of pancreatic cancer.
Keywords: MiR-590-3p, pancreatic ductal carcinoma, PPP2R2A, G1/S cell cycle pathway, p27
Introduction
Pancreatic carcinoma (PC) is a member of the most aggressive malignant tumors and contributes to cancer-related death as the seventh most common cause.1 It is crucial to identify a new potential biomarker as a prognostic factor and therapeutic target of PC.
MiRNAs as a group of short (~22 nucleotides), endogenous and noncoding RNAs can regulate target gene expression by directly binding to the 3ʹ-UTR of specific mRNA.2 miRNAs are becoming important biomarkers in different kinds of diseases, not only in malignant tumor cells, but also in cardiosphere-derived stem cells,3 human mesenchymal stem cell,4 etc. Several microRNAs have been reported to contribute to the tumorigenesis, development and prognosis of PC which might provide therapeutic target for this mortal disease.5
Hsa-miR-590-3p is one of the mature members of the human microRNA-590 family. It has been reported that miR-590-3p is related to the development of several kinds of cancer, including colorectal cancer (CRC),6 Lynch syndrome (a common hereditary form of CRC),7 glioblastoma8 and nephroblastoma.9 However, the effect of miR-590-3p in PC cells has not been reported to our knowledge. In the current study, we first discovered that miR-590-3p directly regulated p27 and PPP2R2A in PC cells.
P27 (CDKN1B) belongs to the CIP/KIP family of CDK inhibitors (CDKIs) with p21 and p57, can induce the G1 cell phase arrest by inhibiting cyclin/CDK complexes in a number of cell lines.10 Posttranscriptional loss of p27 related to poor prognosis in several solid tumors. Reduced expression or loss of p27 protein contributes to the genesis or progression of PC.11–13
Protein phosphatase 2A (PP2A) is an important member of the major Ser/Thr phosphatases and belongs to the PPP family involving control of cell growth and division.14,15 PPP2R2A, also known as PR55α or B55α, has a widespread tissue distribution.14 It has been reported to be a tumor suppressor in several kinds of malignant tumors, such as AML, HCC, colorectal cancer, pancreatic cancer.
The potential function and corresponding molecular mechanism of miR-590-3p in development of PC has been systematically investigated in current study.
Materials and Methods
Human Tissue Specimens
Sixty paired fresh PC and normal pancreas tissues were obtained from PC patients in the Department of Gastrointestinal Surgery of the First Hospital of China Medical University from 2006 to 2017 and 42 pairs of fresh tissues of them were stored at −80°C condition until used. Pathological diagnosis of PC is the necessary condition for all patients to be chosen. This study was approved by the institutional review board of the China Medical University and a consent form was signed by each participating patient. The staging standard was referred to the AJCC Cancer Staging Manual (8th Edition).
Immunohistochemistry (IHC)
All surgical samples were fixed in neutral formaldehyde and embedded in paraffin to make slices 4 µm thick. S-P immunohistochemistry was used for dyeing. Primary antibody was incubated overnight at 4°C with rabbit polyclonal p27 Kip1antibody (Cat. No. 25614-1-AP, 1:200, Proteintech, China) and rabbit anti-PPP2R2A antibody (ab18136, 1:100, Abcam, UK). Biotin-labeled secondary antibodies (ultrasensitive; incubation at indoor temperature for 25 min, MaiXin, gentle, China) and display the colors in DAB. Five fields were randomly selected for each slice. The expression of p27 and PPP2R2A was divided into fir grades according to the percentage of dyeing area: 0 points (no staining), 1 point (1%~25%), 2 points (26%~50%), 3 points (51%~75%), and 4 points (76% +).The expression of p27 and PPP2R2A was further divided into four grades according to the intensity of staining: 0 (no staining), 1 (pale yellow granules), 2 (dark yellow granules) and 3 (yellow-brown granules). The product of the extent and intensity score was used as the final staining scores (0–12).
Cell Lines and Culture
Human pancreatic cancer (PC) cells Capan-2, BxPC-3, AsPC-1, SW1990, MIA PaCa-2 and PANC-1 and the HEK293T cell were purchased from the Cell Bank of the Chinese Academy of Sciences (Shanghai, China). All cells were cultured in DMEM or RPMI-1640 within 10% FBS (Hyclone, Logan, UT, USA), and 1% penicillin streptomycin combination under the condition of 5% CO2 at 37°C in an incubator.
Total RNA Isolation and qRT-PCR
We use TRIzol reagent (Takara Bio, Otsu, Japan) to extract total RNA from tissue samples and harvested PC cells, following the instruction of manufacturer. RNA levels was kept to be equal quantities in all samples via nucleotide test before qRT-PCR detection. MirVana miRNA Isolation Kit (Ambion, Austin, TX, USA) was used to purify microRNAs. For reverse transcriptase polymerase chain reactions (RT-PCR), we used the stem-loop primer and the PrimeScript RT Reagent Kit (Promega, Madison, WI, USA) to synthesize cDNA. MiRNA primers for qPCR were purchased from GenePharma (Soochow, China). We used the Custom gene qRT-PCR Quantitation Kit (GenePharma) to measure mature miR-590-3p expression under the following thermos cycling conditions: 95°C for three minutes, 45 cycles of 95°C for 12 seconds and 62°C for 50 seconds; and dissociation-curve analysis was added at the end. The relative miR-590-3p expression levels were standardized to U6 snRNA expression, and we use the 2−ΔΔct method to calculate the fold changes in expression. We defined positive value of ΔΔct as relative miR-590-3p high-expression and negative value of ΔΔct as relative miR-590-3p low-expression (PC tissues compared with paired normal pancreas tissues).
Primers were as followings:
miR-590-3p forward, 5ʹ-AAAGATTCCAAGAAGCTAAGGGTG-3ʹand reverse, 5ʹ-CCTAACTGGTTTCCTGTGCCTA-3ʹ; U6 forward, 5ʹ-CTCGCTTCGGCAGCACA-3ʹ and reverse, 5ʹ-AACGCTTCACGAATTTGCGT)-3ʹ.
miRNA Transfection
miR-590-3p mimics, NC (negative control), inhibitors and inhibitor NC (inhibitors negative control) were produced by GenePharma (Soochow, China). For transient expression studies, PC cells were transfected with miR-590-3p mimics, NC, inhibitors and inhibitor N.C according to the recommended protocol. Lipofectamine 3000 reagent (Invitrogen, Carlsbad, CA, USA) was the transfection medium during the transfection process.
Cell Cycle
PC cells on culture plate were washed with PBS twice and collected into centrifuge tubes. One milliliter 70% precooled ethanol were added into centrifuge tubes and kept in tubes at 4°C for 12 h. Then the cells were centrifuged at the condition of 1000 rps for five minutes and washed with PBS and centrifuged again under the same conditions. The centrifugal sediment was treated with Cell Cycle and Apoptosis Analysis Kit (Beyotime, China). Flow cytometry was performed to detect the cells 30 mins after PI staining. We used cell cycle matching software to analyze the primary result to record hypodiploid peak, namely sub-G1 phase, G0/G1 phase, S phase, and G2/M phase. The experiment was repeated three times independently. The software used for cell cycle is FlowJo (version 10.6.2. BD biosciences, NY, USA).
Colony Formation and Proliferation Assay
1×10³cells of different group after transfection (miR-590-3p mimics, NC, inhibitors and inhibitor NC) were seperately seeded into six-well culture plates per well. After 10 days culturing under the condition of 37°C and 5% CO2 in an incubator, the plates were washed with PBS. We washed the cells with PBS twice after fixing them with precooled methanol for 30 min and staining them with 1% crystal violet for 30 min. We used Cell Counting Kit-8 (CCK-8) assay to detect cell proliferation. Briefly, we harvested cells with 0.05% trypsin/EDTA and counted them after transfection (miR-590-3p mimics, NC, inhibitors and inhibitor NC) for 48 h and then seeded them into four 96-well plates at a density of 3000 cells per well and incubated overnight. The cells were added with 10 μL CCK-8 (Bimake; USA) and incubated for three hours at 37°C. The absorbancy value (with OD450 nm) was detected every 24 h for four days by ELISA 96-well microtiter plate reader (BIORAD680; USA) and data are presented as the cell number. Three independent experiments were performed.
Cell Migration and Invasion Assay
In our lab, modified Boyden chamber (BD Biosciences, Sparks, MD, USA) assays are standard assays to assess cell invasion and cell migration. Briefly, miR-590-3p mimics, NC, inhibitors and inhibitor NC were transfected into PC cells for 48 h. Then 5×10⁴cells in 300 μL FBS-free culture medium were counted and seeded on BD chamber membrane (pore size: 8.0 μM) in 24-well plates in 600 μL culture medium plus 10% FBS in the bottom of each well. Twenty-four hours later, we used cotton swab to carefully clean cells inside of the chamber. Cells from the chamber on the bottom were fixed with precooled methanol for 30 min, stained with 1% crystal violet for 30 min, and washed with PBS twice. We used a microscope (Nikon Microphot-FX, Japan) to take pictures of the migratory cells and count them in five random fields at ×20 magnification. The invasion assay was almost the same with migration assay except that we added 50 µl 10% matrigel (BD Biosciences) diluted with FBS-free medium inside the BD chamber on the membrane and incubate the chambers for four hours at 37°C. We counted the actual number of cells per field to present results. Three independent experiments were performed.
Western Blot Assays
RIPA buffer (Beyotime, China) with 1% PMSF was used to extract total protein. Total proteins (30 μg/lane) were divided into peptide chains of different molecular weights by 10% SDS-PAGE electrophoresis (KeyGEN BioTECH, China) and transferred to PVDF membranes (EMD Millipore, Billerica, MA, USA). All the membranes were blocked with 5% nonfat milk for two hours and then incubated with primary antibodies at 4°C overnight, and then the membranes were incubated by a secondary antibody for two hours. BeyoECL Plus reagent (Beyotime, China) was used to detect signals.
Dual-luciferase Reporter Assay
The p27 and PPP2R2A 3ʹ-UTR sequence were cloned into the pmirGLO vector dividedly. We co-transfected 100 ng wild-type or mutant-type firefly luciferase reporter plasmid and 10 ng pRL-TK plasmid as control and miR-590-3p mimics or NC into HEK293T cells reached 50–80% confluence grown in 12-well plates. Dual-luciferase Reporter Assay System (Promega) was used to detect luminescence of cells’ lysate after culturing cells for 48 h. Independent experiments were repeated three times.
Statistical Analysis
Statistical analysis was performed with the SPSS software (version 17.0, SPSS Inc., Chicago, IL, USA). The Pearson coefficient was used to assess correlations between variables. The correlations between miR-590-3p expression and clinic pathologic parameters were analyzed by chi-squared tests. Survival data were plotted with Kaplan–Meier curves and significance was calculated using the log rank test provided by the software. Means ±SD was calculated and two tailed Student’s t-test (two group comparison) or one way ANOVA (multiple groups comparison) was performed using the data analysis tools provided by the software. P<0.05 was considered as statistically significant.
Results
miR-590-3p Relatively High-expressed in Clinical Tumor Samples
qRT-PCR showed that miR-590-3p expression was much higher in PC tissues than paired normal pancreas (P<0.05, Figure 1A). High expression of miR-590-3p was significantly relevant with larger tumor size (P=0.042) and high expression of preoperative CA19-9 level (P=0.046), but not related to age, tumor location, gender, the degree of tumor differentiation, UICC stage, lymph node metastasis or postoperative liver metastasis (Table 1). In addition, there was no statistically significant difference in survival analysis shown in Supplemental Figure S1. These results showed that miR-590-3p overexpression participated in the development of PC, which drives us to continue the further study in vitro.
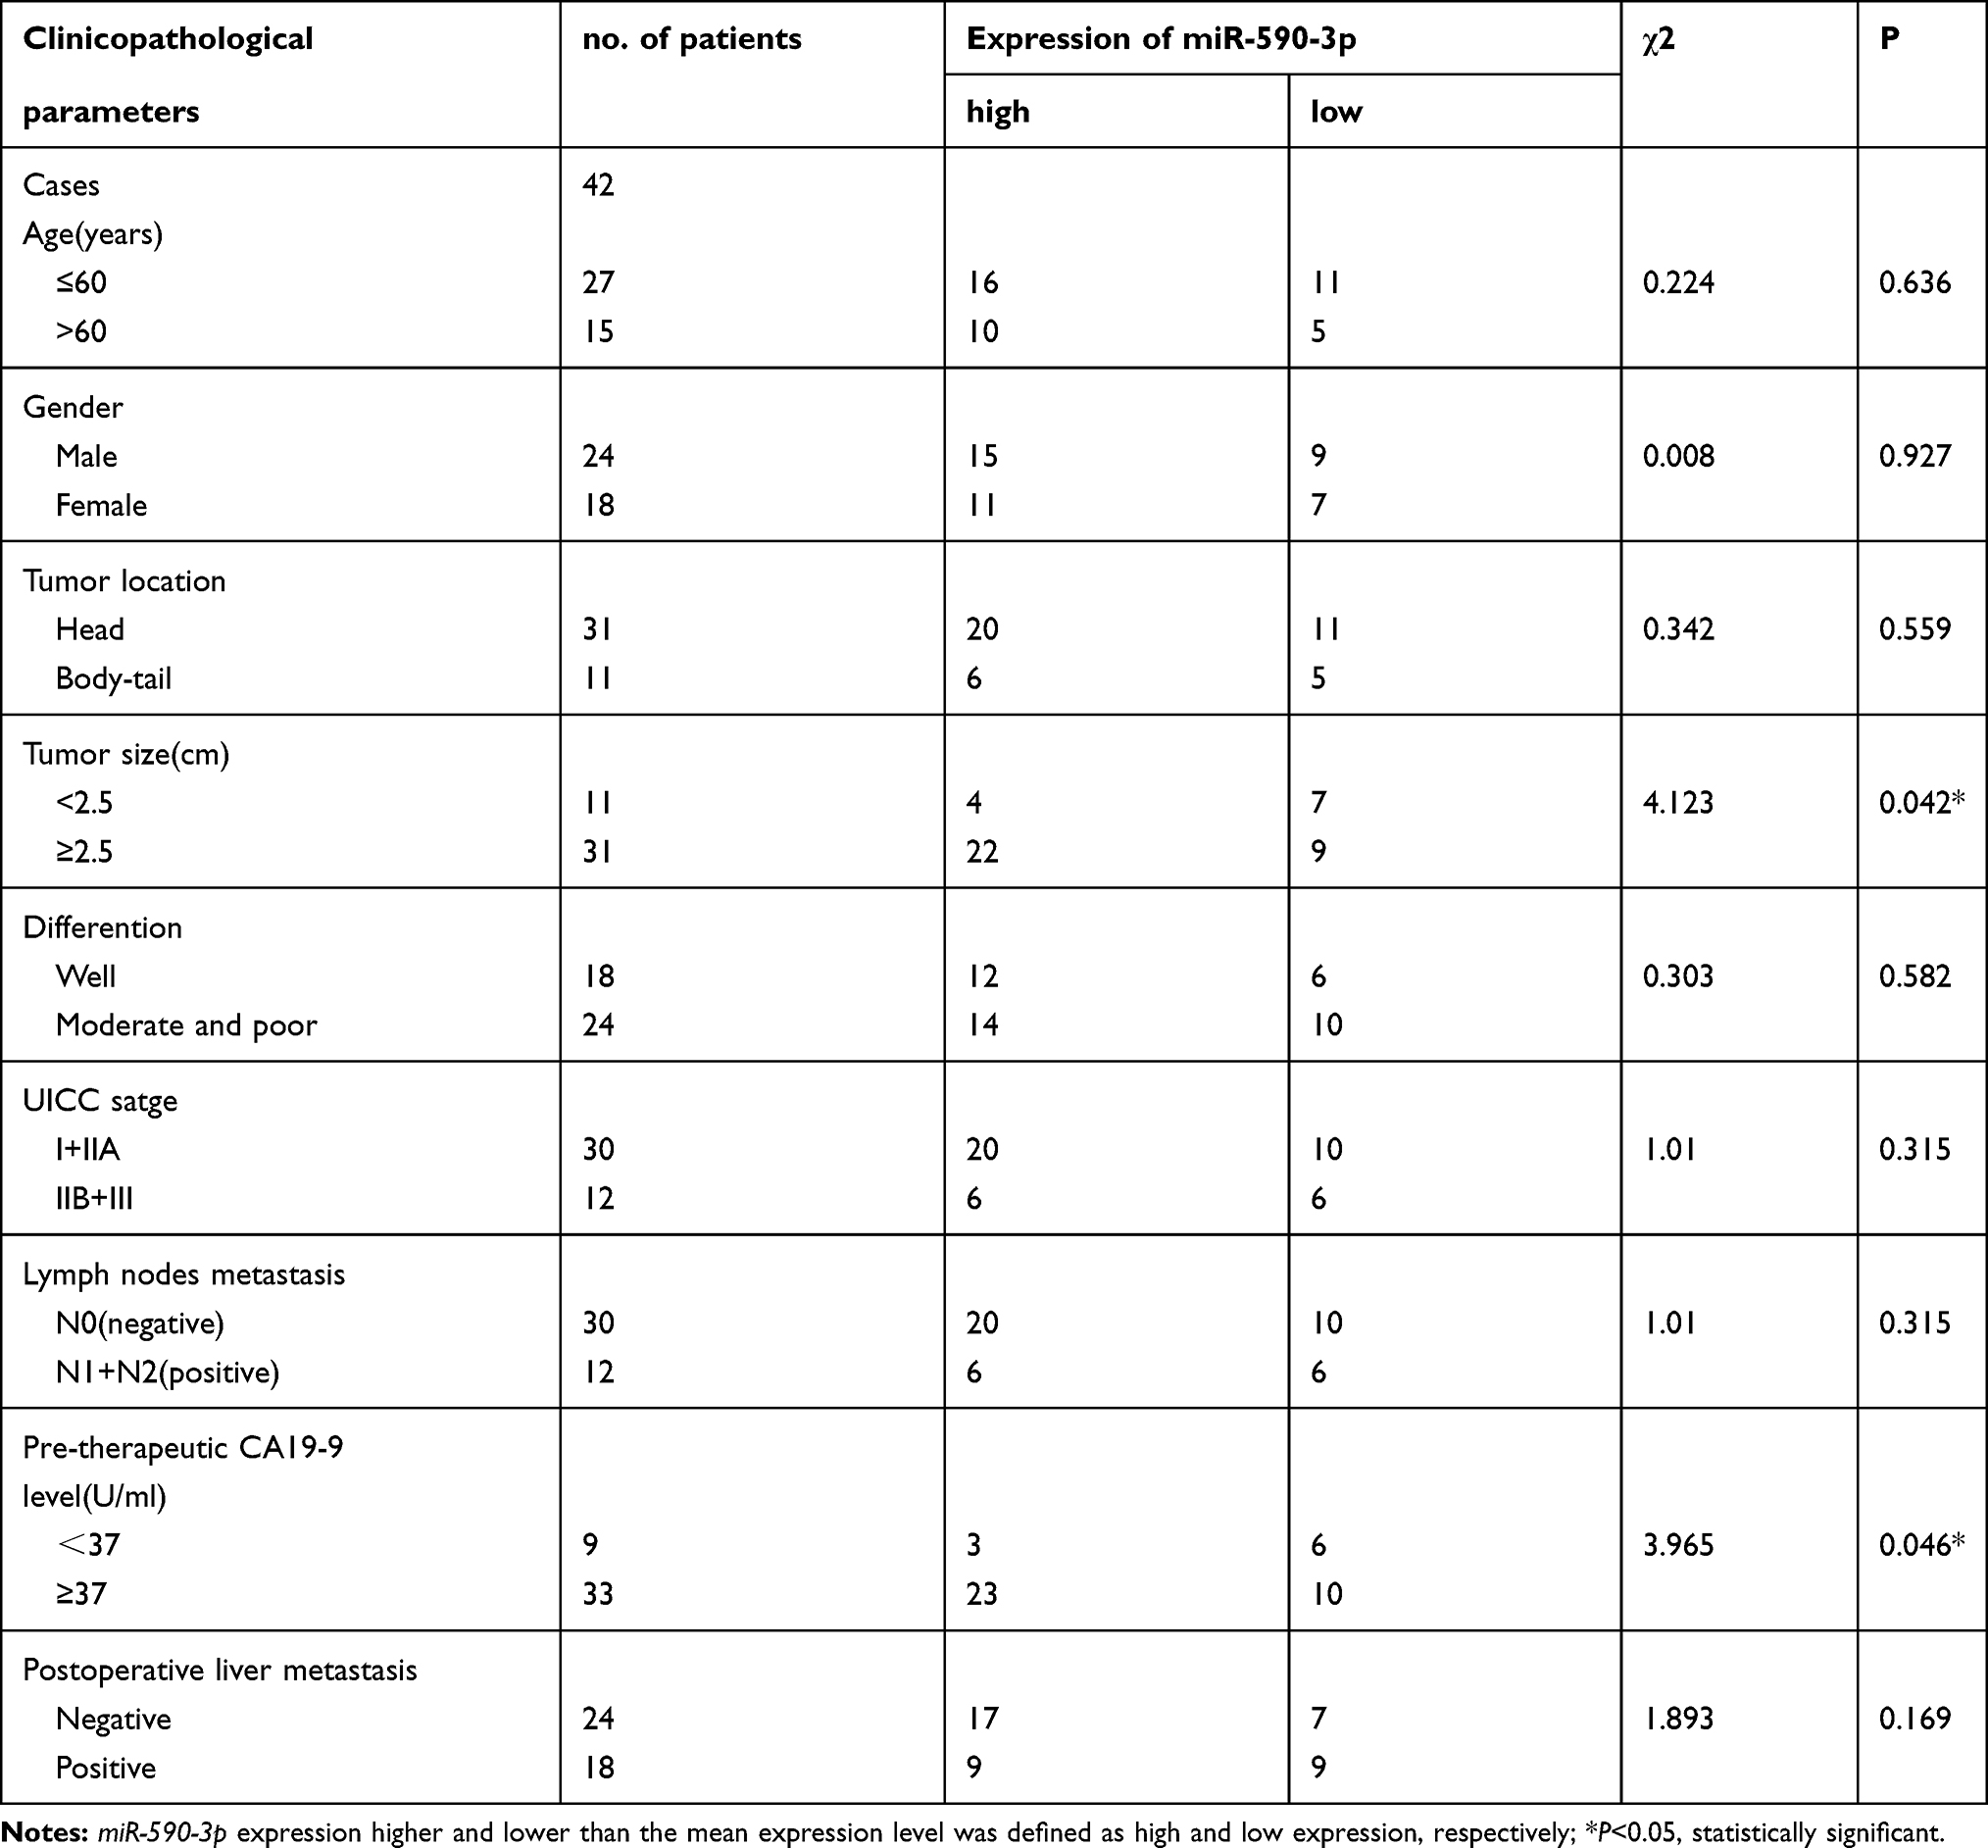 |
Table 1 Clinicopathological Associations of miR-590-3p Expression in Primary PDAC |
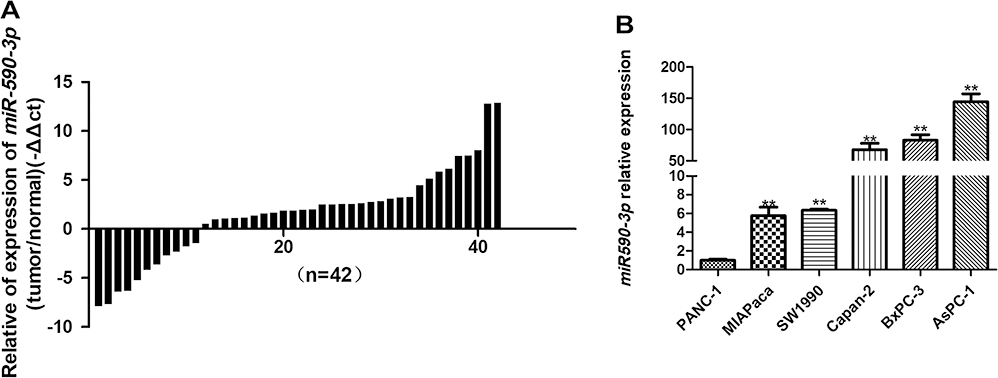 |
Figure 1 miR-590-3p expression in tissue samples and in PC cells. (A) miR-590-3p expression quantities in tissue samples were quantified by qPCR (normalized to U6 snRNA). 2−ΔΔct values represent relative expression level. (B) Expression quantities of miR-590-3p in different PC cells. Bars indicate ±SE, **P<0.01. |
miR-590-3p Enhanced Proliferation of PC Cells in vitro
High miR-590-3p expression (Capan-2 and BxPC-3) cells and low miR-590-3p expression (PANC-1) cells were used to continue our following experiments based on the results in Figure 1B. Although BxPC-3 is the only one cell line that harbored wild-type K-ras, qRT-PCR showed that miR-590-3p expression was not related with K-ras phenotype in six PC cell lines in Figure 1B because of no significant difference of miR-590-3p expression in mutant and wild-type K-ras expressing PC cell lines. The overexpression and silencing efficiency of miR-590-3p mimics and inhibitors in PC cells were confirmed by qRT-PCR (Figure 2A and B). We did the same transfection in AsPC-1 with miR-590-3p mimics and inhibitors following Capan-2 and AsPC-1 cells. However, the transfection efficiency was so poor that we did not see the high and low mRNA expression of miR-590-3p in mimics and inhibitors groups, respectively when compared with other cell lines as Supplemental Figure S2. CCK-8 assay was used to detect cell proliferation in PC cells transfected with miR-590-3p mimics and NC after 48 h. In Figure 2C, cell viability in miR-590-3p inhibitor group was significantly decreased in contrast with NC group in Capan-2 cells. BxPC-3 cells showed the same result in Figure 2E. However, cell viability in miR-590-3p overexpression group was significantly higher than that in NC group in PANC-1 cells. Colony formation experiment further verified the above results. Figure 3A and B showed that cell colonies in miR-590-3p overexpression group was significantly more than NC group in Capan-2 and PANC-1 cells. Conversely, cell colonies in miR-590-3p inhibitor group were significantly less than the NC group in Capan-2 and PANC-1 cells. Flow cytometry was used to further examine the DNA profiles in two cell lines. The cell cycle distribution of miR-590-3p overexpression group significantly differed from the control group with lower G1 phase and higher S+G2 phase (Figure 3E and F), whereas the inhibition group had an opposite result compared with NC group (Figure 3G and H). These findings showed that miR-590-3p promoted PC cell proliferation by changing cell cycle proportions.
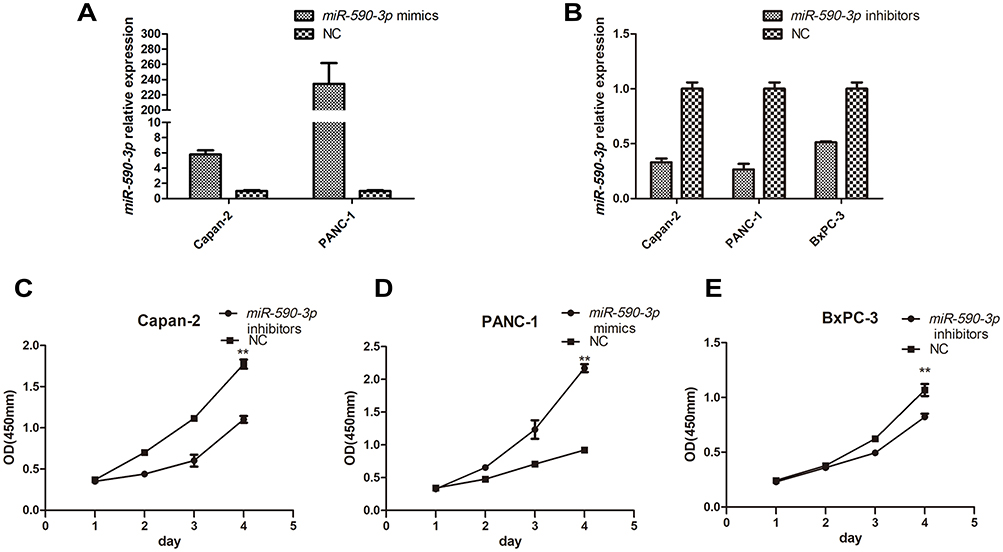 |
Figure 2 miR-590-3p enhanced cancer cell proliferation in vitro via altering cell cycle profiles. (A and B) Transfection efficiency of miR-590-3p mimics and inhibitors in PC cells quantified by qPCR. (C–E) Cell proliferation in PC cells under the condition of miR-590-3p overexpression and downregulation. **P<0.01. |
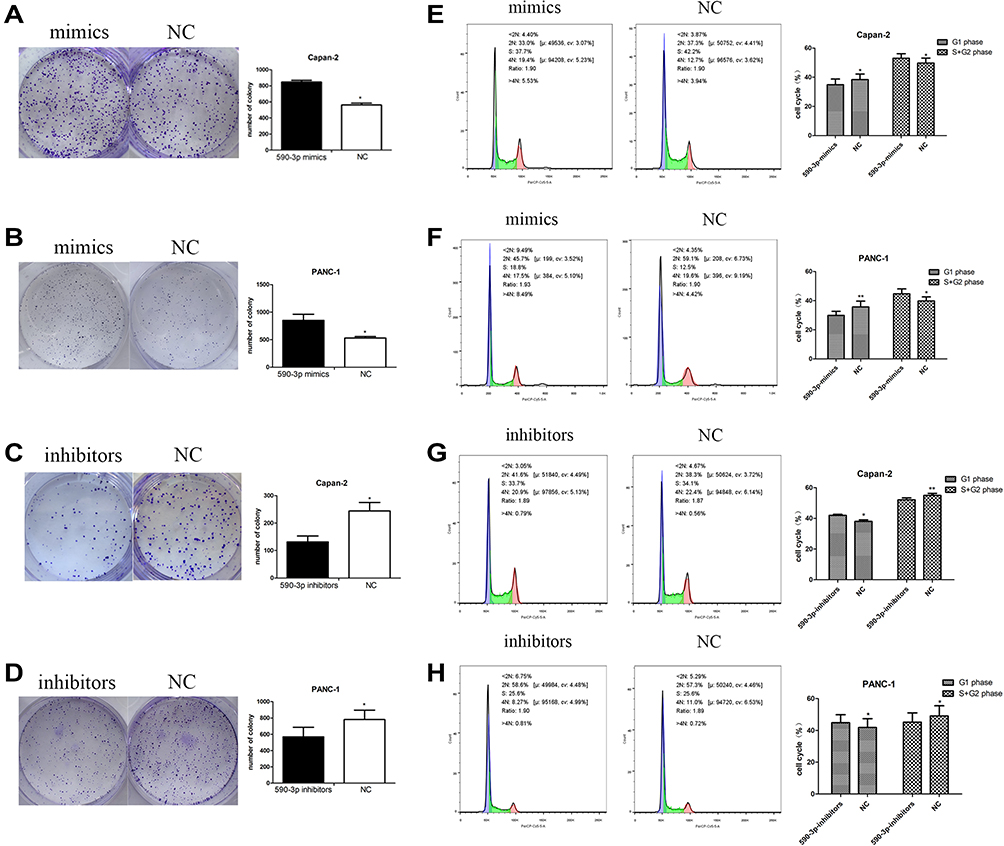 |
Figure 3 (A-D) Colony formation in the two PC cells under the condition of miR-590-3p overexpression and downregulation. (E-H) Cell cycle profiles of two PC cells under the condition of miR-590-3p overexpression and downregulation. *P<0.05, **P<0.01. |
miR-590-3p Enhanced Migration and Invasion Abilities of PC Cells
Transwell assays were performed after miR-590-3p mimics, NC, inhibitors and inhibitor N.C were transfected into PC cells for 48 h. Figure 4A indicated that the cell counting of miR-590-3p mimics group is much higher than NC group in Capan-2 cells in both migration and invasion capacities. Figure 4B showed the same results in PANC-1 cells. However, the cell counting of miR-590-3p inhibitor group is much lower than NC group in Capan-2 cells in both migration and invasion capacities in Figure 4C. The same results was also showed in PANC-1 cells and BxPC-3 cells (Figure 4D and E). All the results above indicated that miR590-3p promoted the PC cell migration and invasion in vitro.
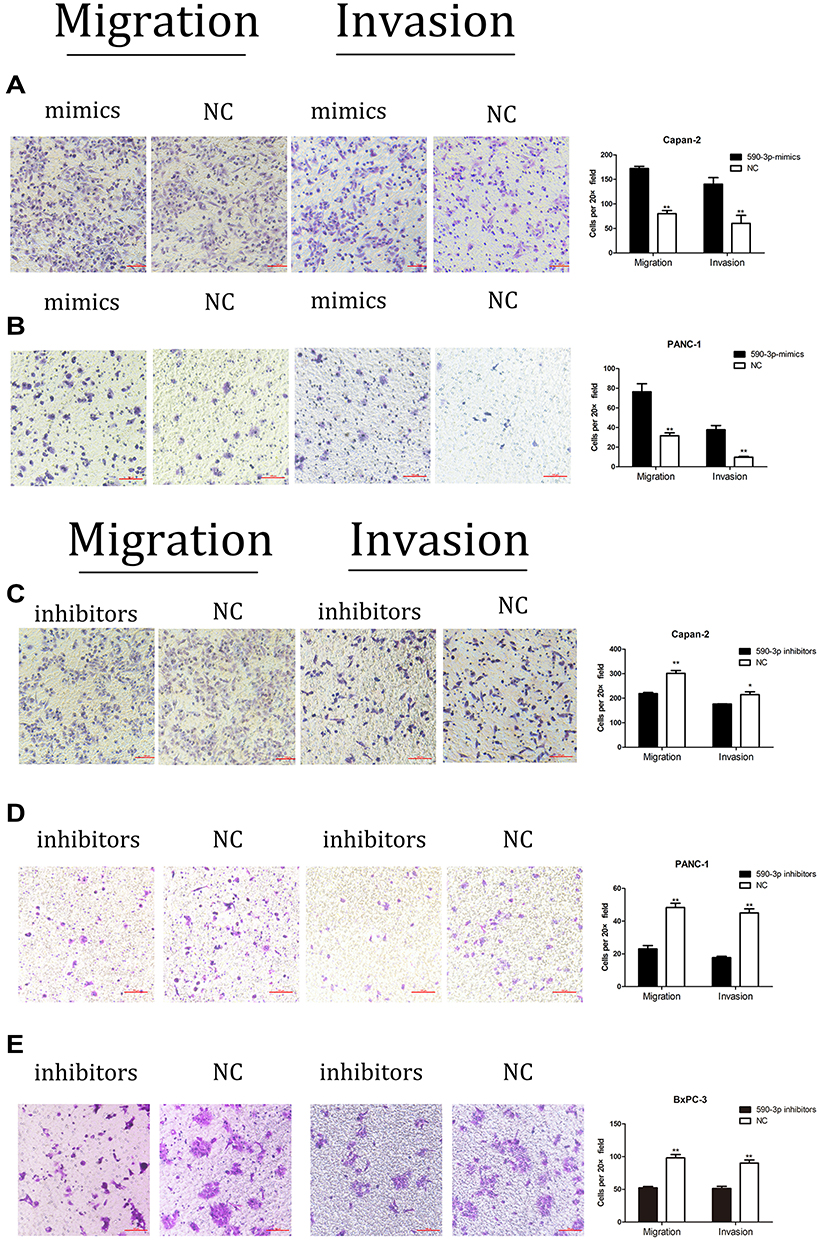 |
Figure 4 miR-590-3p promoted PC cell migration and invasion. (A) Capan-2 cell migration and invasion under the condition of miR-590-3p overexpression. *P<0.05, **P<0.01. (B) PANC-1 cell migration and invasion after transfected with the miR-590-3p mimics or NC. *P<0.05, **P<0.01. (C) Capan-2 cell migration and invasion under the condition of miR-590-3p downregulation. *P<0.05, **P<0.01. (D) PANC-1 cell migration and invasion under the condition of miR-590-3p downregulation. *P<0.05, **P<0.01. (E) BxPC-3 cell migration and invasion under the condition of miR-590-3p downregulation. *P<0.05, **P<0.01. Magnification for parts A-E is 20×. |
miR-590-3p Can Directly Target p27 and PPP2R2A in PC Cells and was Negatively Related to p27 and PPP2R2A in Clinical Tumor Samples
In regard to reveal the corresponding mechanism of hsa-miR-590-3p function in PC cells, we used the bioinformatics tool TargetScan (http://www.targetscan.org) to identify the possible target genes of miR-590-3p. Finally, we found p27 and PPP2R2A mRNA were the possible direct targets of miR-590-3p. WB showed that miR-590-3p overexpression downregulated p27, PPP2R2A, p21 and ZO-1 expression in Capan-2 cells, but upregulated cyclin E2 and CDK2 expressions (Figure 5A). The opposite results were found in the same cell lines transfected with inhibitors (Figure 5B), which was consistent with the data in PANC-1 cells (Figure 5C and D). Also, miR-590-3p underexpression upregulated p27, PPP2R2A, p21 and ZO-1 expression, but downregulated cyclin E2 and CDK2 expression in additional BxPC-3 cells (Figure 5E). We reasoned potential binding sequences on 3ʹ untranslated regions (UTR) of p27 and PPP2R2A with miR-590-3p via TargetScan (Figure 5H). Then dual-luciferase reporter assay was used to detect relative luciferase intensity of HEK-293T cells co-transfected with miR-590-3p or NC and luciferase reporter plasmid of two target genes. Relative luciferase activity was declined 57.28% and 42.11% within wild type 3ʹ-UTR transcripts of p27 and PPP2R2A, respective compared to negative control group (P<0.0001). However, relative luciferase activity was rebounded 12.17% and 20.64% after binding site mutation (P<0.0001) (Figure 5F). Moreover, IHC showed that both p27 and PPP2R2A expression was negatively associated with miR-590-3p expression in 19 clinical PC specimens (Table 2) (Figure 5G). In brief, 83.33% of p27 positive expressions had a low-level miR-590-3p expression, and vice versa. Similar correlations were also found between miR-590-3p and PPP2R2A. The P-value of OS between PC patients with positive PPP2R2A expression and negative PPP2R2A expression is borderline statistical significance (P=0.087, Figure 5I) and the former one had a better overall survival. Expression level of PPP2R2A was negatively connected with tumor size (P=0.017, Table 3). In addition, correlation analysis indicated that miR-590-3p expression inverse relevant with p27 (P=0.004, Table 2) and PPP2R2A expression (P=0.025, Table 2).
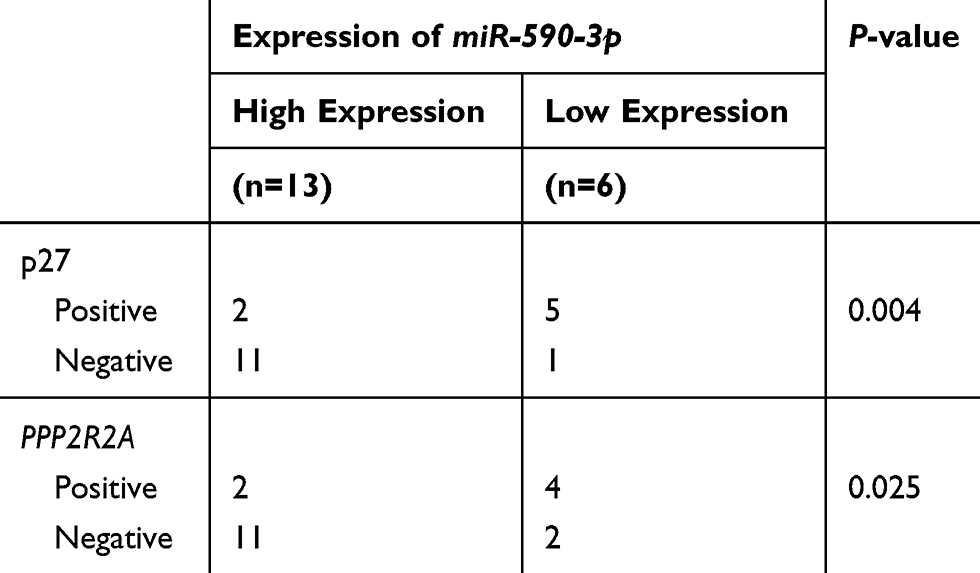 |
Table 2 Expression Association Between miR-590-3p and p27 and PPP2R2A (n=19) in PC |
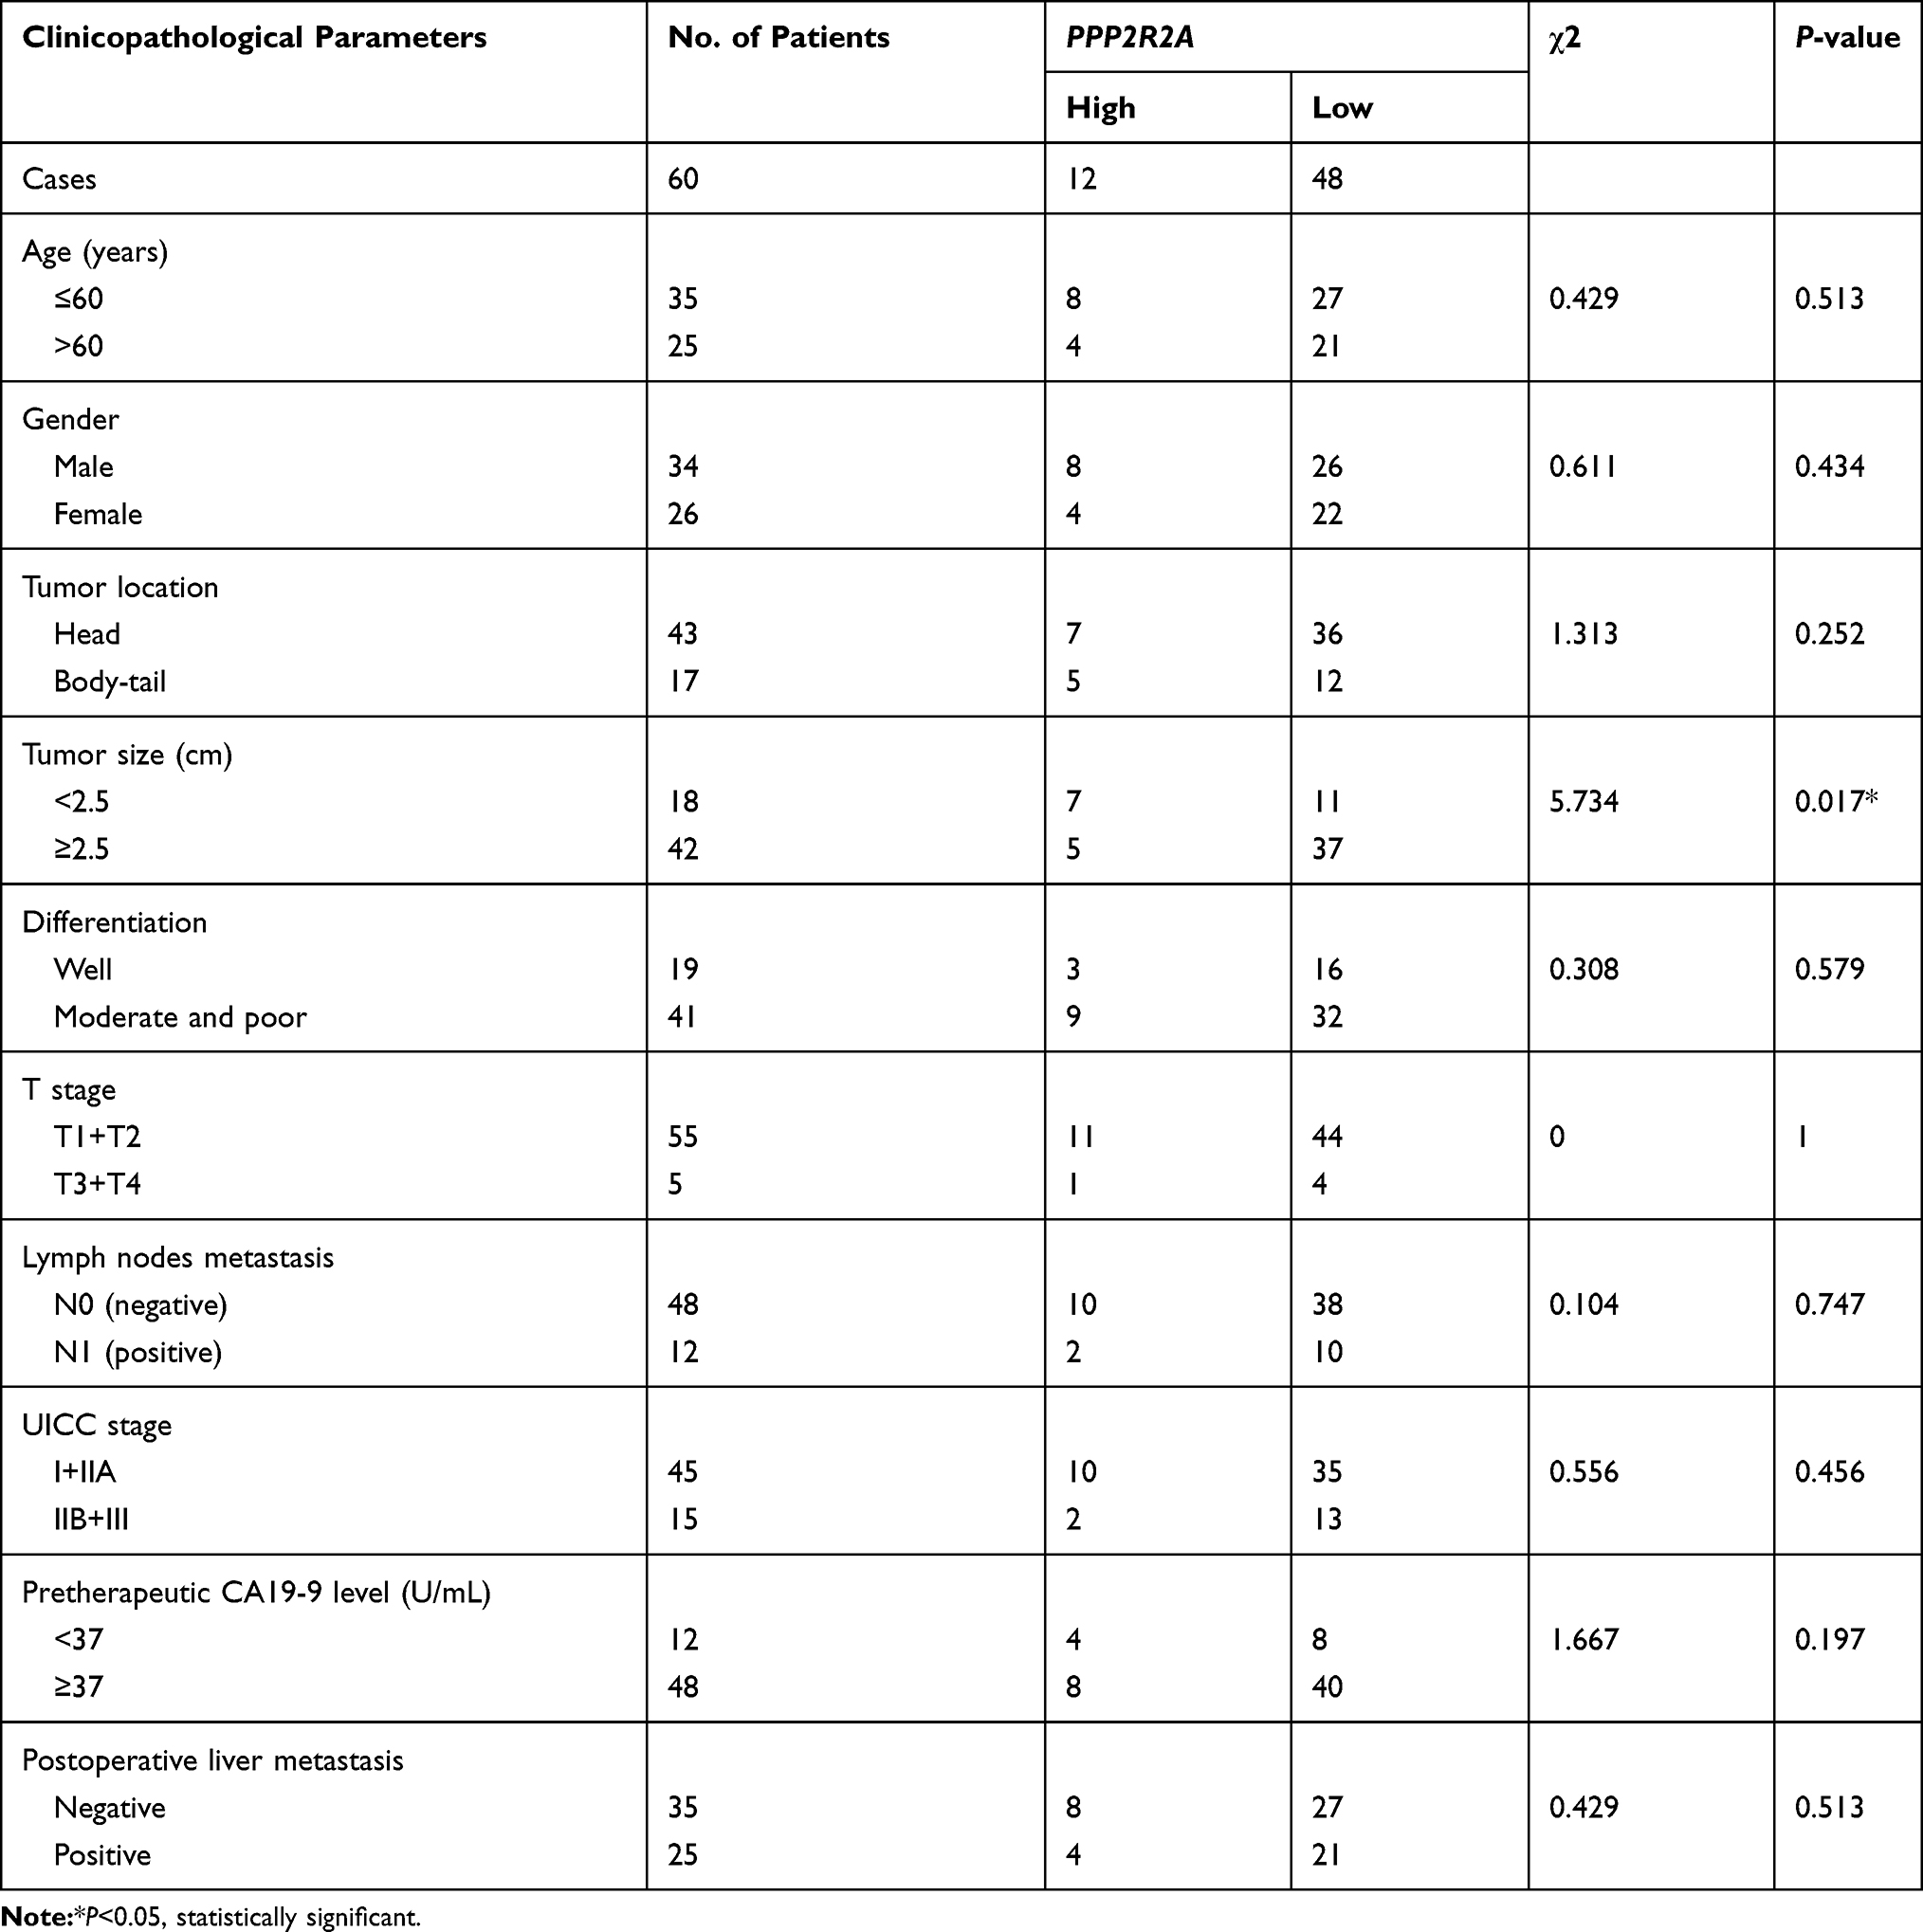 |
Table 3 Clinicopathological Associations of PPP2R2A Expression in Primary PDAC |
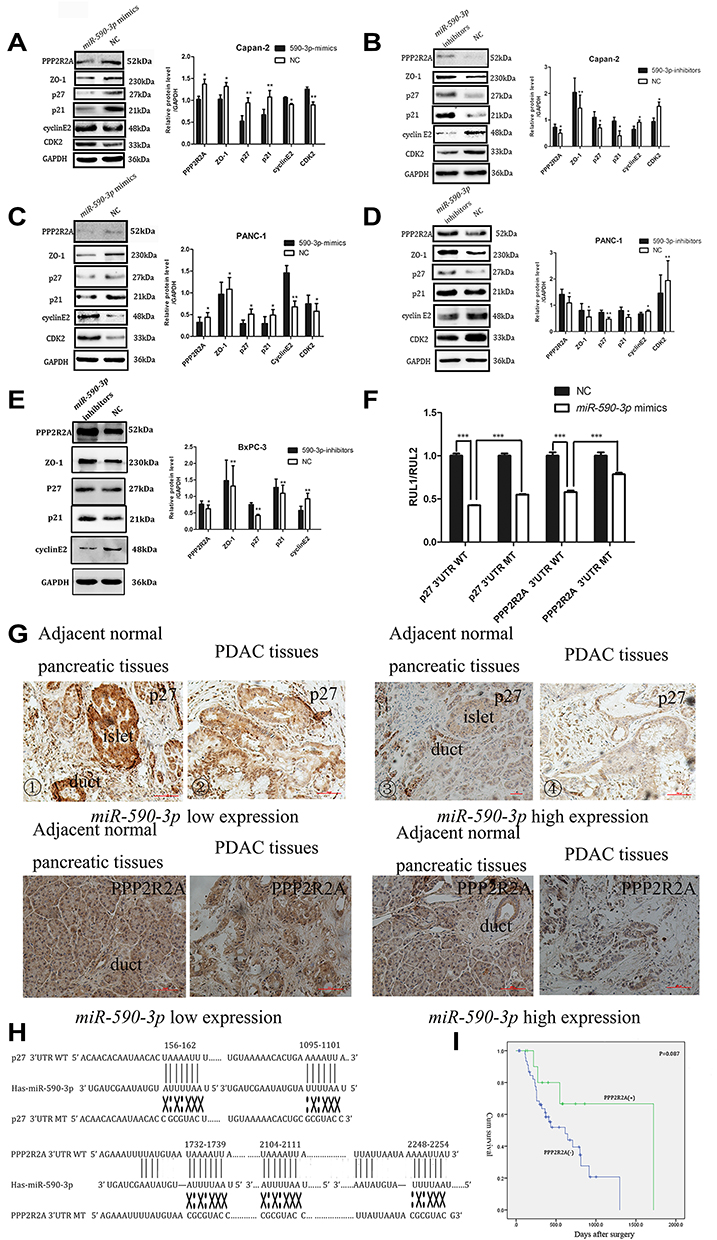 |
Figure 5 miR-590-3p directly targets the 3ʹ-UTR of p27 and PPP2R2A. (A–E) p27, PPP2R2A and other related protein expression was examined by a Western blot assay in PC cells. *P<0.05, **P<0.01. (F) Relative luciferase intensity in HEK-293T cells co-transfected with miR-590-3p or NC and p27 and PPP2R2A luciferase reporter plasmid. Data are showed as the ratio of firefly intensity to Renilla luciferase intensity. (G) ①-④ different expression intensities of p27 within low or high expression of miR-590-3p. ⑤-⑧ different expression intensities of PPP2R2A with low or high miR-590-3p expression.*P<0.05, **P<0.01, ***P<0.001. (H) miR-590-3p and its possible binding sites on the 3ʹ-UTR of p27 and PPP2R2A. WT, wild-type. MT, mutant type. (I) positive (+) and negative (–) expression of PPP2R2A was plotted against the time of overall survival. *P<0.05, **P<0.01. |
Overexpression of p27 and PPP2R2A Reversed the Effect of miR-590-3p
To further confirm the role of p27 and PPP2R2A in mediating miR-590-3p, we performed rescue experiments. The p27 and PPP2R2A overexpression plasmids and their corresponding empty vectors were transfected into PANC-1 cells, and the overexpression of p27 and PPP2R2A was confirmed by Western blotting (Figure 6A). In order to determine the effect of overexpression of p27 and PPP2R2A on the action of miR-590-3p, we co-transfected the overexpression plasmid of p27 and PPP2R2A with miR-590-3p mimics into PANC-1 cells. CCK-8 and colony formation showed that overexpression of p27 and PPP2R2A significantly reduced the promoting effect of miR-590-3p on cell proliferation (Figure 6B and C). The overexpression of p27 and PPP2R2A also significantly reduced the promoting effect of miR-590-3p on cell migration and invasion (Figure 6D and E).
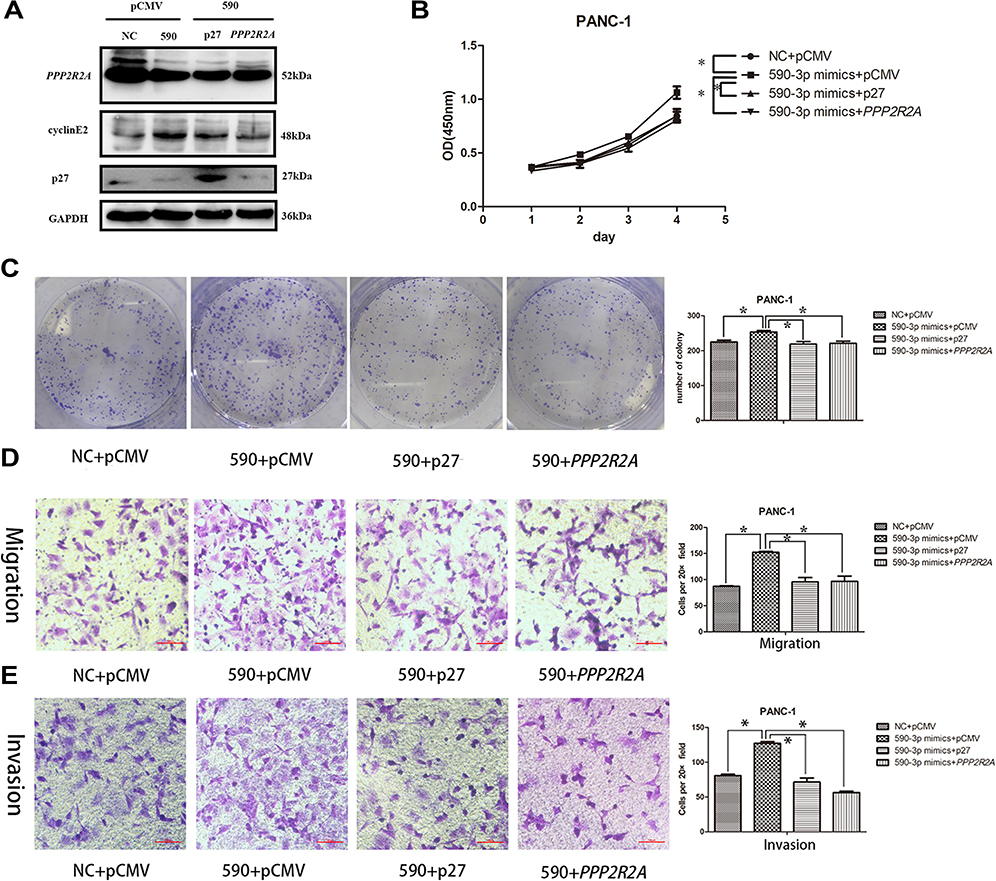 |
Figure 6 The overexpression of p27 and PPP2R2A reversed the promoting effect of miR-590-3p on the proliferation, migration and invasion ability of PANC-1. (A) WB confirmed the overexpression of p27 and PPP2R2A. (B) The proliferation capacity of PANC-1 cells co-transfected with p27, PPP2R2A and miR-590-3p mimics was significantly lower than that of PANC-1 cells co-transfected with pCMV and miR-590-3p mimics. (C) PANC-1 cells co-transfected with p27, PPP2R2A and miR-590-3p mimics and co-transfected with pCMV and miR-590-3p mimics were determined for colony formation. (D) PANC-1 cell migration experiment in which pCMV and miR-590-3p mimics were co-transfected with PANC-1 cells co-transfected with p27, PPP2R2A and miR-590-3p mimics. (E) PANC-1 cell invasion experiment in which pCMV and miR-590-3p mimics were co-transfected with PPP2R2A and miR-590-3p mimics, *P<0.05, . |
Based on our results above, we summarized the roles of miR-590-3p in PDAC (Figure 7). MiR-590-3p has several roles in PDAC: first of all, miR-590-3p decreases p27 expression to induce cell proliferation and invasion; second, miR-590-3p inhibits PPP2R2A expression to reduce p27 expression; in addition, miR-590-3p decrease ZO-1 expression to induce cell migration and invasion.
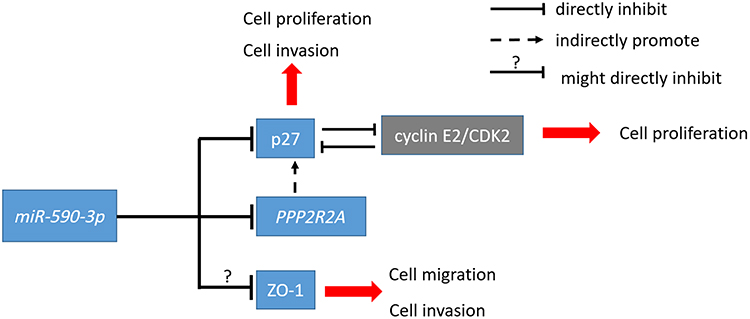 |
Figure 7 The schematic outline of the roles of miR-590-3p in PDAC. |
Discussion
Hsa-miR-590-3p, one of the human microRNA-590 family, had been reported to be a crucial factor in several malignant tumors. However, the function of miR-590-3p in different tumors remained controversial. miR-590-3p overexpression in gastric carcinoma (GC) was associated with tumor relapse in GC patients by direct regulating PPM1F.16 miR-590-3p motivated colon cancer cell growth and metastasis via Wnt/β-catenin signaling pathway and Hippo pathway6,17 and enhanced ovarian cancer proliferation and metastasis via targeting Cyclin G2, FOXA2 and FOXO3.18,19 However, miR-590-3p suppressed glioblastoma cell invasion, migration and EMT by targeting ZEB1 and ZEB2.8 To our knowledge, there was no systematic report involving its function in PC.
According to our study, miR-590-3p was overexpressed in PC tissues which was tightly associated with tumor size (P=0.042) and high preoperative CA19-9 level (P=0.046) of PC patients. In vitro, miR-590-3p overexpression promoted PC cell proliferation, invasion and migration. The negative relationship among miR-590-3p, p27, and PPP2R2A protein expression was verified by WB in vitro, which was also observed in PC samples. Furthermore, miR-590-3p directly downregulated p27 and PPP2R2A via the predicted binding sites. Other atypical binding sites existence and the indirect effect of hsa-miR-590-3p overexpression leading to target gene overall downregulation were two possible reasons to explain above results.20,21
As early as in 1999, it had been found that loss of p27 expression was significantly associated with poor prognosis of PC.12 p27 is also an independent prognostic marker of stage I–II pancreatic cancer.11 Upregulation or activation of p27 inhibited the activation of cyclin E/CDK2 complex and inhibited G1/S in cancer cells, and cyclin E2 can interact with p27 to contribute to tumorigenesis.22 p27 had been reported to be regulated by miR221 and miR222 to influence the biological behaviors of PC cells,23,24 which means that p27 can be a typical target gene of miRNAs in malignant tumor cells. In current study, miR-590-3p promoted cell proliferation of PC cells by pushing forward G1/S via p27-cyclin E/CDK2 axis, which was significantly reversed by the overexpression of p27 and PPP2R2A. Taken together, miR-590-3p mediating cell proliferation by regulating p27 and PPP2R2A in vitro (Figure 6).
PPP2R2A and ZO-1 were downregulated by overexpression of miR-590-3p in this study (Figure 5A and C). PPP2R2A was a negative modulator in PC and can be the target gene of other miRNAs.25,26 Breast cancers harboring PPP2R2A deletions were associated with worse OS.27 In patients with acute myeloid leukemia (AML), PPP2R2A had been shown to dephosphorylate AKT at Thr-308 rendering it inactive, which meant low expression of PPP2R2A related to a poorer prognosis in AML.28,29 The negative modulator role of PPP2R2A had also been elaborated in HCC,30 ovarian cancer,31 colorectal cancer32 and pancreatic cancer.24,25 In the current study, PPP2R2A positive expression was closely related to a better OS of PC patients. More clinical specimens will be added in our future study.
In conclusion, for the first time, miR-590-3p promotes PC cell growth, invasion and migration by directly downregulating p27 and PPP2R2A which acts as an oncomiR and serves as a diagnostic and therapeutic target in PC.
Acknowledgments
We thank the institute of general surgery and central laboratory of the First Hospital of China Medical University for technical support. This work was supported by National Natural Science Foundation of China (No. 81672835). This work was also supported by the Social Development Program from Shenyang Science and Technology Bureau, China (No. F20-205-4-033).
Disclosure
The authors report no conflicts of interest in this work.
References
1. Ferlay J, Soerjomataram I, Dikshit R, et al. Cancer incidence and mortality worldwide: sources, methods and major patterns in GLOBOCAN 2012. Int J Cancer. 2015;136(5):E359–86. doi:10.1002/ijc.29210
2. Bartel DP. MicroRNAs: genomics, biogenesis, mechanism, and function. Cell. 2004;116(2):281–297. doi:10.1016/S0092-8674(04)00045-5
3. Ekhteraei-Tousi S, Mohammad-Soltani B, Sadeghizadeh M, et al. Inhibitory effect of hsa-miR-590-5p on cardiosphere-derived stem cells differentiation through downregulation of TGFB signaling. J Cell Biochem. 2015;116(1):179–191. doi:10.1002/jcb.24957
4. Lee S, Yu KR, Ryu YS, et al. miR-543 and miR-590-3p regulate human mesenchymal stem cell aging via direct targeting of AIMP3/p18. Age (Dordr). 2014;36(6):9724. doi:10.1007/s11357-014-9724-2
5. Li Y, Sarkar FH. MicroRNA targeted therapeutic approach for pancreatic cancer. Int J Biol Sci. 2016;12(3):326–337. doi:10.7150/ijbs.15017
6. Feng ZY, Xu XH, Cen DZ, et al. miR-590-3p promotes colon cancer cell proliferation via Wnt/beta-catenin signaling pathway by inhibiting WIF1 and DKK1. Eur Rev Med Pharmacol Sci. 2017;21(21):4844–4852.
7. Zhou C, Li J, Li J, et al. Hsa-miR-137, hsa-miR-520e and hsa-miR-590-3p perform crucial roles in Lynch syndrome. Oncol Lett. 2016;12(3):2011–2017. doi:10.3892/ol.2016.4816
8. Pang H, Zheng Y, Zhao Y, et al. miR-590-3p suppresses cancer cell migration, invasion and epithelial-mesenchymal transition in glioblastoma multiforme by targeting ZEB1 and ZEB2. Biochem Biophys Res Commun. 2015;468(4):739–745. doi:10.1016/j.bbrc.2015.11.025
9. Hong L, Zhao X, Shao X, et al. miR-590 regulates WT1 during proliferation of G401 cells. Mol Med Rep. 2017;16(1):247–253. doi:10.3892/mmr.2017.6561
10. Soos TJ, Kiyokawa H, Yan JS, et al. Formation of p27-CDK complexes during the human mitotic cell cycle. Cell Growth Differ. 1996;7(2):135–146.
11. Juuti A, Nordling S, Louhimo J, et al. Loss of p27 expression is associated with poor prognosis in stage I-II pancreatic cancer. Oncology. 2003;65(4):371–377. doi:10.1159/000074651
12. Lu CD, Morita S, Ishibashi T, et al. Loss of p27Kip1 expression independently predicts poor prognosis for patients with resectable pancreatic adenocarcinoma. Cancer. 1999;85(6):1250–1260.
13. Feakins RM, Ghaffar AH. p27 Kip1 expression is reduced in pancreatic carcinoma but has limited prognostic value. Hum Pathol. 2003;34(4):385–390. doi:10.1053/hupa.2003.23
14. Janssens V, Goris J. Protein phosphatase 2A: a highly regulated family of serine/threonine phosphatases implicated in cell growth and signalling. Biochem J. 2001;353(Pt 3):417–439. doi:10.1042/bj3530417
15. Lechward K, Awotunde OS, Swiatek W, et al. Protein phosphatase 2A: variety of forms and diversity of functions. Acta Biochim Pol. 2001;48(4):921–933. doi:10.18388/abp.2001_3858
16. Zhang J, Jin M, Chen X, et al. Loss of PPM1F expression predicts tumour recurrence and is negatively regulated by miR-590-3p in gastric cancer. Consultant Pharmacist®. 2018;51(4):e12444.
17. Sun ZQ, Shi K, Zhou QB, et al. MiR-590-3p promotes proliferation and metastasis of colorectal cancer via Hippo pathway. Oncotarget. 2017;8(35):58061–58071. doi:10.18632/oncotarget.19487
18. Salem M, O’brien JA. miR-590-3p promotes ovarian cancer growth and Metastasis via a novel FOXA2-versican pathway. Cancer Res. 2018;78(15):4175–4190.
19. Salem M, Shan Y, Bernaudo S, et al. miR-590-3p targets cyclin G2 and FOXO3 to promote ovarian cancer cell proliferation, invasion, and spheroid formation. Int J Mol Sci. 2019;20:8. doi:10.3390/ijms20081810
20. Lorenz WW, Mccann RO, Longiaru M, et al. Isolation and expression of a cDNA encoding Renilla reniformis luciferase. Proc Natl Acad Sci U S A. 1991;88(10):4438–4442. doi:10.1073/pnas.88.10.4438
21. Farr A, Roman A. A pitfall of using a second plasmid to determine transfection efficiency. Nucleic Acids Res. 1992;20(4):920. doi:10.1093/nar/20.4.920
22. Wingate H, Zhang N, Mcgarhen MJ, et al. The tumor-specific hyperactive forms of cyclin E are resistant to inhibition by p21 and p27. J Biol Chem. 2005;280(15):15148–15157. doi:10.1074/jbc.M409789200
23. Sarkar S, Dubaybo H, Ali S, et al. Down-regulation of miR-221 inhibits proliferation of pancreatic cancer cells through up-regulation of PTEN, p27(kip1), p57(kip2), and PUMA. Am J Cancer Res. 2013;3(5):465–477.
24. Li Z, Tao Y, Wang X, et al. Tumor-secreted exosomal miR-222 promotes tumor progression via regulating P27 expression and re-localization in pancreatic cancer. Cell Physiol Biochem. 2018;51(2):610–629. doi:10.1159/000495281
25. Wang Q, Li J, Wu W, et al. Smad4-dependent suppressor pituitary homeobox 2 promotes PPP2R2A-mediated inhibition of Akt pathway in pancreatic cancer. Oncotarget. 2016;7(10):11208–11222. doi:10.18632/oncotarget.7158
26. Shen R, Wang Q, Cheng S, et al. The biological features of PanIN initiated from oncogenic Kras mutation in genetically engineered mouse models. Cancer Lett. 2013;339(1):135–143. doi:10.1016/j.canlet.2013.07.010
27. Beca F, Pereira M, Cameselle-Teijeiro JF, et al. Altered PPP2R2A and Cyclin D1 expression defines a subgroup of aggressive luminal-like breast cancer. BMC Cancer. 2015;15:285. doi:10.1186/s12885-015-1266-1
28. Shouse G, De Necochea-campion R, Mirshahidi S, et al. Novel B55alpha-PP2A mutations in AML promote AKT T308 phosphorylation and sensitivity to AKT inhibitor-induced growth arrest. Oncotarget. 2016;7(38):61081–61092. doi:10.18632/oncotarget.11209
29. Ruvolo PP, Ruvolo VR, Jacamo R, et al. The protein phosphatase 2A regulatory subunit B55alpha is a modulator of signaling and microRNA expression in acute myeloid leukemia cells. Biochim Biophys Acta. 2014;1843(9):1969–1977. doi:10.1016/j.bbamcr.2014.05.006
30. Wong QW, Ching AK, Chan AW, et al. MiR-222 overexpression confers cell migratory advantages in hepatocellular carcinoma through enhancing AKT signaling. Clin Cancer Res. 2010;16(3):867–875. doi:10.1158/1078-0432.CCR-09-1840
31. Zhang J, Gao D, Zhang H. Upregulation of miR-614 promotes proliferation and inhibits apoptosis in ovarian cancer by suppressing PPP2R2A expression. Mol Med Rep. 2018;17(5):6285–6292.
32. Liang WL, Cao J, Xu B, et al. miR-892a regulated PPP2R2A expression and promoted cell proliferation of human colorectal cancer cells. Biomed Pharmacother. 2015;72:119–124. doi:10.1016/j.biopha.2015.04.015
 © 2020 The Author(s). This work is published and licensed by Dove Medical Press Limited. The full terms of this license are available at https://www.dovepress.com/terms.php and incorporate the Creative Commons Attribution - Non Commercial (unported, v3.0) License.
By accessing the work you hereby accept the Terms. Non-commercial uses of the work are permitted without any further permission from Dove Medical Press Limited, provided the work is properly attributed. For permission for commercial use of this work, please see paragraphs 4.2 and 5 of our Terms.
© 2020 The Author(s). This work is published and licensed by Dove Medical Press Limited. The full terms of this license are available at https://www.dovepress.com/terms.php and incorporate the Creative Commons Attribution - Non Commercial (unported, v3.0) License.
By accessing the work you hereby accept the Terms. Non-commercial uses of the work are permitted without any further permission from Dove Medical Press Limited, provided the work is properly attributed. For permission for commercial use of this work, please see paragraphs 4.2 and 5 of our Terms.