")
Back to Journals » Drug Design, Development and Therapy » Volume 9
Hsa-microRNA-181a is a regulator of a number of cancer genes and a biomarker for endometrial carcinoma in patients: a bioinformatic and clinical study and the therapeutic implication
Authors He S, Zeng S, Zhou Z, He Z, Zhou S
Received 31 August 2014
Accepted for publication 24 September 2014
Published 18 February 2015 Volume 2015:9 Pages 1103—1175
DOI https://doi.org/10.2147/DDDT.S73551
Checked for plagiarism Yes
Review by Single anonymous peer review
Peer reviewer comments 3
Editor who approved publication: Prof. Dr. Wei Duan
Shuming He,1 Shumei Zeng,1 Zhi-Wei Zhou,2,3 Zhi-Xu He,3 Shu-Feng Zhou2,3
1Department of Obstetrics and Gynecology, Xiaolan People’s Hospital affiliated to Southern Medical University, Zhongshan, Guangdong, People’s Republic of China; 2Department of Pharmaceutical Sciences, College of Pharmacy, University of South Florida, Tampa, FL, USA; 3Guizhou Provincial Key Laboratory for Regenerative Medicine, Stem Cell and Tissue Engineering Research Center and Sino-US Joint Laboratory for Medical Sciences, Guiyang Medical University, Guiyang, Guizhou, People’s Republic of China
Abstract: The aberrant expression of human microRNA-181a-1 (hsa-miR-181a) has been implicated in the pathogenesis of various cancers, serving as an oncogene or a tumor suppressor. However, the role of hsa-miR-181a in the pathogenesis of endometrial carcinoma (EC) and its clinical significance are unclear. This study aimed to search for the molecular targets of hsa-miR-181a using bioinformatic tools and then determine the expression levels of hsa-miR-181a in normal, hyperplasia, and EC samples from humans. To predict the targets of hsa-miR-181a, ten different algorithms were used, including miRanda-mirSVR, DIANA microT v5.0, miRDB, RNA22 v2, TargetMiner, TargetScan 6.2, PicTar, MicroCosm Targets v5, and miRWALK. Two algorithms, TarBase 6.0 and miRTarBase, were used to identify the validated targets of hsa-miR-181a-5p (a mature product of hsa-miR-181a), and the web-based Database for Annotation, Visualization and Integrated Discovery (DAVID) 6.7 was used to provide biological functional interpretation of the validated targets of hsa-miR-181a-5p. A total of 78 formalin-fixed, paraffin-embedded tissue specimens from 65 patients and 13 healthy subjects were collected and examined, including normal endometrium (n=13), endometrial hyperplasia (n=18), and EC (37 type I and 10 type II EC cases). Our bioinformatic studies have showed that hsa-miR-181a might regulate a large number of target genes that are important in the regulation of critical cell processes, such as cell fate, cell survival, metabolism, and cell death. To date, 313 targets of hsa-miR-181a have been validated, and 22 of these targets are cancer genes. The precision of predictions by all the algorithms for hsa-miR-181a-1’s targets was low. Many of these genes are involved in tumorigenesis of various cancers, including EC, based on the DAVID and Kyoto Encyclopedia of Genes and Genomes (KEGG) pathway analysis. In comparison with normal endometrial tissue, the expression level of hsa-miR-181a was significantly increased in type I and type II EC (P<0.05), and type II EC exhibited a significant higher expression level of hsa-miR-181a than that in type I EC (P<0.05). In addition, there was a significant increase in the expression level of hsa-miR-181a in type II EC compared with endometrial hyperplasia (P<0.05). Taken together, these results suggest that hsa-miR-181a may serve as an oncogene in endometrial tumorigenesis and that hsa-miR-181a might be used as a new biomarker in the prediction of prognosis of EC in clinical practice. More functional and mechanistic studies are needed to validate the role of hsa-miR-181a in the development, progression, and metastasis of EC.
Keywords: RT-PCR, endometrial cancer, development, progression
Introduction
microRNAs (miRNAs) are a large group of noncoding small RNAs with 20–25 nucleotides that have a capability of regulating gene expression at posttranscriptional levels by antisense complementarily to specific target messenger (m)RNAs.1,2 Based on miRBase version 21 released in June 2014 (http://www.mirbase.org/), there are 1,881 miRNA precursors and 2,588 mature miRNAs in humans. miRNAs are transcribed as ~70 nucleotide stem-loop precursors and subsequently processed by the cytoplasmic RNase III-type enzyme Dicer to generate ~22 nucleotide mature products that can target and modulate protein expression by inhibiting translation and/or inducing degradation of target mRNAs. The mature miRNA is incorporated into a RNA-induced silencing complex (RISC), which recognizes target mRNAs through imperfect base pairing with the miRNA. miRNAs act as adaptors that employ a silencing complex to target mRNAs by selective base-pairing, primarily in the 3′-untranslated region (3′-UTR). Target interaction does not require perfect complementarity between microRNA and mRNA sequences, although near-perfect base-pairing in a small region in the 5′-end (positions 2–8) of the microRNA (sometimes termed “seed”) appears to be one of the key determinants of target recognition. miRNAs regulate almost every signaling pathway and play crucial roles in diverse biological processes, such as development, differentiation, apoptosis, and proliferation.1–3 It has been shown that aberrant expression of miRNAs is involved in the development and progression of many types of cancer through regulation of functional proteins and the network of signaling pathways related to cell proliferation, cell migration and invasion, programmed cell death, and cell survival.3–7 It has been proposed that miRNAs can function as tumor suppressors or oncogenes, targeting other oncogenes and/or tumor-suppressors to modulate cancer development, progression, and metastasis.1,5–8
An extremely large number of potential target sites exist for any given miRNA, and the process of validating a potential miRNA target in the laboratory is time consuming and costly. A computational approach to prediction of miRNA targets facilitates the process of narrowing down potential target sites for experimental validation, which is a critical initial step in identifying miRNA–target interactions. Several useful algorithms/tools provide microRNA target predictions based on sequence complementarity to target sites, with emphasis on perfect or near-perfect base-pairing in the seed region and sequence conservation.9,10 These tools for miRNA target prediction, encompassing a range of different computational approaches, from the modeling of physical interactions to the incorporation of machine learning, are mostly based on seed match, conservation, free energy, and site accessibility.10
Endometrial cancer (EC) is the sixth most common cancer in women worldwide, with at least 320,000 new cases being diagnosed and 74,000 women who die from this disease every year.11 In the United States, there was an estimation of 52,630 new cases and 8,590 deaths due to EC in 2014.12 In the United Kingdom, there were 8,474 women diagnosed with EC and 1,914 deaths from EC in 2011.11 In the People’s Republic of China, the incidence of EC is much lower than Western countries. It contributes about 1% of the world’s new EC cases.11
There are two types of EC, type I and type II, with different molecular expression profiles and histopathological and clinical behaviors.13,14 Type I EC, accounting for 75% of EC, is estrogen-dependent with endometrioid morphology, and the 5-year survival rate is 80%-85%.15 Type II EC exhibits poorly differentiated endometrioid and serous histological alterations with myometrial invasion and extrauterine spread, and the 5-year survival rate is about 35%. Type I EC is related to hyperestrogenism, associated with endometrial hyperplasia, frequent expression of estrogen and progesterone receptors (ER and PR), and younger age, whereas type II EC is unrelated to estrogen and is associated with atrophic endometrium, frequent lack of ER and PR, and older age. The morphologic differences in type I and type II EC are mirrored in their molecular genetic profile, with type I showing defects in DNA-mismatch repair and mutations in phosphatase and tensin homolog (PTEN), phosphatidylinositol-4,5-bisphosphate 3-kinase, catalytic subunit α (PIK3CA), V-Ki-ras2 Kirsten rat sarcoma viral oncogene homolog (KRAS), and β-catenin/CTNNB1, and type II showing chromosomal instability and aneuploidy, p53 mutations, and human epidermal growth factor receptor 2 (HER2)/neu (erbB-2) amplification.16,17 Type I EC is associated with chronic exposure to unopposed estrogen and is often preceded by complex atypical hyperplasia. Current therapies for EC include surgery, chemotherapy, radiation therapy, immunotherapy, and biological therapy.18 Most cases of EC are diagnosed at an early stage, which has a 5-year survival rate of over 91%.11 However, the prognosis of EC does not meet the long-term survival expectation due to tumor metastasis, lack of effective treatment, and rarity of valid biomarkers to precisely predict therapeutic outcome.19 There are lines of evidence that a number of genetic and epigenetic factors have been implicated in the pathogenesis of EC, including abnormality in oncogenes, tumor suppressors, and miRNAs and related signaling pathways.13 Alterations in the expression profiles of oncogenes and tumor suppressor genes are the major contributing factors to the initiation, development, progression, and metastasis of EC. However, the association between such alterations and the clinical phenotypes of EC has not been conclusively established yet, and the underlying mechanism for EC etiology remains elusive.
There is an increased interest in the discovery and identification of miRNAs as novel epigenetic biomarkers for early detection and prediction of therapeutic outcomes in cancer therapy.20–24 So far, there are a number of human miRNAs that have been identified to have a potential role in the development and progression of EC, including hsa-miR-181a, hsa-miR-185, hsa-miR-106a, hsa-miR-210, hsa-miR-423, hsa-miR-107, hsa-miR-let7c, and hsa-miR-221.3,4 hsa-miR-181a is one of the many miRNAs conserved among the vertebrates that is preferentially expressed in B lymphocytes of bone marrow, and its ectopic expression in hematopoietic stem/progenitor cells modulates blood cell development.25 hsa-miR-181a has been reported to be a key modulatory factor in the regulation of cell proliferation and differentiation at transcriptional and posttranscriptional levels in gastric cancer, acute myeloid leukemia, and other types of cancer,26,27 and hsa-miR-181a overexpression resulted in promotion of cell proliferation and migration but inhibition of apoptosis in colorectal cancer.28 RalA, one of the Ral family small G proteins, is directly regulated by hsa-miR-181a and plays an important role in the development chronic myelogenous leukemia.29 hsa-miR-181a and hsa-miR-181b act as tumor suppressors by inducing cell growth inhibition, apoptosis, and repression of invasion in glioma cells.30 So far, there have been only scattered reports about the role of a form of miR-181a in EC.4 Panda et al31 showed that the expression level of miR-181a-1 was higher in EC than in normal endometrial tissues. However, there is limited information on the association between the expression profile of miR-181a and the development and progression of EC. In this regard, we conducted a comprehensive bioinformatic study to predict the targets of miR-181a-1 and then validate these targets based on published experimental evidence. Finally, we examined the expression levels of miR-181a-1 in different types of EC and the association with the clinical progression of EC.
Material and methods
Gene nomenclature
The miR-181 family includes four members, namely miR-181a, miR-181b, miR-181c, and miR-181d. They are expressed in at least 70 species and various human cancers and are highly conserved in the seed-region sequence and RNA secondary structure. hsa-miR-181a-1 was retrieved from miRBase 21 (http://www.mirbase.org/). The hsa-miR-181a-1 gene (MIR181A1) has been mapped to 1q32.1. miRBase was established in 2002 as the public and central online repository for all published miRNA sequences and associated annotations, and the latest miRBase release of v21 (released in June 2014) contains 28,645 miRNA loci from 223 species (of which 1,881 precursors and 2,588 mature miRNAs are for humans), processed to produce 35,828 mature miRNAs. As compared with miRBase v20, a total of 4,196 new hairpin sequences and 5,441 novel mature products, mainly for bat, horse, goat, cobra, and salmon, have been added, with 72 dubious and misannotated entries removed from version 21. miRBase provides a user-friendly web interface for miRNA data, allowing the user to search using key words or sequences, trace links to the primary literature referencing the miRNA discoveries, analyze genomic coordinates and context, and mine relationships between miRNA sequences.32–34 Clusters of miRNA sequences in the genome are highlighted and can be defined and retrieved with any inter-miRNA distance. The mature forms of hsa-miR-181a include hsa-miR-181a-3p and hsa-miR-181a-5p (Table 1).
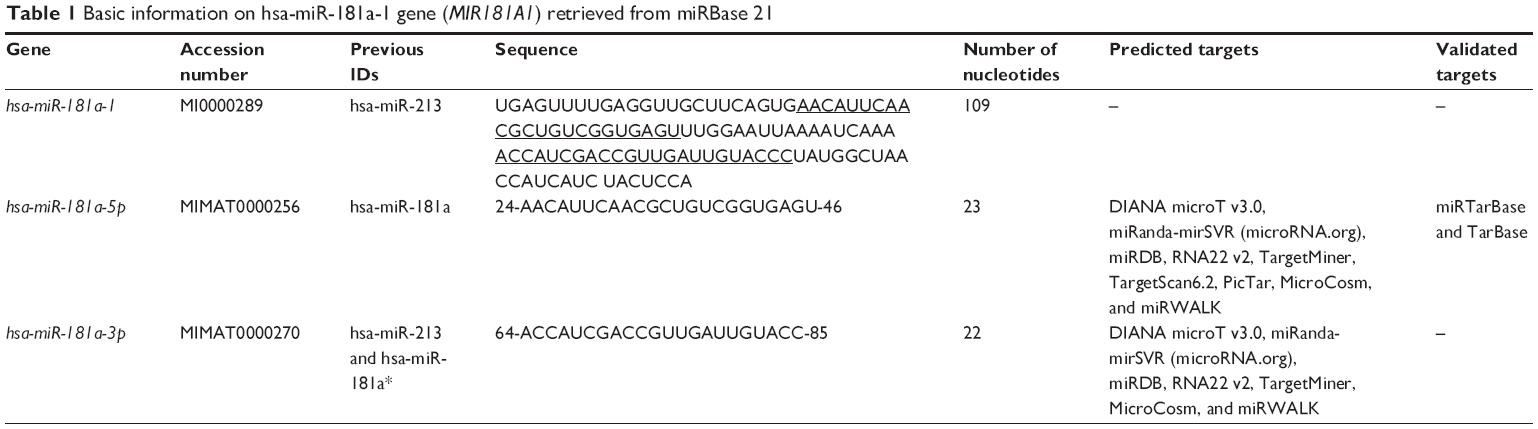 | Table 1 Basic information on hsa-miR-181a-1 gene (MIR181A1) retrieved from miRBase 21 |
Prediction of the targets of hsa-miR-181a using various computational algorithms
Before starting the bench and clinical work, we conducted a bioinformatic study to predict the target genes regulated by hsa-miR-181a-3p and hsa-miR-181a-5p, using ten different algorithms, including miRanda-mirSVR (http://www.microrna.org/), DIANA microT v5.0 (http://diana.cslab.ece.ntua.gr/microT/), miRDB (http://mirdb.org/miRDB/), RNA22 v2 (https://cm.jefferson.edu/rna22v2.0/), TargetMiner (http://www.isical.ac.in/~bioinfo_miu/targetminer20.htm), TargetScan 6.2 (http://www.targetscan.org/), PicTar (http://pictar.mdc-berlin.de/), MicroCosm Targets v5 (http://www.ebi.ac.uk/enright-srv/microcosm/htdocs/targets/v5/), and miRWALK (http://www.umm.uni-heidelberg.de/apps/zmf/mirwalk/index.html).
miRanda-mirSVR (http://www.microrna.org/) is an online tool that can be used to predict targets and score them.35 Unlike most miRNA target predictors, miRanda considers matching along the entire miRNA sequence, and it takes the seed region into account by weighting matches in the seed region more heavily; free energy is calculated by predicting the folding of the miRNA:mRNA hybrid, using the Vienna package. DIANA microT v5.0 currently hosts miRNA target predictions for Homo sapiens, Mus musculus, Drosophila melanogaster, and Caenorhabditis elegans, based on data from Ensembl release 69 and miRBase version 18.36,37 miRDB, a web-based database and tool, can predict miRNAs and their targets.38 All the targets are predicted by the bioinformatic tool MirTarget2, which has been developed by analyzing thousands of genes impacted by miRNAs, using a support vector machine (SVM) learning machine. RNA22 v2 can be used to predict the targets of miRNAs in human, mouse, roundworm, and fruit fly.39 It allows users to visualize the predictions within a complementary (c)DNA map and also find transcripts where multiple miRNAs of interest target.
TargetMiner is a robust tool for microRNA target prediction with systematic identification of negative examples.40 In this algorithm, ~300 tissue-specific negative examples have been identified, using a novel approach that involves expression profiling of miRNAs and mRNAs, miRNA–mRNA structural interactions, and seed-site conservation. TargetScan 6.2 can predict biological targets of miRNAs by searching for the presence of conserved 8-mer and 7-mer sites matching the seed region of each miRNA,41 with nonconserved sites being predicted as well. TargetScan is the first computational method used for human miRNA target prediction, that uses mouse, rat, and fish genomes for conservation analysis. In mammals, the prediction is ranked based on the predicted efficacy of targeting as calculated using the context+ scores of the sites.42 The context score for a specific site is the sum of the contribution of four features: site-type contribution, 3′-pairing contribution, local nucleobases adenine and uracil contribution, and position contribution. In the current work, the sum of the context scores for each miRNA was calculated, and the most favorable (lowest) was shown. PicTar is an algorithm for the identification of miRNA targets.43 In addition, MicroCosm Targets v5 was used to predict the targets that might be regulated by hsa-miR-181a. In this tool, there are 851 miRNAs (711 native) with 34,788 targets for humans.
miRWALK is a comprehensive database that provides information on miRNAs from the human, mouse, and rat, on their predicted as well as validated binding sites on their target genes (http://www.umm.uni-heidelberg.de/apps/zmf/mirwalk/index.html).44 miRWALK predicts miRNA binding sites on the complete sequence of all known genes, including all transcripts and mitochondrial genes of the human, mouse, and rat, based on a comparison of identified miRNA binding sites with ten established miRNA-target prediction programs: miRWALK, DIANA-microT v3.0, miRanda, miRDB, PicTar 4 and PicTar 5, PITA (http://genie.weizmann.ac.il/pubs/mir07/mir07_prediction.html), RNA22, RNAhybrid (http://bibiserv.techfak.uni-bielefeld.de/rnahybrid/submission.html), and TargetScan. In addition, it provides predicted miRNA binding sites on genes associated with 449 human biological pathways and 2,356 Online Mendelian Inheritance in Man (OMIM) disorders.44 This algorithm also presents information on experimentally validated miRNA interaction information associated with genes, pathways, diseases, organs, OMIM disorders, cell lines, and literature on miRNAs.
Validated targets of hsa-miR-181a based on TarBase 6.0 and miRTarBase 4.0
Two algorithms were used to identify the validated targets of miR-181a-5p: TarBase 6.0 and miRTarBase 4.0. TarBase 6.0 is a database that houses a manually curated collection of experimentally supported miRNA targets in 21 species, including human, rat, mouse, virus, Caenorhabditis elegans, Danio rerio (zebrafish), Drosophila, and plant (http://diana.imis.athena-innovation.gr/DianaTools/index.php?r=tarbase/index).45 TarBase 6.0 is the largest available manually curated target database, indexing more than 65,000 miRNA-gene interactions, 16.5- to 175-fold more than any other available implementation. The database includes targets derived from specific as well as high-throughput experiments, such as microarrays and proteomics. Specific attention was paid in the inclusion of targets derived from sequencing experiments, such as high-throughput sequencing of RNA isolated by crosslinking immunoprecipitation (HITS-CLIP) and photoactivatable-ribonucleoside-enhanced crosslinking and immunoprecipitation (PAR-CLIP). TarBase 6.0 hosts data derived from three CLIP-Seq and 12 Degradome-Seq studies, significantly more than any other available database. DIANA TarBase 6.0 offers a significant amount of crucial information to the user, including detailed description of the involved genes and miRNAs, a list of publications supporting each interaction, and the experimental methods used for validations, along with their outcomes. The database also provides links to related Kyoto Encyclopedia of Genes and Genomes (KEGG) pathways, as well as to other external databases, such as Ensembl, Uniprot, and RefSeq. It is also equipped with powerful searching and filtering capabilities.
miRTarBase 4.0 has collected 51,460 miRNA–target interactions from 18 species having experimental evidence (http://mirtarbase.mbc.nctu.edu.tw/).46 Generally, the collected miRNA–target interactions are validated experimentally by reporter assay, Western blotting, microarray, and next-generation sequencing experiments. There are 4,572 miRNA–target interactions validated by reporter assays or Western blotting experiments.
Cancer genes are defined as “mutated genes that are causally implicated in oncogenesis” based on the criteria by Futreal et al47 (Table S1 gives the full list of cancer genes). The proteins that are encoded by cancer genes normally regulate cell proliferation, cell differentiation, and cell death. Mutations underlying oncogenesis also occur in genes that mediate DNA-repair processes. Currently, more than 1% of all human genes have been implicated, via mutation, in cancer. Of these, approximately 90% have been implicated in somatic mutations in cancer, 20% bear germline mutations that predispose to cancer, and 10% show both somatic and germline mutations.48
Pathway analysis by the Database for Annotation, Visualization and Integrated Discovery (DAVID)
The web-based DAVID 6.7 (http://david.abcc.ncifcrf.gov/)49,50 was used to provide biological functional interpretation of the validated targets of hsa-miR-181a-5p, based on TarBase 6.0 and miRTarBase 4.0. DAVID 6.7 systematically maps a large number of interesting genes in a list to associated Gene Ontology (GO) terms, and then statistically highlights the most overrepresented (enriched) GO terms out of a list of hundreds or thousands of terms.47,48 The DAVID Knowledgebase has comprehensively integrated more than 20 types of major gene/protein identifiers and more than 40 well-known functional annotation categories from dozens of public databases, to address the enriched and redundant relationships among many genes to many terms. The protein IDs of the validated targets of hsa-miR-181a-5p from the National Center for Biotechnology Information (NCBI), Protein Information Resource (PIR), and UniProtKB were converted into gene lists, using the Gene ID Conversion Tool in DAVID. By doing so, interesting genes derived from one identifier system can be quickly translated to other gene identifier types preferred by a given annotation resource. The DAVID database adds biological function annotation including GO terms, protein–protein interactions, protein functional domains, disease associations, gene clustering, biopathways, sequence general features, homologies, gene functional summaries, and gene tissue expressions in a network context.47,48 The genes of interest were visualized using BioCarta and KEGG pathway maps. The highest classification stringency was selected for functional annotation clustering. Enrichment scores and Fisher’s exact test P-values (and corresponding false discovery rate [FDR]) were then calculated to identify which functionally related gene groups are significantly enriched in the target list.
Reagents and antibodies
The RNA inhibitor and Moloney murine leukemia virus reverse transcriptase were obtained from Promega Inc. (Madison, WI, USA). The antigen retrieval solution (ethylenediaminetetraacetic acid [EDTA] method) and Dolichos biflorus agglutinin kit were purchased from Maixin Biological Co. Ltd., Fuzhou, Fujian, People’s Republic of China. Human monoclonal primary antibodies against (ER, PR), and horseradish peroxidase-conjugated secondary antibodies were bought from Linked-Biotech Pathology Co. Ltd. (Guangzhou, Guangdong, People’s Republic of China). MiR-easy FFPE Kit and Syber® Green PCR mix were purchased from QIAGEN Inc. (Venlo, the Netherlands).
Sample collection
Fresh tissue samples were obtained from 65 patients who received uterusectomy and 13 healthy subjects at Xiaolan People’s Hospital or Zhongshan People’s Hospital, Zhongshan, Guangdong, or at Nanfang Hospital of Southern Medical University, Guangzhou, Guangdong, People’s Republic of China, with a mean age of 48 years (range 24–69). We collected the endometrial samples from 47 patients with EC, 18 patients with endometrial hyperplasia, and 13 healthy subjects. There was no preoperative radiotherapy, chemotherapy, or endocrine therapy performed in any of the recruited participants. All samples were fixed with formalin and embedded with paraffin. International Federation of Gynecology and Obstetrics (FIGO) staging was performed according to the FIGO classification.15,51 Histological classification of tissue samples was performed according to the World Health Organization (WHO) criteria (www.iarc.fr/en/.../BB2.pdf), and samples were classified as G1 (well differentiated), G2 (moderately differentiated), or G3 (poorly differentiated). The study design was approved by the Ethics Committees of Xiaolan People’s Hospital, Zhongshan People’s Hospital, and Nanfang Hospital. Written informed consent was obtained from each participant.
Immunohistochemistry
Dewaxed and dehydrated sections were first washed with phosphate-buffered saline (PBS) and then incubated with 3% peroxyl in methanol for 15 minutes to terminate the activity of endogenous peroxidases. The sections were washed with PBS, and antigen retrieval was performed. The sections were immersed into boiled citrate-buffered solution for 10 minutes and blocked with 5% bovine serum albumin in PBS for 20 minutes at room temperature. Thereafter, the sections were probed with primary antibody against ER or PR overnight in a humidified chamber at 4°C. On the following day, sections were incubated with biotinylated anti-Rabbit antibody (Boster Biotechnology Ltd., Wuhan, Hubei, People’s Republic of China) for 30 minutes at room temperature and then coupled with diaminobenzidine to visualize the expression of the targeted proteins. After all sections were counterstained with hematoxylin, they were dehydrated in ascending ethanol and then mounted using neutral resins. Samples with both ER-positive and PR-positive were classified as type I EC, while samples with both ER-negative and PR-negative were classified as type II EC.4,25
Primer design
The sequences of target gene were retrieved from GenBank (http://www.ncbi.nlm.nih.gov/genbank/) and miRBase (http://www.mirbase.org/). The primers were designed using Primer Designer 2.0, and the sequences are shown in Table 2. All primers were synthesized by Beijing Liu He Synthetic Genomics Ltd., Beijing, People’s Republic of China. U6 was used as the internal control.
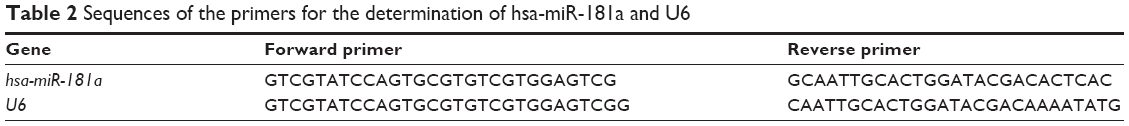 | Table 2 Sequences of the primers for the determination of hsa-miR-181a and U6 |
Total RNA extraction
A series of sections of thickness 10 μm was obtained, and the paraffin was dissolved by xylene treatment. Ten slides were prepared for each sample. Sections with cell content more than 50% of the area were selected for total RNA extraction. Briefly, sections were washed twice with ethanol in a 1.5 mL centrifuge tube to remove residual xylene. Total RNA was extracted, and the purity and integrity of the total RNA were examined using a miRNeasy FFPE kit according to the manufacturer’s instruction. The purity of the total RNA was tested using an ultraviolet (UV) spectrophotometer. The ratio of A260/A280 between 1.8 and 2.1 was considered as high purity. Electrophoresis was performed to detect the RNA integrity in 1.0% agarose denaturing gel.
Quantitative real-time polymerase chain reaction (qRT-PCR) analysis
RNA was reversely transcribed into cDNA, using a RevertAid First Strand cDNA Synthesis Kit (Thermo Fisher Scientific Inc., Waltham, MA, USA) according to the manufacturer’s instruction. The resultant cDNA was subject to qRT-PCR analysis using a Bio-Rad Real-time PCR System (Bio-Rad Laboratories Inc., Hercules, CA, USA) and Syber green PCR mix. The conditions for RT-PCR were 95°C for 6 minutes and then 50 cycles of 95°C for 10 seconds, 55°C for 10 seconds, and 72°C for 30 seconds. The dissolution curve was analyzed to determine the specificity of the real-time PCR amplification. The relative expression level of hsa-miR-181a was calculated by the comparative cycle threshold method, with U6 as the internal reference and expressed as the percentage change relative to untreated controls. Quantification of the relative expression levels of hsa-miR-181a was achieved by the following formula: 2−ΔΔCt, where ΔΔCt equals (Ct of hsa-miR-181a- Ct of U6)experiment minus (Ct of hsa-miR-181a- Ct of U6)control. 2−ΔΔCt was presented as the relative change of hsa-miR-181a expression.
Statistical analysis
Data are expressed as the mean ± standard deviation (SD). Statistical analysis was performed using one-way analysis of variance (ANOVA) followed by Tukey’s multiple comparison to determine statistical significance among multiple groups. Student’s t-test was used to compare the difference between two groups when appropriate. P<0.05 was considered as statistically significant.
Results
Predicted targets of hsa-miR-181a-5p and hsa-miR-181a-3p using various algorithms
Predicted targets of hsa-miR-181a-5p
Using DIANA microT v3.0, hsa-miR-181a-5p was predicted to regulate 522 targets when the threshold was set to 0.7, including ATP1B1, BHLHE40, CLASP1, CREBRF, FBXO33, GLS, KLHL5, LRBA, MAP1B, MTF2, NMT2, PAPD5, REPS2, RLF, SESN3, SLC2A3, SLITRK1, TMEM131, TRIM2, ZFP90, ZNF268, ZNF441, ZNF527, ZNF570, ZNF704, ZNF717, ZNF781, ZNF788, ZNF799, ZNF846, etc (Table 3 and Table S2). Many of these targets regulate a number of important cellular processes, such as cell proliferation, cell death, cell division, mitosis, metabolism of glucose, lipids, nuclear acids, and amino acids, and transport. Among the predicted targets, 30 of the predicted targets (5.74%) were cancer genes, including ABI1, ARID2, ATM, BCL11B, BCL6, CARD11, CCDC6, CHN1, CREB1, GNAQ, HMGA2, LCP1, MAF, MAP2K1, MLLT10, MSI2, NOTCH2, NR4A3, PAX5, PBX1, PHOX2B, PMS1, PRDM1, PTEN, SS18L1, STAG2, TRIM33, WHSC1, WIF1, and XPO1 (Table 3 and Table S2).
 | Table 3 Predicted targets of hsa-miR-181a-5p by various predicting tools |
miRanda-mirSVR predicted that hsa-miR-181a-5p could regulate 7,847 transcripts/targets (Table 3 and Table S3). These included ZNF527, ZNF439, ZNF781, ZNF559, ZNF204P, BAZ2B, ZNF844, C15orf29, FBXO34, C5orf41, KIAA0528, ZNF594, EIF4A2, ZNF833, GATM, ZNF440, MARK1, OSBPL3, AP1G1, GABRA1, DDX3X, etc. Most of these genes regulate a number of important cellular processes, such as cell proliferation, cell death, division, mitosis, metabolism of glucose, lipids, nuclear acids, and amino acids, and transport. Notably, 223 genes from these predicted targets were cancer genes (2.84%) (Table S4). These included ABI1, ABL1, ABL2, AKAP9, AKT2, APC, ARHGEF12, ARID2, ARNT, ATF1, ATM, ATP2B3, ATRX, BAP1, BCL2, BCL6, BCL7A, BCL9, BCOR, BCR, BRCA1, BTG1, C16orf75, CALR, CAMTA1, CANT1, CARD11, CASP8, CBFA2T3, CBL, CBLB, CCDC6, CCNE1, CD274, CDC73, CDH1, CDK6, CDX2, CEBPA, CHCHD7, CHN1, CLTC, CREB1, CREB3L2, CREBBP, CRTC3, CTNNB1, CYLD, DAXX, DDX10, DDX5, DEK, DICER1, DNM2, ECT2L, EGFR, EIF4A2, EML4, EPS15, ERG, ETV1, ETV6, EXT2, EZH2, FAM46C, FANCA, FANCD2, FANCF, FANCG, FAS, FBXO11, FGFR1, FGFR1OP, FGFR2, FGFR3, FLT3, FNBP1, FOXP1, FSTL3, FUS, GAS7, GATA2, GNAS, GOPC, H3F3B, HERPUD1, HEY1, HLF, HMGA2, HNRNPA2B1, HOOK3, HOXA11, HOXC11, HOXC13, IDH1, IGL@, IL2, IL21R, IL6ST, IL7R, IRF4, JAK2, JAZF1, JUN, KCNJ5, KDM5A, KDM5C, KDM6A, KDR, KIAA1549, KLK2, KRAS, LASP1, LCP1, LIFR, LMO1, LPP, MAF, MAFB, MALAT1, MALT1, MAP2K1, MAP2K4, MDM2, MDM4, MDS2, MET, MITF, MKL1, MLF1, MLH1, MLL, MLL3, MLLT10, MLLT3, MLLT4, MLLT6, MN1, MPL, MSH2, MSI2, MYB, MYCN, MYH11, NCOA1, NCOA2, NF1, NF2, NFE2L2, NFIB, NIN, NOTCH2, NPM1, NR4A3, NRAS, NSD1, NT5C2, NUP98, PAFAH1B2, PAX3, PAX5, PAX7, PBRM1, PBX1, PDE4DIP, PDGFRA, PDGFRB, PHF6, PHOX2B, PICALM, PIK3R1, PLAG1, PML, PMS1, PPARG, PRDM1, PTEN, PTPRC, RAC1, RAD21, RALGDS, RANBP17, RAP1GDS1, RB1, RNF43, RPL5, RUNX1, SDC4, SETBP1, SF3B1, SH2B3, SLC34A2, SMARCA4, SMARCE1, SRGAP3, SS18L1, STAT3, SUFU, SUZ12, SYK, TAF15, TAL2, TBL1XR1, TCF7L2, TCL6, TET2, TFRC, TMPRSS2, TOP1, TPM3, TRA@, TRIM27, TRIM33, TRRAP, TSC1, TSHR, U2AF1, UBR5, VTI1A, WHSC1, WIF1, YWHAE, and ZNF521 (Table S4).
miRDB predicted that 1,065 targets/transcripts were possibly regulated by hsa-miR-181a-5p (Table 3 and Table S5). These included PDE5A, ZNF439, PRTG, BRWD1, ZNF549, NFAT5, SH3TC2, OSBPL3, GFPT1, ZNF781, TNPO1, PAPD5, FIGN, S1PR1, TMEM87B, DDX3X, ZNF559, ZNF844, CLMN, GPR26, CTDSPL, ANKRD13C, FUT9, RAB3IP, DLGAP2, BIRC6, ZNF268, C5orf41, PAM, KIAA0528, ARHGEF3, etc. Many of the predicted targets play a role in the regulation of cell proliferation, cell cycle, apoptosis, energy, nuclear acid, and protein metabolism, signaling transduction, and transport. Among these targets, 43 targets were cancer genes (4.04%). These included ABI1, ATF1, ATM, BCL11A, CBLB, CREB1, EIF4A2, ETV6, FAS, FOXP1, GAS7, HLF, HOOK3, HOXA11, IL2, JAZF1, KDM5A, LIFR, LPP, MAP2K1, MAP2K4, MDM4, MET, MLL, MLL3, MLLT10, NCOA2, NFIB, NOTCH2, NR4A3, NRAS, PBX1, PDGFRA, PLAG1, RAD21, SH2B3, TCF7L2, TET2, TFRC, TMPRSS2, VHL, VTI1A, and WIF1 (Table 3 and Table S5).
Using RNA22 v2, 7,028 targets were predicted to be regulated by hsa-miR-181a-5p (Table 3 and Table S6). These included NIPAL3, PAX7, METTL13, FMO1, CLCN6, CLCA1, CLCA1, ATP1A2, KPNA6, SLAMF7, ZZZ3, USH2A, TRIT1, TPR, VPS13D, PER3, COL9A2, HHAT, TNFRSF9, KIF1B, ATP2B4, ZC3H11A, ZC3H11A, TMEM48, TARBP1, DDX20, GNAI3, SPEN, TIE1, IARS2, KCNAB2, TGFBR3, etc. Many of the predicted targets play a role in the regulation of cell proliferation, cell cycle, apoptosis, energy, nuclear acid and protein metabolism, signaling transduction, and transport. Among the predicted targets, 211 genes were cancer genes (3.00%) (Table S7). These included AKAP9, ARHGEF12, ARID2, ARNT, ASXL1, ATM, ATP1A1, ATRX, AXIN1, BAP1, BCL11A, BCL11B, BCL3, BCL6, BCOR, BCR, BLM, BMPR1A, BRAF, BRCA1, BRD4, BTG1, BUB1B, C15orf55, C2orf44, CAMTA1, CARD11, CARS, CBLB, CCND1, CD74, CDH1, CDK4, CHCHD7, CHEK2, CHN1, CIITA, CLTC, COL1A1, CREB1, CREB3L2, CRTC3, CTNNB1, CYLD, DDX5, DICER1, DNM2, DNMT3A, ECT2L, EGFR, ELF4, ELL, ERBB2, ERCC2, ETV5, EXT1, EZH2, FANCA, FANCD2, FBXO11, FBXW7, FGFR1, FGFR1OP, FGFR2, FHIT, FNBP1, FOXP1, GAS7, GATA2, GATA3, GNAQ, GNAS, GOLGA5, GPHN, HERPUD1, HIP1, HMGA1, HMGA2, HRAS, IDH1, IDH2, IL6ST, IL7R, ITK, JAK3, JAZF1, JUN, KCNJ5, KDM5A, KIAA1549, KIT, KRAS, LASP1, LCP1, LIFR, LPP, MAF, MALT1, MAML2, MAP2K1, MAX, MDM2, MDM4, MED12, MITF, MKL1, MLF1, MLH1, MLL, MLL3, MLLT10, MLLT3, MLLT4, MLLT6, MN1, MSH6, MSI2, MSN, MYD88, MYH11, MYST4, NACA, NCOA1, NDRG1, NF1, NF2, NIN, NONO, NOTCH1, NOTCH2, NT5C2, NTRK3, NUP214, NUP98, OLIG2, P2RY8, PAFAH1B2, PALB2, PAX5, PAX7, PBRM1, PBX1, PDE4DIP, PDGFRA, PDGFRB, PER1, PHF6, PHOX2B, PIK3CA, PIK3R1, PLAG1, PML, POU2AF1, PPARG, PRDM16, PTEN, PTPN11, PTPRC, RAD21, RAF1, RALGDS, RANBP17, RET, ROS1, RPN1, SBDS, SDC4, SDHD, SETBP1, SETD2, SFPQ, SLC45A3, SMO, SOX2, SRGAP3, SS18, SS18L1, SSX1, SSX2, SSX4, STAG2, STAT3, SUZ12, TAF15, TAL1, TBL1XR1, TCL1A, TERT, TET2, TFRC, THRAP3, TMPRSS2, TNFAIP3, TNFRSF14, TOP1, TRAF7, TRIM33, TRIP11, TRRAP, TSC1, TSC2, TSHR, UBR5, VHL, WHSC1, WHSC1L1, WRN, WWTR1, ZNF331, ZNF384, and ZNF521 (Table S7).
TargetMiner predicted that 108 targets were regulated by hsa-miR-181a-5p, including GPD2, THRB, DIO2, GABRA4, KITLG, PGR, SMAD5, LDLRAD4, MFAP3L, MTX3, CREB5, KCNMA1, RAB3IP, AP1G1, FOXK1, GK5, CREBZF, CHIC1, PAPD5, CYLD, KDM5A, ACVR2B, LOC124389, CALCR, AFF2, ITGA2, etc (Table 3 and Table S8). Among these predicted targets, five were cancer genes, including CYLD, KDM5A, KRAS, LIFR, and TET2 (4.63%) (Table 3 and Table S8).
TargetScan 6.2 only provided the predicted targets for the precursor hsa-miR-181a. It predicted that hsa-miR-181a could regulate 1,194 transcripts with conserved sites, with a total of 1,412 conserved sites and 626 poorly conserved sites (Table 3 and Table S9). Among these transcripts, 626 were functional genes. These included ZNF780A, PPIP5K2, NUDT12, HOXC8, MARK1, TOM1L1, CLVS1, ZNF563, S1PR1, ZNF568, FLT1, BTBD3, TCERG1, CTDSPL, SLC25A37, DDX3Y, RPS6KB1, METAP1, FGD4, PBMUCL1, CDON, DDX3X, ZFP62, CLMN, TMEM165, PAPD5, ZFP82, CLIP1, SLC7A2, etc. Many of the targets were involved in the regulation of cell proliferation, cell cycle, apoptosis, energy, nuclear acid, and protein metabolism, signaling transduction, and transport. Among the predicted targets, 36 were cancer genes (5.75%). These included ABL2, ARID2, ATP2B3, ATXN1, BCL2, BCL9, BCR, CALR, CBFA2T3, CBLB, CCDC6, CDC73, CEBPA, CREBL2, CYLD, EIF4A2, ERG, FGFR3, H3F3B, HLF, HOXA11, KDM5A, KIAA1549, LMO1, LPP, MAP2K1, NCOA2, NFIB, NOTCH2, PAFAH1B2, PBX1, PRDM1, SH2B3, SS18L1, TCF7L2, and WHSC1 (Table 3 and Table S9).
PicTar only provided predicted targets for the precursor hsa-miR-181a. It predicted that hsa-miR-181a could regulate 510 transcripts with 399 genes, including KIAA0195, OSBPL3, CTDSPL, HIC2, GRIK2, ATXN1, ADAM11, ZBTB4, KIAA0802, FBXO33, PIP3AP, EYA3, CBX7, TARSH, CPEB4, LRRC5, MMP14, RLF, AKAP7, ZIC2, CLASP1, ATP2B2, SEMA4G, YTHDF3, FLJ23548, ALS2CR3, HOXC8, RSN, SOX6, TCERG1, COPEB, etc (Table 3 and Table S10). Many of the predicted targets play a role in the regulation of cell proliferation, cell cycle, apoptosis, energy, nuclear acid, and protein metabolism, signaling transduction, and transport. Among the predicted targets, 23 (5.76%) were cancer genes involved in the initiation, growth, and development and metastasis of cancer, including ATXN1, CARD11, CBFA2T3, CBLB, CHN1, COPEB, CREB1, EIF4A2, ETV6, FOXP1, HLF, HOXA11, JAZF1, KIT, LMO1, MYCN, NCOA2, NR4A3, PDGFRA, PHOX2B, PLAG1, RUNX1, and SS18L1 (Table 3 and Table S10).
MicroCosm Targets v5 predicted that 1,104 targets/transcripts were likely regulated by hsa-miR-181a-5p (Table 3 and Table S11). These included NR6A1, TMEM64, TMED8, TMED4, TADA1L, ZNF17, ZNF487, SLC3A1, CARD11, DOCK7, SLC10A7, THBS4, E2F5, PRDX3, PLCL2, RGMA, DHX29, FAM58A, DMRT3, MAB21L1, C19orf59, TGFBRAP1, DEPDC6, CARM1, WDR45L, MDH1B, etc. Among the predicted targets, 37 (3.35%) were cancer genes, including AKAP9, BCL11A, C16orf75, CAGE1, CARD11, CSF3R, EIF4A2, EXT2, FANCE, FAS, FGFR2, FOS, FOXP1, FVT1, HOOK3, IDH1, IL2, LMO1, MLF1, MRAS, MYBL1, PALB2, PHOX2B, RAB38, RALA, RASGRP4, RASIP1, RASSF1, RASSF6, SSX1, SSX2, STAG2, TAF15, TSG101, TUSC3, WIF1, and ZNF521 (Table 3 and Table S11).
These results showed that the number of predicted targets of hsa-miR-181a-5p by the eight algorithms was very different, ranging from 108 to 7,847, with a mean of 2,424. Most of the predicted targets are involved in the regulation of cell proliferation, cell division, cell apoptosis, energy metabolism, amino acid, and nucleic acid metabolism, and transport, inflammation, redox homeostasis, and stress response. Many of the predicted targets are cancer genes, which participate in cancer initiation, development, growth, and metastasis. These cancer genes, including tumor suppressor genes and oncogenes, act as drivers or passengers in tumorigenesis. They are involved in various aspects of functions implicated in cancer initiation, development, and metastasis, including control of cell proliferation, apoptosis, signal transduction, transcription regulation, immunity, and defense.
Predicted targets of hsa-miR-181a-3p
Using DIANA microT v3.0, hsa-miR-181a-3p was predicted to regulate 249 transcripts/targets when the threshold was set at 0.45 (Table 4 and Table S12). These included ETV1, GGCT, ODZ1, NUB1, CPS1, AGPAT4, TRIO, LMO3, COL9A2, ELN, HEBP2, CYFIP2, MCOLN3, RC3H2, FLYWCH1, COL11A1, MRPS35, DGKA, LAPTM4A, IFT80, CLEC2D, AFF4, MARK2, SENP1, STX7, PDS5B, NKAIN1, PSMC5, SLC26A4, etc. Among these targets, 15 were cancer genes (6.12%), including ASPSCR1, BCL11A, CACNA1D, CCND2, ELN, ETV1, EZH2, GATA3, HIP1, HRAS, MSI2, PIM1, TSHR, USP6, and WIF1 (Table 4 and Table S12).
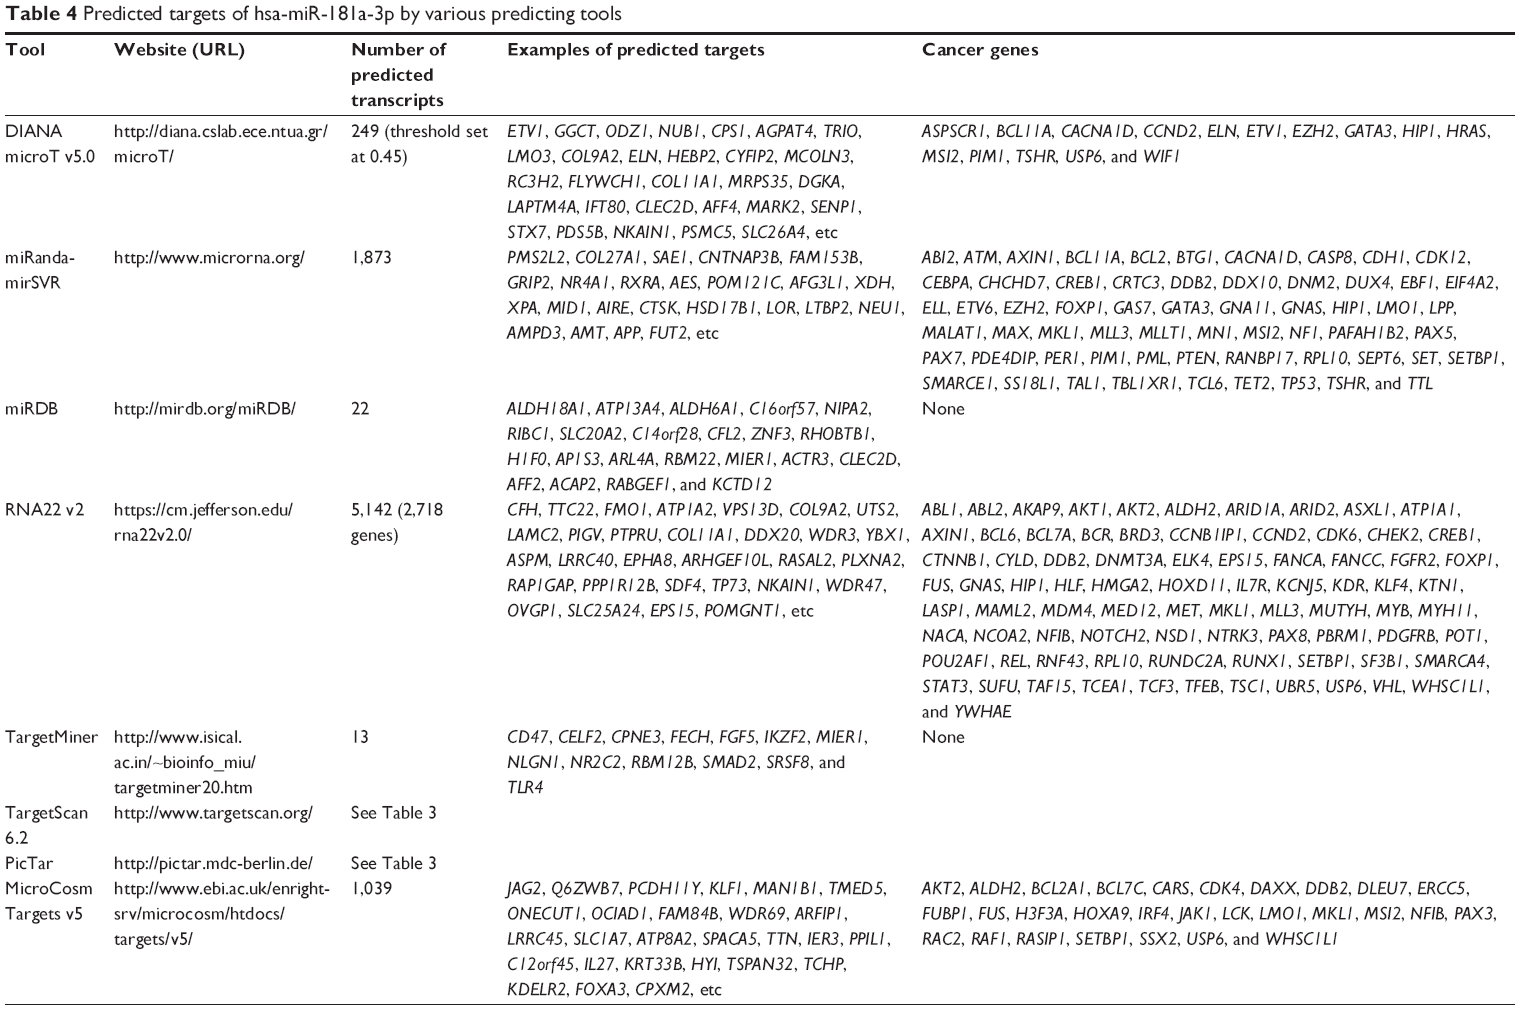 | Table 4 Predicted targets of hsa-miR-181a-3p by various predicting tools |
miRanda-mirSVR predicted that hsa-miR-181a-3p could regulate 1,873 targets (Table 4 and Table S13). These genes included PMS2L2, COL27A1, SAE1, CNTNAP3B, FAM153B, GRIP2, NR4A1, RXRA, AES, POM121C, AFG3L1, XDH, XPA, MID1, AIRE, CTSK, HSD17B1, LOR, LTBP2, NEU1, AMPD3, AMT, APP, FUT2, etc. Most of these genes regulate a number of important cellular processes, such as cell proliferation, cell death, division, mitosis, metabolism of glucose, lipids, nuclear acids, and amino acids, and transport. Among the predicted targets, 61 were cancer genes (3.26%). These included ABI2, ATM, AXIN1, BCL11A, BCL2, BTG1, CACNA1D, CASP8, CDH1, CDK12, CEBPA, CHCHD7, CREB1, CRTC3, DDB2, DDX10, DNM2, DUX4, EBF1, EIF4A2, ELL, ETV6, EZH2, FOXP1, GAS7, GATA3, GNA11, GNAS, HIP1, LMO1, LPP, MALAT1, MAX, MKL1, MLL3, MLLT1, MN1, MSI2, NF1, PAFAH1B2, PAX5, PAX7, PDE4DIP, PER1, PIM1, PML, PTEN, RANBP17, RPL10, SEPT6, SET, SETBP1, SMARCE1, SS18L1, TAL1, TBL1XR1, TCL6, TET2, TP53, TSHR, and TTL (Table 4 and Table S14).
miRDB predicted that 22 targets were possibly regulated by hsa-miR-181a-3p (Table 4 and Table S15). These included ALDH18A1, ATP13A4, ALDH6A1, C16orf57, NIPA2, RIBC1, SLC20A2, C14orf28, CFL2, ZNF3, RHOBTB1, H1F0, AP1S3, ARL4A, RBM22, MIER1, ACTR3, CLEC2D, AFF2, ACAP2, RABGEF1, and KCTD12. These targets play a role in the regulation of cell proliferation, cell cycle, apoptosis, energy, nuclear acid, and protein metabolism, signaling transduction, and transport. However, none of the predicted targets were cancer genes.
Using RNA22 v2, 5,142 transcripts/2,718 genes were predicted to be regulated by hsa-miR-181a-3p (Table 4 and Table S16). These included CFH, TTC22, FMO1, ATP1A2, VPS13D, COL9A2, UTS2, LAMC2, PIGV, PTPRU, COL11A1, DDX20, WDR3, YBX1, ASPM, LRRC40, EPHA8, ARHGEF10L, RASAL2, PLXNA2, RAP1GAP, PPP1R12B, SDF4, TP73, NKAIN1, WDR47, OVGP1, SLC25A24, EPS15, POMGNT1, etc. Many of the predicted targets play a role in the regulation of cell proliferation, cell cycle, apoptosis, energy, nuclear acid, and protein metabolism, signaling transduction, and transport. Among these targets, 82 were cancer genes (3.02%), including ABL1, ABL2, AKAP9, AKT1, AKT2, ALDH2, ARID1A, ARID2, ASXL1, ATP1A1, AXIN1, BCL6, BCL7A, BCR, BRD3, CCNB1IP1, CCND2, CDK6, CHEK2, CREB1, CTNNB1, CYLD, DDB2, DNMT3A, ELK4, EPS15, FANCA, FANCC, FGFR2, FOXP1, FUS, GNAS, HIP1, HLF, HMGA2, HOXD11, IL7R, KCNJ5, KDR, KLF4, KTN1, LASP1, MAML2, MDM4, MED12, MET, MKL1, MLL3, MUTYH, MYB, MYH11, NACA, NCOA2, NFIB, NOTCH2, NSD1, NTRK3, PAX8, PBRM1, PDGFRB, POT1, POU2AF1, REL, RNF43, RPL10, RUNDC2A, RUNX1, SETBP1, SF3B1, SMARCA4, STAT3, SUFU, TAF15, TCEA1, TCF3, TFEB, TSC1, UBR5, USP6, VHL, WHSC1L1, and YWHAE (Table 4 and Table S16).
TargetMiner predicted that 13 targets were regulated by hsa-miR-181a-3p, including CD47, CELF2, CPNE3, FECH, FGF5, IKZF2, MIER1, NLGN1, NR2C2, RBM12B, SMAD2, SRSF8, and TLR4 (Table 4 and Table S17). None of the predicted targets was a cancer gene.
TargetScan 6.2 predicted that hsa-miR-181a could regulate 626 targets (Tables 3 and 4). In PicTar, only hsa-miR-181a could be searched. It probably regulated 510 transcripts with 399 genes (Tables 3 and 4).
MicroCosm Targets v5 predicted that 1,039 targets were likely regulated by hsa-miR-181a-3p (Table 4 and Table S18). These included JAG2, Q6ZWB7, PCDH11Y, KLF1, MAN1B1, TMED5, ONECUT1, OCIAD1, FAM84B, WDR69, ARFIP1, LRRC45, SLC1A7, ATP8A2, SPACA5, TTN, IER3, PPIL1, C12orf45, IL27, KRT33B, HYI, TSPAN32, TCHP, KDELR2, FOXA3, CPXM2, etc. Among the predicted targets, 29 were cancer genes (2.79%), including AKT2, ALDH2, BCL2A1, BCL7C, CARS, CDK4, DAXX, DDB2, DLEU7, ERCC5, FUBP1, FUS, H3F3A, HOXA9, IRF4, JAK1, LCK, LMO1, MKL1, MSI2, NFIB, PAX3, RAC2, RAF1, RASIP1, SETBP1, SSX2, USP6, and WHSC1L1 (Table 4 and Table S18).
These results demonstrated that the number of predicted targets of hsa-miR-181a-3p by the eight tools was very different, ranging from 13 to 5,142, with a mean of 1,184. Most of the predicted targets are involved in the regulation of cell proliferation, cell division, cell apoptosis, energy metabolism, amino acid and nucleic acid metabolism, and transport, inflammation, redox homeostasis, and stress response. Many of the predicted targets are cancer genes which participate in cancer initiation, development, growth, and metastasis.
Predicted targets of hsa-miR-181a by miRWALK
miRWALK provides information on predicted targets from ten algorithms. When only miRWALK was chosen, where only one longest binding site was set per miRNA per mRNA, 3,762 transcripts were predicted to be regulated by hsa-miR-181a (Table S19). These included AASS, ABCB11, ACN9, ACTA2, ADAM28, BAG2, BCL11A, BCL6B, BTRC, CARD11, CCR3, CDK8, CDKN3, CIT, CNOT1, DAD1, DCN, DKC1, DR1, EHF, ESCO2, FBN2, FUT1, GALNT3, GCS1, GPC5, HK2, HSPB3, IL2, IL25, IVD, KCNG3, KIF2C, LACE1, MAEL, MAOA, MLL5, NCL, NOVA1, OCA2, PAG1, PROCR, RAD21, RFC3, RNF6, SELT, SIX2, TAF15, etc. Among these transcripts, 1,436 were functional genes (Table S20).
miRWALK also provided a summarized table that included all targets predicted to be regulated by hsa-miR-181a by the ten algorithms. In total, there were 17,395 transcripts that would be regulated by hsa-miR-181a (Table S21). Only 24 genes were predicted to be the targets of hsa-miR-181a by all the algorithms or at least nine algorithms. These included RNF145, TCERG1, SIRT1, SS18L1, NR6A1, FOXP1, GLS, HOXA11, SMAD7, MAP1B, INOC1, CDKN2AIP, LRRN1, TGFBI, YWHAG, C17orf39, CHD9, NAT13, C6orf62, ACVR2A, DCLK1, NMT2, NPEPPS, and KIAA0195. There were 102 targets that were predicted to be regulated by hsa-miR-181a by eight algorithms, including CDH13, PDIA6, IPO8, IGF2BP2, SLITRK1, SSX2IP, COL16A1, ADM, ZNF800, ADAMTS18, DPYSL2, E2F5, EIF4A2, EN2, ETV6, ACSL1, FBN2, C7orf41, FKBP1A, BTBD3, KIAA0423, HIC2, KANK1, HISPPD1, SYNE1, ZNF281, FOS, LEMD3, BRD1, OSBPL3, EPC2, GAPVD1, GATA6, NPTN, ATP11C, KLF15, LRP12, BAZ2B, HLF, HOXA1, ID4, JARID2, KPNA1, etc. There were 191, 778, 1,615, and 3,168 targets that were predicted to be regulated by hsa-miR-181a by seven, six, five, and four algorithms, respectively.
Validated targets of hsa-miR-181a-5p based on TarBase
Based on TarBase, 211 targets of hsa-miR-181a-5p have been validated with experimental evidence (Table 5). These included ACOT12, ALG10B, AMMECR1, ANKRD1, ANKRD13C, ARF6, ARHGAP11A, ARL6IP1, ARL6IP6, ATF7IP2, ATG10, ATM, ATP6V0E1, BAG2, BCL2, BDNF, BPGM, BRIX1, BRMS1L, BTBD3, C1orf109, C1orf43, C1QTNF9, C8A, CBX3, CCDC6, CCDC82, CCND1, CCNG1, etc. Among these validated targets, only eleven of them are cancer genes (5.21%), including ATM, BCL2, CCDC6, CCND1, CDX2, EP300, HOXA11, KRAS, PLAG1, TAF15, and TSHR.
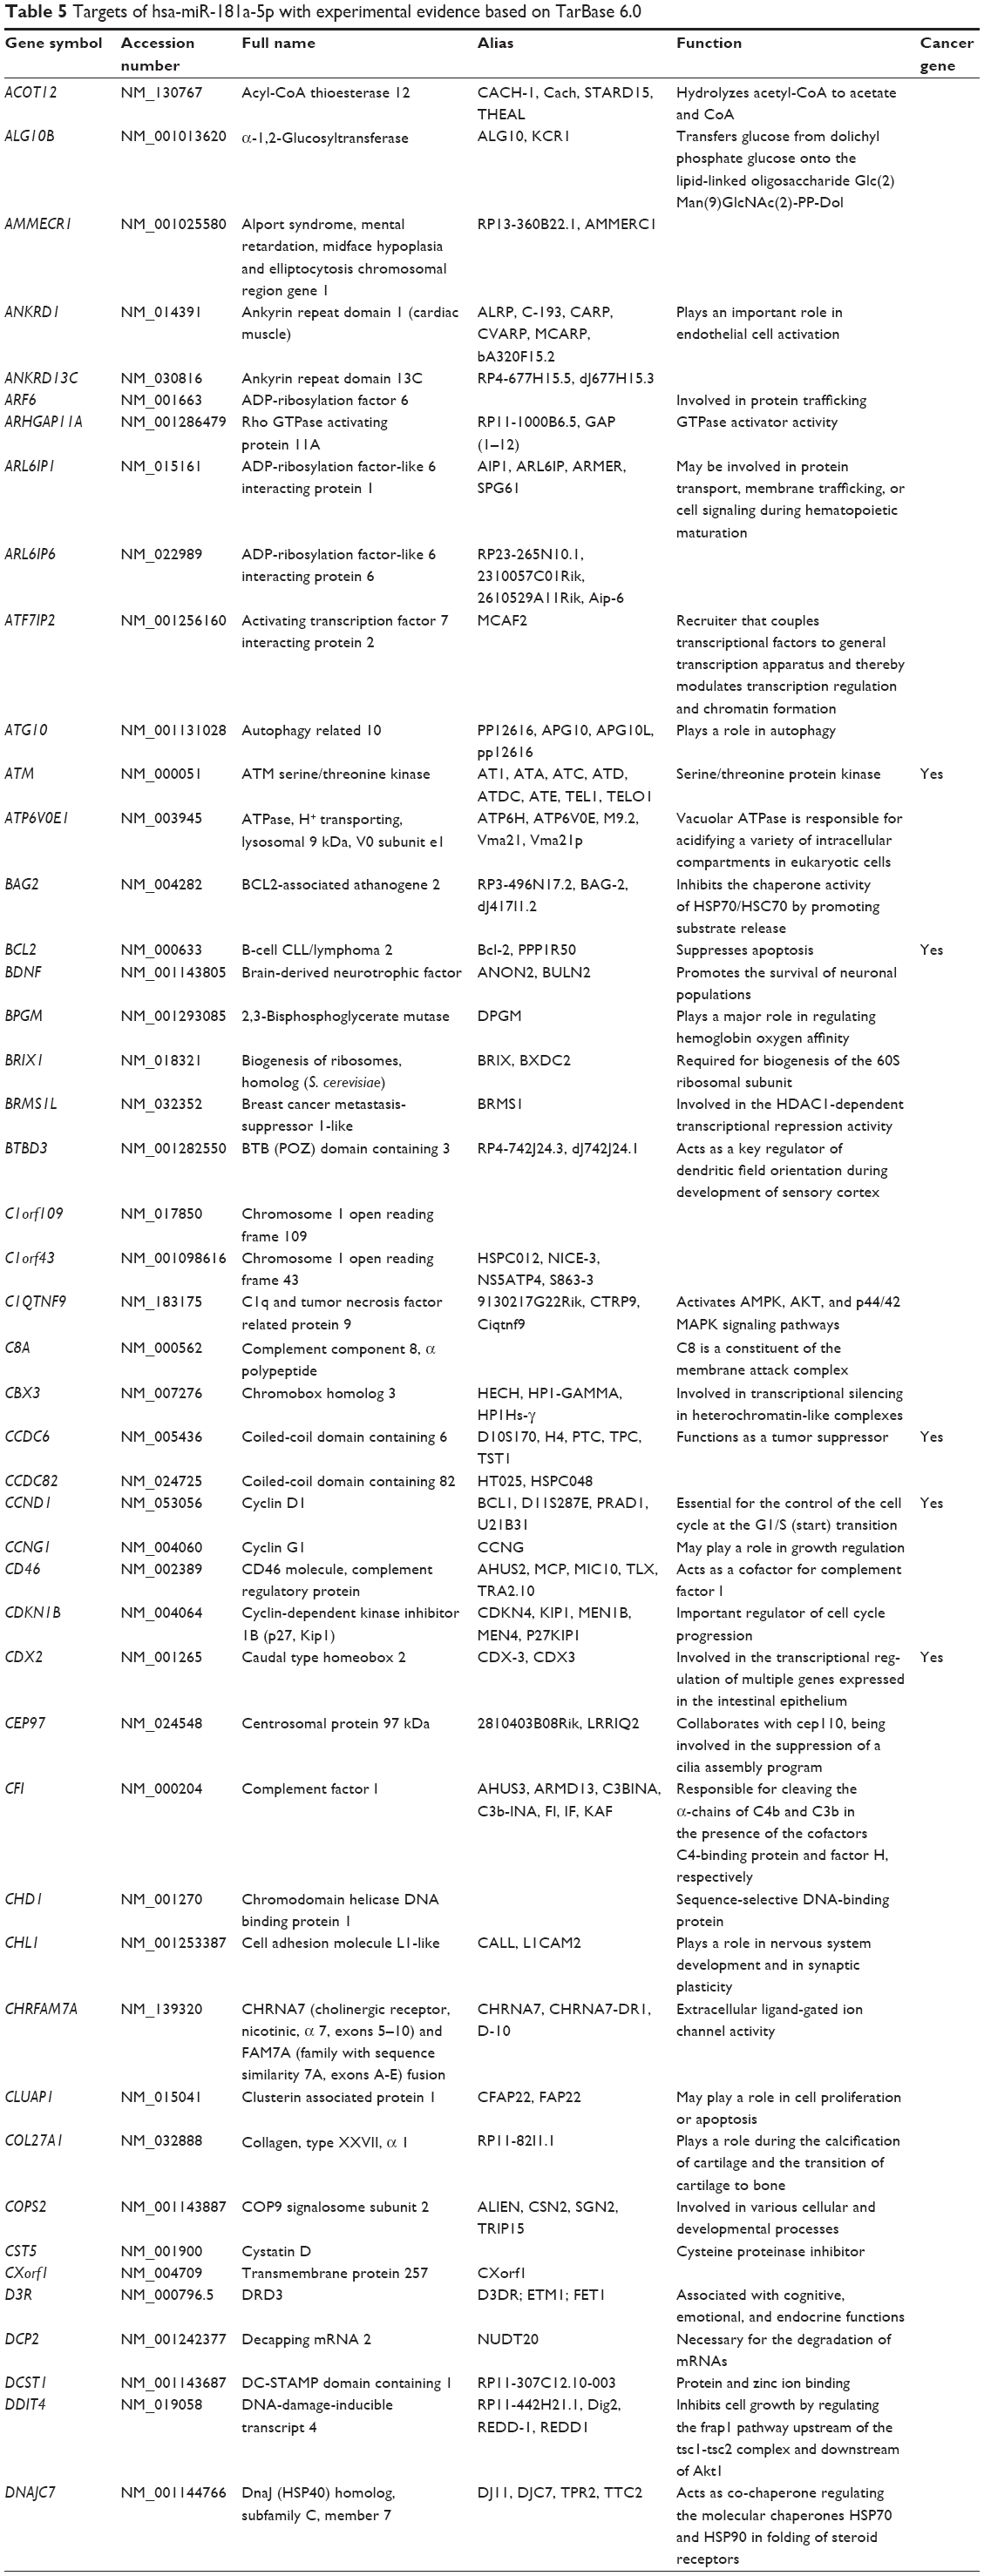 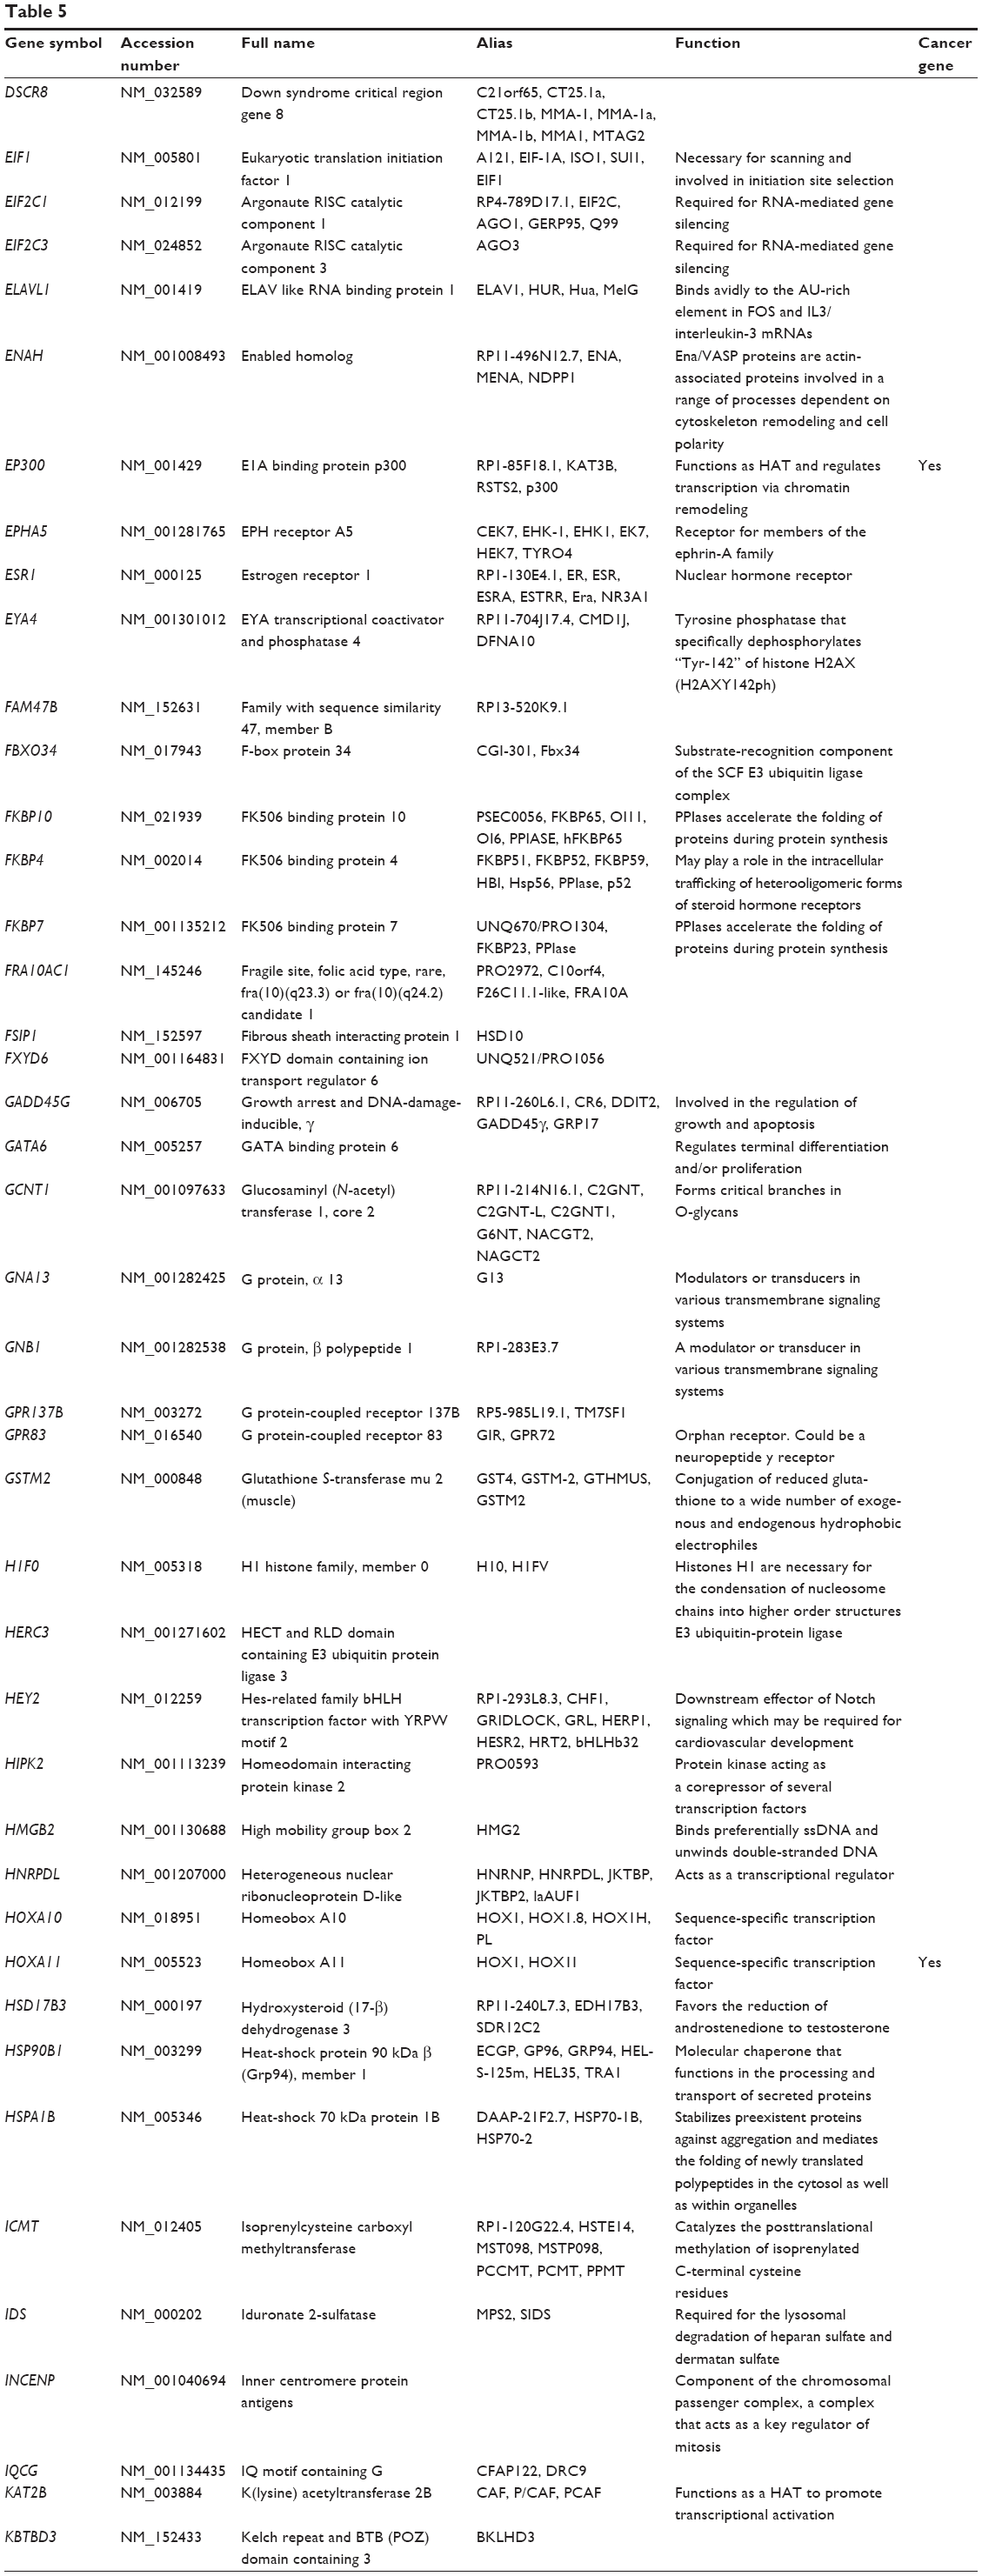 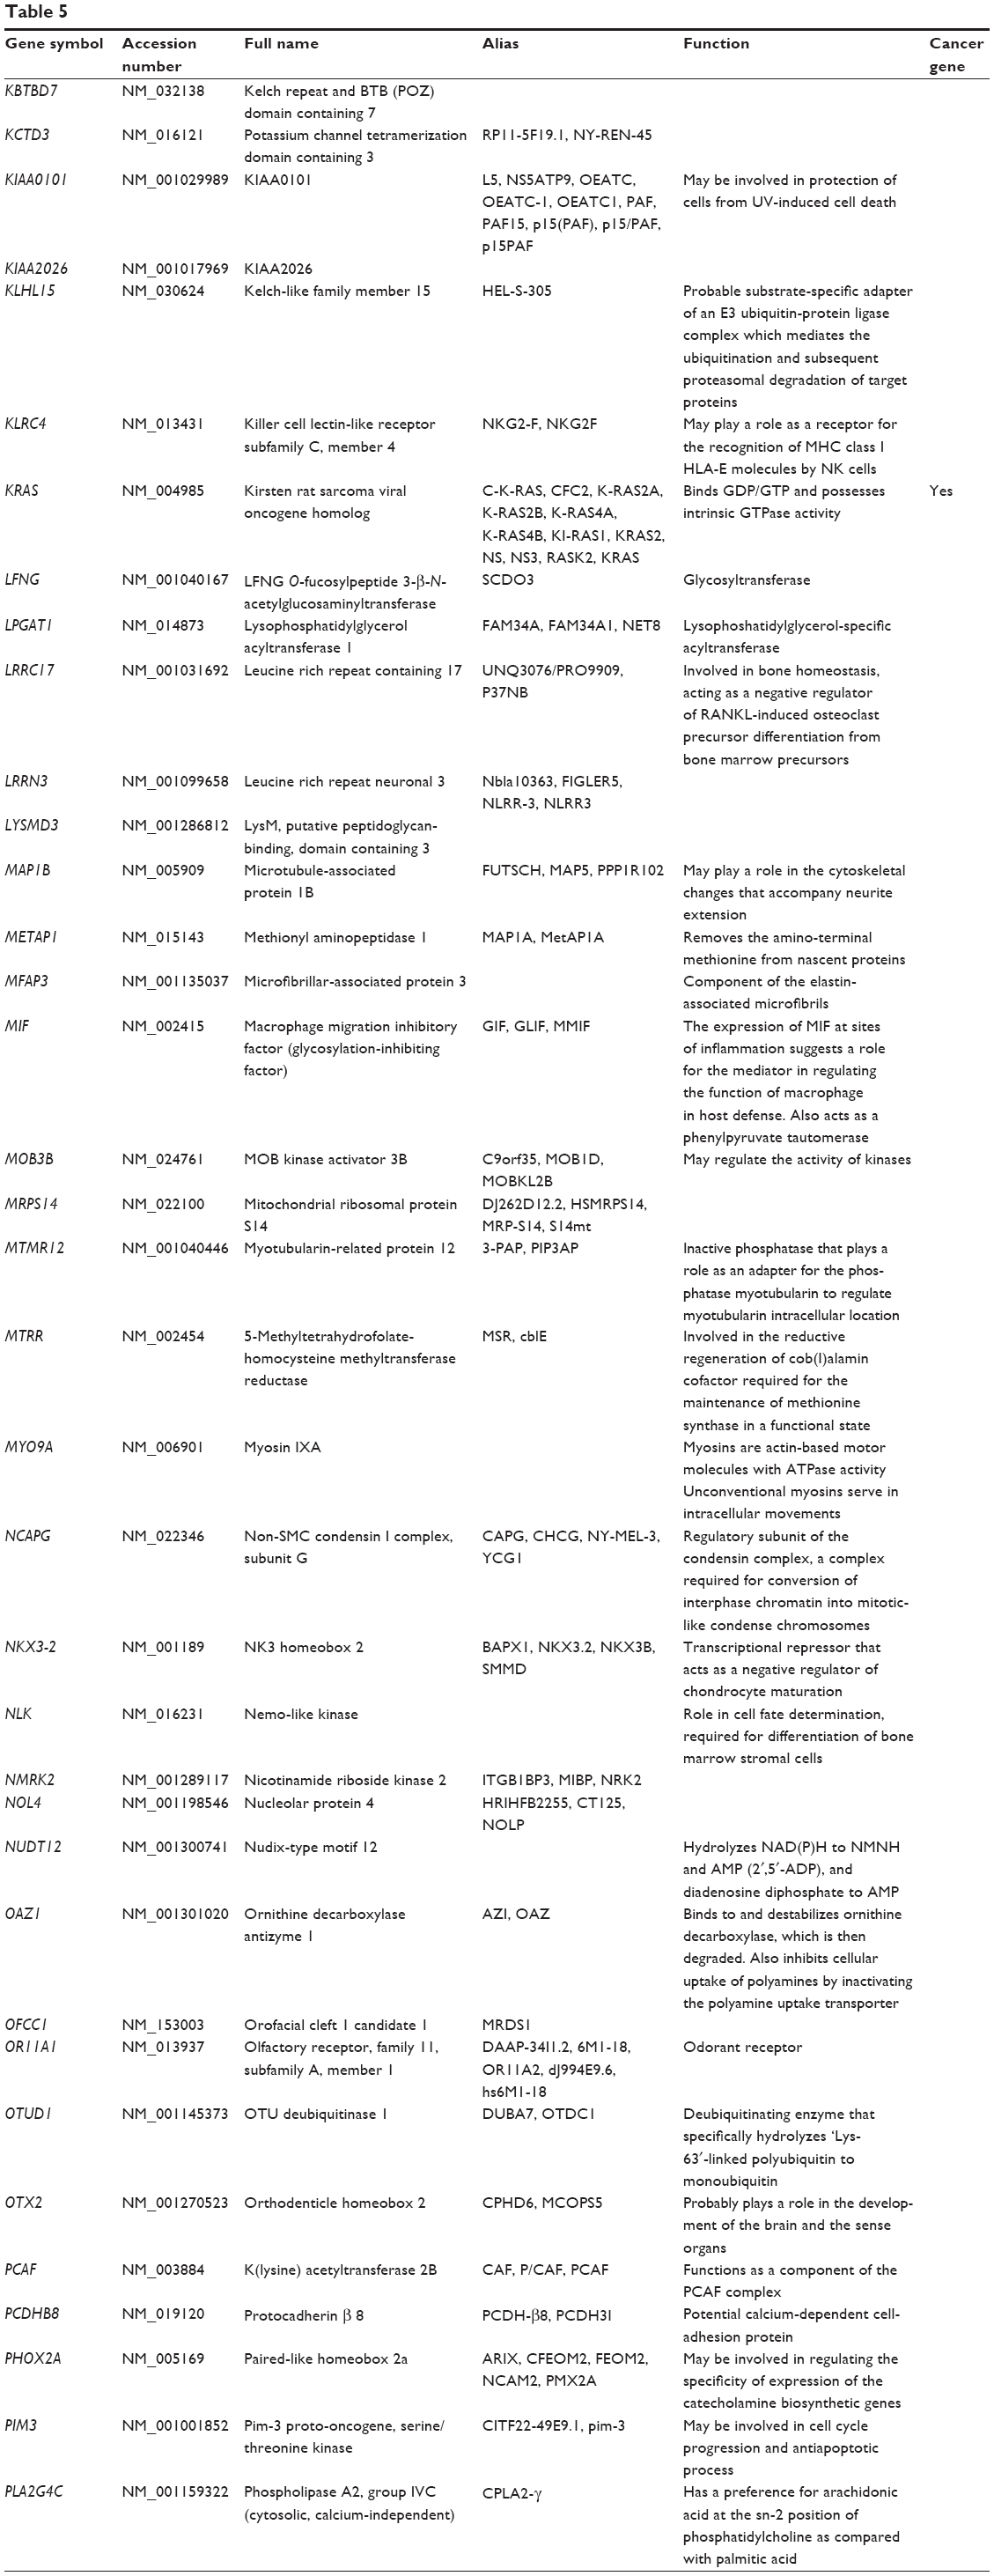 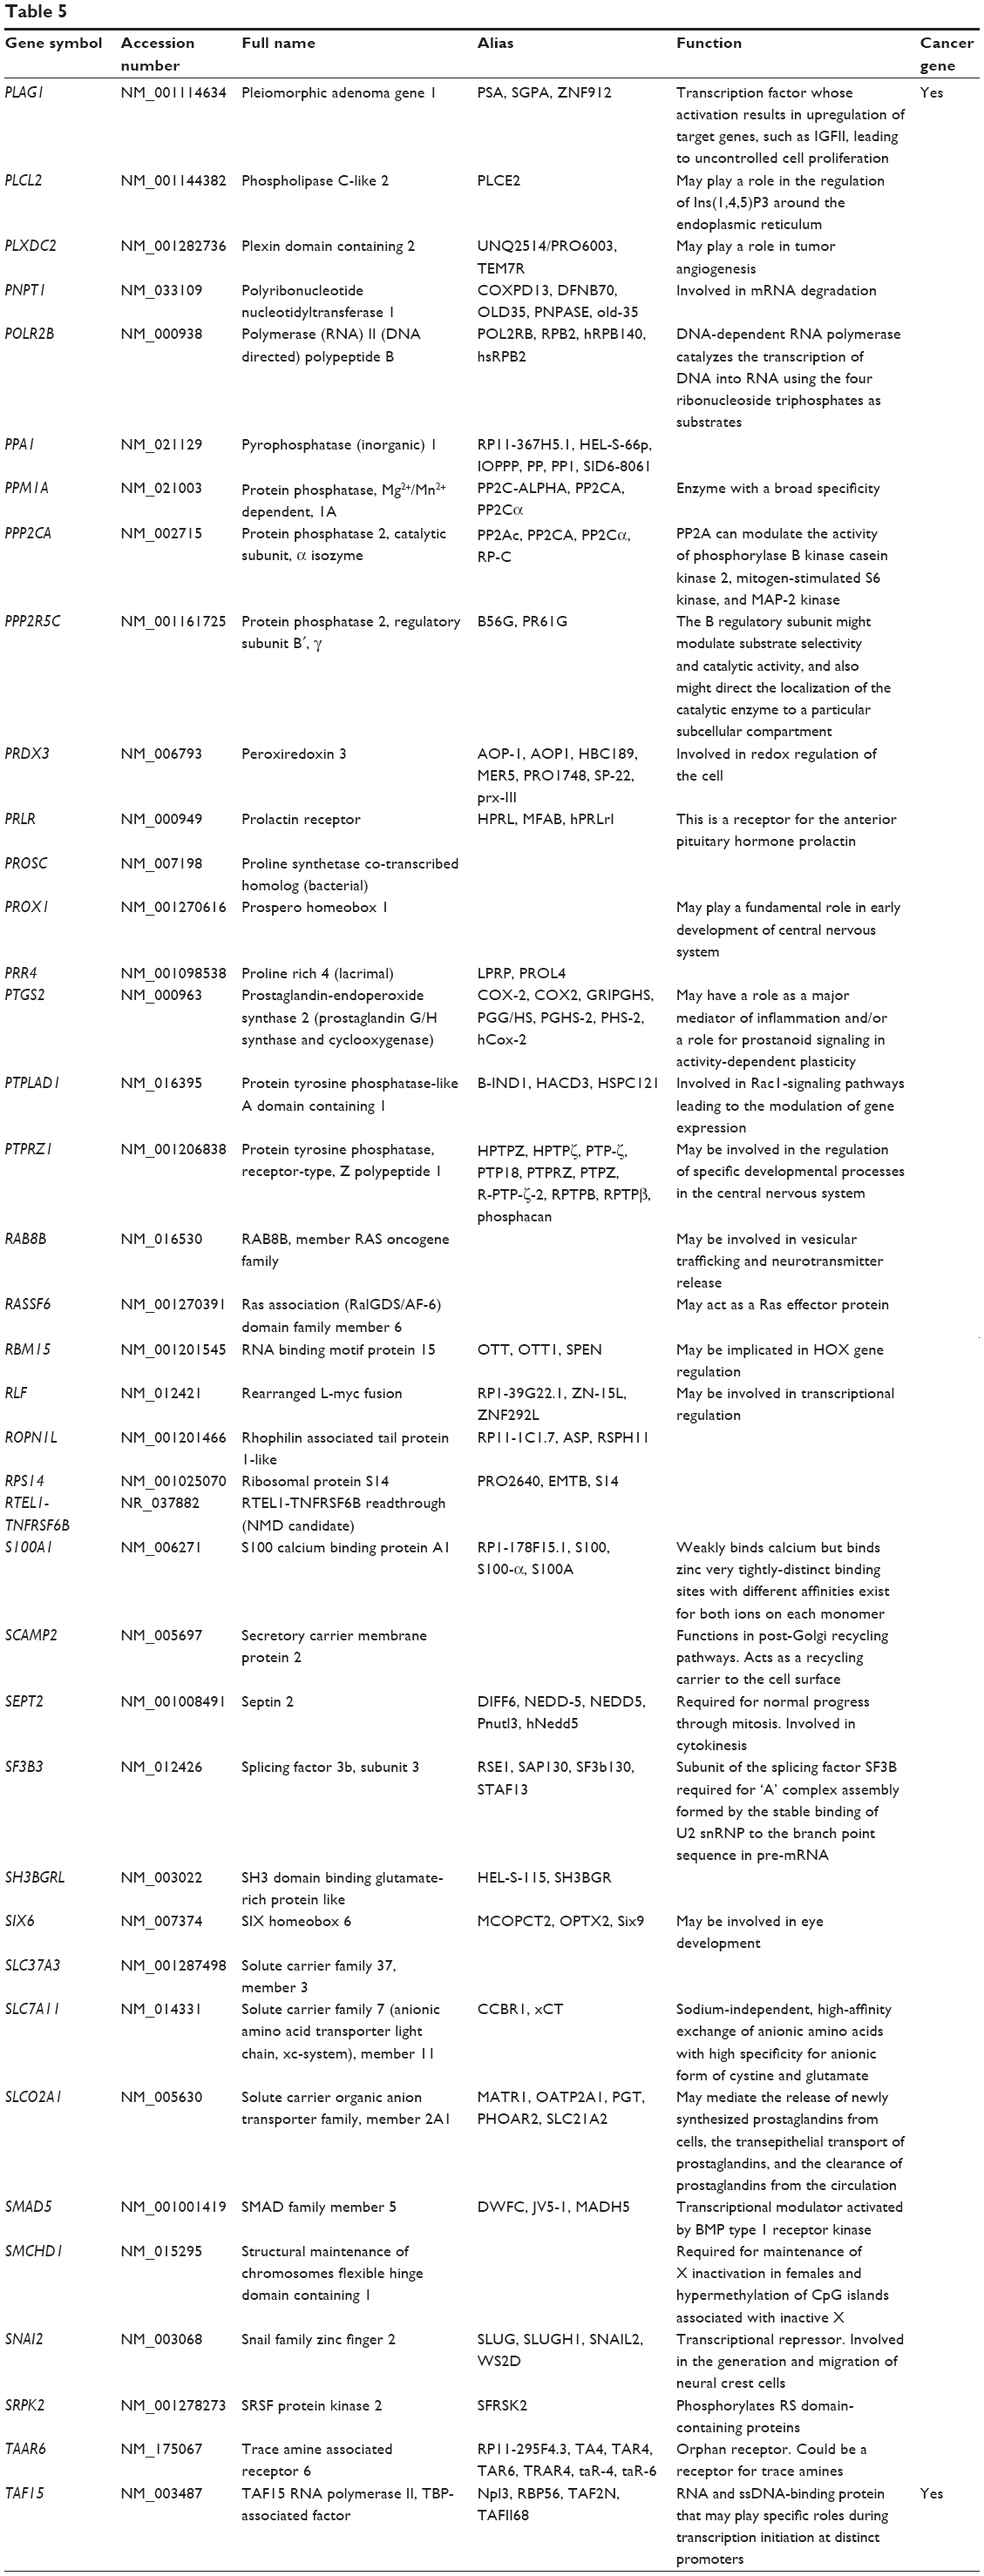 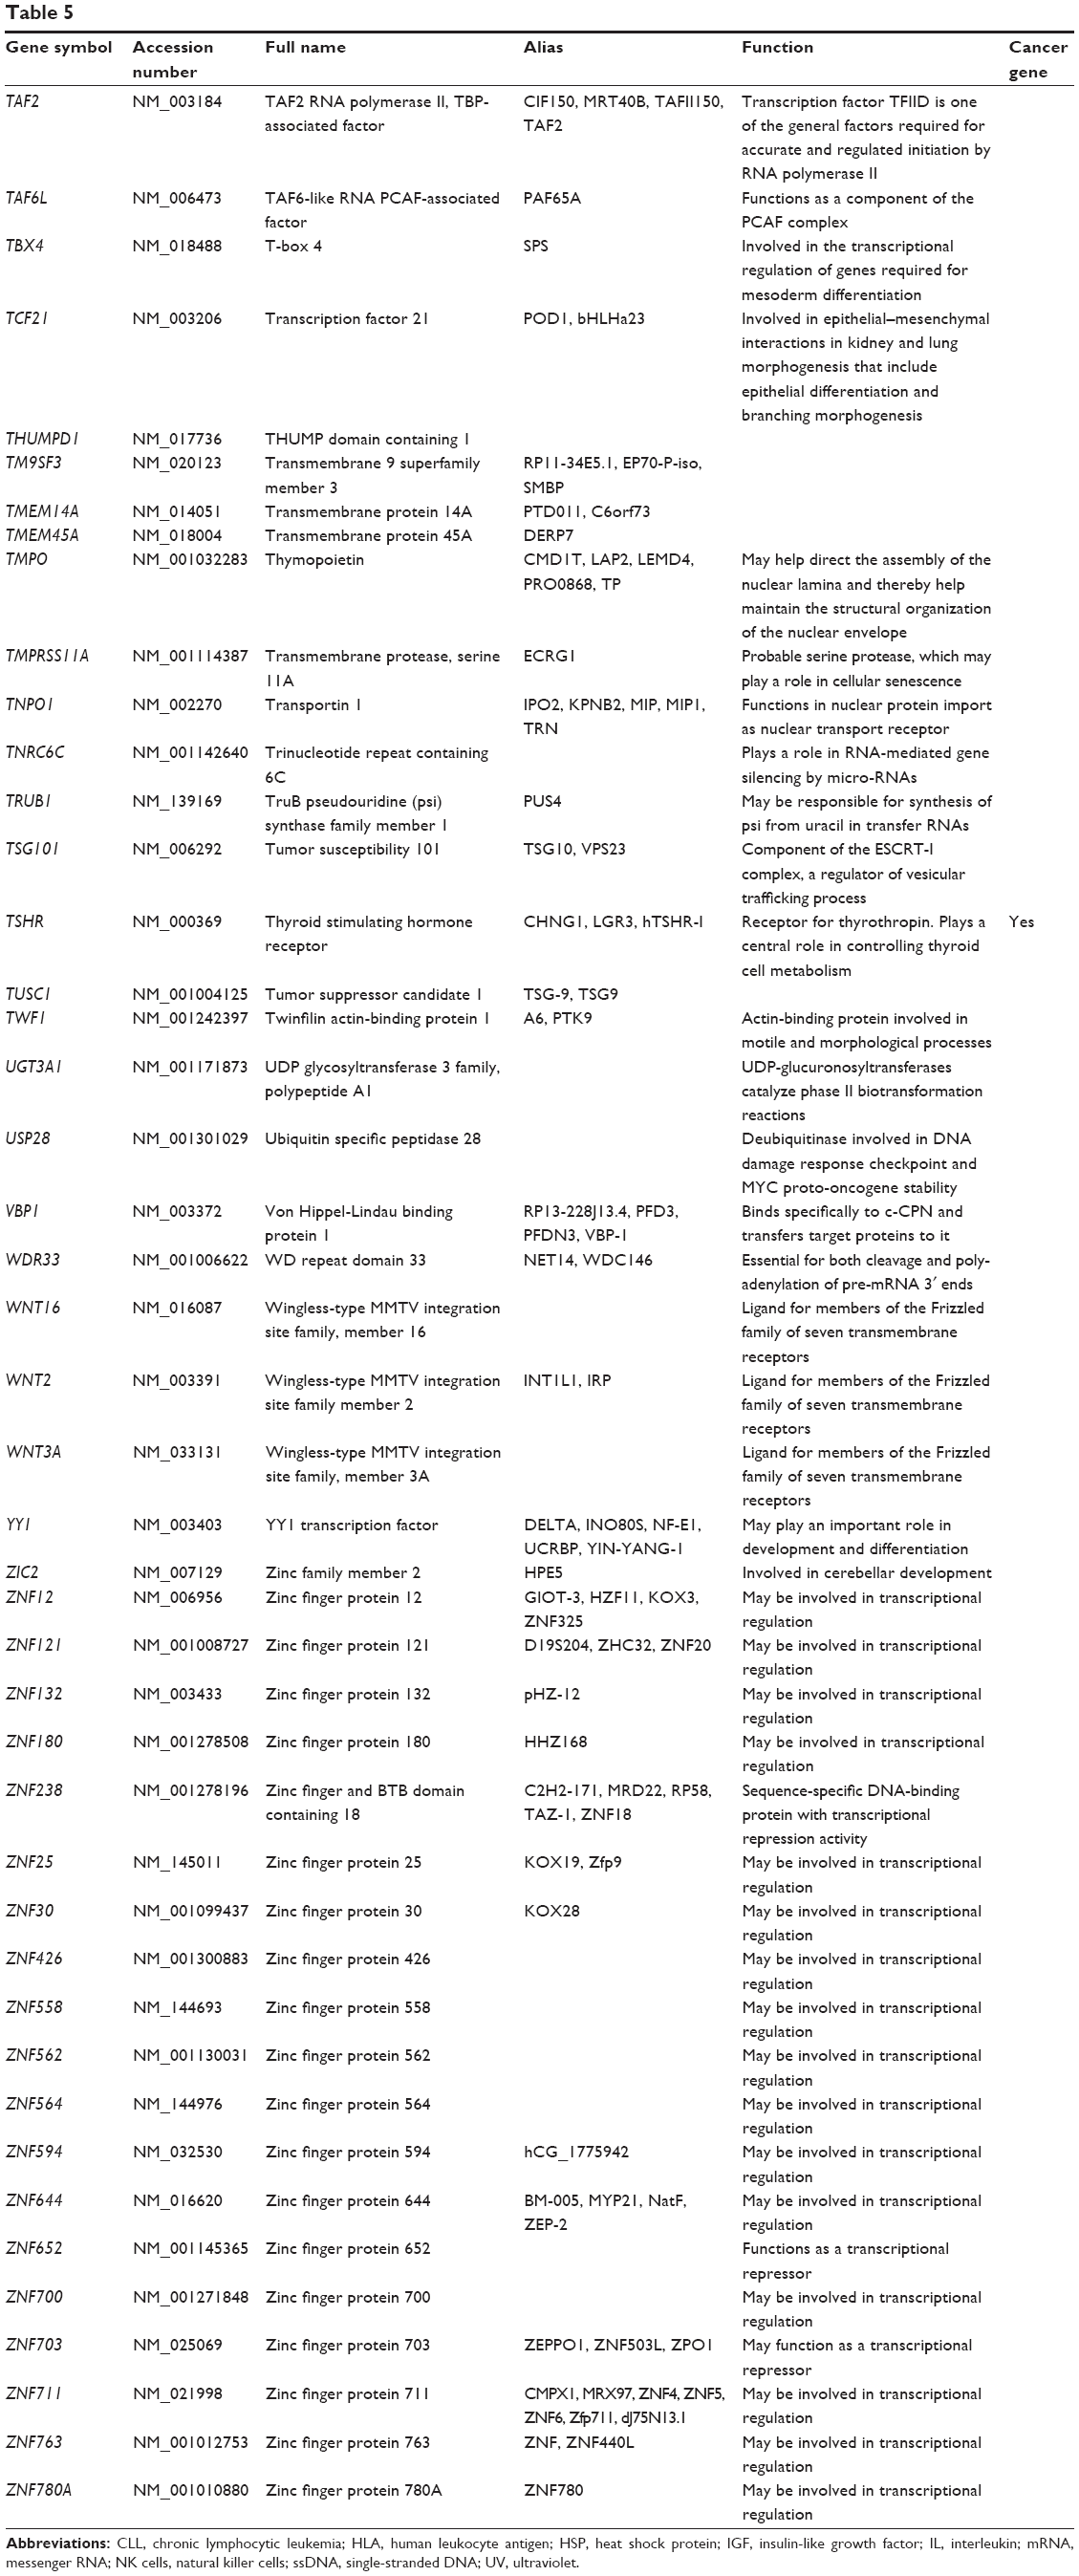 | Table 5 Targets of hsa-miR-181a-5p with experimental evidence based on TarBase 6.0 |
As shown in Table 6, our DAVID analysis showed that there were 16 functional clusters that were identified to be enriched with an enrichment score >1.0 in the target list of hsa-miR-181a-5p, based on TarBase. The functions of these clusters involved negative regulation of macromolecule biosynthetic process, negative regulation of the cellular biosynthetic process, negative regulation of biosynthetic process, negative regulation of apoptosis, negative regulation of programmed cell death, negative regulation of cell death, negative regulation of transcription, negative regulation of nucleobase, nucleoside, nucleotide, and nucleic acid metabolic processes, negative regulation of nitrogen compound metabolic process, and lung and respiratory tube development, positive regulation of protein polymerization, positive regulation of protein complex assembly, positive regulation of protein polymerization, and positive regulation of protein complex assembly.
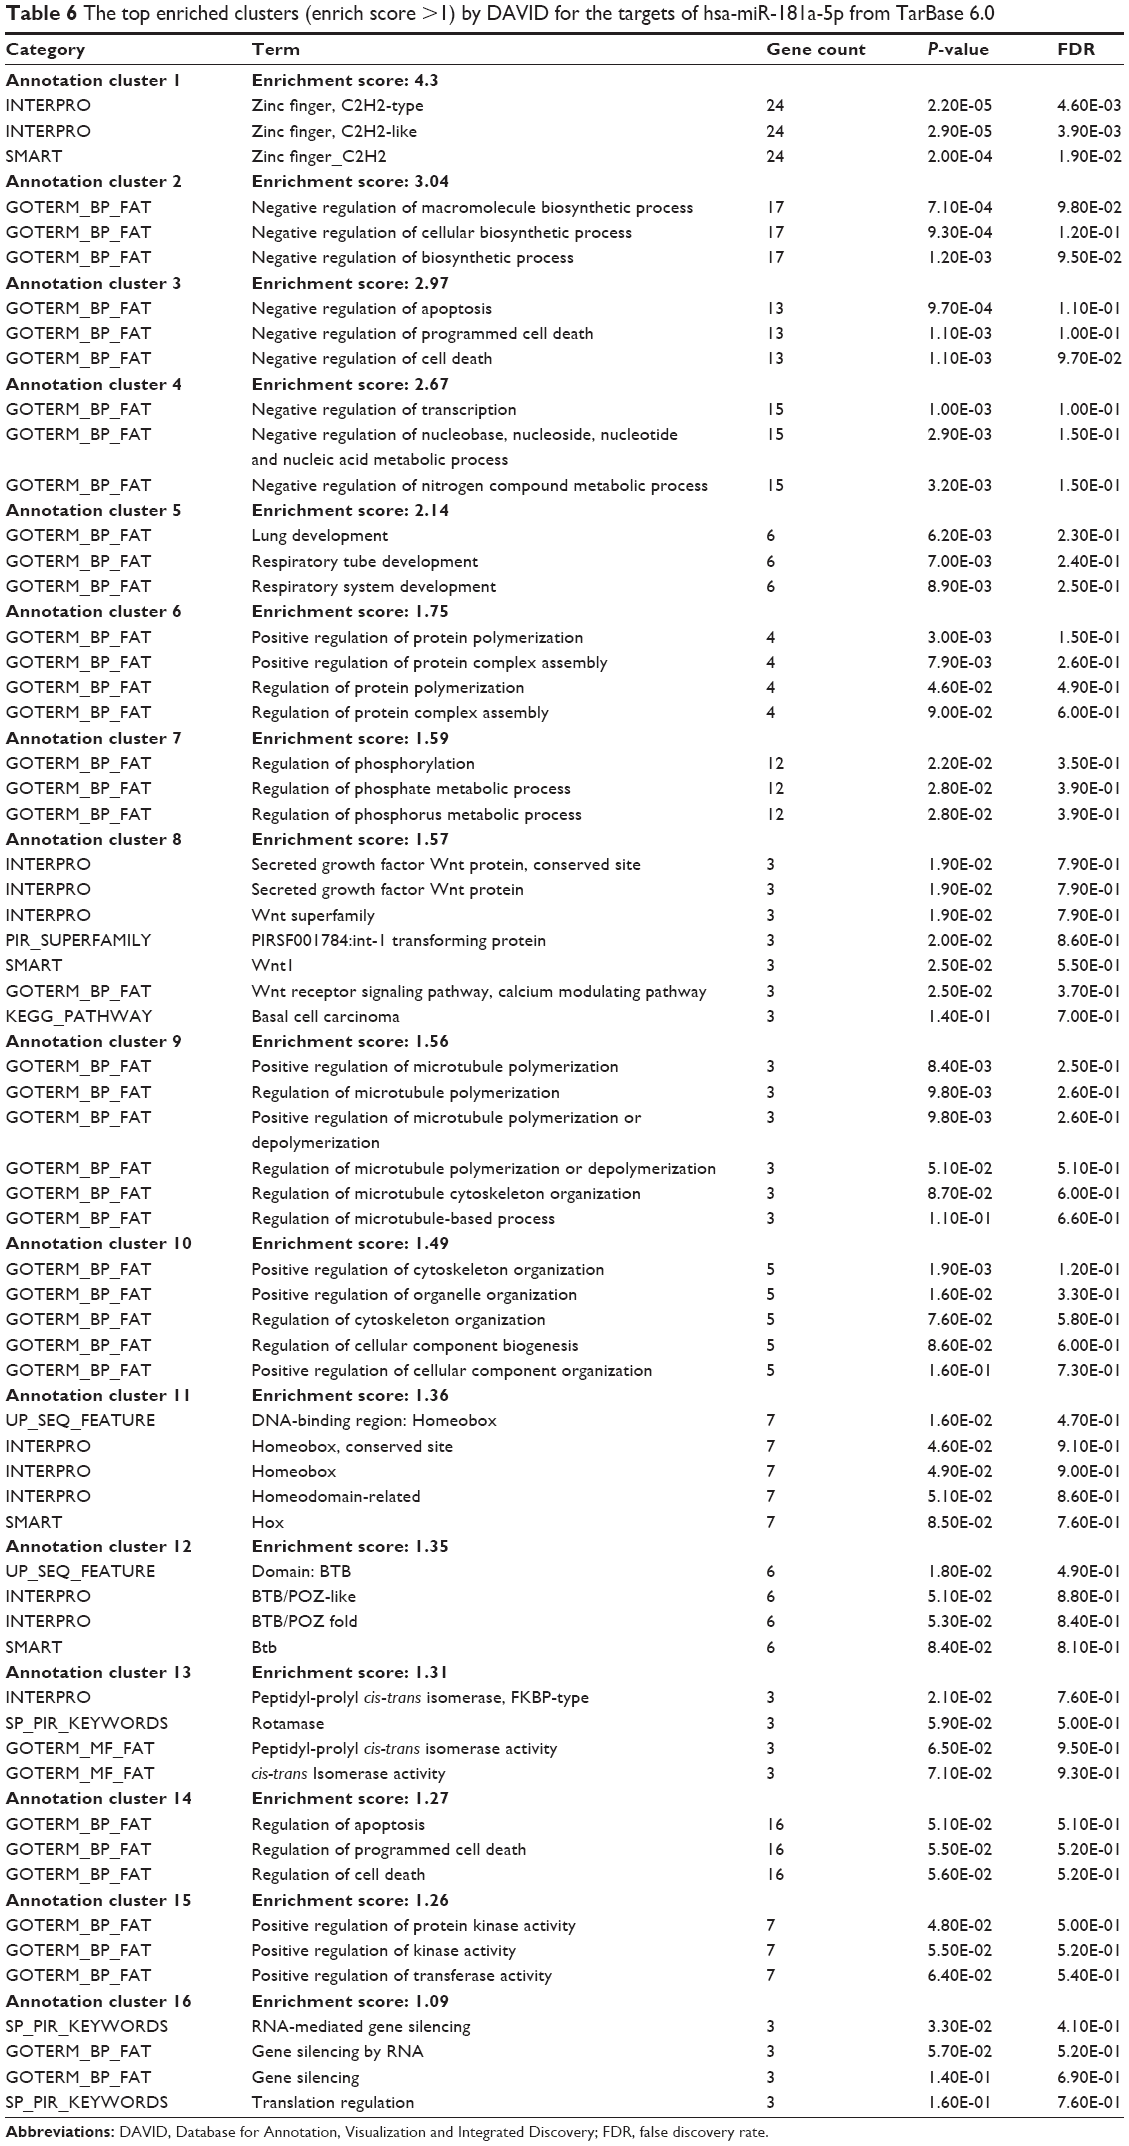 | Table 6 The top enriched clusters (enrich score >1) by DAVID for the targets of hsa-miR-181a-5p from TarBase 6.0 |
Furthermore, our DAVID analysis revealed that there were nine KEGG pathways significantly enriched in the target list of hsa-miR-181a-5p, based on TarBase (Table 7). These pathways included pathways in cancer pathways (Figure 1), the Wnt signaling pathway (Figure 2), prostate cancer, melanogenesis, cell cycle (Figure 3), hedgehog signaling pathway, p53 signaling pathway (Figure 4), small cell lung cancer, and thyroid cancer.
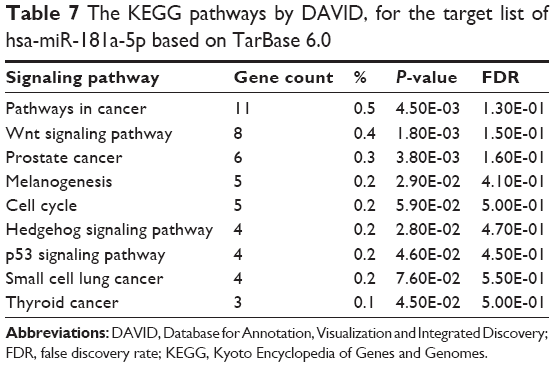 | Table 7 The KEGG pathways by DAVID, for the target list of hsa-miR-181a-5p based on TarBase 6.0 |
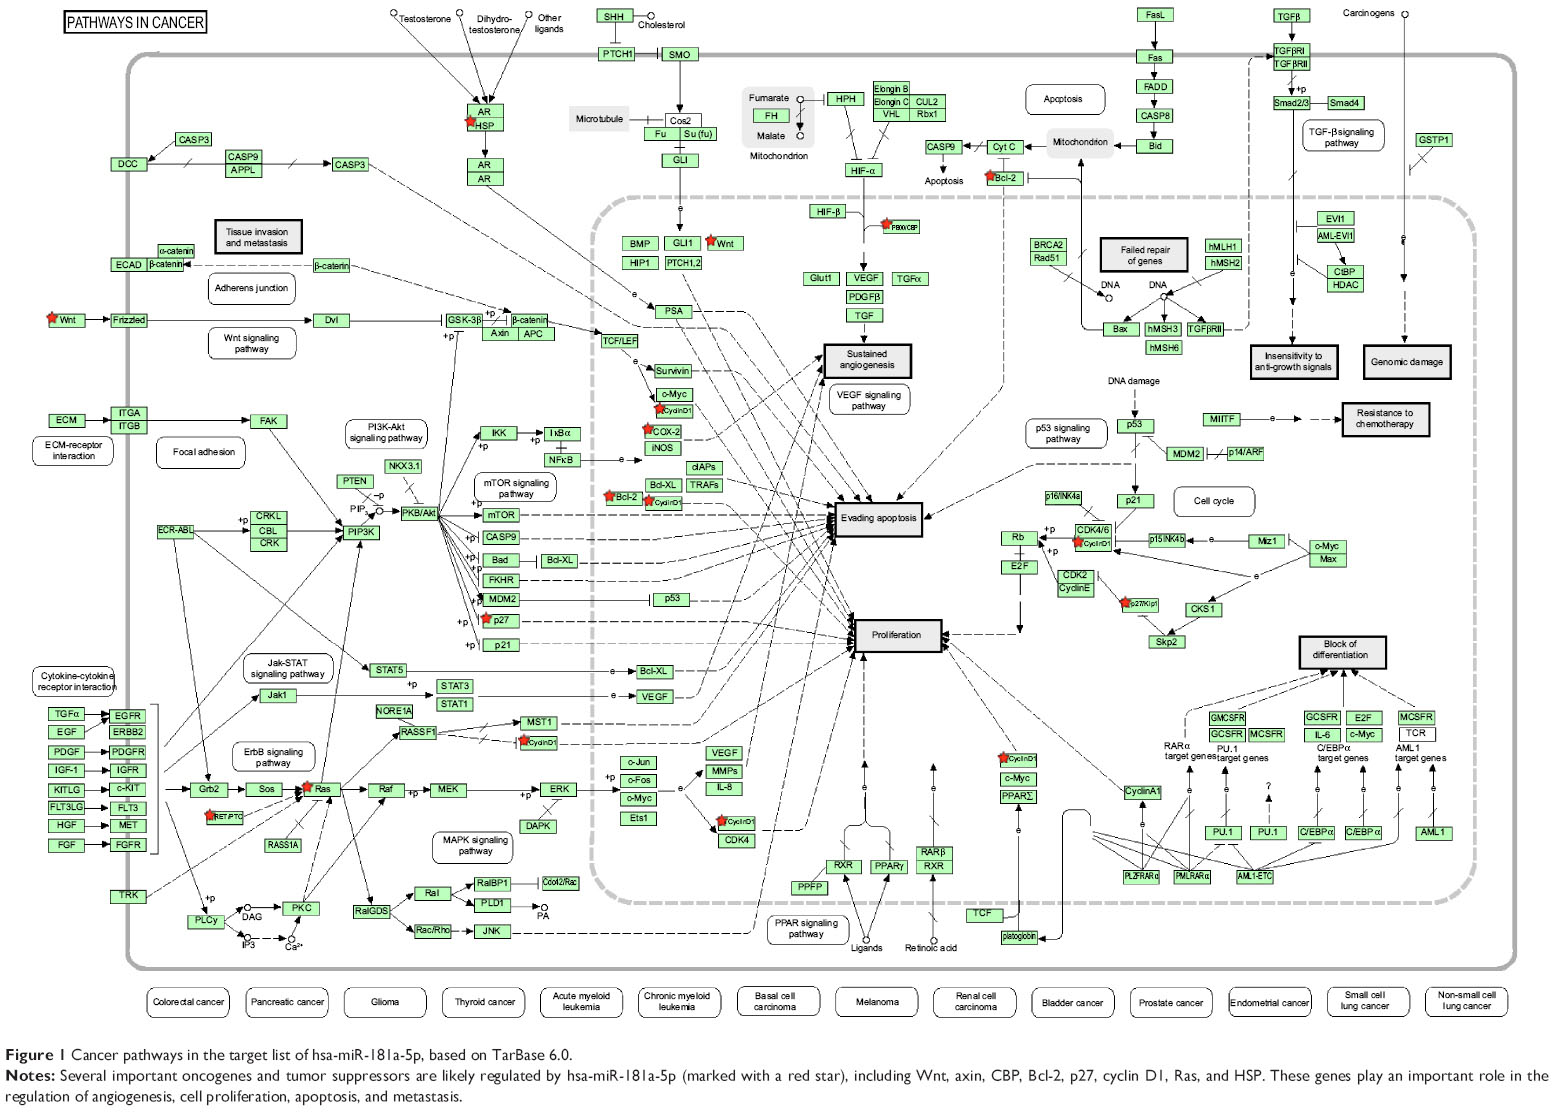 | Figure 1 Cancer pathways in the target list of hsa-miR-181a-5p, based on TarBase 6.0. |
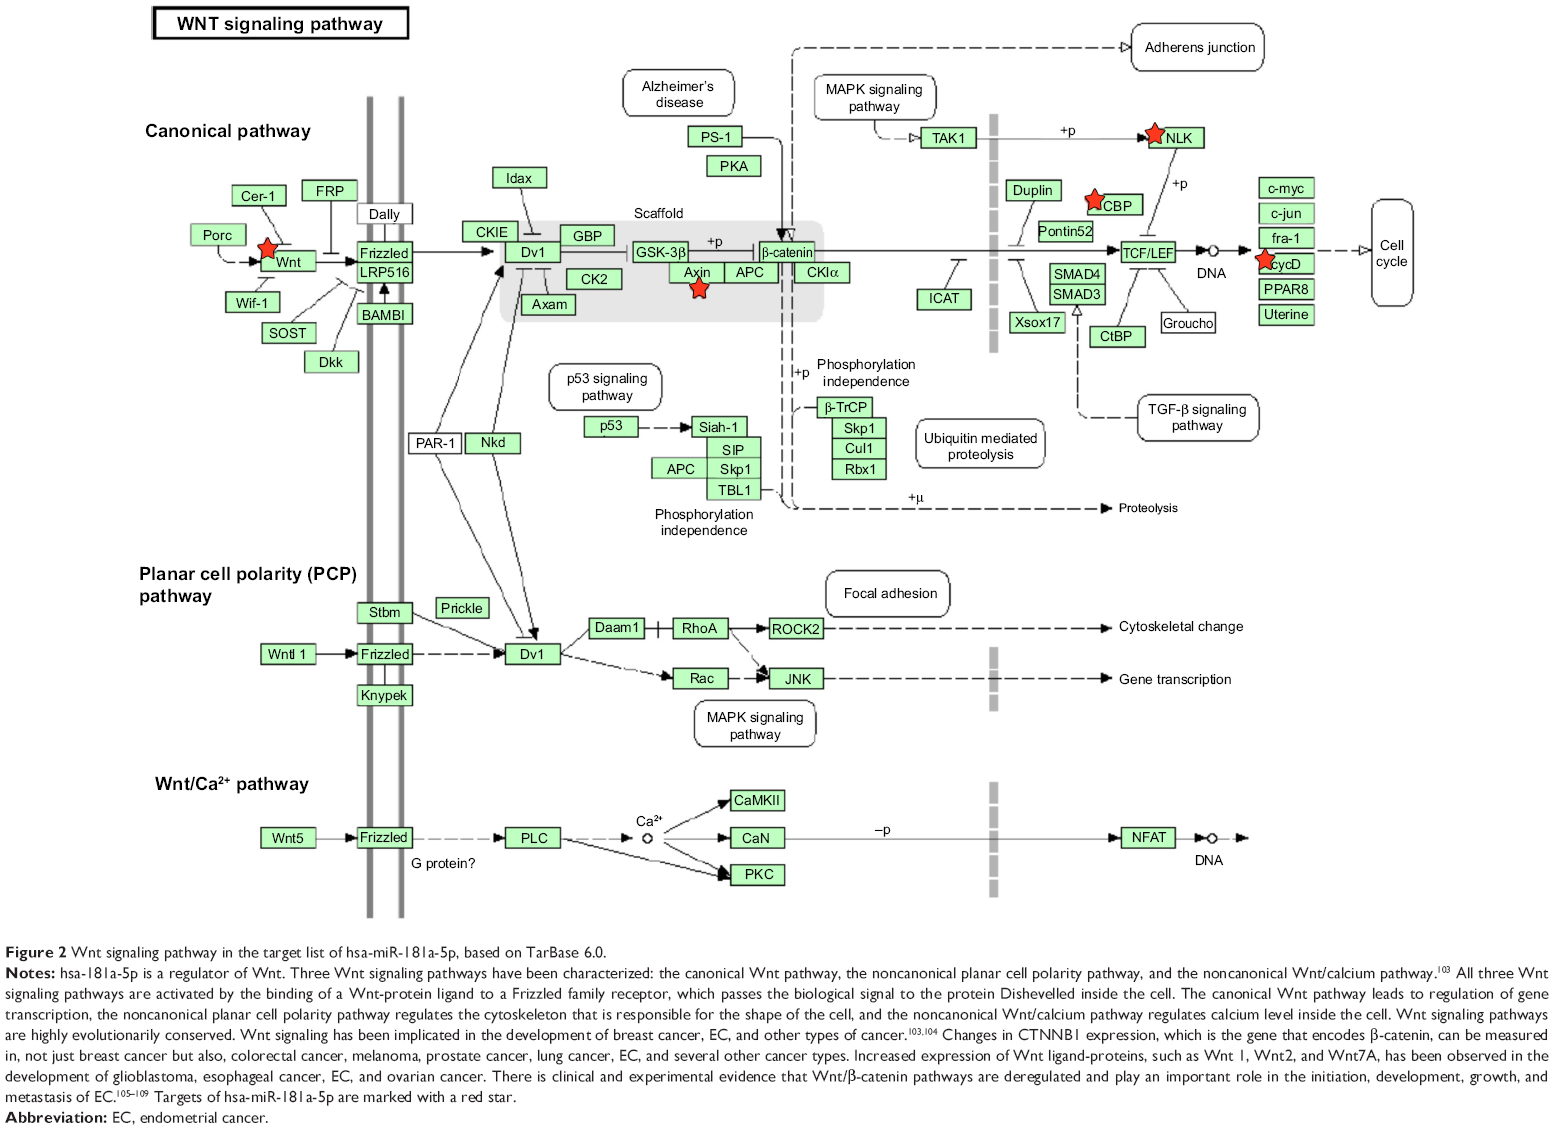 | Figure 2 Wnt signaling pathway in the target list of hsa-miR-181a-5p, based on TarBase 6.0. |
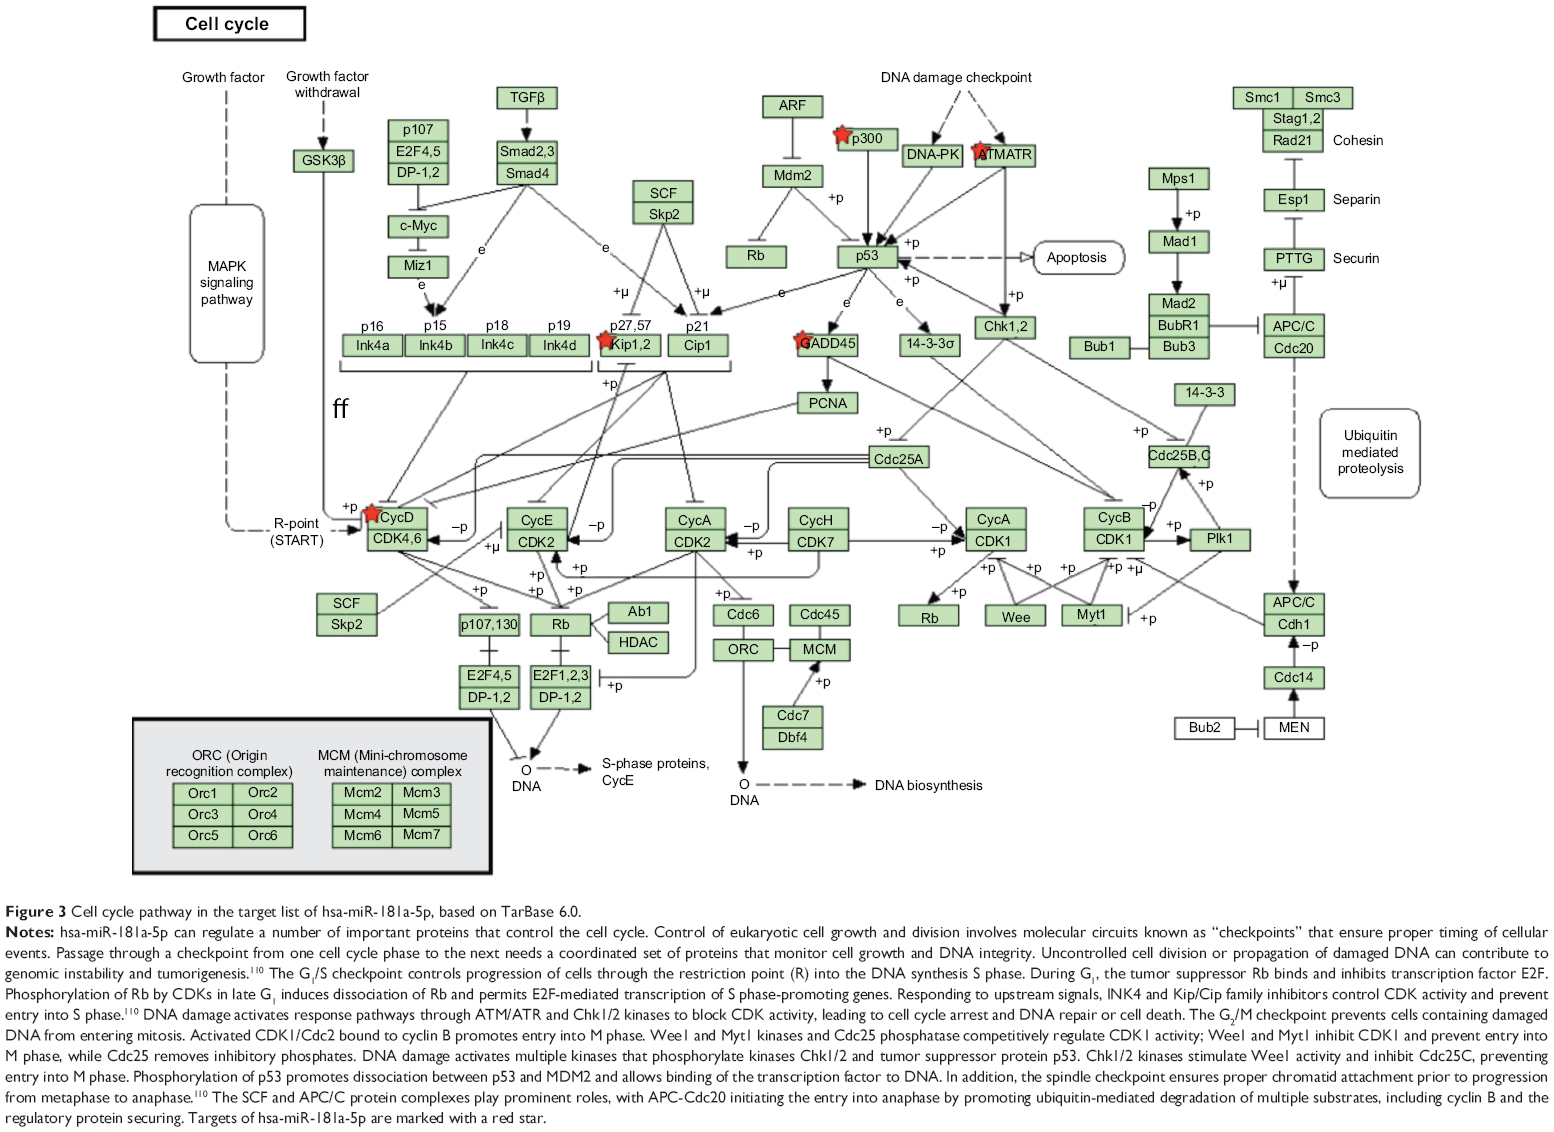 | Figure 3 Cell cycle pathway in the target list of hsa-miR-181a-5p, based on TarBase 6.0. |
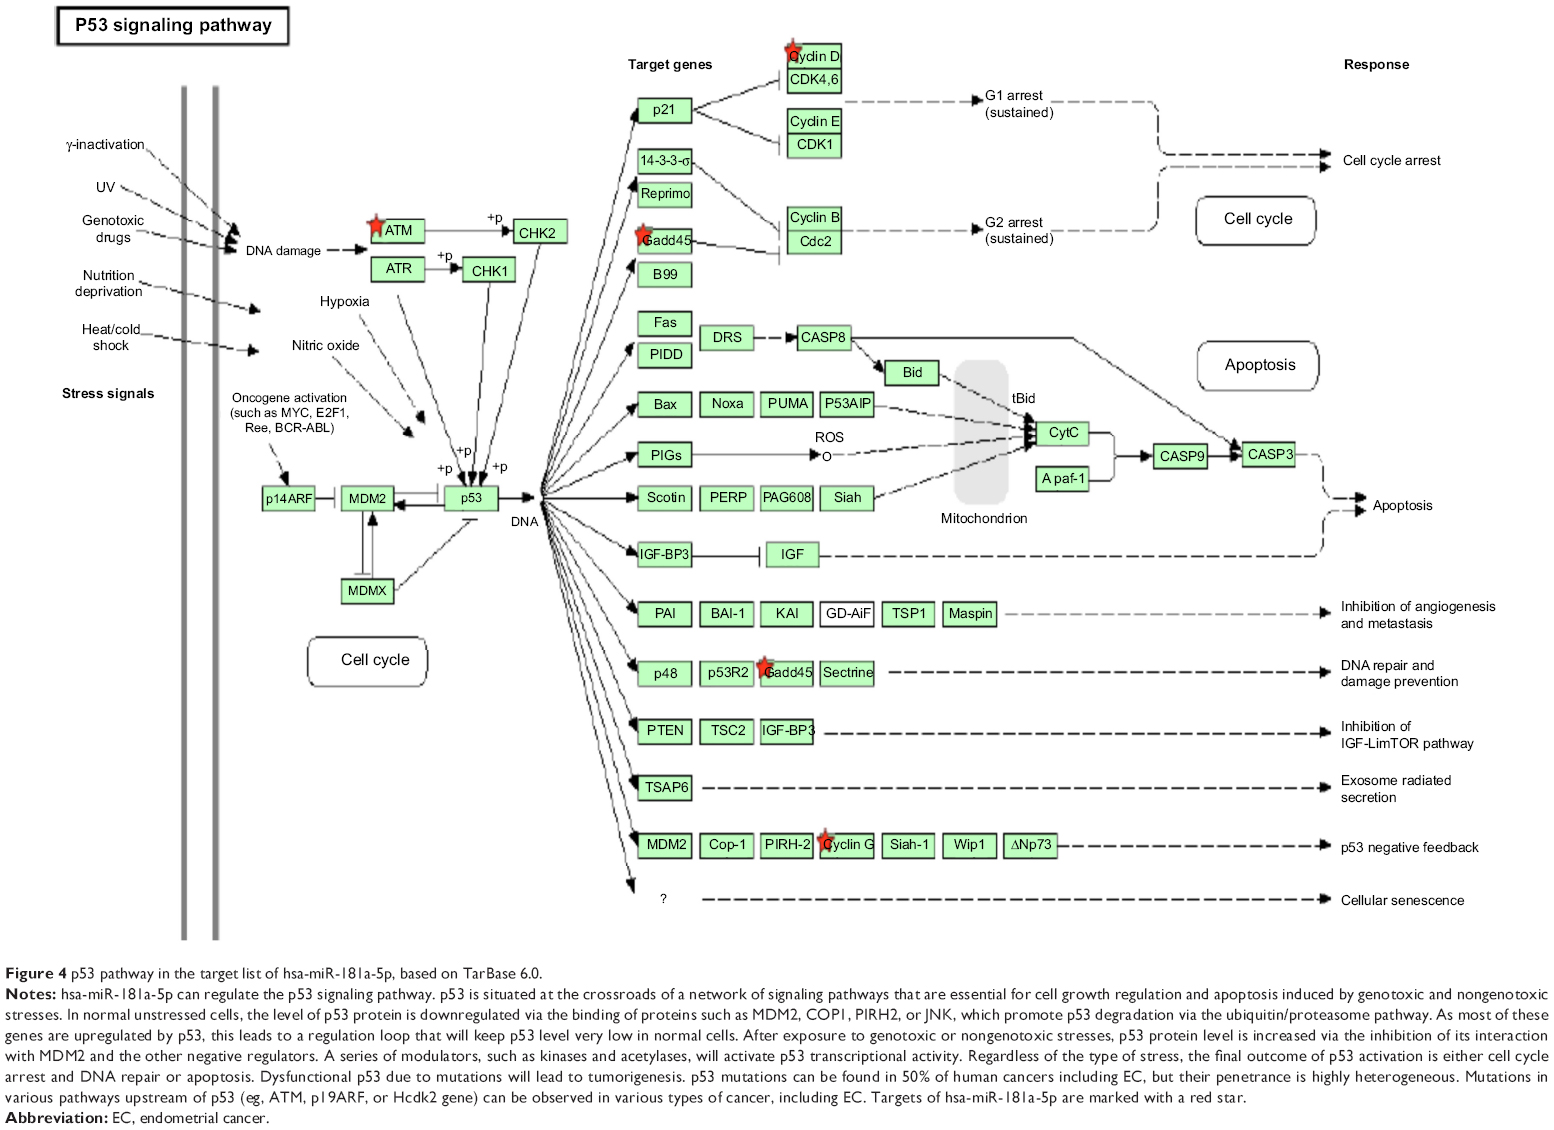 | Figure 4 p53 pathway in the target list of hsa-miR-181a-5p, based on TarBase 6.0. |
Validated targets of hsa-miR-181a-5p based on miRTarBase
Based on miRTarBase, 241 targets of hsa-miR-181a-5p have been validated with experimental evidence (Table 8). These included ACOT12, AFTPH, AKAP12, AMMECR1, ANKRD1, ANKRD13C, AP1M1, ARF6, ARHGAP12, ARL6IP6, ATF7IP2, ATG10, ATM, ATP6V0E1, ATP8A1, BAG2, BCL2, BCL2L11, BDNF, BPGM, BRCA1, BRMS1L, BTBD3, C1orf109, C1QTNF9, C8A, CCDC6, CCNG1, CD46, and CDKN1B. Among these validated targets, only 18 are cancer genes (7.47%), including ATM, BCL2, CCDC6, CDX2, FBXO11, H3F3B, HOOK3, HOXA11, HRAS, KRAS, MAP2K1, NOTCH1, NOTCH2, PLAG1, PTPN11, STAG2, TAF15, and TSHR (Table 8). Only half of these cancer genes have been included in TarBase.
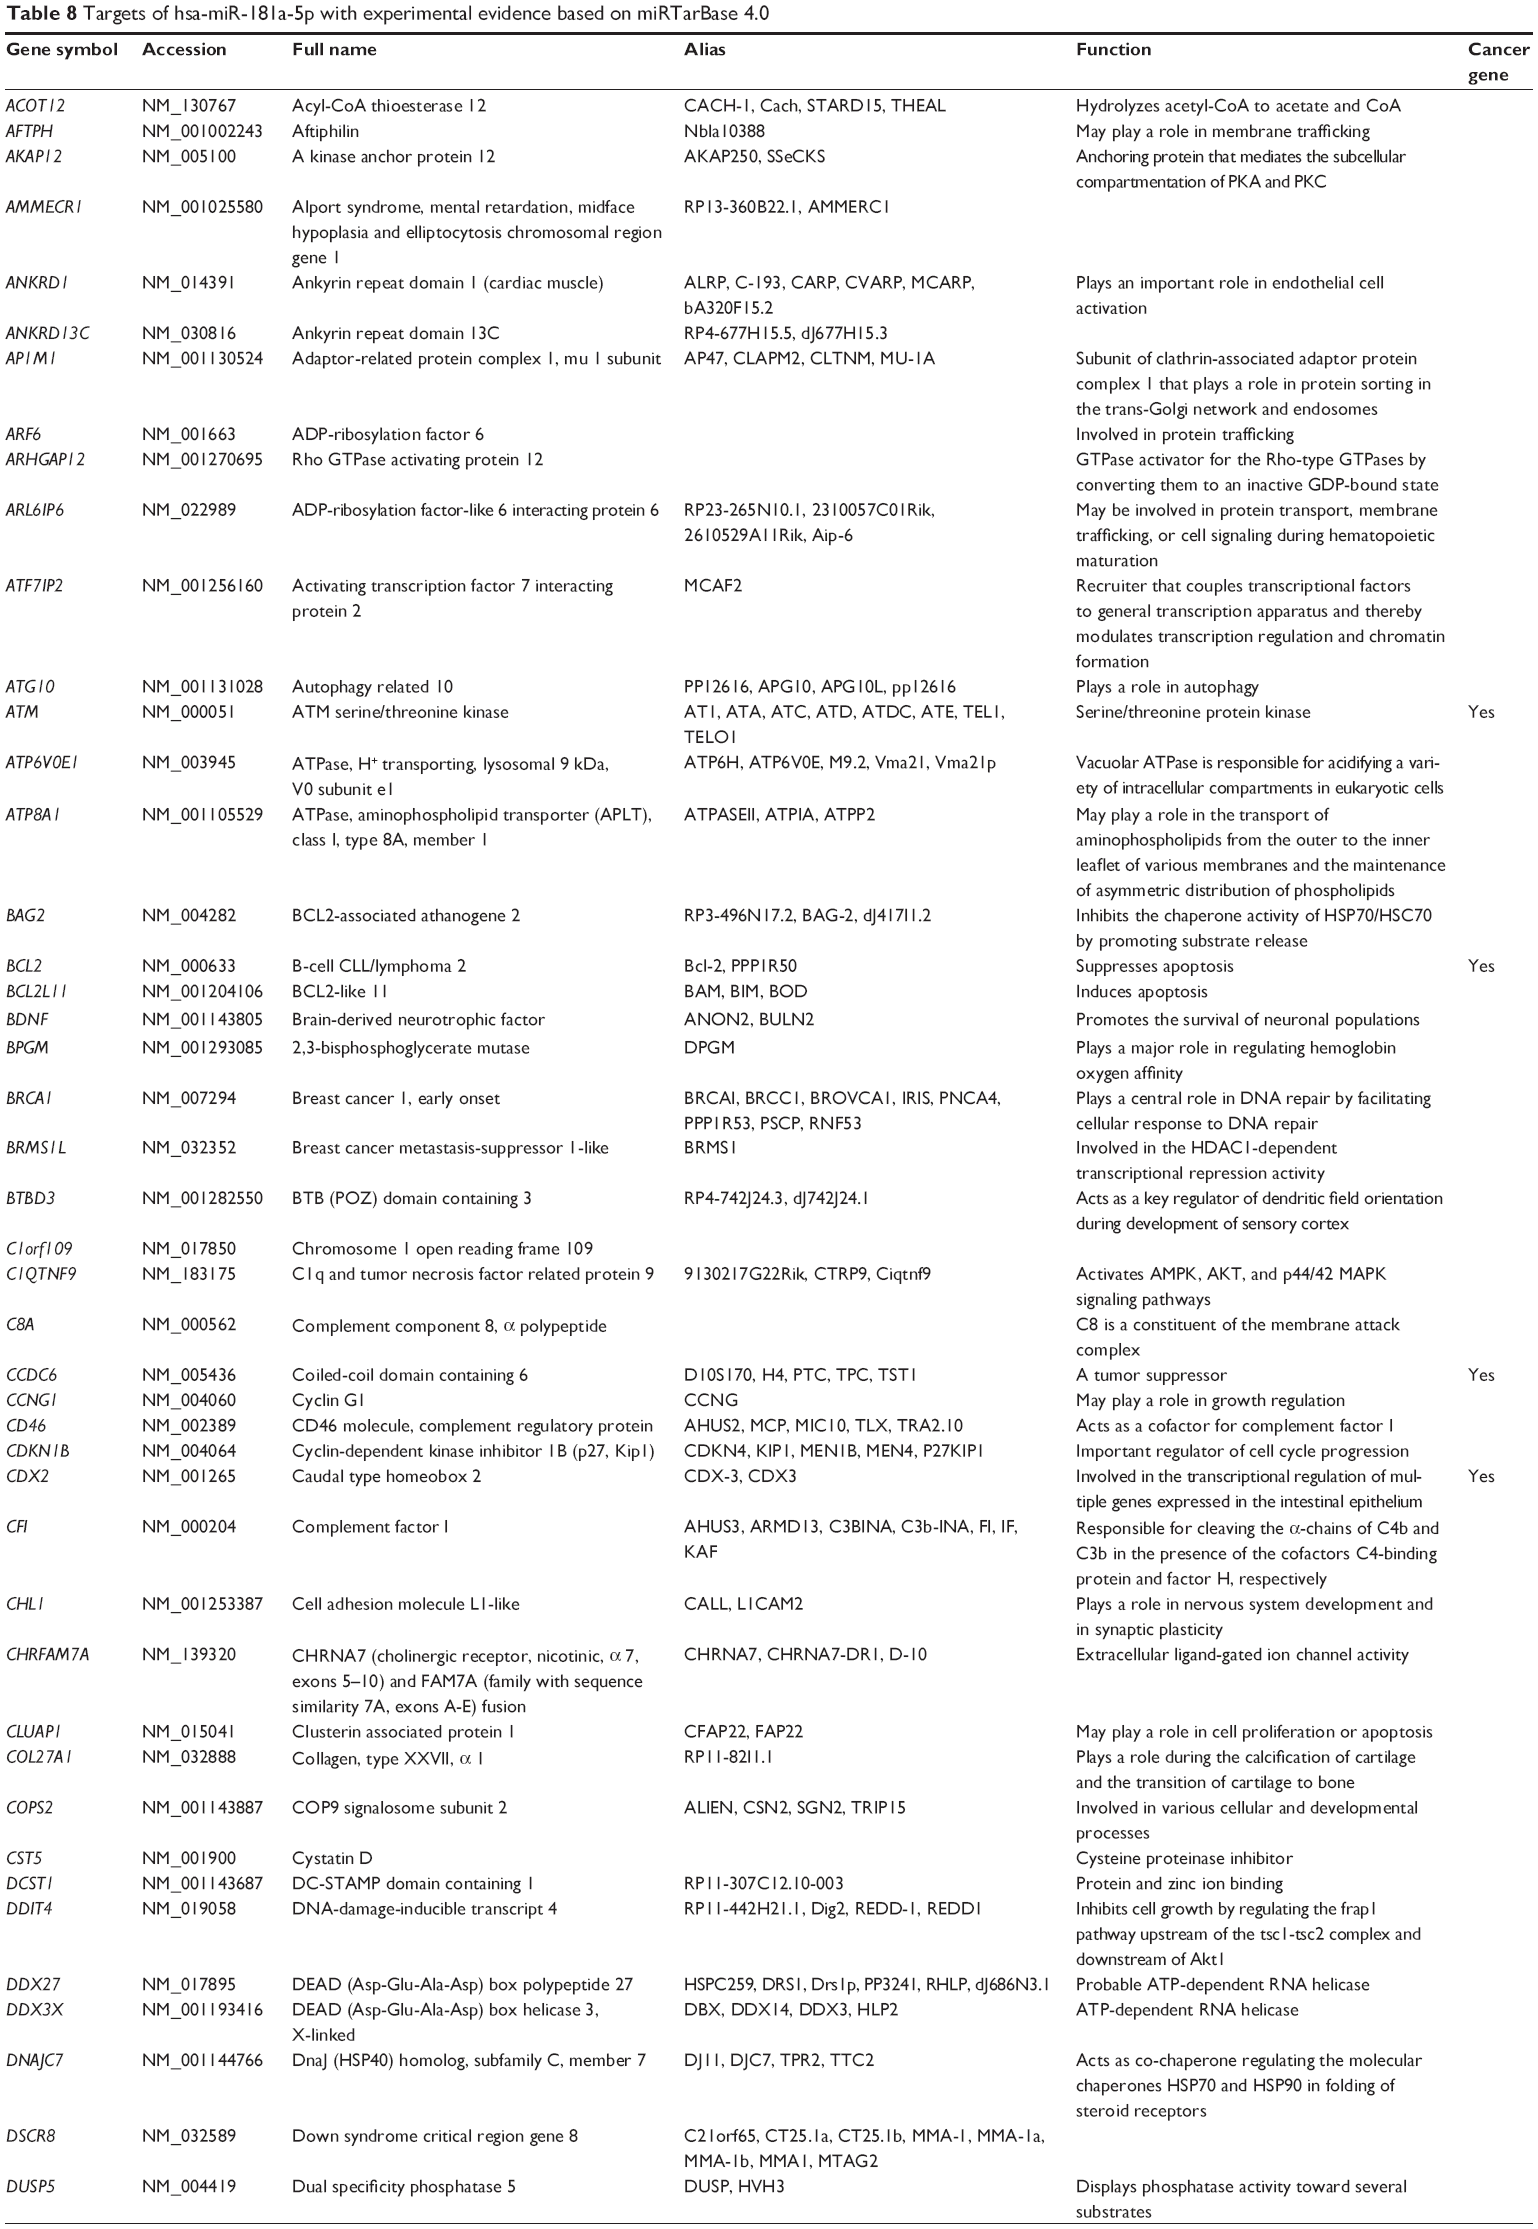 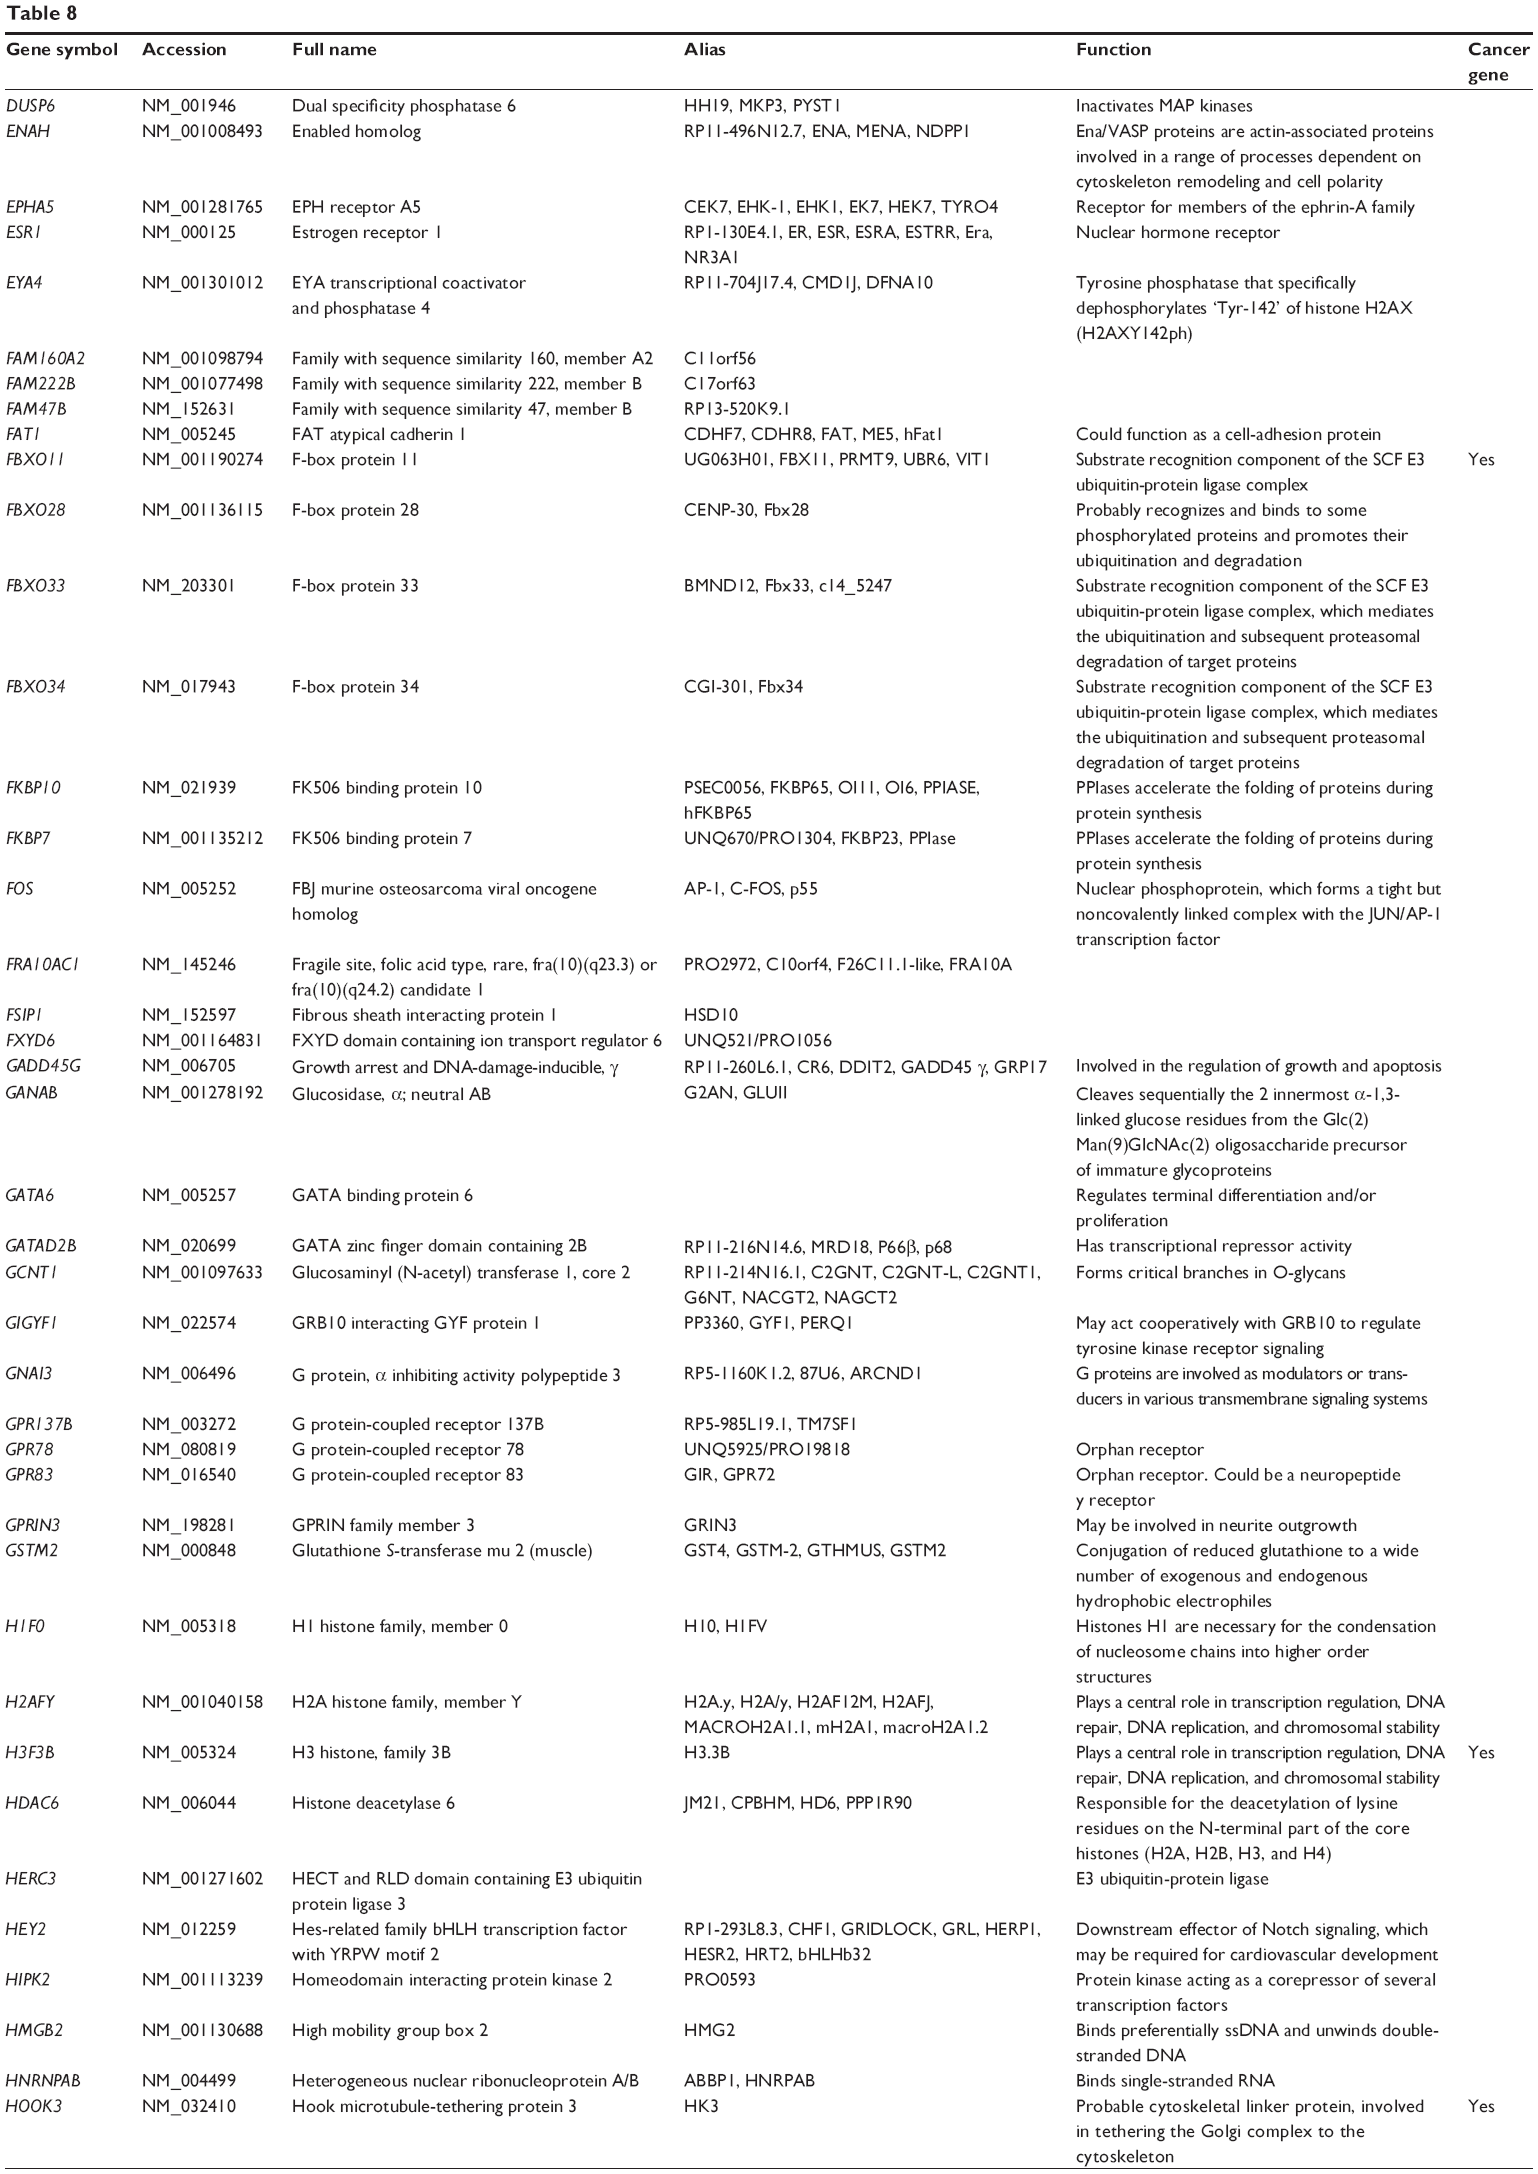 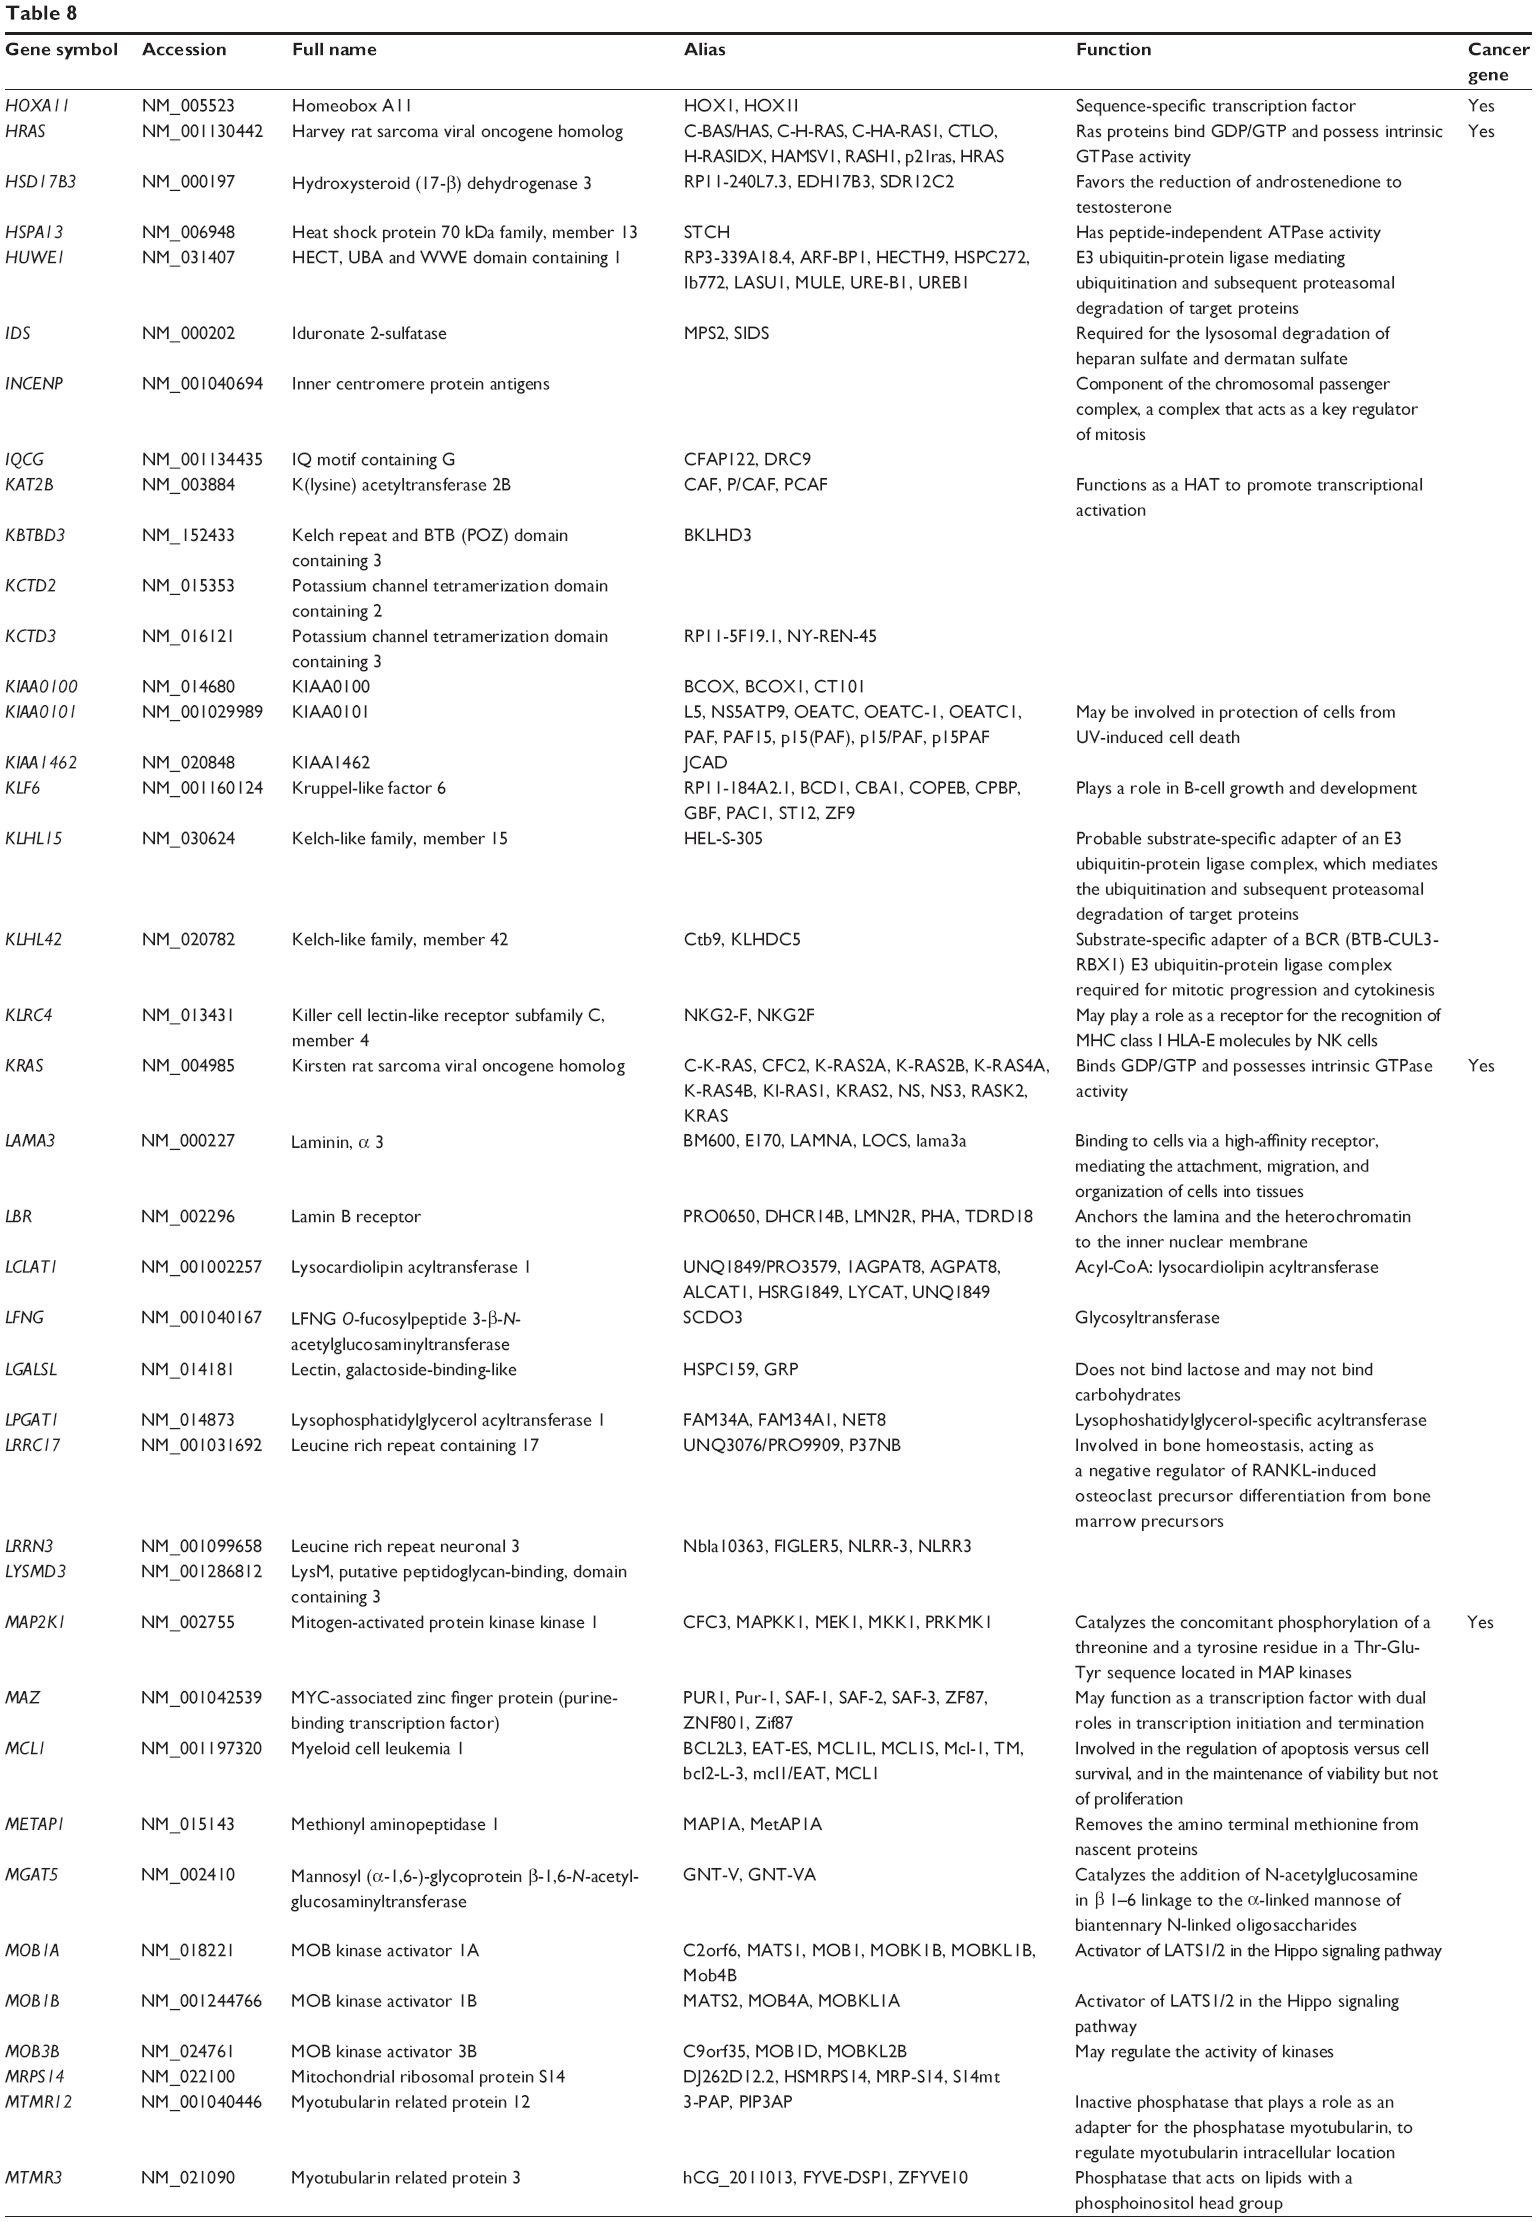 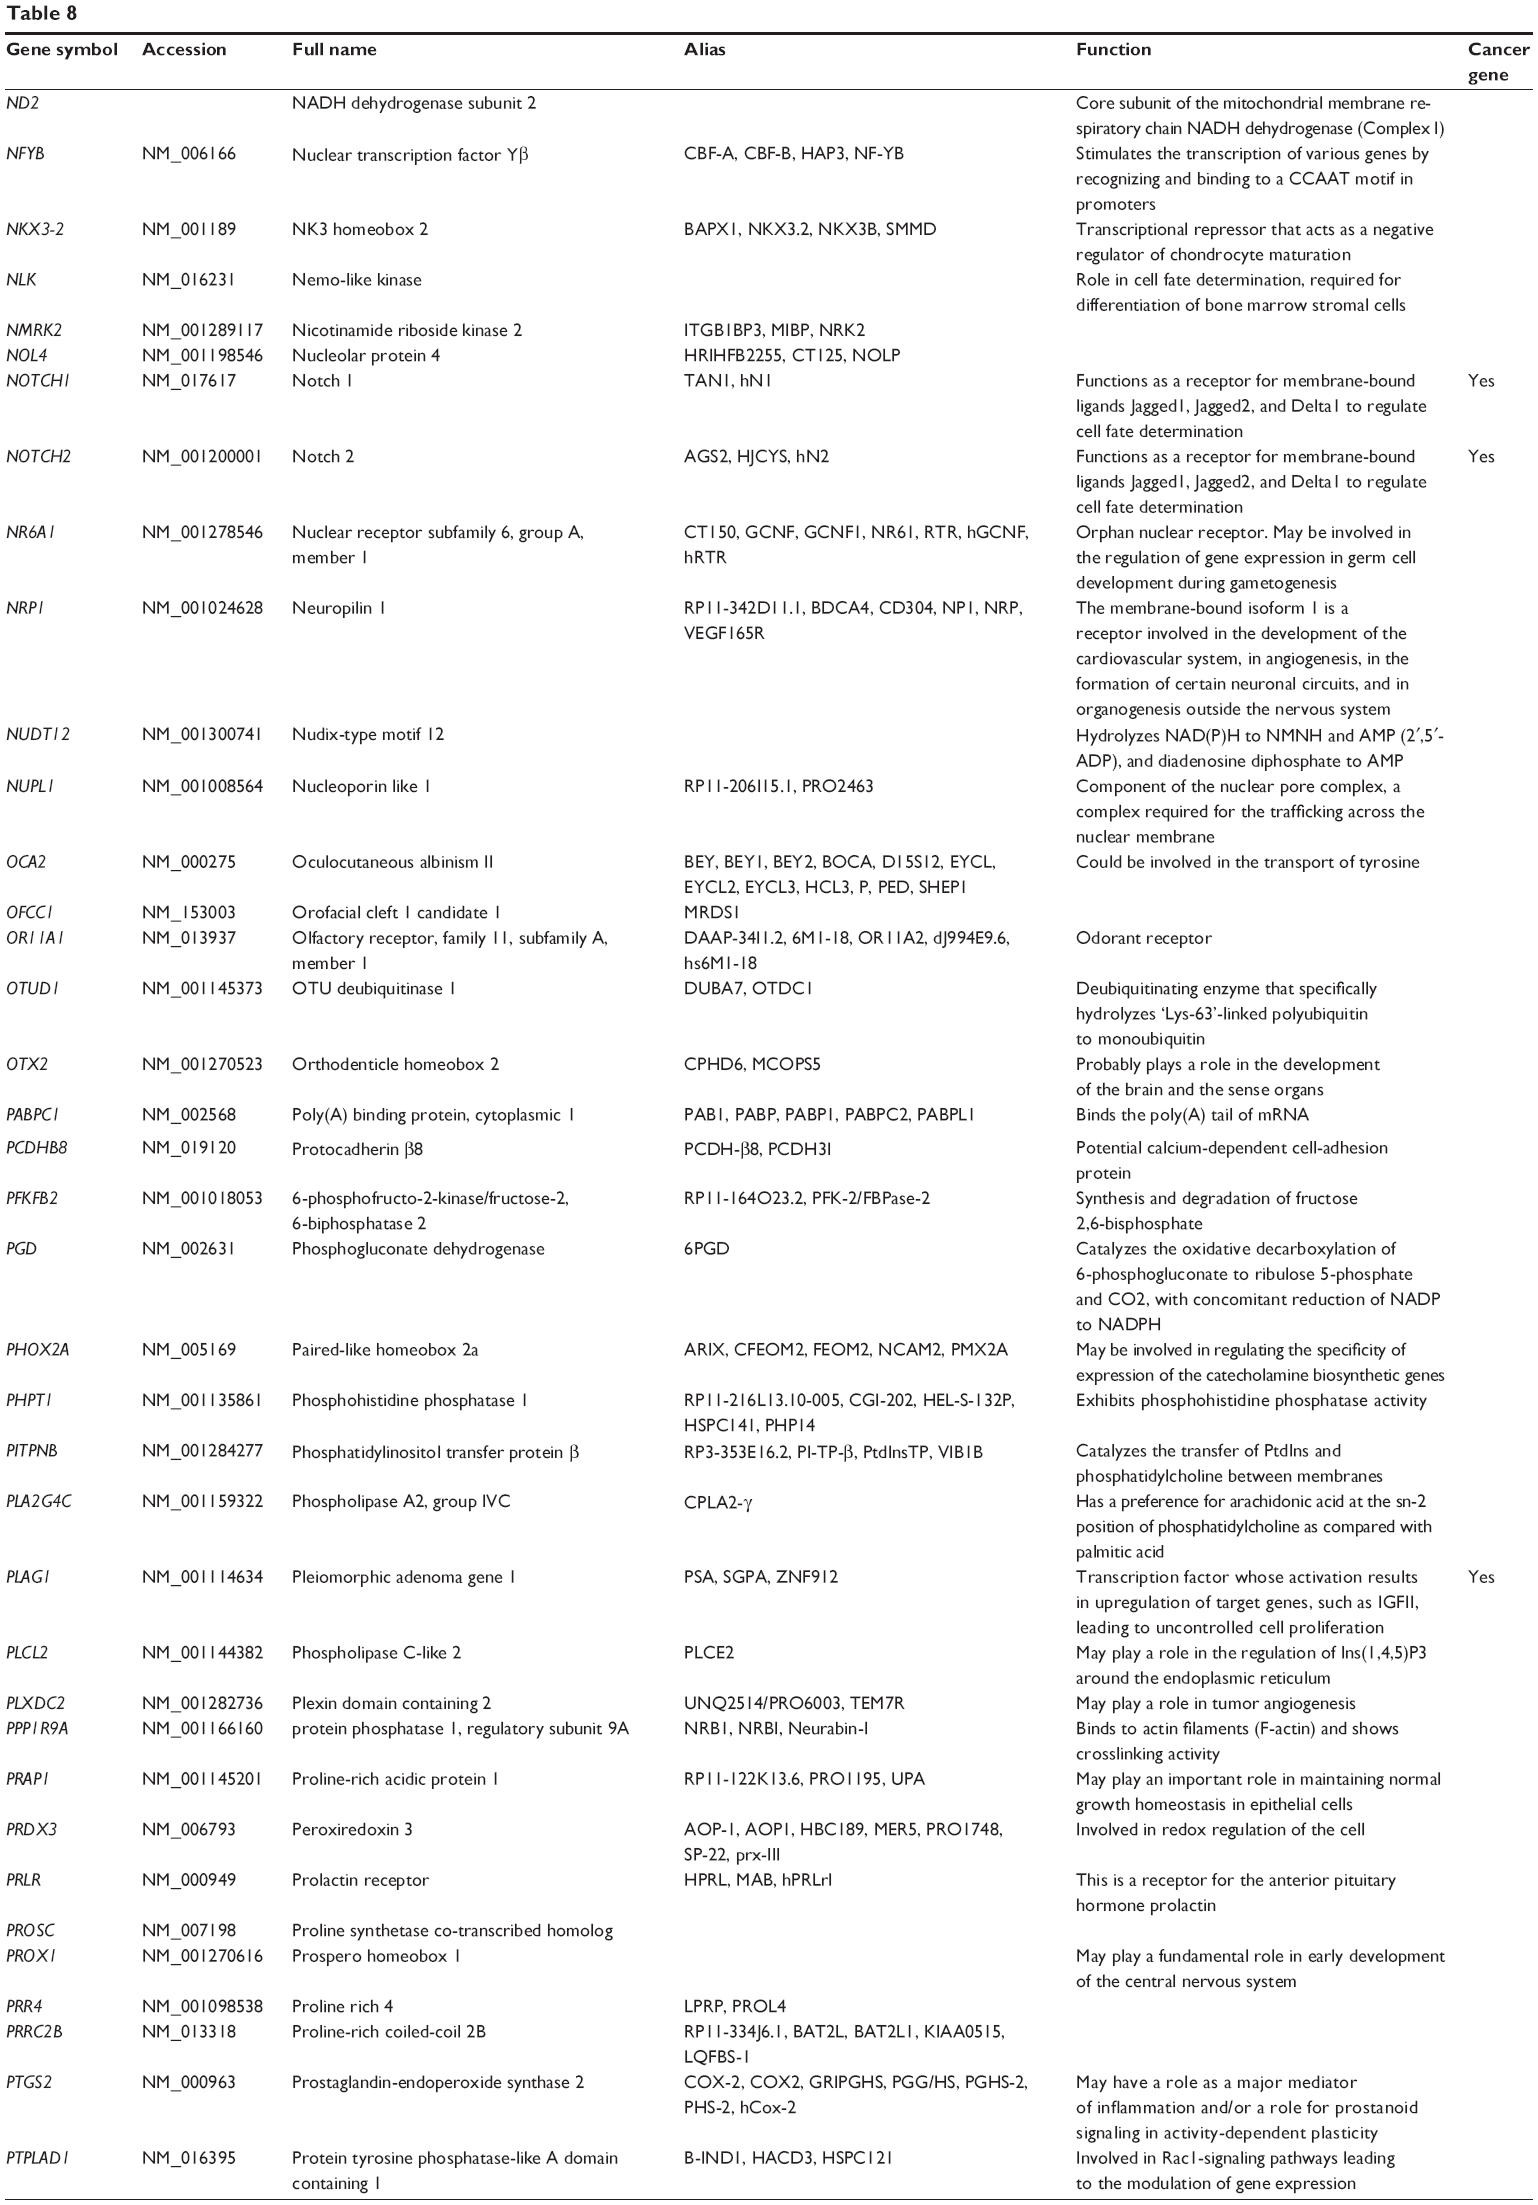 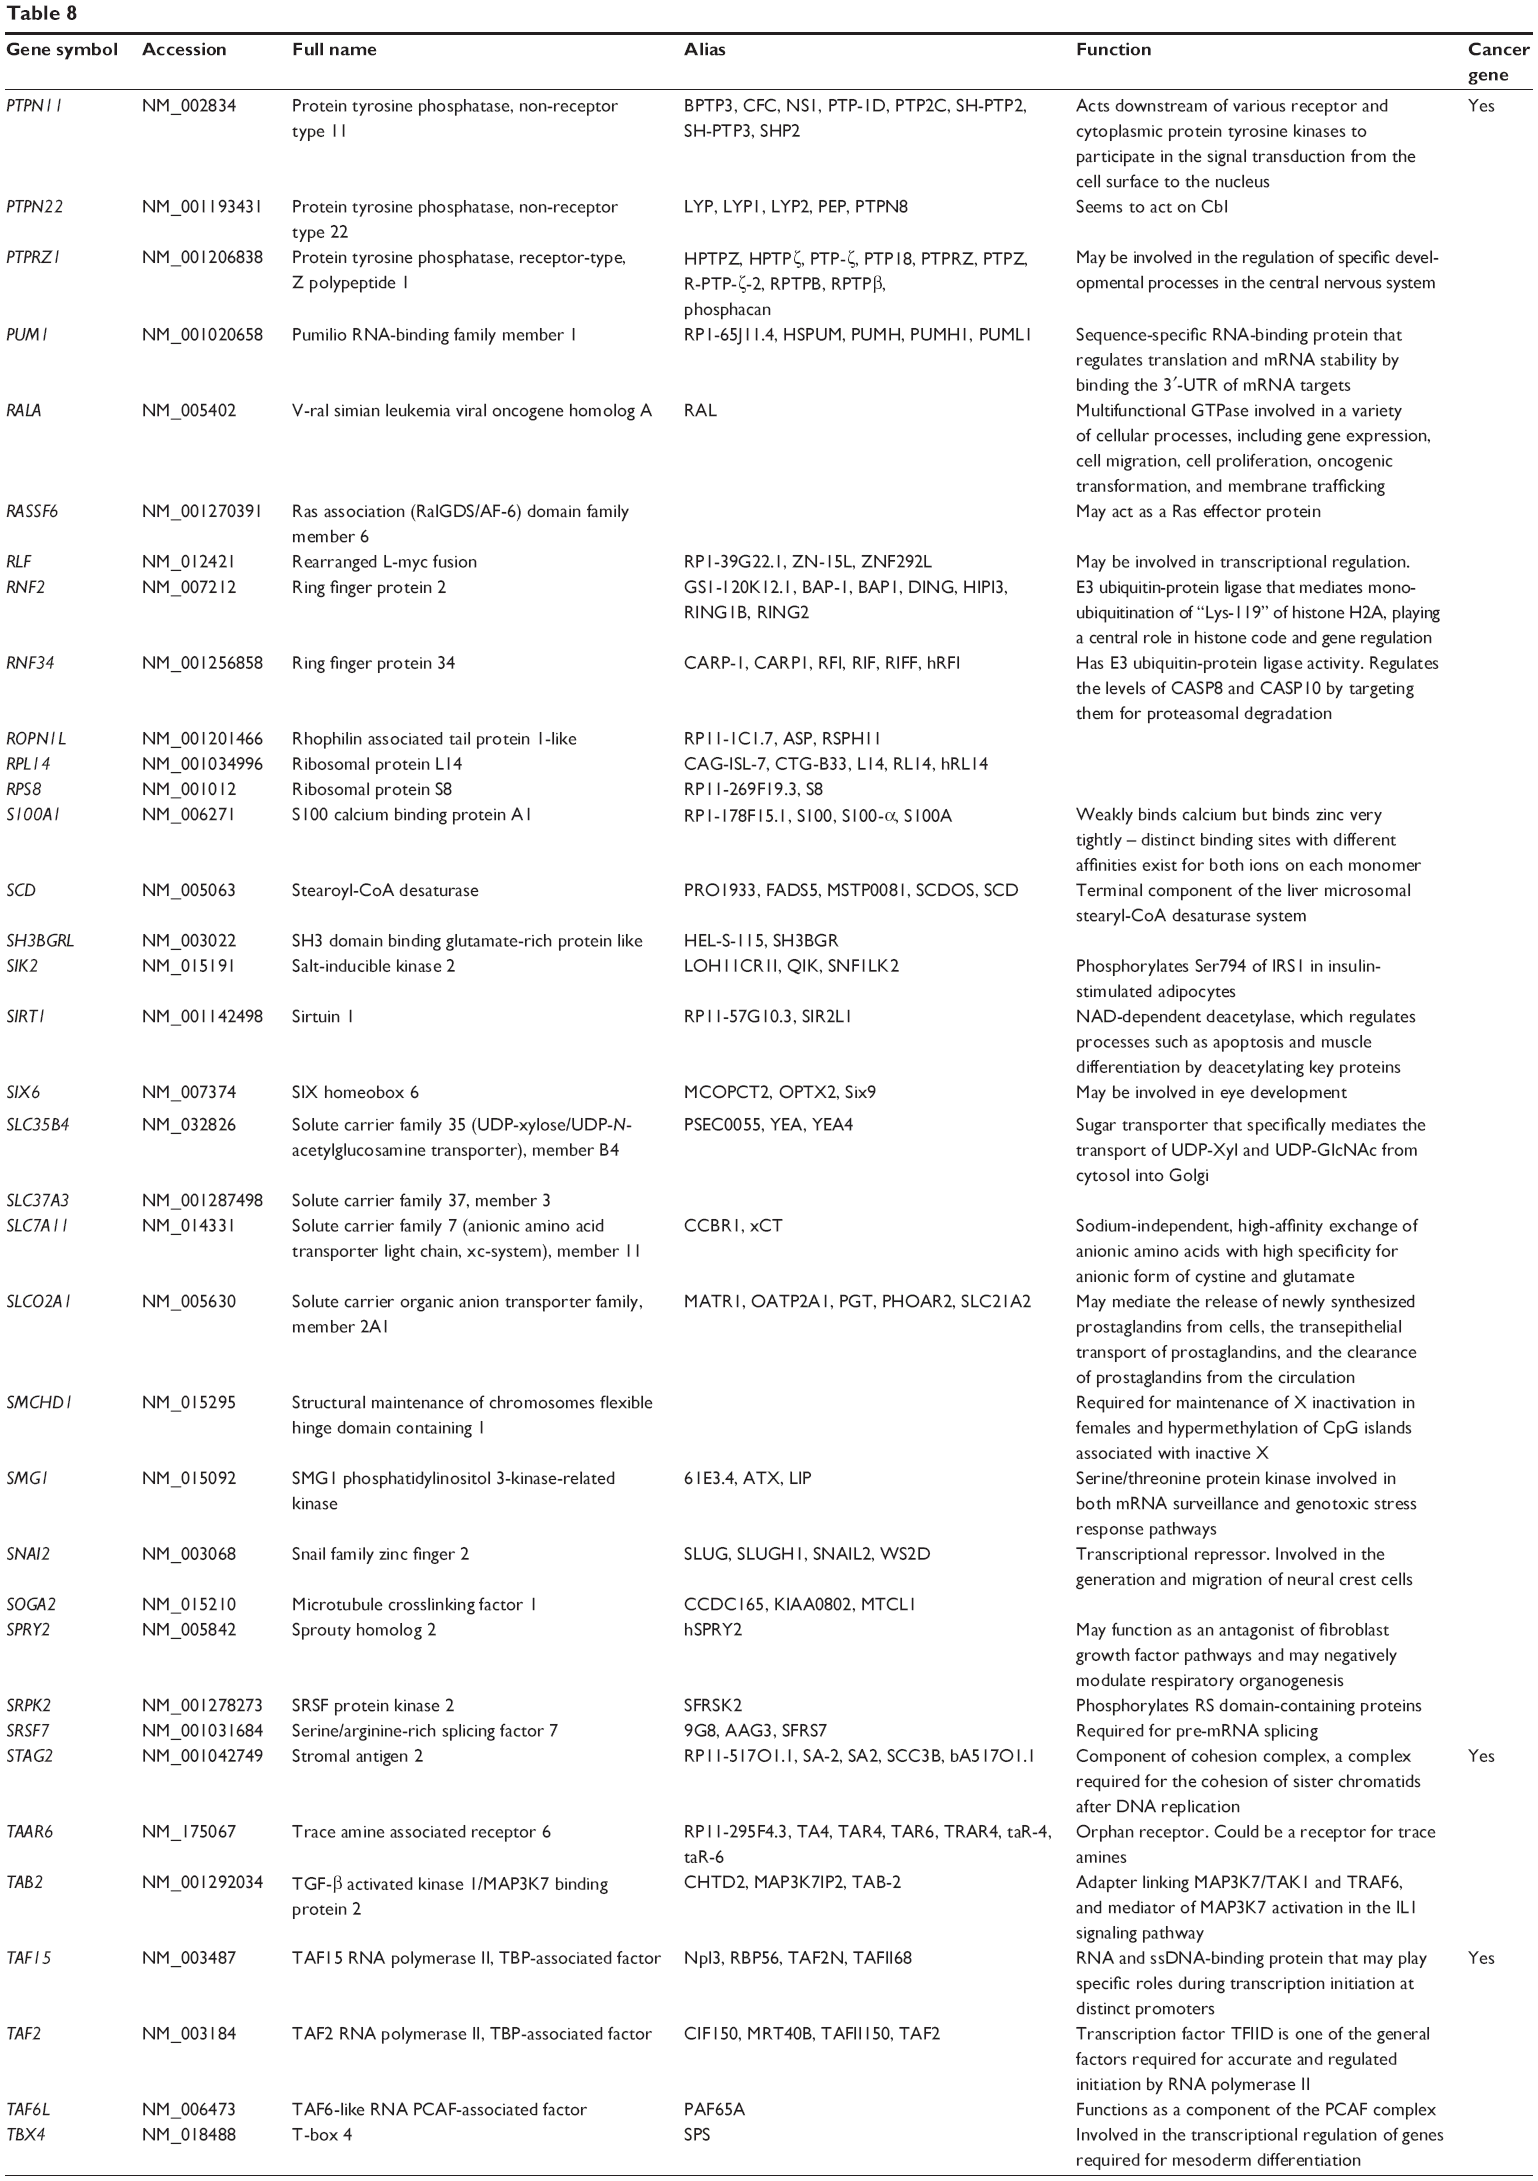 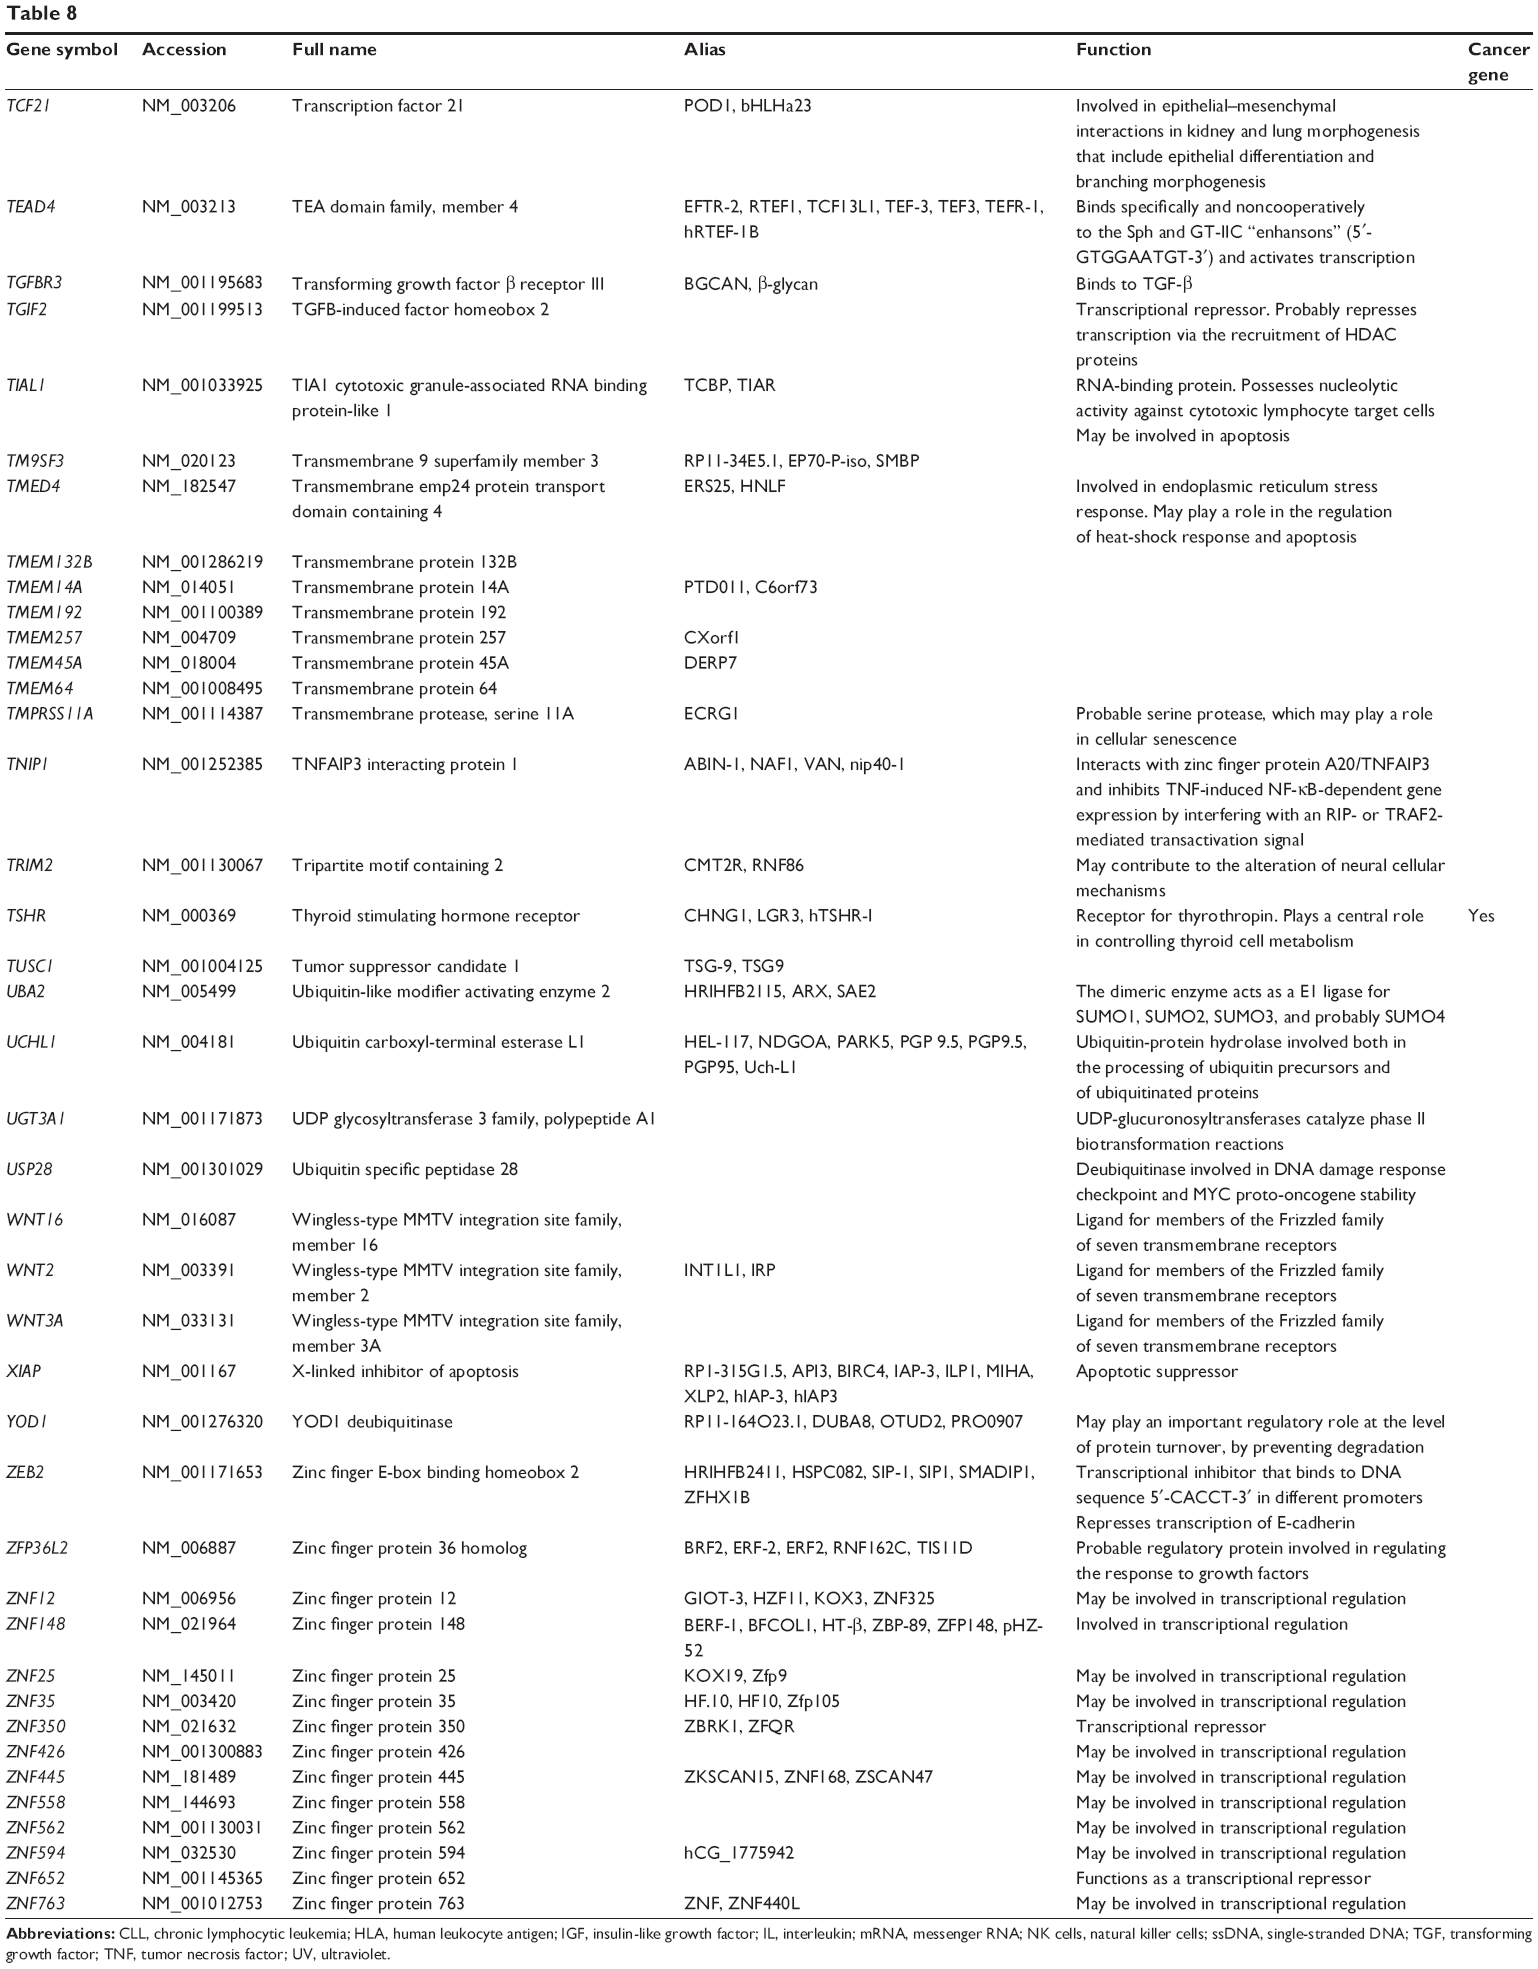 | Table 8 Targets of hsa-miR-181a-5p with experimental evidence based on miRTarBase 4.0 |
As shown in Table 9, our DAVID analysis showed that there were 20 functional clusters that were identified to be enriched with an enrichment score >1.0 in the target list of hsa-miR-181a-5p, based on miRTarBase. The functions of these clusters involved negative regulation of transcription, negative regulation of gene expression, negative regulation of nucleobase, nucleoside, nucleotide, and nucleic acid metabolic processes, negative regulation of nitrogen compound metabolic process, negative regulation of macromolecule biosynthetic process, negative regulation of cellular biosynthetic process, negative regulation of biosynthetic process, regulation of phosphorylation, regulation of phosphate metabolic process, lung development, respiratory tube development, positive regulation of transcription, positive regulation of gene expression, mesenchymal cell differentiation and development, negative regulation of apoptosis and programmed cell death, the insulin-like growth factor (IGF)-1 signaling pathway, interleukin (IL)-6 signaling pathway, insulin signaling pathway, Ubl conjugation pathway, modification-dependent macromolecule catabolic process, and modification-dependent protein catabolic process.
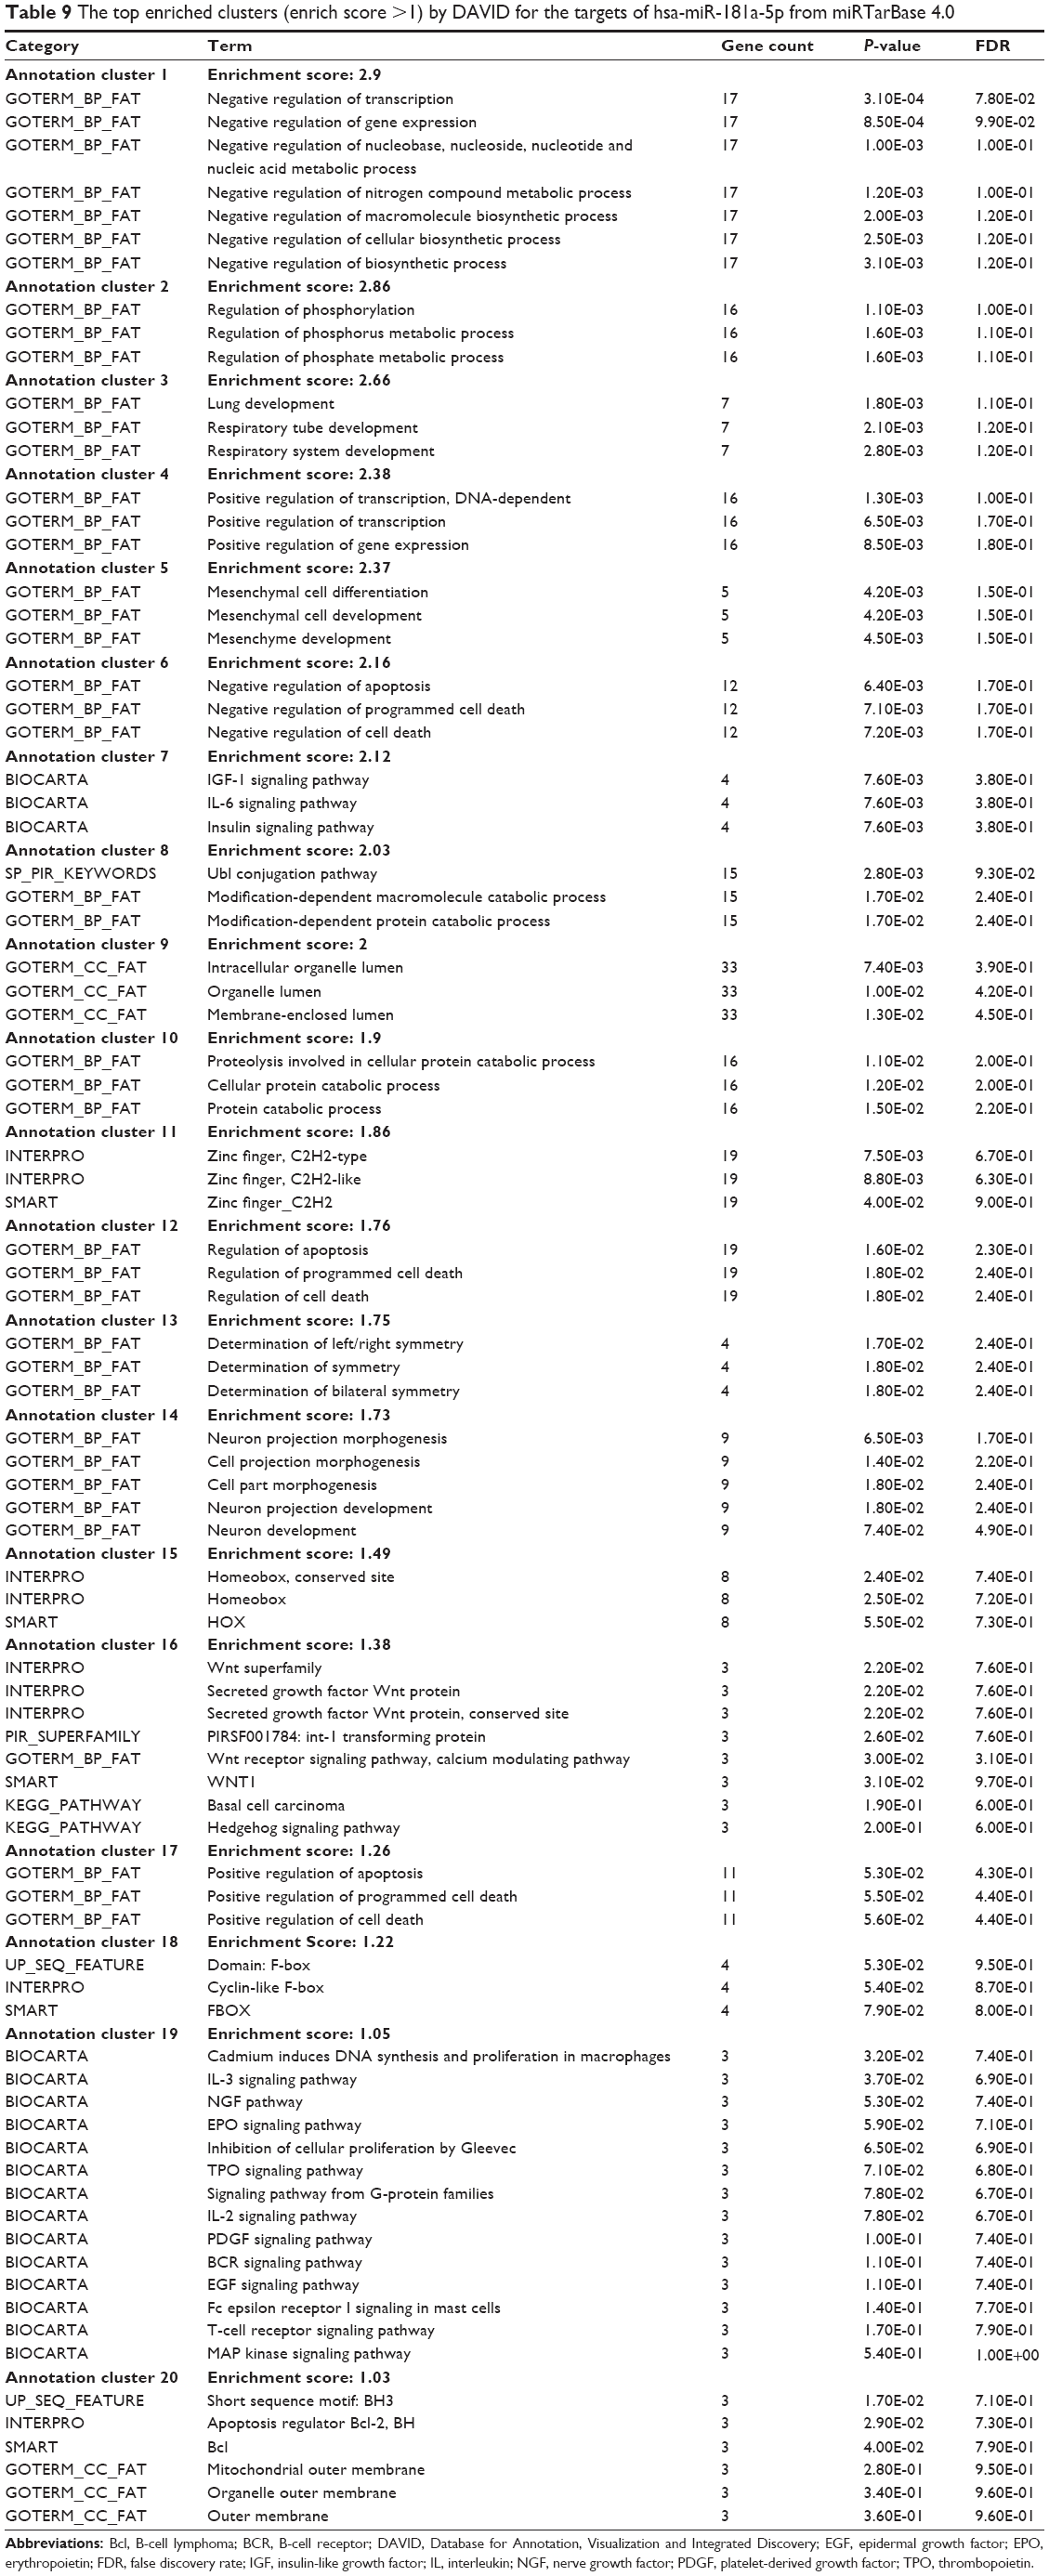 | Table 9 The top enriched clusters (enrich score >1) by DAVID for the targets of hsa-miR-181a-5p from miRTarBase 4.0 |
Furthermore, our DAVID analysis revealed that there were 14 KEGG pathways significantly enriched in the target list of hsa-miR-181a-5p, based on miRTarBase (Table 10). These pathways included pathways in cancer pathways (Figure 5), the MAPK signaling pathway (Figure 6), melanogenesis, chronic myeloid leukemia, small cell lung cancer, prostate cancer, dorsoventral axis formation, thyroid cancer, the Notch signaling pathway (Figure 7), long-term depression, renal cell carcinoma, the B cell receptor signaling pathway, vascular endothelial growth factor (VEGF) signaling pathway (Figure 8), and prion diseases.
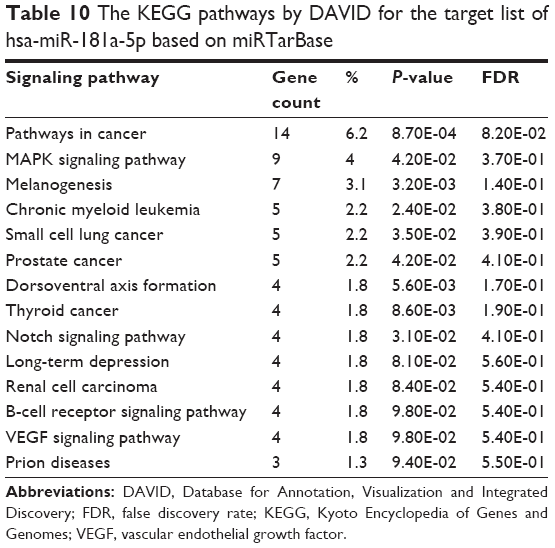 | Table 10 The KEGG pathways by DAVID for the target list of hsa-miR-181a-5p based on miRTarBase |
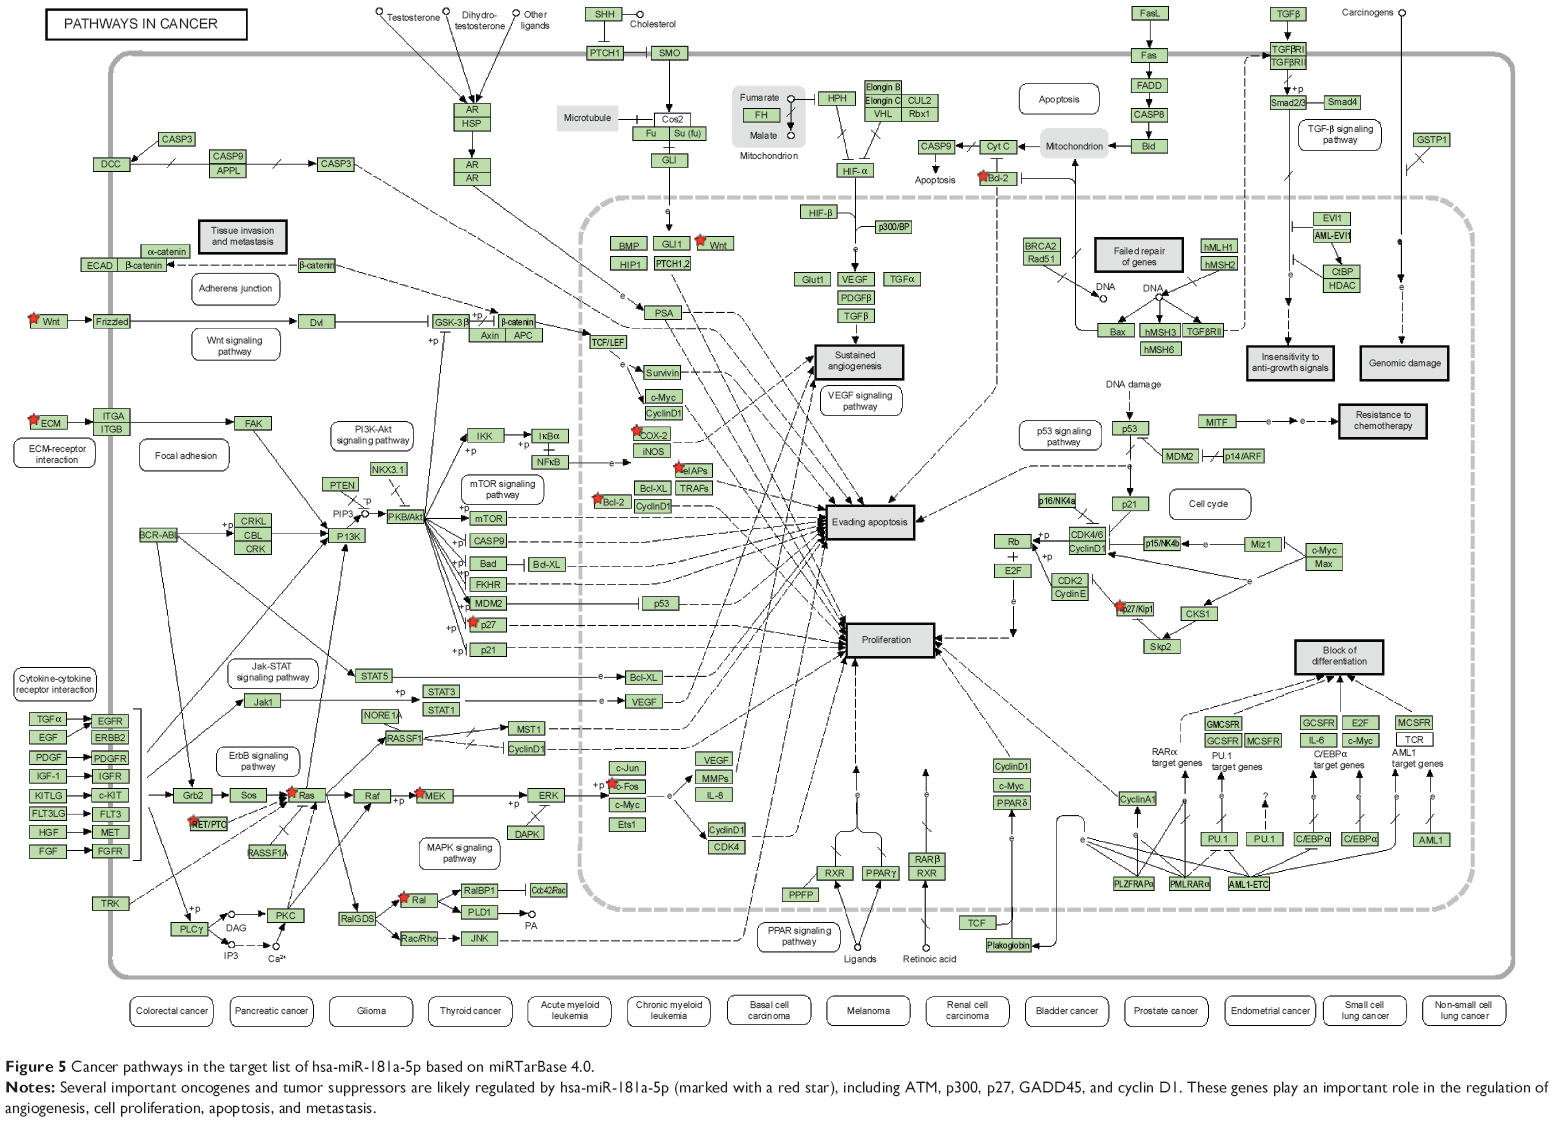 | Figure 5 Cancer pathways in the target list of hsa-miR-181a-5p based on miRTarBase 4.0. |
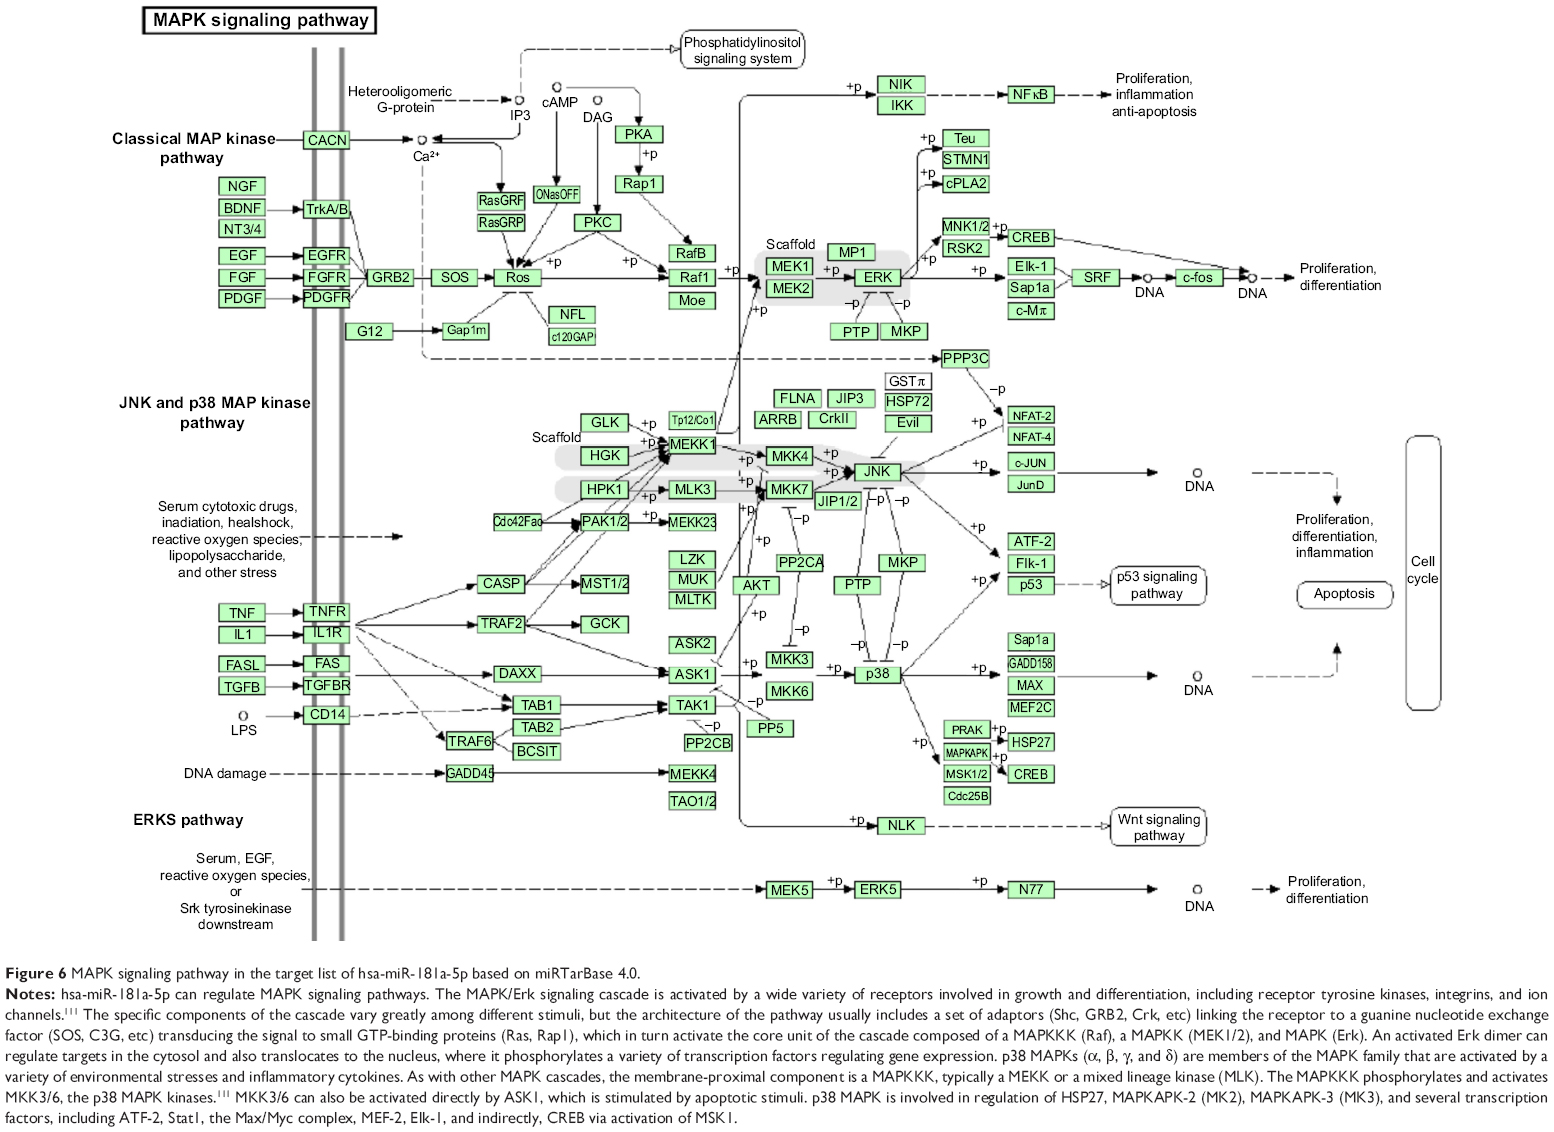 | Figure 6 MAPK signaling pathway in the target list of hsa-miR-181a-5p based on miRTarBase 4.0. |
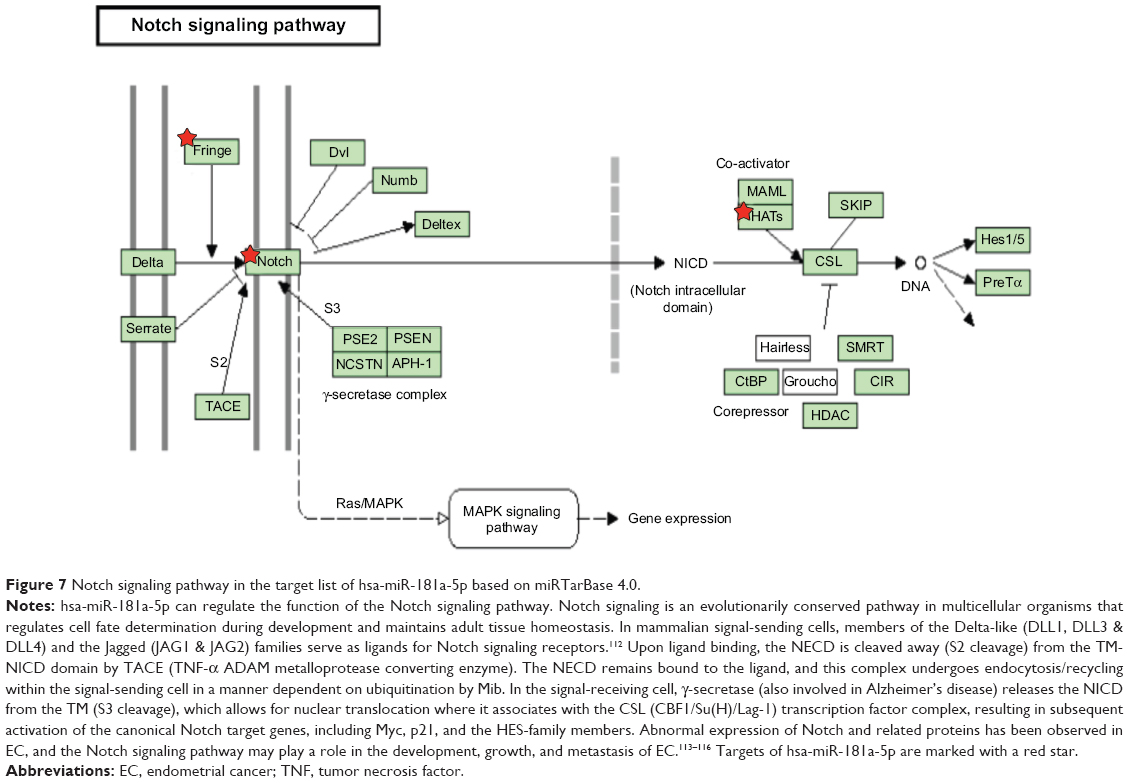 | Figure 7 Notch signaling pathway in the target list of hsa-miR-181a-5p based on miRTarBase 4.0. |
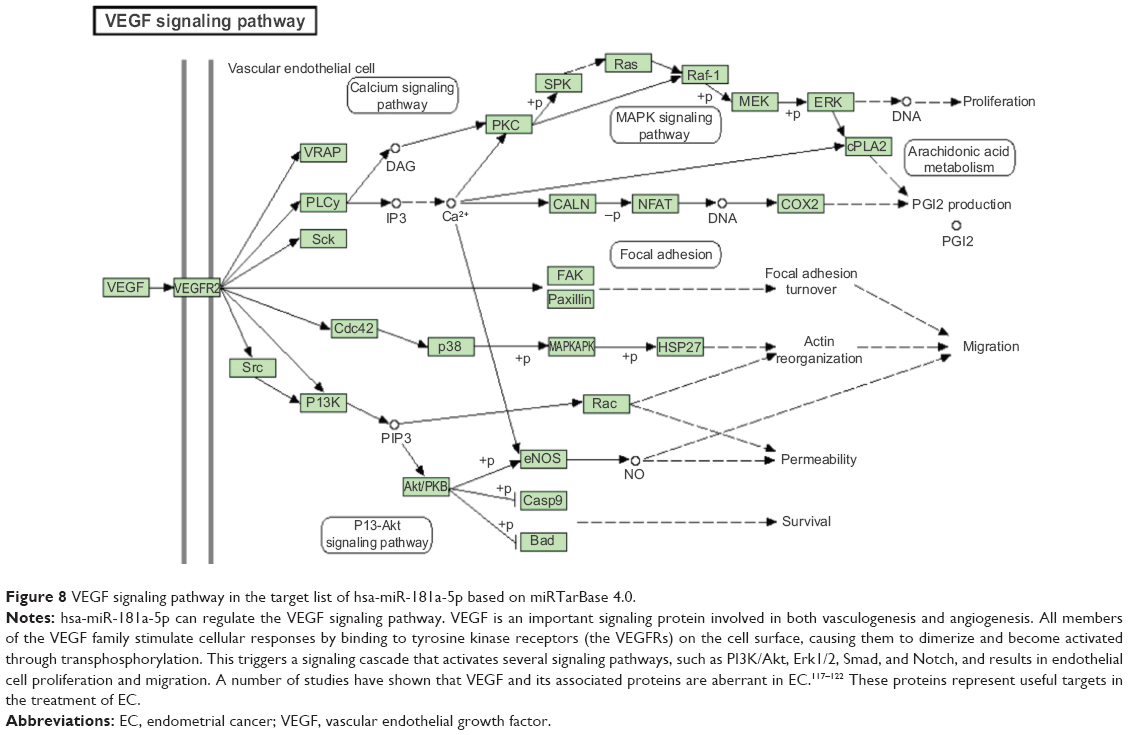 | Figure 8 VEGF signaling pathway in the target list of hsa-miR-181a-5p based on miRTarBase 4.0. |
Combined validated targets of hsa-miR-181a-5p, based on both TarBase 6.0 and miRTarBase 4.0
When we combined the target lists of hsa-miR-181a-5p with experimental evidence from both TarBase 6.0 and miRTarBase 4.0, there were 313 validated targets for hsa-miR-181a-5p (Table 11). As shown in Table 12, our DAVID analysis showed that there were 26 functional clusters that were identified to be enriched with an enrichment score >1.0 in the combined target list of hsa-miR-181a-5p, based on both TarBase 6.0 and miRTarBase 4.0. The functions of these clusters involved response to hormone stimulus, response to endogenous stimulus, response to organic substance, negative regulation of apoptosis, negative and positive regulation of programmed cell death, negative and positive regulation of cell death, the DNA damage checkpoint, DNA integrity checkpoint, DNA damage response and signal transduction, the cell cycle checkpoint, response to DNA damage stimulus, bladder cancer, endometrial cancer (Figure 9), non-small-cell lung cancer, acute myeloid leukemia, glioma, melanoma, developmental growth, cell fate commitment, tissue morphogenesis, positive regulation of macromolecule biosynthetic process, positive regulation of cellular biosynthetic process, positive regulation of biosynthetic process, regulation of phosphorylation, regulation of phosphate metabolic process, regulation of phosphorus metabolic process, positive regulation of transcription, positive regulation of gene expression, positive regulation of protein kinase activity, positive regulation of kinase activity, positive regulation of transferase activity, regulation of protein kinase activity, regulation of kinase activity, positive regulation of cellular protein metabolic process, positive regulation of protein metabolic process, branching morphogenesis of a tube, positive regulation of cell development, morphogenesis of a branching structure, tube morphogenesis, regulation of cell development, neuron projection morphogenesis, cell projection morphogenesis, neuron projection development, cell part morphogenesis, neuron development, cell morphogenesis, cell projection organization, cellular component morphogenesis, neuron differentiation, IGF-1 signaling pathway, IL6 signaling pathway, insulin signaling pathway, signaling of hepatocyte growth factor receptor, embryonic appendage morphogenesis, embryonic limb morphogenesis, limb morphogenesis, appendage morphogenesis, limb development, appendage development, embryonic morphogenesis, response to ethanol, response to metal ion, response to inorganic substance, response to drug, response to estrogen stimulus, positive regulation of protein modification process, regulation of protein modification process, protein amino acid phosphorylation, phosphorylation, phosphate metabolic process, phosphorus metabolic process, cell aging, negative regulation of neuron apoptosis, aging, actin cytoskeleton organization, actin filament-based process, membrane organization, membrane insoluble fraction, Ras protein signal transduction, long-term depression, the B cell receptor signaling pathway, VEGF signaling pathway, Fc epsilon RI signaling pathway, ErbB signaling pathway, gap junction, gonadotropin-releasing hormone (GnRH) signaling pathway, T cell receptor signaling pathway, insulin signaling pathway, small GTPase-mediated signal transduction, chemokine signaling pathway, regulation of actin cytoskeleton, MAPK signaling pathway, axonogenesis, cell morphogenesis involved in neuron differentiation, cell morphogenesis involved in differentiation, nucleoplasm, nuclear lumen, intracellular organelle lumen, organelle lumen, membrane-enclosed lumen, hemopoiesis, hemopoietic or lymphoid organ development, immune system development, and transcription regulation (Table 12).
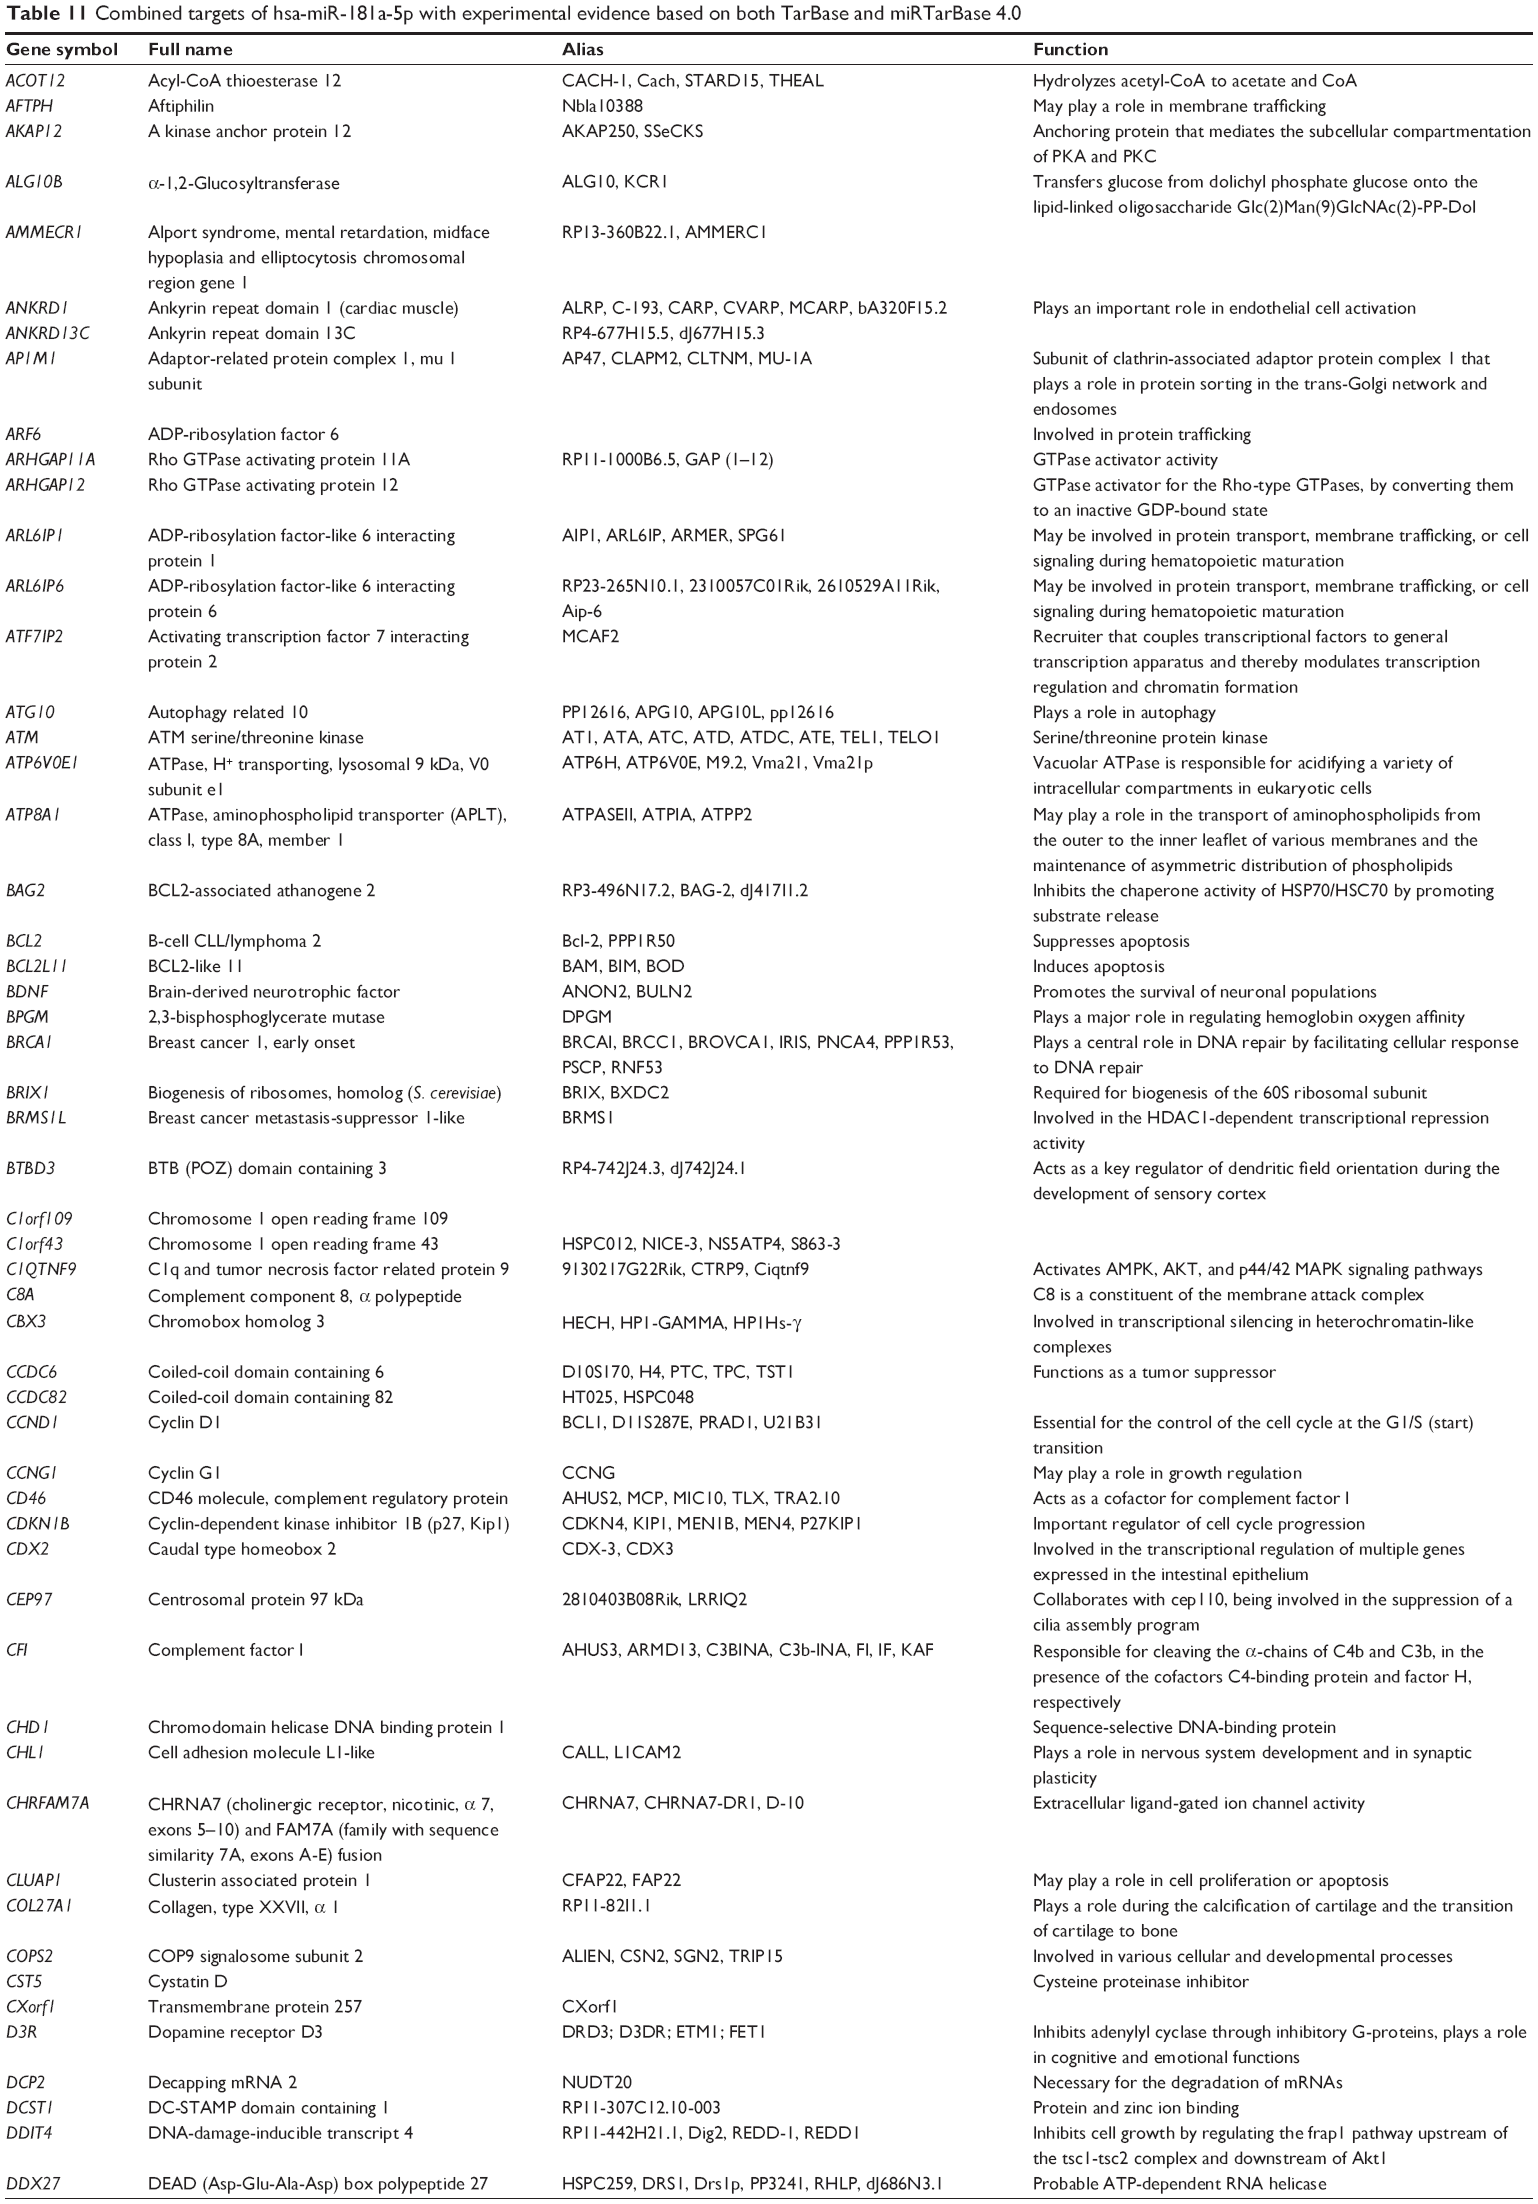 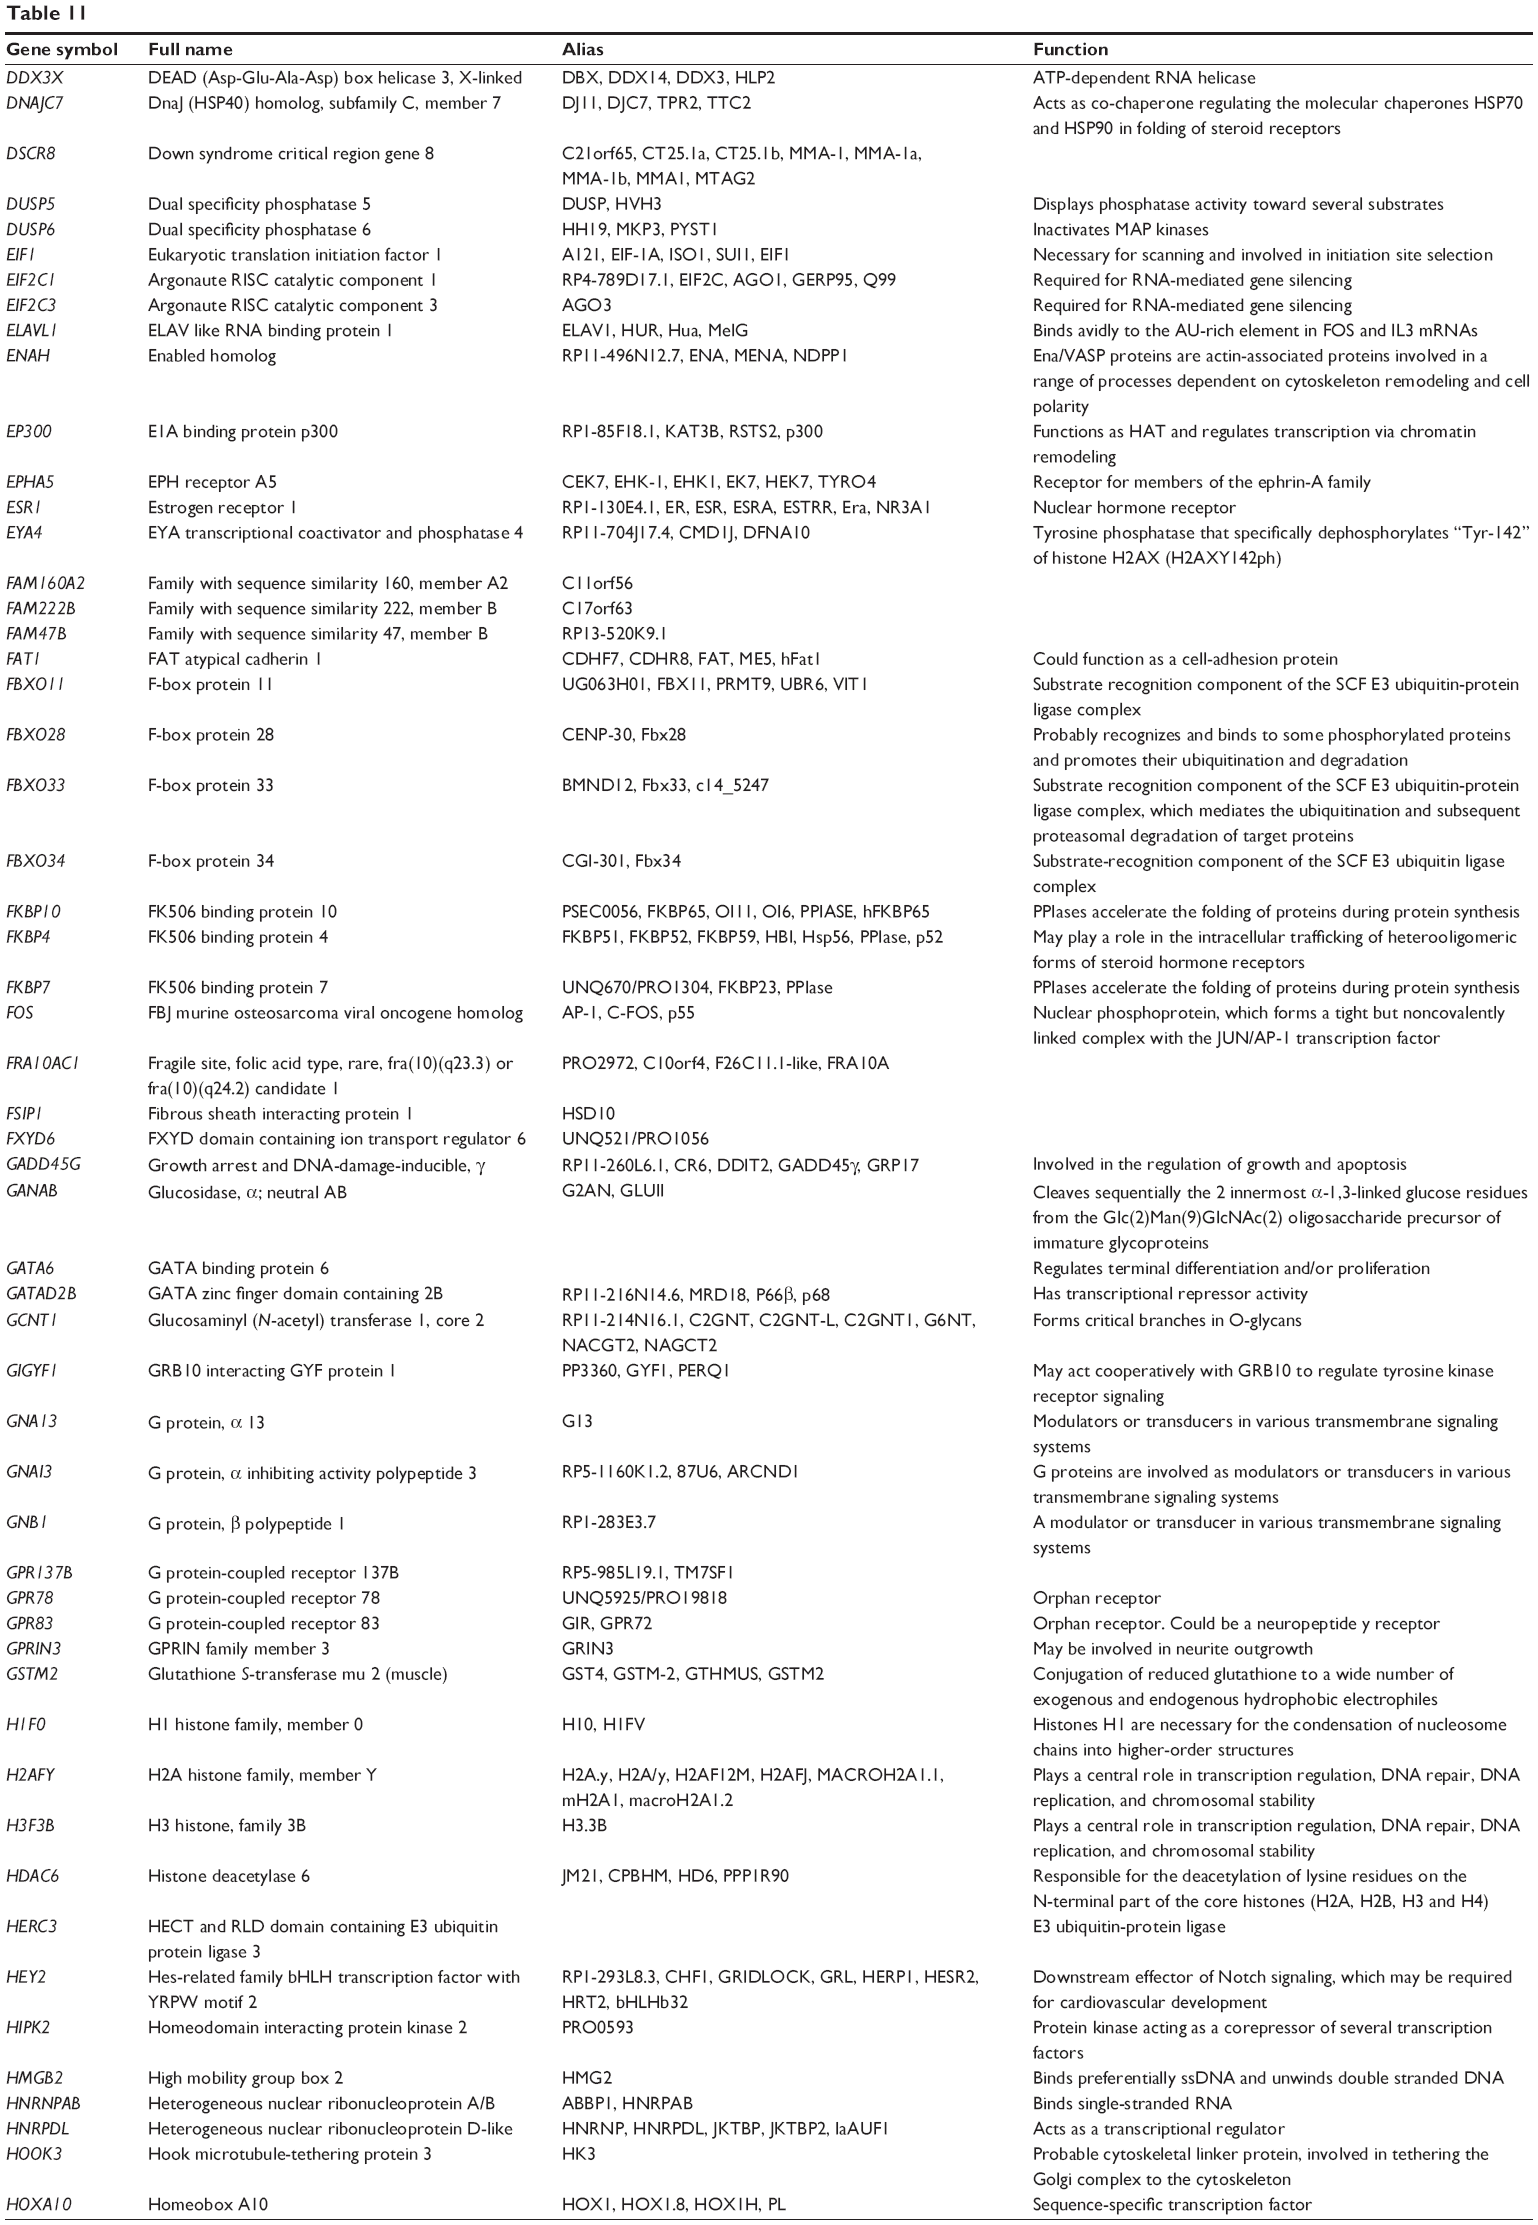 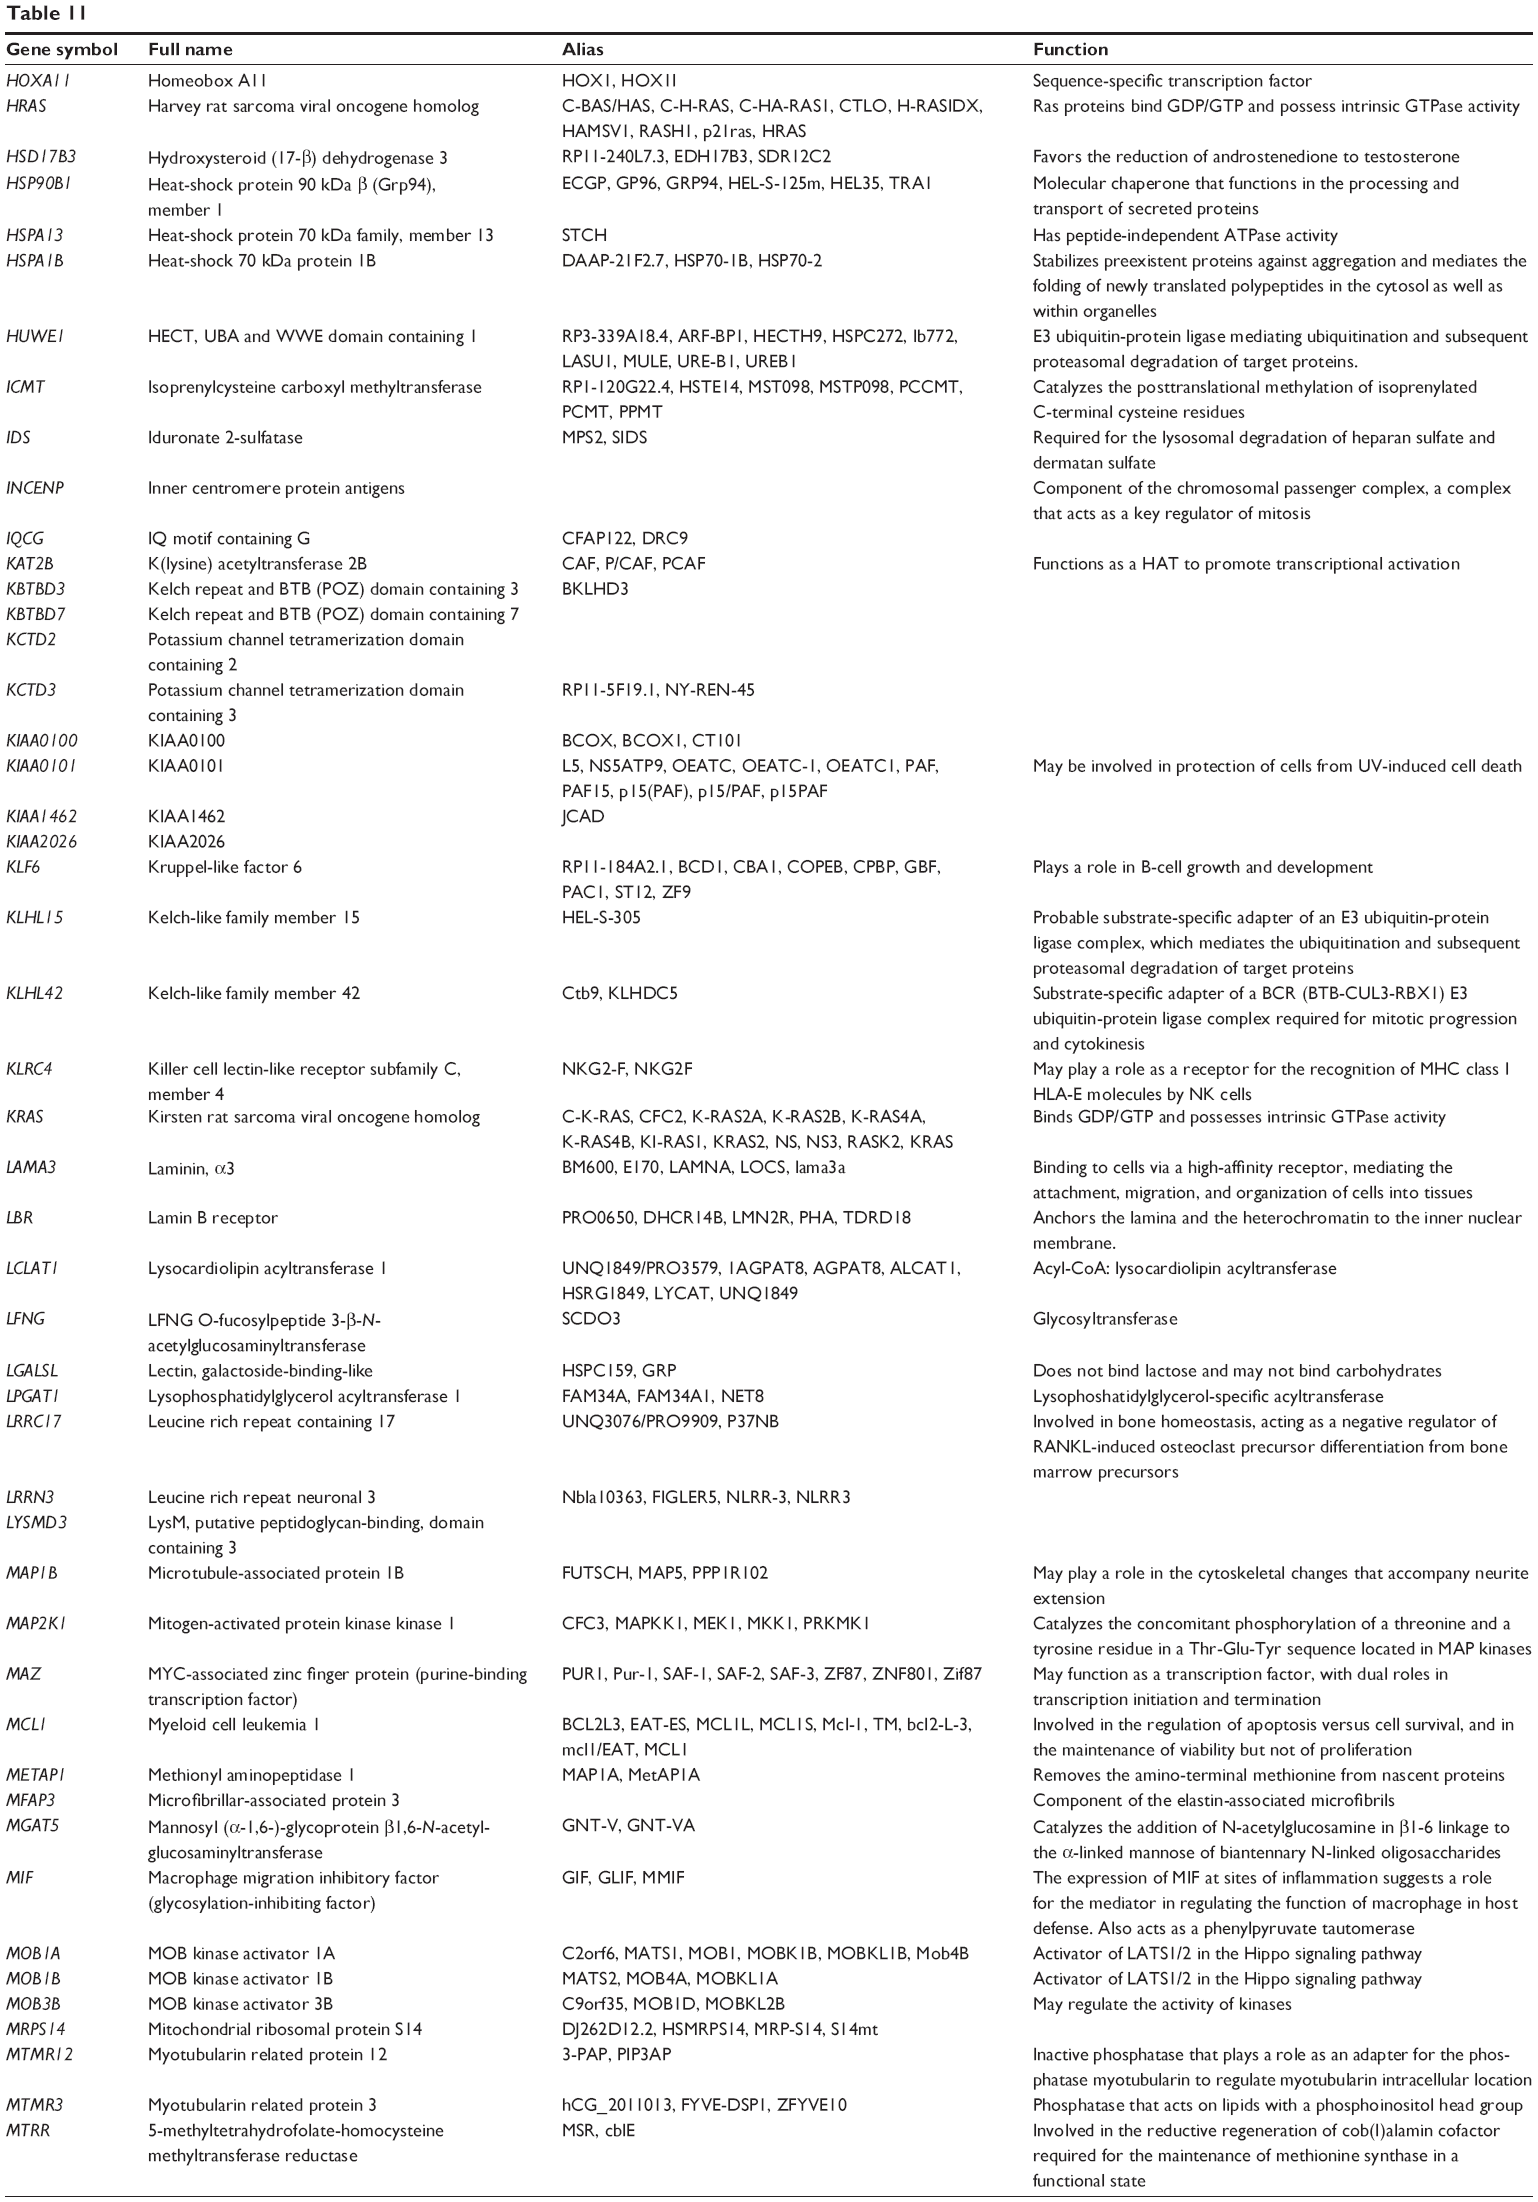 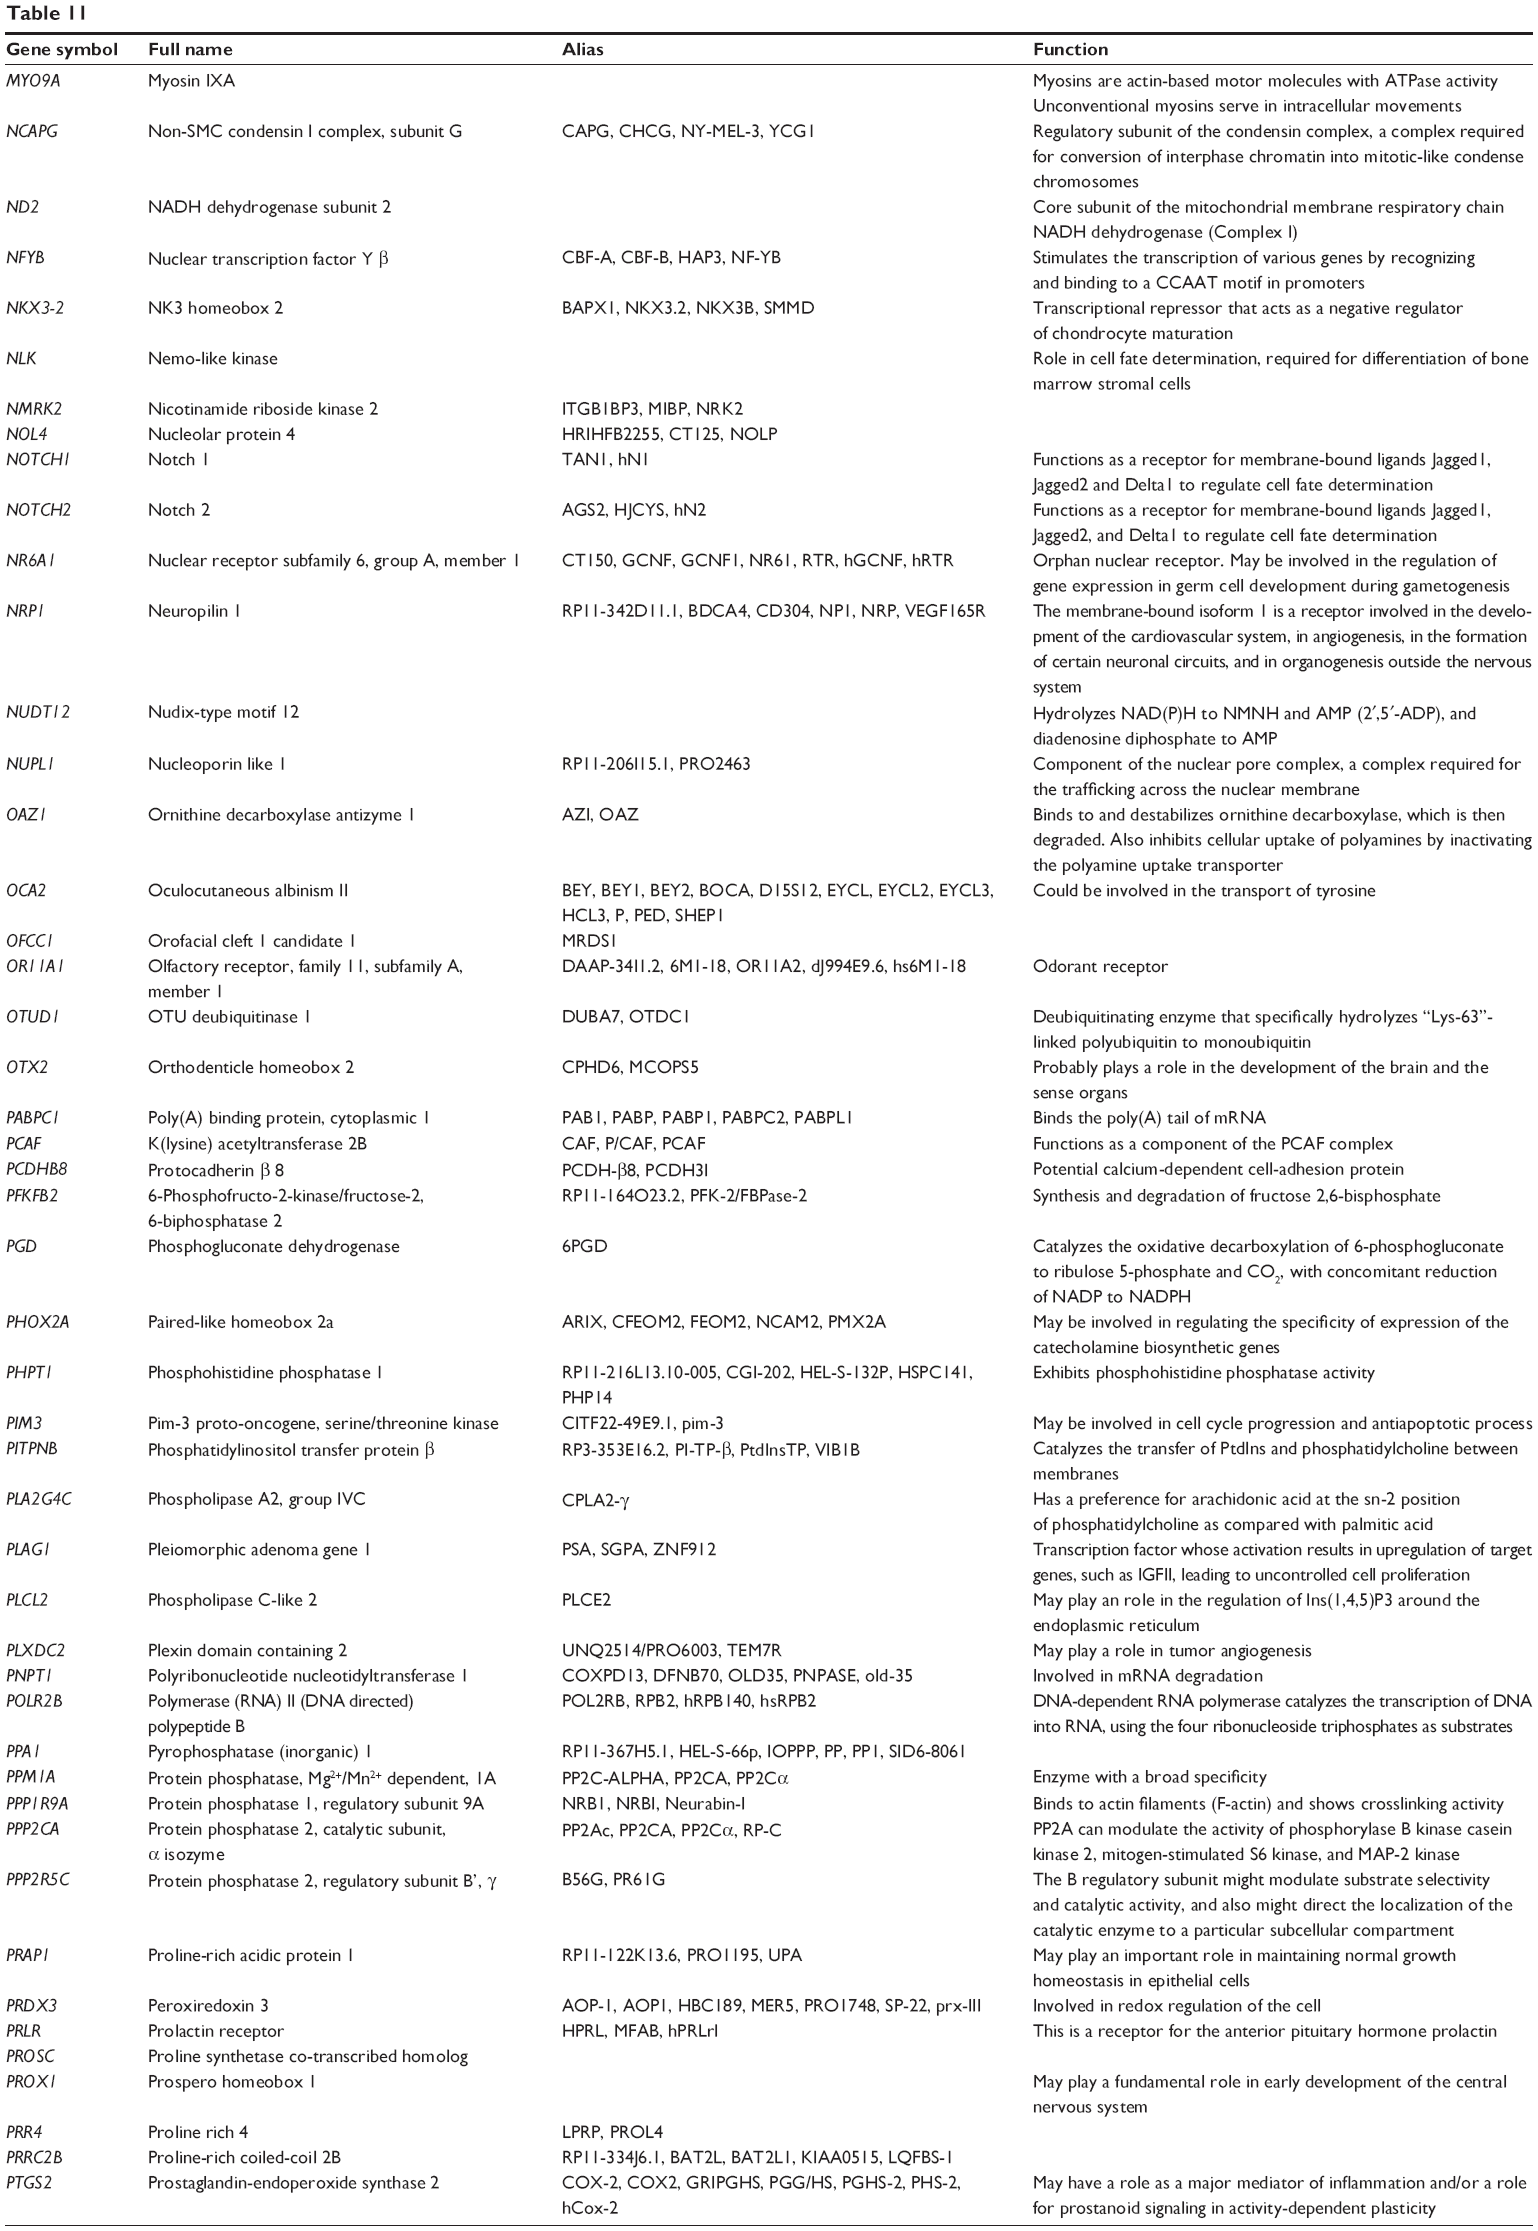 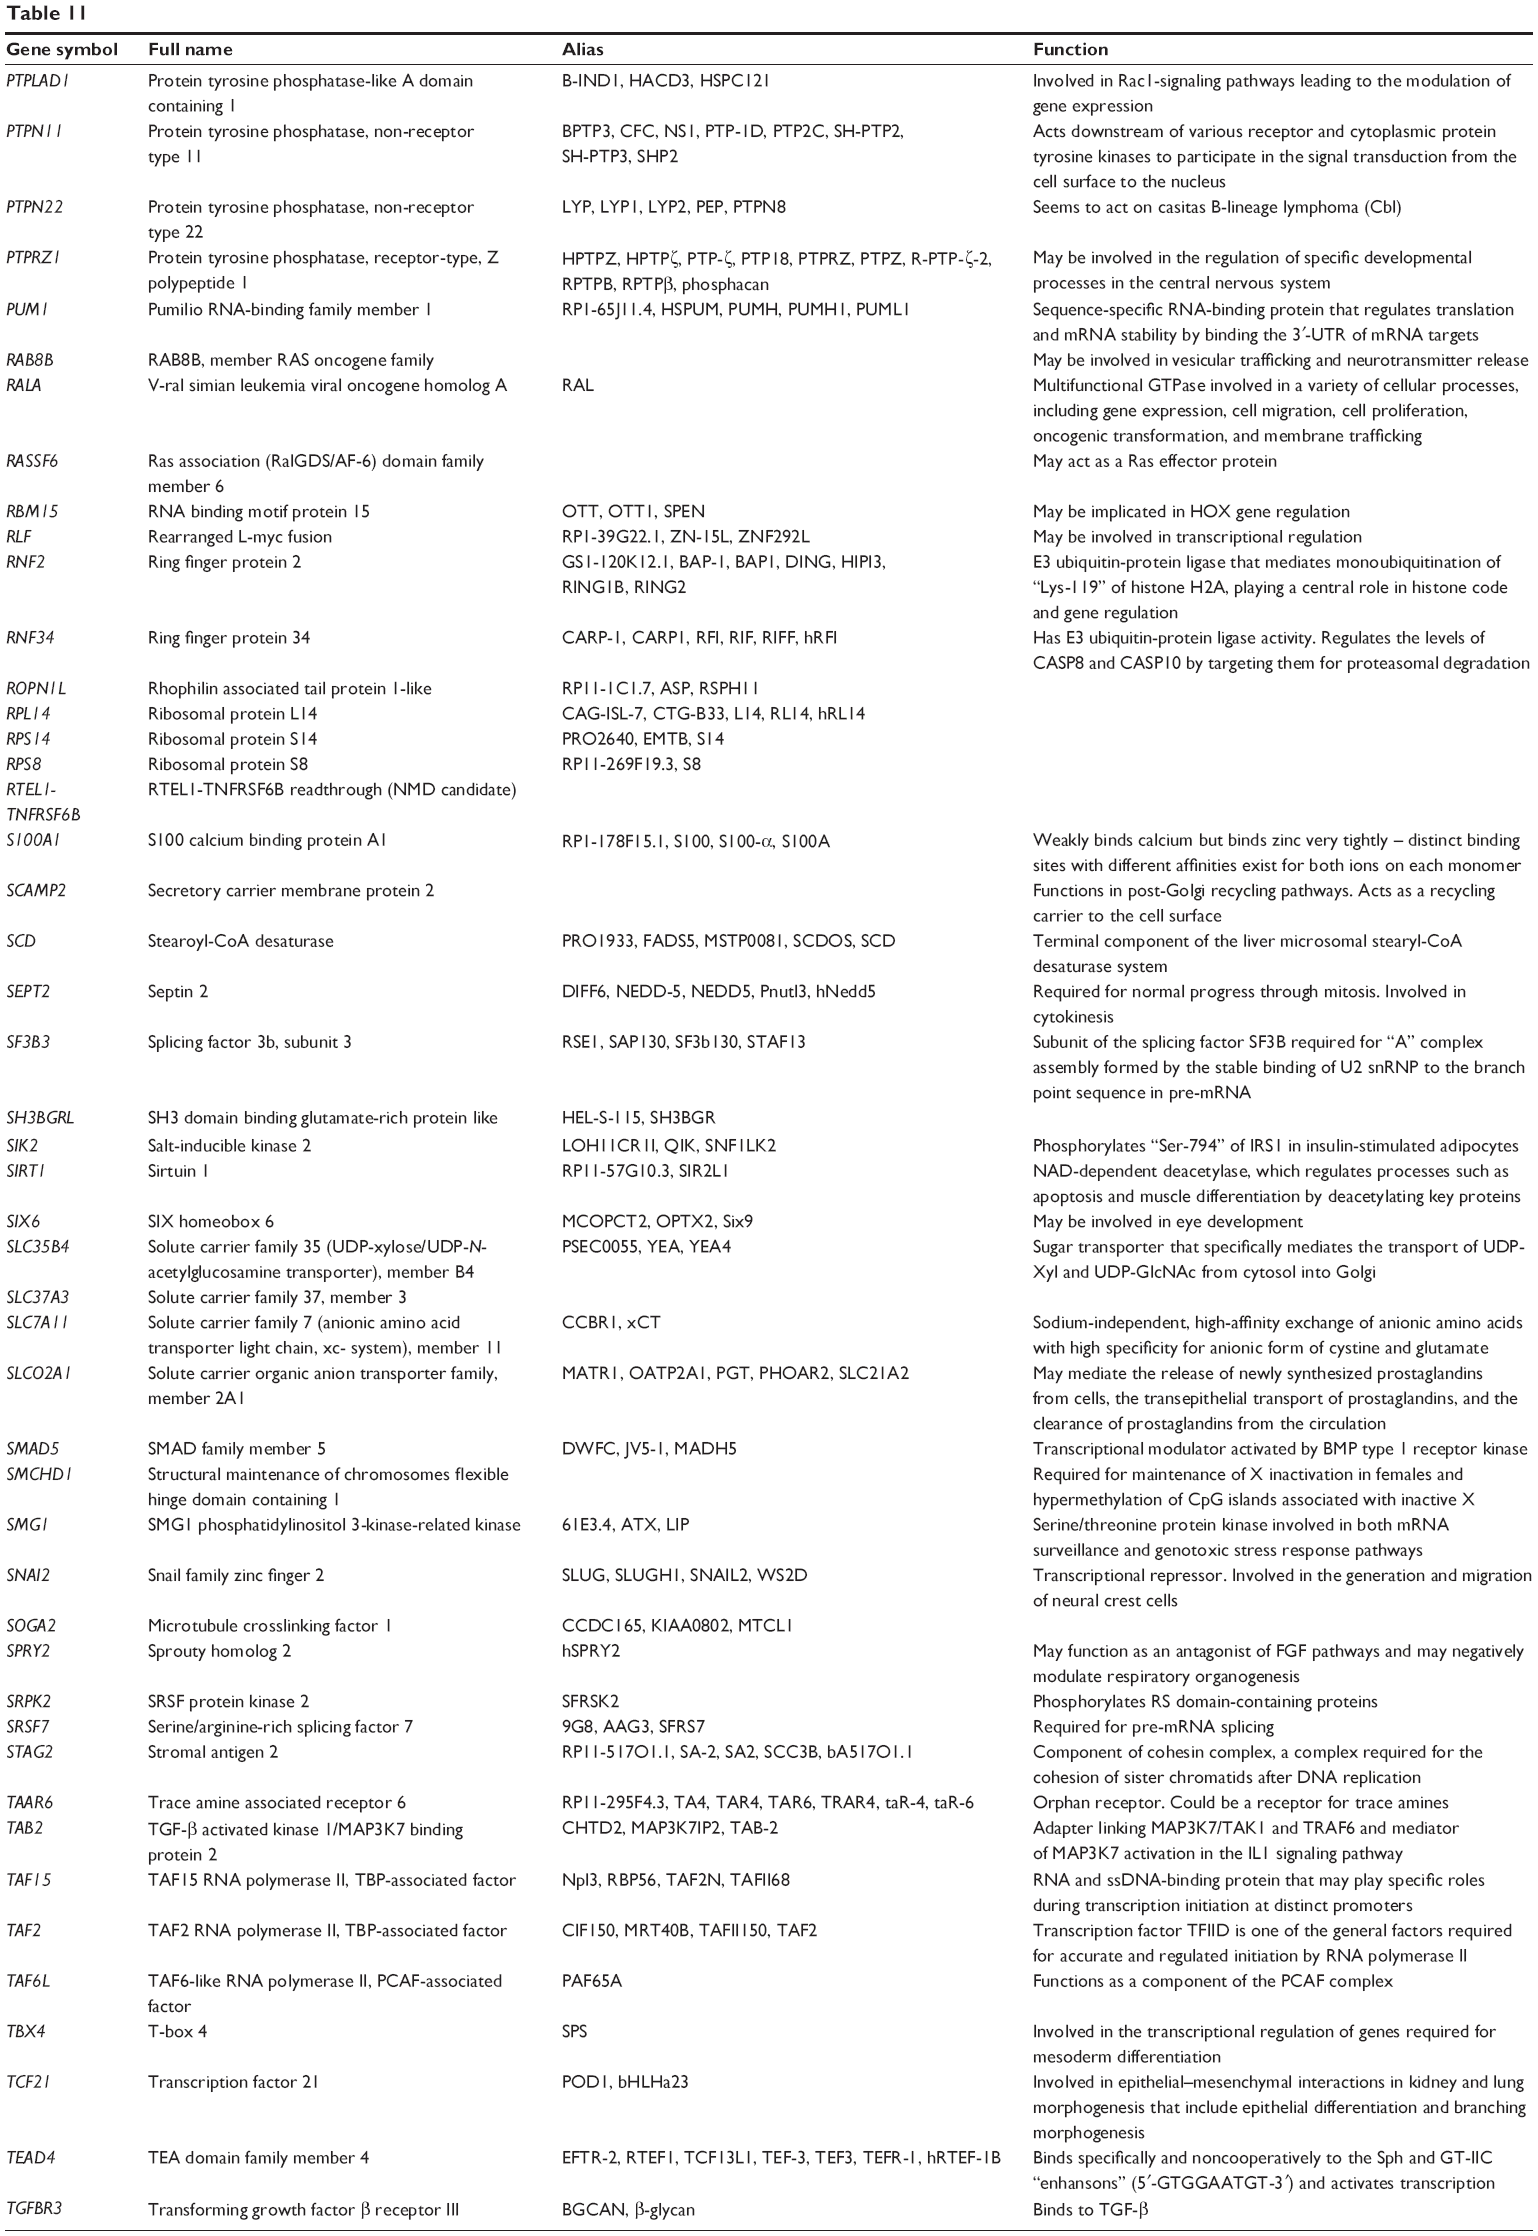 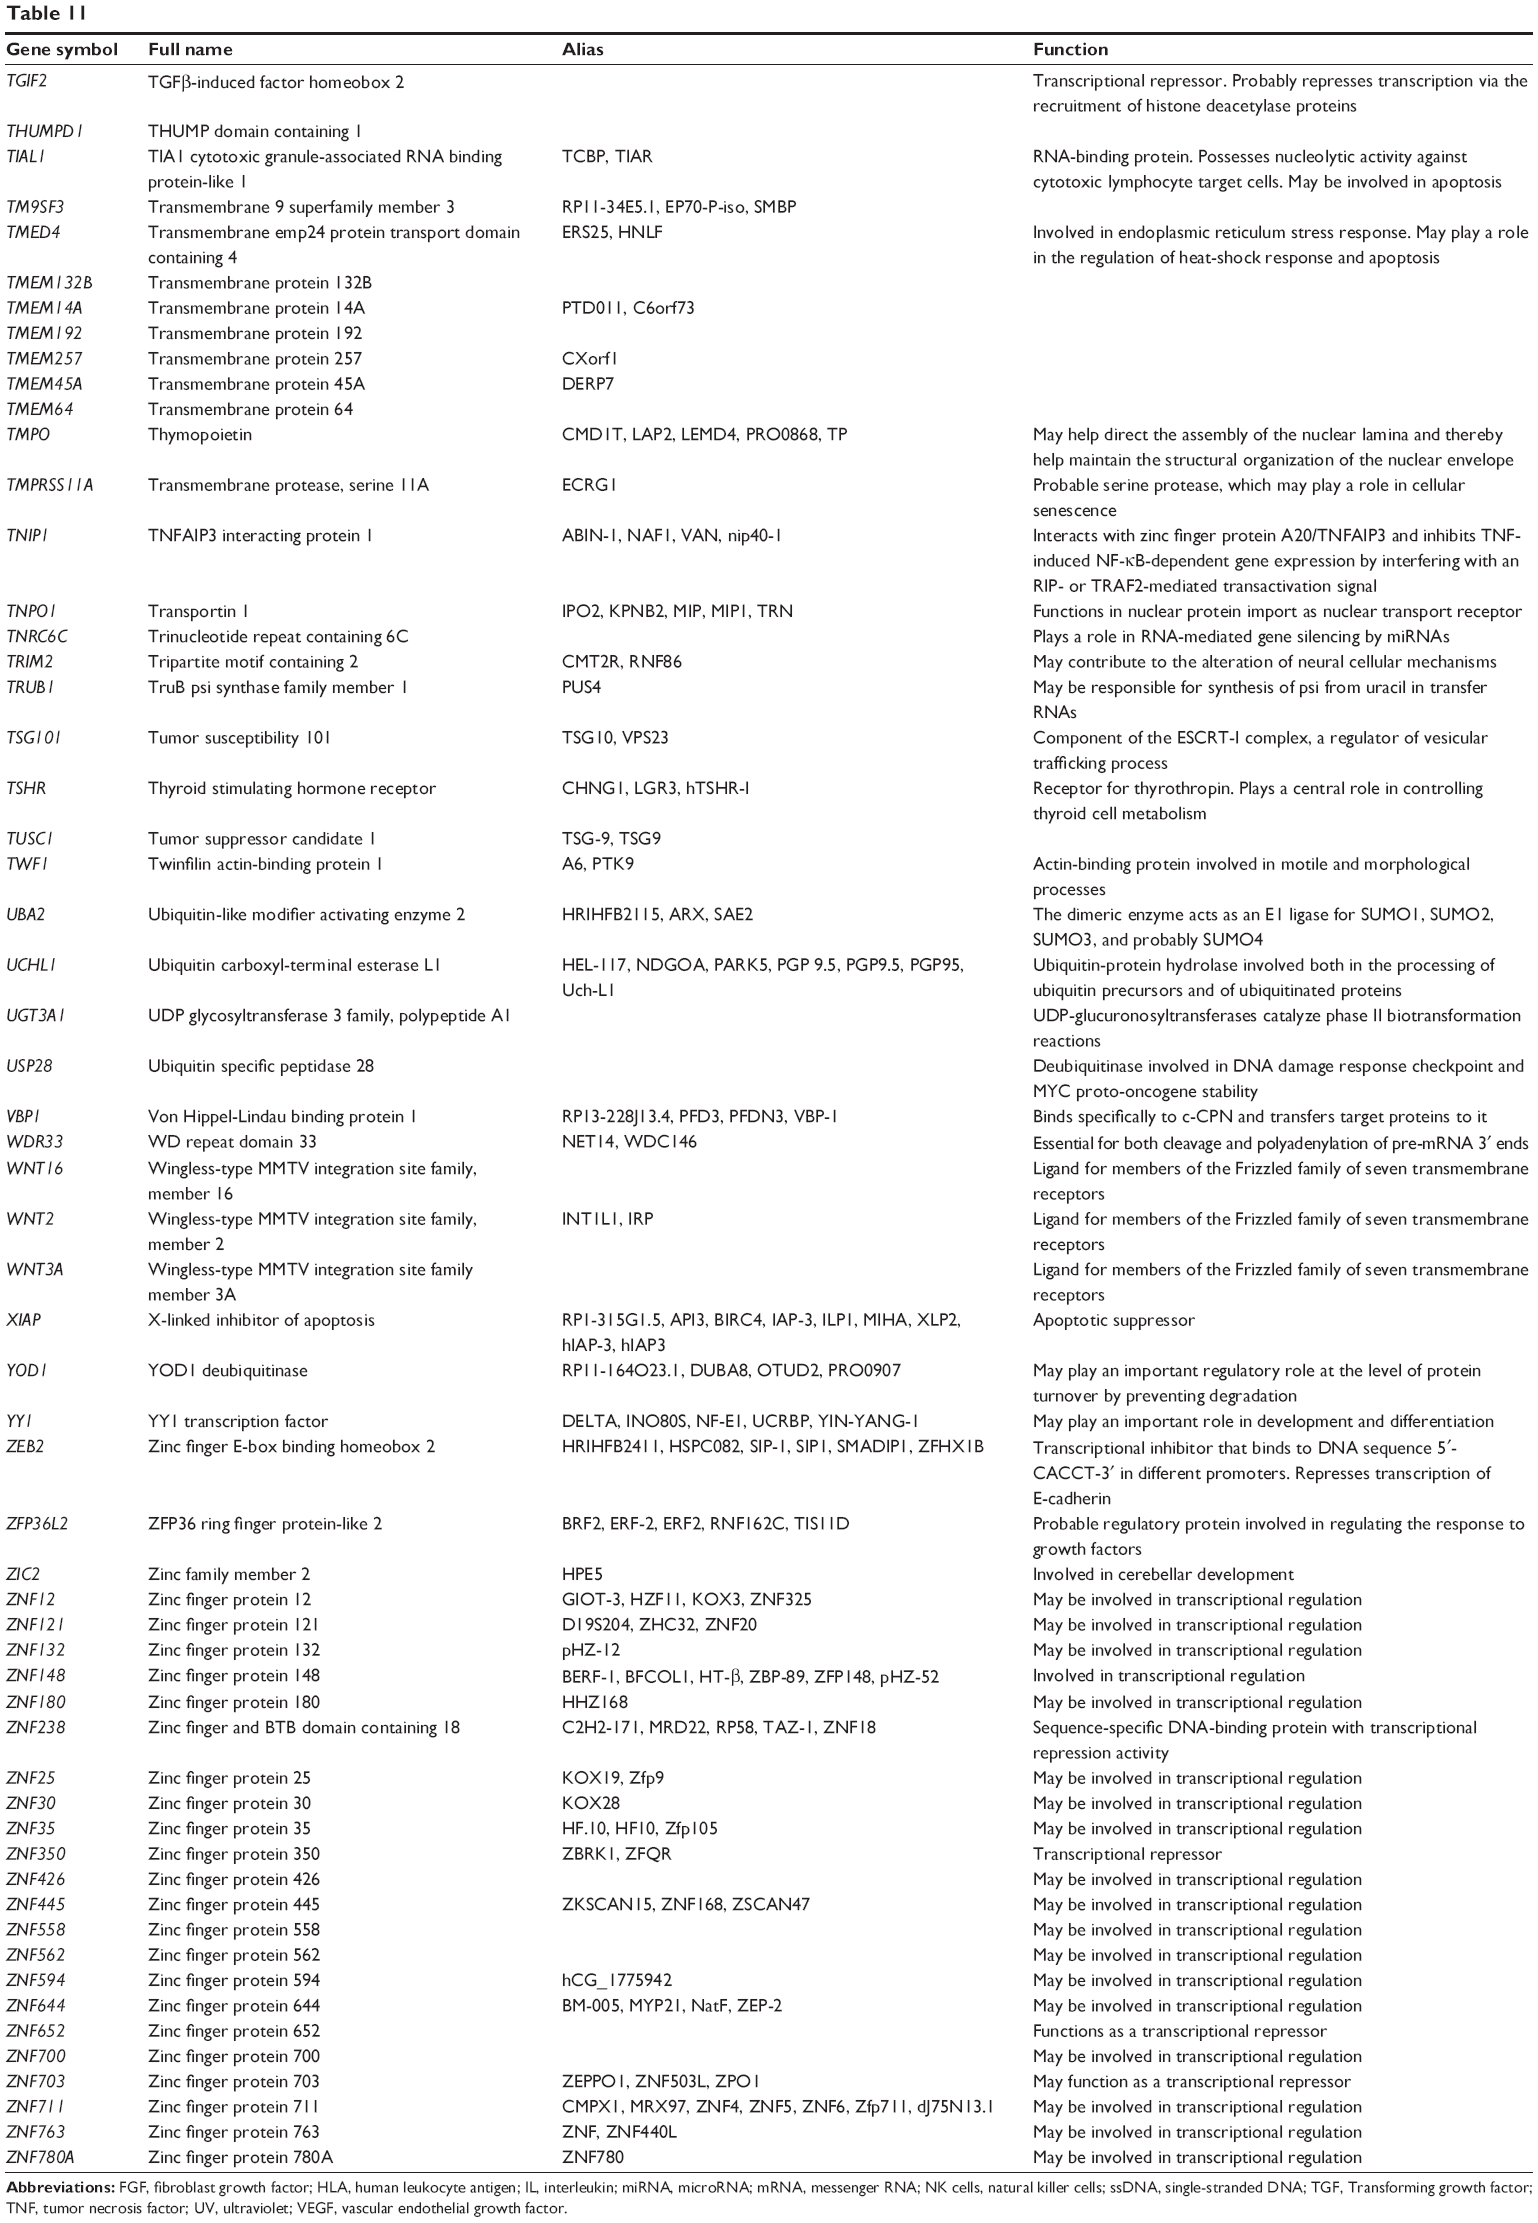 | Table 11 Combined targets of hsa-miR-181a-5p with experimental evidence based on both TarBase and miRTarBase 4.0 |
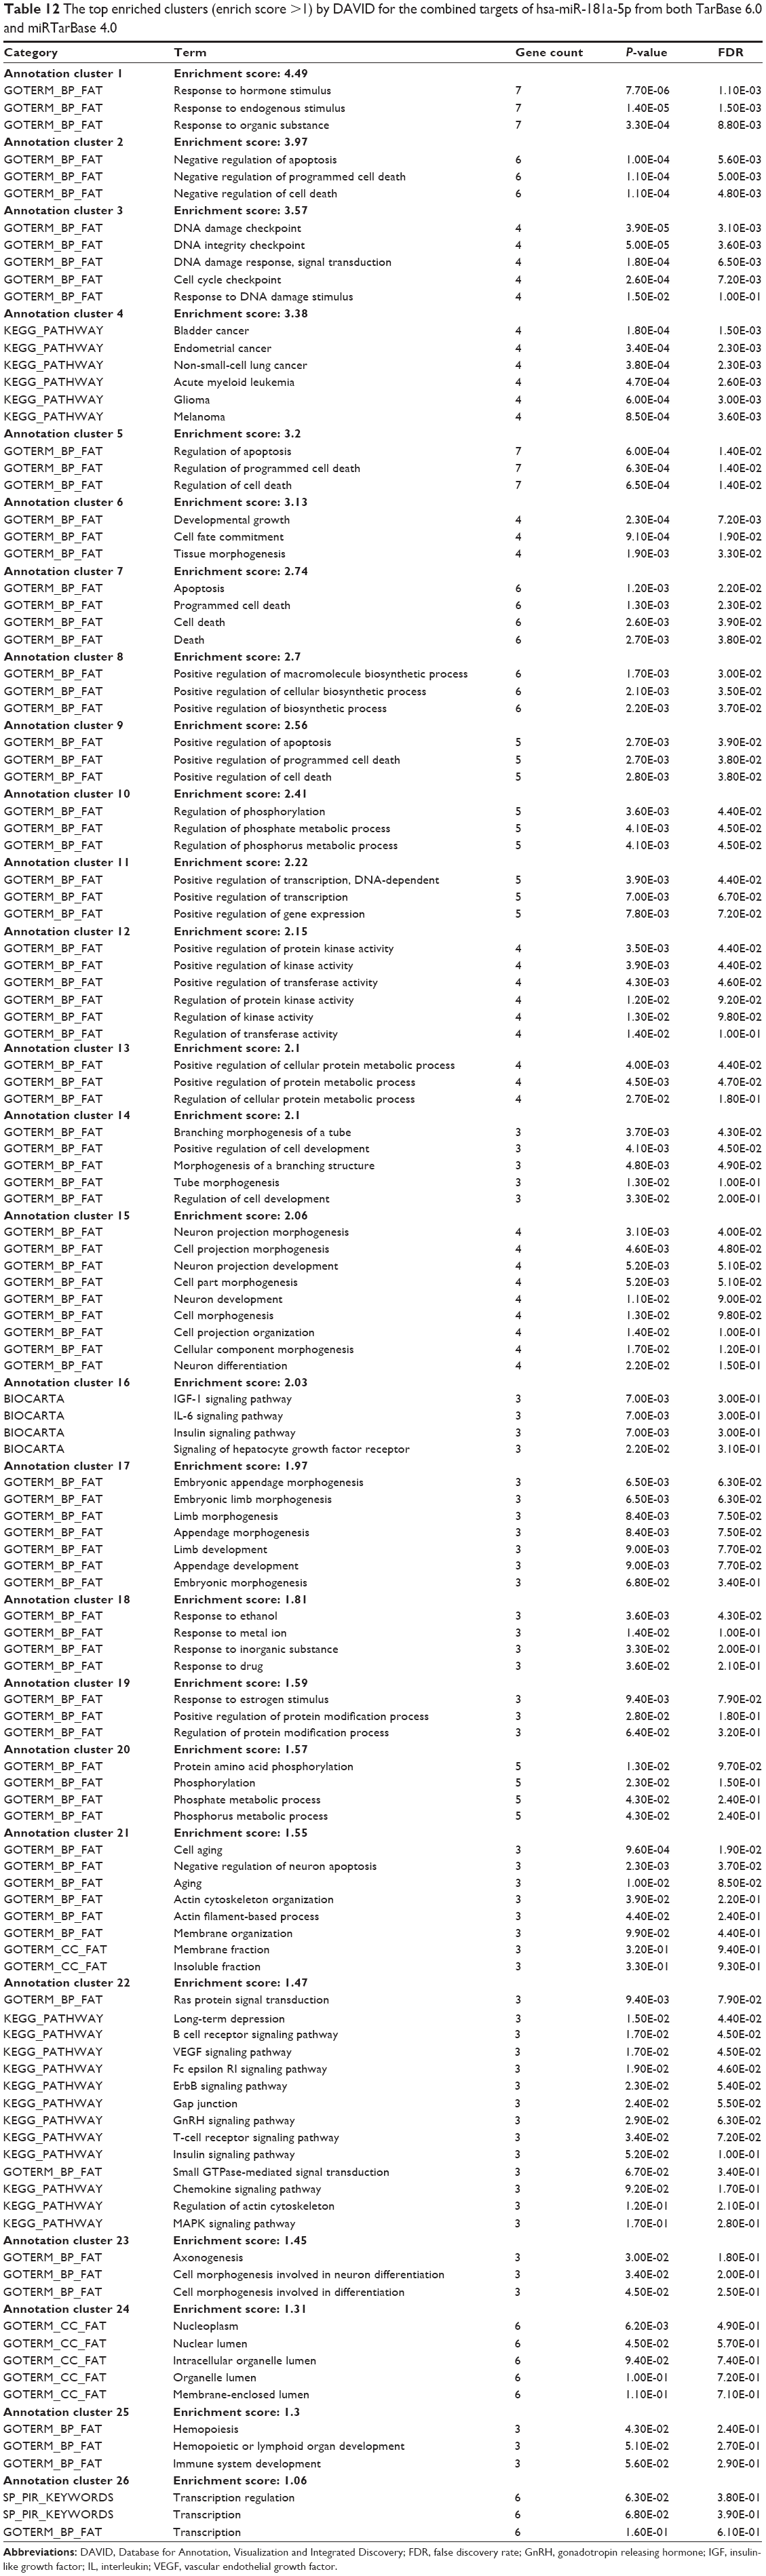 | Table 12 The top enriched clusters (enrich score >1) by DAVID for the combined targets of hsa-miR-181a-5p from both TarBase 6.0 and miRTarBase 4.0 |
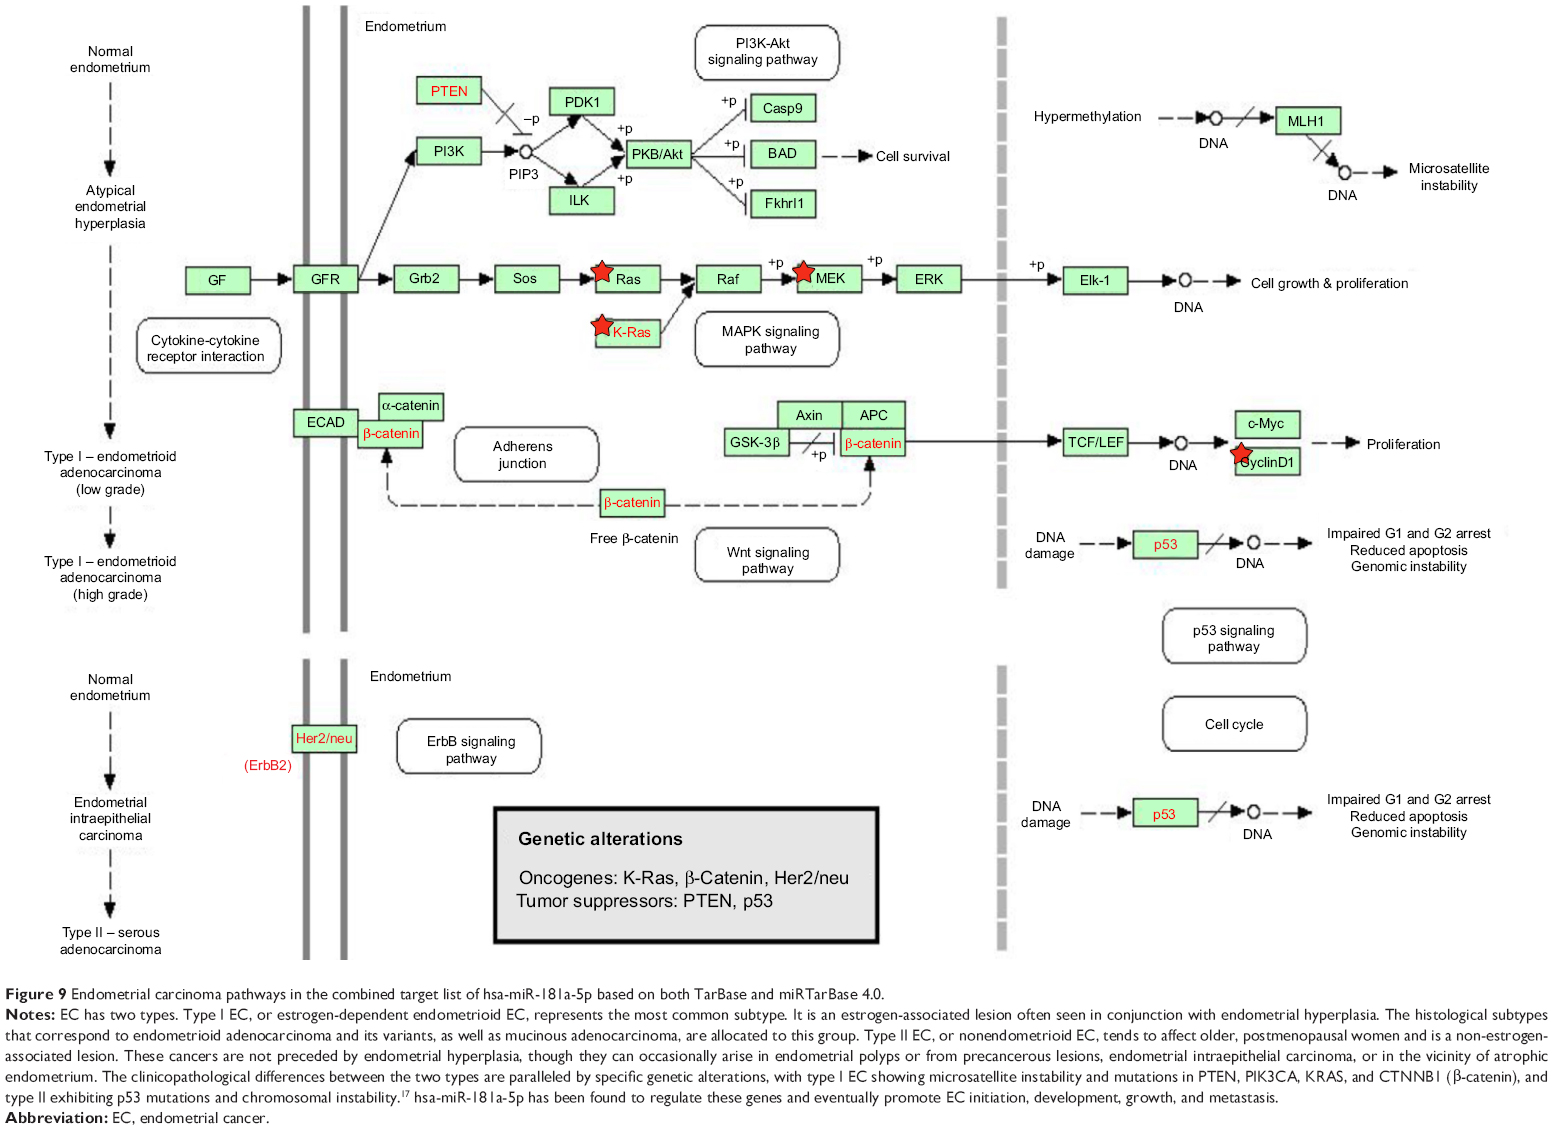 | Figure 9 Endometrial carcinoma pathways in the combined target list of hsa-miR-181a-5p based on both TarBase and miRTarBase 4.0. |
Furthermore, our DAVID analysis revealed that there were 33 KEGG pathways significantly enriched in the target list of hsa-miR-181a-5p, based on both TarBase and miRTarBase (Table 13). These pathways included pathways in cancer, prostate cancer, thyroid cancer, renal cell carcinoma, chronic myeloid leukemia, neurotrophin signaling pathway, dorsoventral axis formation, bladder cancer, endometrial cancer, non-small-cell lung cancer, acute myeloid leukemia, glioma, long-term potentiation, melanoma, colorectal cancer, melanogenesis, cell cycle, natural killer cell–mediated cytotoxicity, focal adhesion, notch signaling pathway, long-term depression, pancreatic cancer, B cell receptor signaling pathway, VEGF signaling pathway, Fc epsilon RI signaling pathway, ErbB signaling pathway, gap junction, GnRH signaling pathway, T cell receptor signaling pathway, insulin signaling pathway, Jak-STAT signaling pathway, chemokine signaling pathway, and prion diseases.
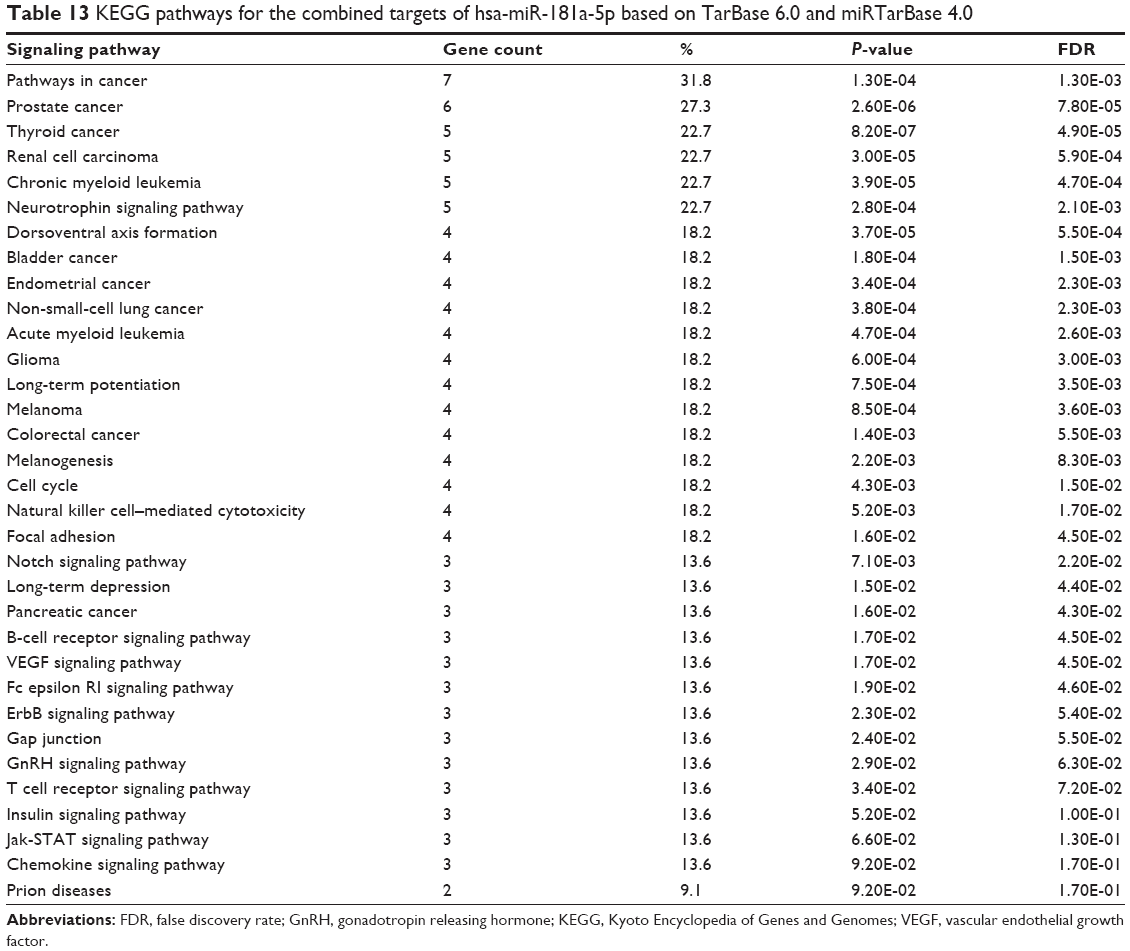 | Table 13 KEGG pathways for the combined targets of hsa-miR-181a-5p based on TarBase 6.0 and miRTarBase 4.0 |
Among the 313 validated targets of hsa-miR-181a-5p, 22 were cancer genes (Table 14). These included ATM, BCL2, BRCA1, CCDC6, CCND1, CDX2, EP300, FBXO11, H3F3B, HOOK3, HOXA11, HRAS, KRAS, MAP2K1, NOTCH1, NOTCH2, PLAG1, PTPN11, RBM15, STAG2, TAF15, and TSHR. The KEGG pathway analysis also indicate that the targets regulated by hsa-miR-181a that are cancer genes are all involved in the tumorigenesis of bladder cancer, endometrial cancer, non-small-cell lung cancer, acute myeloid leukemia, glioma, melanoma, and colorectal cancer.
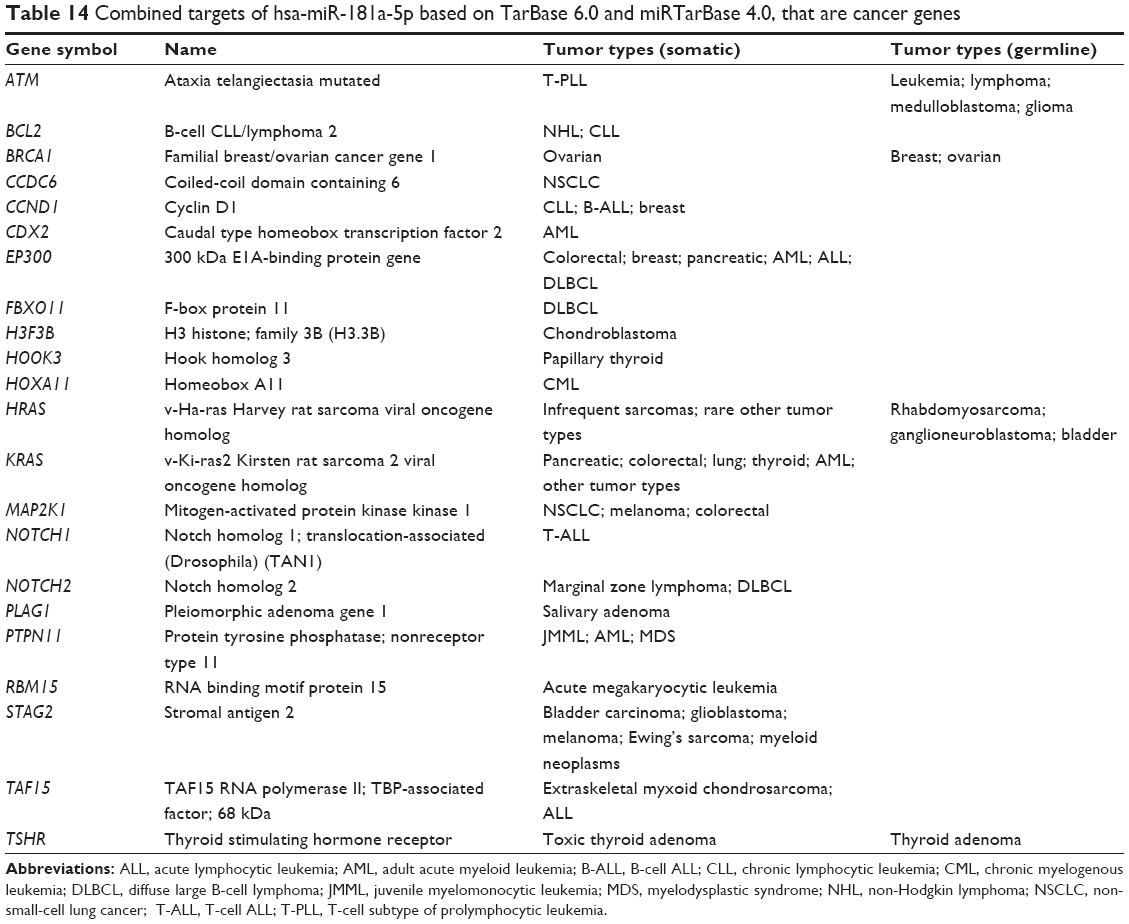 | Table 14 Combined targets of hsa-miR-181a-5p based on TarBase 6.0 and miRTarBase 4.0, that are cancer genes |
Now when we looked at the prediction accuracy of all the nine algorithms we used, we found that all the predicting programs behaved poorly. The reasons for this may include: a) the predicting criteria were not set up properly; b) the matching criteria for hsa-miR-181a with the complementary sites of the target mRNAs may have been too restrictive or too loose; c) the value for the threshold was not properly set prior to prediction; and d) the calculation of the P-values may have been too simple or too complicated. The poor predictive ability for all these algorithms also emphasizes the importance of experimental validation of the targets of any specific miRNAs.
Clinical validation of the role of hsa-miR-181a in EC tumorigenesis
Next, we aimed to validate the function of hsa-miR-181a in the pathogenesis of EC by measuring and comparing the expression levels of hsa-miR-181a in normal, benign, and malignant endometrial tissues. The association of disease progression of EC with the expression profile of hsa-miR-181a was also determined. There are two types of EC with distinct histological characteristics.15,51 Herein, a total of 78 tissue samples were classified by immunohistochemical staining. There were 47, 18, and 13 samples that were categorized as EC, endometrial hyperplasia, or normal endometrium, respectively. For the EC group, there were 37 samples, and 10 samples that belonged to type I and type II EC, respectively. The type I EC was ER- and PR-positive (Figure 10), and the type II EC was ER- and PR-negative (Figure 11).
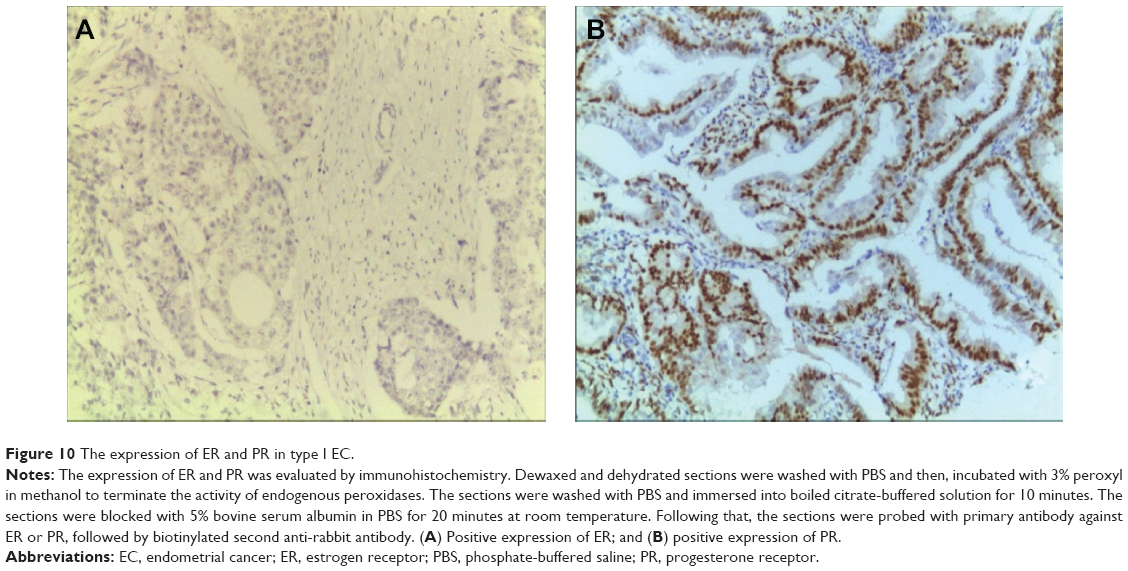 | Figure 10 The expression of ER and PR in type I EC. |
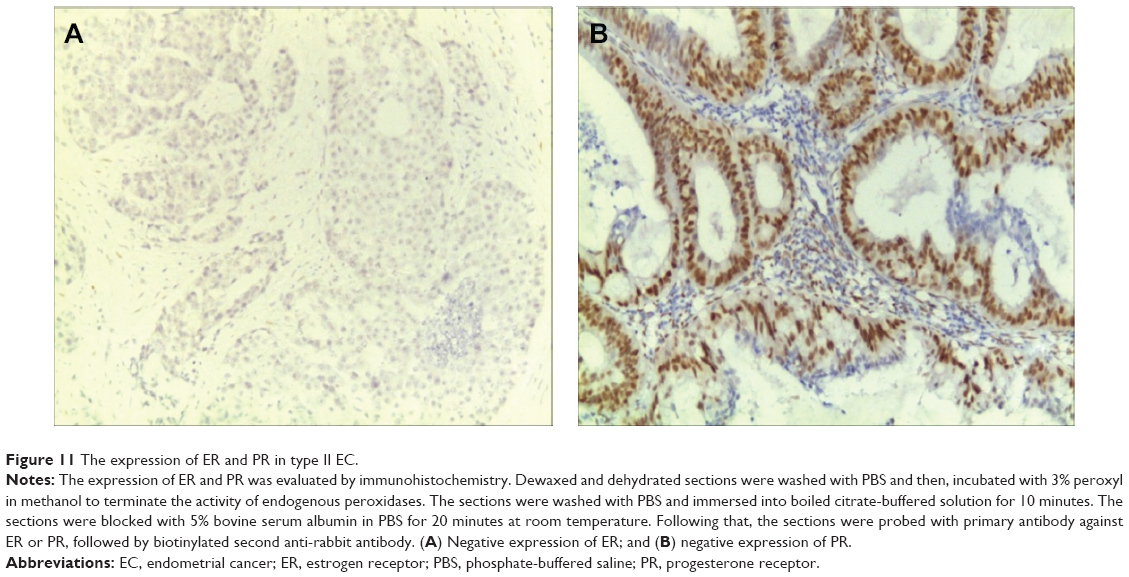 | Figure 11 The expression of ER and PR in type II EC. |
To examine the potential role of hsa-miR-181a in the development and progression of EC, the expression profile of hsa-miR-181a was tested in all collected clinical samples, using RT-PCR (Figure S1). In comparison with normal endometrium, the expression level of hsa-miR-181a was increased 8.5-, 31.2-, and 4.1-fold in type I EC, type II EC, and endometrial hyperplasia, respectively (P<0.05, by one-way ANOVA) (Tables 15 and 16). The expression level of hsa-miR-181a in type II EC was higher (3.7-fold) than that in type I EC (P<0.05). In addition, hsa-miR-181a had a higher expression level in EC than that in endometrial hyperplasia.
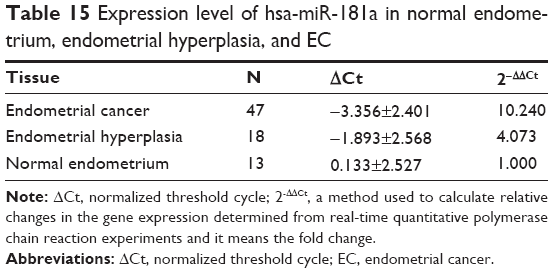 | Table 15 Expression level of hsa-miR-181a in normal endometrium, endometrial hyperplasia, and EC |
 | Table 16 Differential expression level of hsa-miR181a in endometrium tissues |
Since we have observed the differential expression profile of hsa-miR-181a in all examined clinical samples, we further assessed the association between the expression of hsa-miR-181a and the development of EC with regard to histological type, stage, grade, migration, and invasion. As shown in Table 17, compared with the stage I and II EC, there was a remarkable increase in the expression level of hsa-miR-181a in stage III and VI EC (P=0.01, by one-way ANOVA). The expression level of hsa-miR-181a was increased in EC with lymph migration and myometrial invasion. In addition, compared with the grade 1 EC, there was an increase in the expression level of hsa-miR-181a in grade 2 and grade 3 EC (P>0.05; Table 17). Taken together, these results indicate that there is an association between the expression level of hsa-miR-181a and the clinical development and progression of EC.
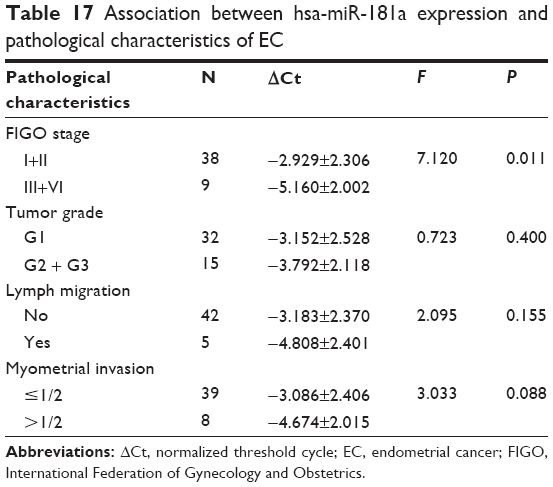 | Table 17 Association between hsa-miR-181a expression and pathological characteristics of EC |
Discussion
miRNAs play critical roles in regulating proliferation, differentiation, apoptosis, development, metabolism, and immunity.2 miRNAs may act as oncogenes or tumor suppressors, and they could play a potential role as diagnostic and prognostic biomarkers of cancers.7,52 Specific miRNAs are expressed in various tissues, and changes in regulation of gene expression are thought to cause carcinogenesis. Thus, tissue-specific miRNAs may be used as effective biomarkers for cancer diagnosis, treatment, and prognosis.8 Hsa-miR-181a has been proposed to play a role in the pathogenesis, development, progression, metastasis, prognosis, and therapeutic response to chemo- and radiotherapy in EC,4,53 ovarian cancer,54 glioma,30,55 liver cancer,56 colorectal cancer,57–59 gastric cancer,60,61 lung cancer,62 breast cancer,63–67 cervical carcinoma,68,69 pancreatic cancer,46 osteosarcoma,70 oral squamous cell carcinoma,71,72 B-cell lymphoma,73 thyroid cancer,74 salivary adenoid cystic carcinoma,75 and acute and chronic leukemias.76–81 Ciafrè et al,82 firstly reported that the expression of hsa-miR-181a was significantly downregulated in primary glioblastomas and human glioblastoma cell lines compared with normal brain tissue. As in glioblastoma, significant downregulation of hsa-miR-181a was also observed in squamous lung cell carcinoma,83 oral squamous cell carcinoma,71 luminal A-like breast cancer,67 and non-small-cell lung cancer.84 However, hsa-miR-181a was significantly overexpressed in MCF-7 breast cancer cells,85 colorectal cancer,28 and hepatocellular carcinoma cells.56,86,87 Hsa-miR-181a was upregulated in acute myeloid leukemia,76 especially in the M1 and M2 subtypes, and in myelodysplastic syndromes88 but downregulated in multiple myeloma89 and chronic lymphocyte leukemia.79,90 hsa-miR-181a can serve as an oncogene46,54,56–58,60,61,65,66,68–70,87,91 or tumor suppressor,55,67,71,75,78,79,92 implicating its multifaceted and complex roles in the regulation of its target genes and signaling pathways associated with cancer initiation, growth, development, progression, and metastasis.
In the present study, our bioinformatic study predicted that hsa-miR-181a could regulate a large number of targets, including proteins that participate in regulation of cell proliferation, cell cycle, apoptosis, autophagy, metabolism, signaling transduction, and transport. A further search in TarBase and miRTarBase identified 313 targets of hsa-miR-181a-5p, and 22 of these genes are cancer genes that play critical roles in the tumorigenesis of various cancers.
During the prediction process, we employed ten different predicting programs that are based on different matching criteria and calculating algorithms. All the algorithms displayed disappointing predictive accuracy and ability when compared with the validated targets of hsa-miR-181a. It appears that there is a need to refine or combine these algorithms to improve their predictive accuracy and ability. Indeed, most of these prediction algorithms, including RNAhybrid, miRanda, TargetScan, DIANA microT, and PicTar exhaustively analyze all the possible miRNA: mRNA pairs, searching for structural evidence that could suggest the existence of an interaction. Although these approaches are significantly cheaper than those based on experimental validation, results of these methods are in many cases uncorrelated to each other, and their degree of overlap is low as shown in this study. The weakness of these algorithms depends on many factors, especially on the impossibility of incorporating in a single model all the possible interplaying variants/factors that can affect miRNA targeting and the prediction outcomes, especially in mammals. Different results can also depend on the approach used and on the rules considered for the miRNA targeting, as well as on the type of resource of sequences they use as a reference dataset.93 Shirdel et al94 found that the precision and recall values computed against validated interactions of a specific algorithm were generally poor, but a combination of these algorithms can improve the prediction precision. Recently, some machine learning approaches have been incorporated, to learn to combine the outputs of distinct prediction algorithms and improve their accuracy.95–97 Zhang and Verbeek97 proposed the application of a supervised learning algorithm, ie, a Bayesian network learner, to distinct sets of features considered in three prediction algorithms, including RNAhybrid, miRanda, and TargetScan. Pio et al96 proposed a semisupervised ensemble learning approach using miRTarBase as the set of labeled (positive) interactions and microRNA Data Integration Portal (mirDIP) as the set of unlabeled interactions, and the predictive accuracy was improved.
We next compared the expression levels of hsa-miR-181a in normal endometrium, endometrial hyperplasia, and type I and type II EC. We found that the expression level of hsa-miR-181a was significantly higher in EC than that in normal endometrium and that advanced EC exhibited a higher expression level of hsa-miR-181a. These observations demonstrate that there was an association between the expression level of hsa-miR-181a and the progression of EC and that hsa-miR-181a might serve as an oncogene in the development and progression of EC.
Many miRNAs are aberrantly expressed in cancer, resulting in functional alterations in cell differentiation, proliferation, migration, invasion, programmed cell death, and survival.5,6,8,53 A number of oncogenes and tumor-suppressor genes could be potentially regulated by miRNAs. miRNAs are presumed to be a class of genes involved in human tumorigenesis, and miRNA-mediated gene regulation is an important cellular biologic process in cancer development.5,6,8,53 For example, let-7 acts as tumor suppressor gene, which was found to be downregulated in lung tumors and associated with a poor postoperative prognosis.98 It has been showed that the RAS oncogene was regulated by let-7 and that a decreased expression level of let-7 in lung cancer resulted in an increase in the expression level of the RAS oncogene.99
Many studies have showed that upregulation of hsa-miR-181a promotes carcinogenesis, cancer cell growth, and metastasis in a variety of cancers, via regulation of a number of molecular targets and signaling pathways related to cell proliferation, invasion, migration, survival, and cell death.46,54,56–58,60,61,65,66,68–70,87,91 Zou et al87 observed an increase in the expression level of hsa-miR-181a, which may contribute to the development and progression of hepatocellular carcinoma via targeting of E2F transcription factor 5, p130-binding (E2F5). hsa-miR-181a was also upregulated in hepatocellular cancer stem cells.86,100 Silencing hsa-miR-181 led to a decreased motility and invasion of hepatocellular cancer stem cells, via targeting of the putative tumor suppressor Ras association domain family 1 isoform A (RASSF1), metalloproteinase inhibitor 3 (ie, TIMP3), and nemo-like kinase (NLK).100 hsa-miR-181 could directly target hepatic transcriptional regulators of differentiation, including caudal type homeobox 2 (CDX2), GATA binding protein 6 (GATA6), and NLK, an inhibitor of Wnt/β-catenin signaling.86 hsa-miR-181a promoted tumor growth and liver metastasis in colorectal cancer patients by targeting the tumor suppressor WNT inhibitory factor 1 (WIF1).28 hsa-miR-181a was most elevated in these colorectal cancer patients with liver metastases and could serve as an independent prognostic factor of poor overall survival.28 hsa-miR-181a showed a potent tumor-promoting effect through inhibition of the expression of WIF1 and promotion of epithelial–mesenchymal transition.28 Moreover, upregulation of hsa-miR-181a plays a potential role in the development of gastric cancer by targeting the tumor suppressor ATM serine/threonine kinase (ATM). Consequently, it leads to promotion of gastric cancer cell proliferation and inhibition of apoptosis. Wei et al101 showed that the PTEN/Akt signaling pathway was involved in the regulatory effect of hsa-miR-181a in the development of colon cancer, by promoting cell growth. hsa-miR-181a also played an important role in ovarian cancer progression, by promoting epithelial–mesenchymal transition.54 These data indicate that hsa-miR-181a may function as oncogenic miRNA in cancer development and progression. In agreement with previous studies, our findings showed that there was a significant increase in the expression level of hsa-miR-181a in EC compared with that in normal endometrium. Moreover, our results showed that advanced EC had a significant higher expression level of hsa-miR-181a than that in early stage of EC, suggesting that hsa-miR-181a may have a critical role in tumor metastasis of advanced EC.
On the other hand, hsa-miR-181 may function as a tumor suppressor. In glioma, hsa-miR-181a was shown to be downregulated.30 Both hsa-miR-181a and hsa-miR-181b triggered growth inhibition, induced apoptosis, and inhibited invasion in glioma cells. Transiently overexpressed hsa-miR-181a significantly sensitized malignant glioma U87MG cells to radiation with downregulated BCL2.55 In chronic lymphocytic leukemia, hsa-miR-181a together with hsa-miR-15a, hsa-miR-16-1, hsa-miR-29b, and hsa-miR-181b were all downregulated.90 These miRNAs may play a role in the pathogenesis of chronic lymphocytic leukemia and serve as new biomarkers for the prediction of prognosis in chronic lymphocytic leukemia. hsa-miR-181a expression level was found to be significantly lower in poor prognosis patients, and a low expression of hsa-miR-181a and hsa-miR-181b was associated with shorter overall survival and treatment-free survival in patients with chronic lymphocytic leukemia.79 Furthermore, hsa-miR-181a inhibited the migration, invasion, and proliferation of salivary adenoid cystic carcinoma cells, and suppressed tumor growth and lung metastasis in nude mice, via targeting of MAP2K1, MAPK1, and SNAI2.75
Based on our DAVID and KEGG pathway analysis, PI3K/Akt, MAPK, and Wnt signaling pathways played important roles in the development of type I EC. CCND1, HRAS, and KRAS are all key components in these pathways, which are all validated targets of hsa-miR-181a.
The expression level of hsa-miR-181a has been proposed as a potential biomarker for assessing prognosis and therapeutic response in cancer. Ouyang et al102 suggested that hsa-miR-181a may be a potential biomarker for predicting chemoresistance in the treatment of triple negative breast cancer. It also has been showed that hsa-miRNA-181a enhanced the chemoresistance of human cervical squamous cell carcinoma to cisplatin by targeting protein kinase Cδ69 and that hsa-miR-181a may serve an oncologic miRNA biomarker for luminal A-like breast cancer.67 Interestingly, Pichler et al59 showed a reverse correlation between hsa-miR-181a expression level and survival rate in patients with colorectal cancer. In our study, we observed a significant difference in the expression level of hsa-miR-181a among normal endometrium, endometrial hyperplasia, and EC, and a higher expression level of hsa-miR-181a in advanced EC. Our findings suggest that the expression level of hsa-miR-181a might serve as a useful biomarker for the prediction of prognosis of EC in clinic.
In summary, our bioinformatics studies have showed that hsa-miR-181a might regulate a large number of target genes that are important in the regulation of critical cell processes. To date, 313 targets of hsa-miR-181a have been validated, and 22 of these targets are cancer genes. Many of these genes are involved in tumorigenesis of various cancers, including EC. Our data demonstrate that hsa-miR-181a is upregulated in EC, with a possible role in the development and progression of EC (Figure 12). It might serve as a new biomarker for prognosis prediction in EC in clinical practice and has important implication in the treatment of EC. More mechanistic and functional studies are needed to validate the role of hsa-miR-181a in the pathogenesis of EC and to establish the association between the expression level of hsa-miR-181a and the clinical phenotypes, including disease status and therapeutic response of EC to chemo- and radiotherapy.
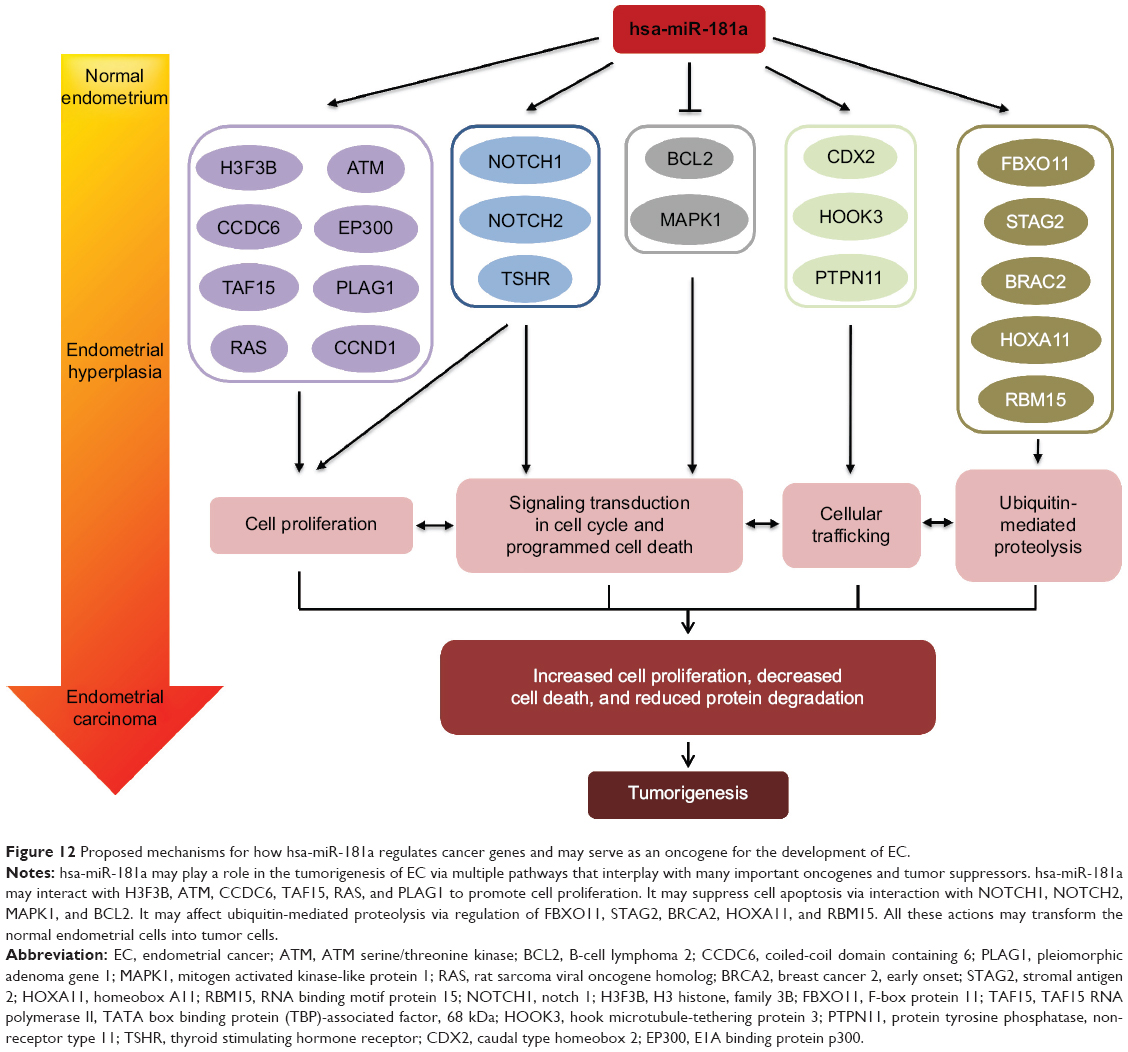 | Figure 12 Proposed mechanisms for how hsa-miR-181a regulates cancer genes and may serve as an oncogene for the development of EC. |
Acknowledgment
This work was supported by Guangdong Natural Science Foundation (grant number S2012010010024), Guangzhou, People’s Republic of China. Dr Zhi-Wei Zhou is a postdoctoral fellow supported by the College of Pharmacy, University of South Florida, Tampa, FL, USA.
Disclosure
The authors report no conflicts of interest in this work.
References
Croce CM, Calin GA. miRNAs, cancer, and stem cell division. Cell. 2005; 122(1):6–7. | ||
Yates LA, Norbury CJ, Gilbert RJ. The long and short of microRNA. Cell. 2013;153(3):516–519. | ||
Lu J, Getz G, Miska EA, et al. MicroRNA expression profiles classify human cancers. Nature. 2005;435(7043):834–838. | ||
Banno K, Yanokura M, Kisu I, Yamagami W, Susumu N, Aoki D. MicroRNAs in endometrial cancer. Int J Clin Oncol. 2013;18(2):186–192. | ||
Lujambio A, Lowe SW. The microcosmos of cancer. Nature. 2012; 482(7385):347–355. | ||
Esquela-Kerscher A, Slack FJ. Oncomirs – microRNAs with a role in cancer. Nat Rev Cancer. 2006;6(4):259–269. | ||
Ryan BM, Robles AI, Harris CC. Genetic variation in microRNA networks: the implications for cancer research. Nat Rev Cancer. 2010; 10(6):389–402. | ||
Nana-Sinkam SP, Croce CM. Clinical applications for microRNAs in cancer. Clin Pharmacol Ther. 2013;93(1):98–104. | ||
Ritchie W, Rasko JE. Refining microRNA target predictions: sorting the wheat from the chaff. Biochem Biophys Res Commun. 2014; 445(4):780–784. | ||
Peterson SM, Thompson JA, Ufkin ML, Sathyanarayana P, Liaw L, Congdon CB. Common features of microRNA target prediction tools. Front Genet. 2014;5:23. | ||
Ferlay J, Soerjomataram I, Ervik M, et al. GLOBOCAN 2012 v1.0, Cancer Incidence and Mortality Worldwide: IARC CancerBase No. 11 [Internet]. Lyon: International Agency for Research on Cancer; 2013. Available from: http://globocan.iarc.fr. Accessed November 10, 2014. | ||
Howlader N, Noone AM, Krapcho M, et al. SEER Cancer Statistics Review, 1975–2011. Bethesda, MD: National Cancer Institute; 2014. | ||
Balch C, Matei DE, Huang TH, Nephew KP. Role of epigenomics in ovarian and endometrial cancers. Epigenomics. 2010;2(3):419–447. | ||
Amant F, Moerman P, Neven P, Timmerman D, Van Limbergen E, Vergote I. Endometrial cancer. Lancet. 2005;366(9484):491–505. | ||
Colombo N, Preti E, Landoni F, et al; ESMO Guidelines Working Group. Endometrial cancer: ESMO Clinical Practice Guidelines for diagnosis, treatment and follow-up. Ann Oncol. 2013;24 Suppl 6: vi33–vi38. | ||
Hecht JL, Mutter GL. Molecular and pathologic aspects of endometrial carcinogenesis. J Clin Oncol. 2006;24(29):4783–4791. | ||
Yeramian A, Moreno-Bueno G, Dolcet X, et al. Endometrial carcinoma: molecular alterations involved in tumor development and progression. Oncogene. 2013;32(4):403–413. | ||
National Cancer Institute. Endometrial Cancer. 2014. Available from http://www.cancer.gov/cancertopics/types/endometrial. Accessed December 15, 2014. | ||
Dong P, Kaneuchi M, Konno Y, Watari H, Sudo S, Sakuragi N. Emerging therapeutic biomarkers in endometrial cancer. Biomed Res Int. 2013; 2013:130362. | ||
Ow TJ, Sandulache VC, Skinner HD, Myers JN. Integration of cancer genomics with treatment selection: from the genome to predictive biomarkers. Cancer. 2013;119(22):3914–3928. | ||
Mitra S, Das S, Chakrabarti J. Systems biology of cancer biomarker detection. Cancer Biomark. 2013;13(4):201–213. | ||
Widschwendter M, Jones A, Teschendorff AE. Epigenetics makes its mark on women-specific cancers – an opportunity to redefine oncological approaches? Gynecol Oncol. 2013;128(1):134–143. | ||
Schwarzenbach H, Hoon DS, Pantel K. Cell-free nucleic acids as biomarkers in cancer patients. Nat Rev Cancer. 2011;11(6):426–437. | ||
Kasinski AL, Slack FJ. Epigenetics and genetics. MicroRNAs en route to the clinic: progress in validating and targeting microRNAs for cancer therapy. Nat Rev Cancer. 2011;11(12):849–864. | ||
Chen CZ, Li L, Lodish HF, Bartel DP. MicroRNAs modulate hematopoietic lineage differentiation. Science. 2004;303(5654):83–86. | ||
Lin Y, Nie Y, Zhao J, et al. Genetic polymorphism at miR-181a binding site contributes to gastric cancer susceptibility. Carcinogenesis. 2012; 33(12):2377–2383. | ||
Havelange V, Stauffer N, Heaphy CC, et al. Functional implications of microRNAs in acute myeloid leukemia by integrating microRNA and messenger RNA expression profiling. Cancer. 2011;117(20):4696–4706. | ||
Ji D, Chen Z, Li M, et al. MicroRNA-181a promotes tumor growth and liver metastasis in colorectal cancer by targeting the tumor suppressor WIF-1. Mol Cancer. 2014;13:86. | ||
Fei J, Li Y, Zhu X, Luo X. miR-181a post-transcriptionally downregulates oncogenic RalA and contributes to growth inhibition and apoptosis in chronic myelogenous leukemia (CML). PLoS One. 2012;7(3):e32834. | ||
Shi L, Cheng Z, Zhang J, et al. hsa-mir-181a and hsa-mir-181b function as tumor suppressors in human glioma cells. Brain Res. 2008;1236: 185–193. | ||
Panda H, Chuang TD, Luo X, Chegini N. Endometrial miR-181a and miR-98 expression is altered during transition from normal into cancerous state and target PGR, PGRMC1, CYP19A1, DDX3X, and TIMP3. J Clin Endocrinol Metab. 2012;97(7):E1316–E1326. | ||
Kozomara A, Griffiths-Jones S. miRBase: annotating high confidence microRNAs using deep sequencing data. Nucleic Acids Res. 2014;42(Database issue):D68–D73. | ||
Kozomara A, Griffiths-Jones S. miRBase: integrating microRNA annotation and deep-sequencing data. Nucleic Acids Res. 2011;39(Database issue):D152–D157. | ||
Griffiths-Jones S, Grocock RJ, van Dongen S, Bateman A, Enright AJ. miRBase: microRNA sequences, targets and gene nomenclature. Nucleic Acids Res. 2006;34(Database issue):D140–D144. | ||
Betel D, Koppal A, Agius P, Sander C, Leslie C. Comprehensive modeling of microRNA targets predicts functional non-conserved and non-canonical sites. Genome Biol. 2010;11(8):R90. | ||
Maragkakis M, Alexiou P, Papadopoulos GL, et al. Accurate microRNA target prediction correlates with protein repression levels. BMC Bioinformatics. 2009;10:295. | ||
Paraskevopoulou MD, Georgakilas G, Kostoulas N, et al. DIANA-microT web server v5.0: service integration into miRNA functional analysis workflows. Nucleic Acids Res. 2013;41(Web Server issue):W169–W173. | ||
Wang X. miRDB: a microRNA target prediction and functional annotation database with a wiki interface. RNA. 2008;14(6):1012–1017. | ||
Miranda KC, Huynh T, Tay Y, et al. A pattern-based method for the identification of MicroRNA binding sites and their corresponding heteroduplexes. Cell. 2006;126(6):1203–1217. | ||
Bandyopadhyay S, Mitra R. TargetMiner: microRNA target prediction with systematic identification of tissue-specific negative examples. Bioinformatics. 2009;25(20):2625–2631. | ||
Lewis BP, Burge CB, Bartel DP. Conserved seed pairing, often flanked by adenosines, indicates that thousands of human genes are microRNA targets. Cell. 2005;120(1):15–20. | ||
Garcia DM, Baek D, Shin C, Bell GW, Grimson A, Bartel DP. Weak seed-pairing stability and high target-site abundance decrease the proficiency of lsy-6 and other microRNAs. Nat Struct Mol Biol. 2011;18(10): 1139–1146. | ||
Krek A, Grün D, Poy MN, et al. Combinatorial microRNA target predictions. Nat Genet. 2005;37(5):495–500. | ||
Dweep H, Sticht C, Pandey P, Gretz N. miRWALK – database: prediction of possible miRNA binding sites by “walking” the genes of three genomes. J Biomed Inform. 2011;44(5):839–847. | ||
Vergoulis T, Vlachos IS, Alexiou P, et al. TarBase 6.0: capturing the exponential growth of miRNA targets with experimental support. Nucleic Acids Res. 2012;40(Database issue):D222–D229. | ||
Hsu SD, Tseng YT, Shrestha S, et al. miRTarBase update 2014: an information resource for experimentally validated miRNA-target interactions. Nucleic Acids Res. 2014;42(Database issue):D78–D85. | ||
Futreal PA, Coin L, Marshall M, et al. A census of human cancer genes. Nat Rev Cancer. 2004;4(3):177–183. | ||
Vogelstein B, Papadopoulos N, Velculescu VE, Zhou S, Diaz LA Jr, Kinzler KW. Cancer genome landscapes. Science. 2013;339(6127): 1546–1558. | ||
Huang da W, Sherman BT, Lempicki RA. Systematic and integrative analysis of large gene lists using DAVID bioinformatics resources. Nat Protoc. 2009;4(1):44–57. | ||
Huang da W, Sherman BT, Tan Q, et al. DAVID bioinformatics resources: expanded annotation database and novel algorithms to better extract biology from large gene lists. Nucleic Acids Res. 2007;35(Web Server issue):W169–W175. | ||
Pecorelli S. Revised FIGO staging for carcinoma of the vulva, cervix, and endometrium. Int J Gynaecol Obstet. 2009;105(2):103–104. | ||
Di Leva G, Garofalo M, Croce CM. MicroRNAs in cancer. Annu Rev Pathol. 2014;9:287–314. | ||
Gilabert-Estelles J, Braza-Boils A, Ramon LA, et al. Role of microRNAs in gynecological pathology. Curr Med Chem. 2012;19(15): 2406–2413. | ||
Parikh A, Lee C, Peronne J, et al. microRNA-181a has a critical role in ovarian cancer progression through the regulation of the epithelial-mesenchymal transition. Nat Commun. 2014;5:2977. | ||
Chen G, Zhu W, Shi D, et al. MicroRNA-181a sensitizes human malignant glioma U87MG cells to radiation by targeting Bcl-2. Oncol Rep. 2010;23(4): 997–1003. | ||
Brockhausen J, Tay SS, Grzelak CA, et al. miR-181a mediates TGF-β-induced hepatocyte EMT and is dysregulated in cirrhosis and hepatocellular cancer. Liver Int. 2015;35(1):240–253. | ||
Nishimura J, Handa R, Yamamoto H, et al. microRNA-181a is associated with poor prognosis of colorectal cancer. Oncol Rep. 2012; 28(6):2221–2226. | ||
Zou C, Chen J, Chen K, et al. Functional analysis of miR-181a and Fas involved in hepatitis B virus-related hepatocellular carcinoma pathogenesis. Exp Cell Res. 2015 [Epub ahead of print]. | ||
Pichler M, Winter E, Ress AL, et al. miR-181a is associated with poor clinical outcome in patients with colorectal cancer treated with EGFR inhibitor. J Clin Pathol. 2014;67(3):198–203. | ||
Zhang X, Nie Y, Du Y, Cao J, Shen B, Li Y. MicroRNA-181a promotes gastric cancer by negatively regulating tumor suppressor KLF6. Tumour Biol. 2012;33(5):1589–1597. | ||
Zhang X, Nie Y, Li X et al., MicroRNA-181a functions as an oncomir in gastric cancer by targeting the tumour suppressor gene ATM. Pathol Oncol Res. 2014;20(2):381–389. | ||
Galluzzi L, Morselli E, Vitale I, et al. miR-181a and miR-630 regulate cisplatin-induced cancer cell death. Cancer Res. 2010;70(5): 1793–1803. | ||
Farazi TA, Horlings HM, Ten Hoeve JJ, et al. MicroRNA sequence and expression analysis in breast tumors by deep sequencing. Cancer Res. 2011;71(13):4443–4453. | ||
Guo LJ, Zhang QY. Decreased serum miR-181a is a potential new tool for breast cancer screening. Int J Mol Med. 2012;30(3):680–686. | ||
Taylor MA, Sossey-Alaoui K, Thompson CL, Danielpour D, Schiemann WP. TGF-β upregulates miR-181a expression to promote breast cancer metastasis. J Clin Invest. 2013;123(1):150–163. | ||
Bisso A, Faleschini M, Zampa F, et al. Oncogenic miR-181a/b affect the DNA damage response in aggressive breast cancer. Cell Cycle. 2013;12(11):1679–1687. | ||
McDermott AM, Miller N, Wall D, et al. Identification and validation of oncologic miRNA biomarkers for luminal A-like breast cancer. PLoS One. 2014;9(1):e87032. | ||
Ke G, Liang L, Yang JM, et al. MiR-181a confers resistance of cervical cancer to radiation therapy through targeting the pro-apoptotic PRKCD gene. Oncogene. 2013;32(25):3019–3027. | ||
Chen Y, Ke G, Han D, Liang S, Yang G, Wu X. MicroRNA-181a enhances the chemoresistance of human cervical squamous cell carcinoma to cisplatin by targeting PRKCD. Exp Cell Res. 2014;320(1):12–20. | ||
Jianwei Z, Fan L, Xiancheng L, Enzhong B, Shuai L, Can L. MicroRNA 181a improves proliferation and invasion, suppresses apoptosis of osteosarcoma cell. Tumour Biol. 2013;34(6):3331–3337. | ||
Shin KH, Bae SD, Hong HS, Kim RH, Kang MK, Park NH. miR-181a shows tumor suppressive effect against oral squamous cell carcinoma cells by downregulating K-ras. Biochem Biophys Res Commun. 2011;404(4):896–902. | ||
Liu M, Wang J, Huang H, Hou J, Zhang B, Wang A. miR-181a-Twist1 pathway in the chemoresistance of tongue squamous cell carcinoma. Biochem Biophys Res Commun. 2013;441(2):364–370. | ||
Alencar AJ, Malumbres R, Kozloski GA, et al. MicroRNAs are independent predictors of outcome in diffuse large B-cell lymphoma patients treated with R-CHOP. Clin Cancer Res. 2011;17(12):4125–4135. | ||
Keutgen XM, Filicori F, Crowley MJ, et al. A panel of four miRNAs accurately differentiates malignant from benign indeterminate thyroid lesions on fine needle aspiration. Clin Cancer Res. 2012;18(7): 2032–2038. | ||
He Q, Zhou X, Li S, et al. MicroRNA-181a suppresses salivary adenoid cystic carcinoma metastasis by targeting MAPK-Snai2 pathway. Biochim Biophys Acta. 2013;1830(11):5258–5266. | ||
Debernardi S, Skoulakis S, Molloy G, Chaplin T, Dixon-McIver A, Young BD. MicroRNA miR-181a correlates with morphological sub-class of acute myeloid leukaemia and the expression of its target genes in global genome-wide analysis. Leukemia. 2007;21(5):912–916. | ||
Cuesta R, Martínez-Sánchez A, Gebauer F. miR-181a regulates cap-dependent translation of p27(kip1) mRNA in myeloid cells. Mol Cell Biol. 2009;29(10):2841–2851. | ||
Bai H, Cao Z, Deng C, Zhou L, Wang C. miR-181a sensitizes resistant leukaemia HL-60/Ara-C cells to Ara-C by inducing apoptosis. J Cancer Res Clin Oncol. 2012;138(4):595–602. | ||
Zhu DX, Zhu W, Fang C, et al. miR-181a/b significantly enhances drug sensitivity in chronic lymphocytic leukemia cells via targeting multiple anti-apoptosis genes. Carcinogenesis. 2012;33(7):1294–1301. | ||
Dahlhaus M, Schult C, Lange S, Freund M, Junghanss C. MicroRNA 181a influences the expression of HMGB1 and CD4 in acute leukemias. Anticancer Res. 2013;33(2):445–452. | ||
Lin S, Pan L, Guo S, et al. Prognostic role of microRNA-181a/b in hematological malignancies: a meta-analysis. PLoS One. 2013;8(3): e59532. | ||
Ciafrè SA, Galardi S, Mangiola A, et al. Extensive modulation of a set of microRNAs in primary glioblastoma. Biochem Biophys Res Commun. 2005;334(4):1351–1358. | ||
Gao W, Shen H, Liu L, Xu J, Xu J, Shu Y. MiR-21 overexpression in human primary squamous cell lung carcinoma is associated with poor patient prognosis. J Cancer Res Clin Oncol. 2011;137(4):557–566. | ||
Gao W, Yu Y, Cao H, et al. Deregulated expression of miR-21, miR-143 and miR-181a in non small cell lung cancer is related to clinicopathologic characteristics or patient prognosis. Biomed Pharmacother. 2010;64(6):399–408. | ||
Miller TE, Ghoshal K, Ramaswamy B, et al. MicroRNA-221/222 confers tamoxifen resistance in breast cancer by targeting p27Kip1. J Biol Chem. 2008;283(44):29897–29903. | ||
Ji J, Yamashita T, Budhu A, et al. Identification of microRNA-181 by genome-wide screening as a critical player in EpCAM-positive hepatic cancer stem cells. Hepatology. 2009;50(2):472–480. | ||
Zou C, Li Y, Cao Y, et al. Up-regulated MicroRNA-181a induces carcinogenesis in hepatitis B virus-related hepatocellular carcinoma by targeting E2F5. BMC Cancer. 2014;14:97. | ||
Pons A, Nomdedeu B, Navarro A, et al. Hematopoiesis-related microRNA expression in myelodysplastic syndromes. Leuk Lymphoma. 2009;50(11):1854–1859. | ||
Pichiorri F, Suh SS, Ladetto M, et al. MicroRNAs regulate critical genes associated with multiple myeloma pathogenesis. Proc Natl Acad Sci U S A. 2008;105(35):12885–12890. | ||
Zhu DX, Miao KR, Fang C, et al. Aberrant microRNA expression in Chinese patients with chronic lymphocytic leukemia. Leuk Res. 2011; 35(6):730–734. | ||
Albulescu R. TGF-β upregulates miR-181a expression to promote breast cancer metastasis. Biomark Med. 2013;7(2):204. | ||
Jiao X, Zhao L, Ma M, et al. MiR-181a enhances drug sensitivity in mitoxantone-resistant breast cancer cells by targeting breast cancer resistance protein (BCRP/ABCG2). Breast Cancer Res Treat. 2013;139(3):717–730. | ||
Ritchie W, Flamant S, Rasko JE. Predicting microRNA targets and functions: traps for the unwary. Nat Methods. 2009;6(6):397–398. | ||
Shirdel EA, Xie W, Mak TW, Jurisica I. NAViGaTing the micronome – using multiple microRNA prediction databases to identify signalling pathway-associated microRNAs. PLoS One. 2011;6(2):e17429. | ||
Godsey B. Discovery of miR-mRNA interactions via simultaneous Bayesian inference of gene networks and clusters using sequence-based predictions and expression data. J Integr Bioinform. 2013;10(1):227. | ||
Pio G, Malerba D, D’Elia D, Ceci M. Integrating microRNA target predictions for the discovery of gene regulatory networks: a semi-supervised ensemble learning approach. BMC Bioinformatics. 2014;15 Suppl 1:S4. | ||
Zhang Y, Verbeek FJ. Comparison and integration of target prediction algorithms for microRNA studies. J Integr Bioinform. 2010;7(3). | ||
Takamizawa J, Konishi H, Yanagisawa K, et al. Reduced expression of the let-7 microRNAs in human lung cancers in association with shortened postoperative survival. Cancer Res. 2004;64(11):3753–3756. | ||
Johnson SM, Grosshans H, Shingara J, et al. RAS is regulated by the let-7 microRNA family. Cell. 2005;120(5):635–647. | ||
Meng F, Glaser SS, Francis H, et al. Functional analysis of microRNAs in human hepatocellular cancer stem cells. J Cell Mol Med. 2012; 16(1):160–173. | ||
Wei Z, Cui L, Mei Z, Liu M, Zhang D. miR-181a mediates metabolic shift in colon cancer cells via the PTEN/AKT pathway. FEBS Lett. 2014; 588(9):1773–1779. | ||
Ouyang M, Li Y, Ye S, et al. MicroRNA profiling implies new markers of chemoresistance of triple-negative breast cancer. PLoS One. 2014; 9(5):e96228. | ||
Clevers H, Nusse R. Wnt/β-catenin signaling and disease. Cell. 2012;149(6):1192–1205. | ||
MacDonald BT, Tamai K, He X. Wnt/β-catenin signaling: components, mechanisms, and diseases. Dev Cell. 2009;17(1):9–26. | ||
Pijnenborg JM, Kisters N, van Engeland M, et al. APC, b-catenin, and E-cadherin and the development of recurrent endometrial carcinoma. Int J Gynecol Cancer. 2004;14(5):947–956. | ||
van der Zee M, Jia Y, Wang Y, et al. Alterations in Wnt-β-catenin and Pten signalling play distinct roles in endometrial cancer initiation and progression. J Pathol. 2013;230(1):48–58. | ||
Liu Y, Meng F, Xu Y, et al. Overexpression of Wnt7a is associated with tumor progression and unfavorable prognosis in endometrial cancer. Int J Gynecol Cancer. 2013;23(2):304–311. | ||
Zhao Y, Yang Y, Trovik J, et al. A novel wnt regulatory axis in endometrioid endometrial cancer. Cancer Res. 2014;74(18):5103–5117. | ||
Liu Y, Patel L, Mills GB, et al. Clinical significance of CTNNB1 mutation and Wnt pathway activation in endometrioid endometrial carcinoma. J Natl Cancer Inst. 2014;106(9):dju245. | ||
Malumbres M, Barbacid M. Cell cycle, CDKs and cancer: a changing paradigm. Nat Rev Cancer. 2009;9(3):153–166. | ||
Plotnikov A, Zehorai E, Procaccia S, Seger R. The MAPK cascades: signaling components, nuclear roles and mechanisms of nuclear translocation. Biochim Biophys Acta. 2011;1813(9):1619–1633. | ||
Ranganathan P, Weaver KL, Capobianco AJ. Notch signalling in solid tumours: a little bit of everything but not all the time. Nat Rev Cancer. 2011;11(5):338–351. | ||
Suzuki T, Aoki D, Susumu N, Udagawa Y, Nozawa S. Imbalanced expression of TAN-1 and human Notch4 in endometrial cancers. Int J Oncol. 2000;17(6):1131–1139. | ||
Cobellis L, Caprio F, Trabucco E, et al. The pattern of expression of Notch protein members in normal and pathological endometrium. J Anat. 2008;213(4):464–472. | ||
Mitsuhashi Y, Horiuchi A, Miyamoto T, Kashima H, Suzuki A, Shiozawa T. Prognostic significance of Notch signalling molecules and their involvement in the invasiveness of endometrial carcinoma cells. Histopathology. 2012;60(5):826–837. | ||
Jonusiene V, Sasnauskiene A, Lachej N, et al. Down-regulated expression of Notch signaling molecules in human endometrial cancer. Med Oncol. 2013;30(1):438. | ||
Nickkho-Amiry M, McVey R, Holland C. Peroxisome proliferator-activated receptors modulate proliferation and angiogenesis in human endometrial carcinoma. Mol Cancer Res. 2012;10(3):441–453. | ||
Pengchong H, Tao H. Expression of IGF-1R, VEGF-C and D2-40 and their correlation with lymph node metastasis in endometrial adenocarcinoma. Eur J Gynaecol Oncol. 2011;32(6):660–664. | ||
Dobrzycka B, Mackowiak-Matejczyk B, Kinalski M, Terlikowski SJ. Pretreatment serum levels of bFGF and VEGF and its clinical significance in endometrial carcinoma. Gynecol Oncol. 2013;128(3):454–460. | ||
Saarelainen SK, Staff S, Peltonen N, et al. Endoglin, VEGF, and its receptors in predicting metastases in endometrial carcinoma. Tumour Biol. 2014;35(5):4651–4657. | ||
Wang J, Taylor A, Showeil R, et al. Expression profiling and significance of VEGF-A, VEGFR2, VEGFR3 and related proteins in endometrial carcinoma. Cytokine. 2014;68(2):94–100. | ||
Saharinen P, Eklund L, Pulkki K, Bono P, Alitalo K. VEGF and angiopoietin signaling in tumor angiogenesis and metastasis. Trends Mol Med. 2011;17(7):347–362. |
Supplementary materials
Table S1 A full list of cancer genes, based on Futreal et al1. Reprinted by permission from Macmillan Publishers Ltd: Nature Reviews Cancer. Futreal PA, Coin L, Marshall M, et al. A census of human cancer genes. Nat Rev Cancer. 2004;4(3):177–183. Copyright © 2004.1
Table S2 Predicted targets of hsa-miR-181a-5p, by DIANA microT v5.0
Table S3 Predicted targets of hsa-miR-181a-5p, by miRanda-mirSVR
Table S4 Predicted targets of hsa-miR-181a-5p, by miRanda-mirSVR, that are cancer genes
Table S5 Predicted targets of hsa-miR-181a-5p, by miRDB
Table S6 Predicted targets of hsa-miR-181a-5p, by RNA22 v2
Table S7 Predicted targets of hsa-miR-181a-5p, by RNA22 v2, that are cancer genes
Table S8 Predicted targets of hsa-miR-181a-5p, by TargetMiner
Table S9 Predicted targets of hsa-miR-181a-5p, by TargetScan 6.2
Table S10 Predicted targets of hsa-miR-181a-5p, by PicTar
Table S11 Predicted targets of hsa-miR-181a-5p, by MicroCosm Targets v5
Table S12 Predicted targets of hsa-miR-181a-3p, by DIANA microT v5.0
Table S13 Predicted targets of hsa-miR-181a-3p, by miRanda-mirSVR
Table S14 Predicted targets of hsa-miR-181a-3p, by miRanda-mirSVR, that are cancer genes
Table S15 Predicted targets of hsa-miR-181a-3p, by miRDB
Table S16 Predicted targets of hsa-miR-181a-3p, by RNA22 v2
Table S17 Predicted targets of hsa-miR-181a-3p, by TargetMiner
Table S18 Predicted targets of hsa-miR-181a-5p, by MicroCosm Targets v5
Table S19 Predicted targets of hsa-miR-181a, by miRWALK
Table S20 Predicted genes of hsa-miR-181a, by miRWALK
Table S21 A summarized table that includes all the targets predicted to be regulated by hsa-miR-181a by the eight algorithms
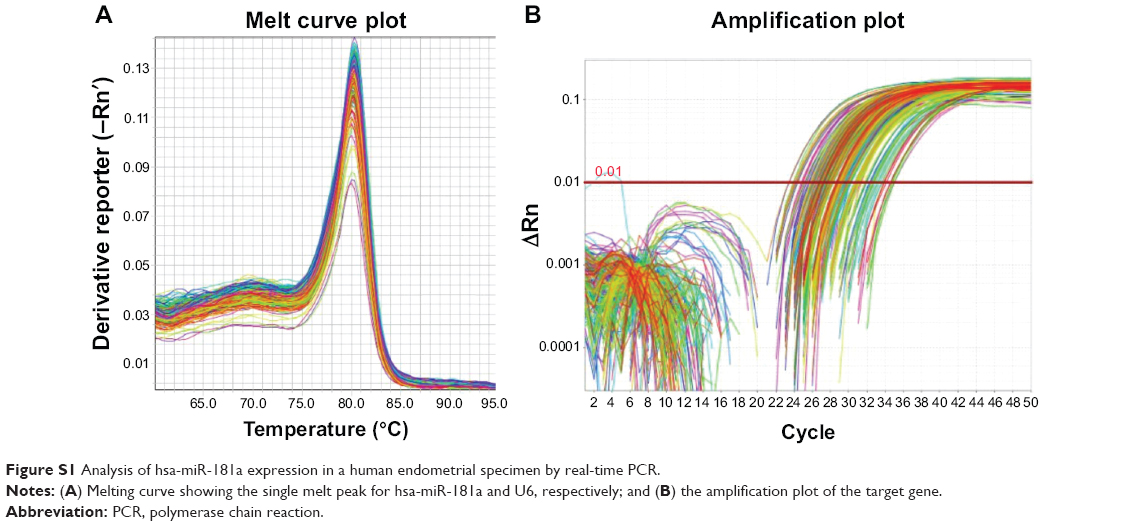 | Figure S1 Analysis of hsa-miR-181a expression in a human endometrial specimen by real-time PCR. |
Reference
Futreal PA, Coin L, Marshall M, et al. A census of human cancer genes. Nat Rev Cancer. 2004;4(3):177–183. |
 © 2015 The Author(s). This work is published and licensed by Dove Medical Press Limited. The full terms of this license are available at https://www.dovepress.com/terms.php and incorporate the Creative Commons Attribution - Non Commercial (unported, v3.0) License.
By accessing the work you hereby accept the Terms. Non-commercial uses of the work are permitted without any further permission from Dove Medical Press Limited, provided the work is properly attributed. For permission for commercial use of this work, please see paragraphs 4.2 and 5 of our Terms.
© 2015 The Author(s). This work is published and licensed by Dove Medical Press Limited. The full terms of this license are available at https://www.dovepress.com/terms.php and incorporate the Creative Commons Attribution - Non Commercial (unported, v3.0) License.
By accessing the work you hereby accept the Terms. Non-commercial uses of the work are permitted without any further permission from Dove Medical Press Limited, provided the work is properly attributed. For permission for commercial use of this work, please see paragraphs 4.2 and 5 of our Terms.