")
Back to Journals » Nature and Science of Sleep » Volume 15
How Tired is Too Tired to Drive? A Systematic Review Assessing the Use of Prior Sleep Duration to Detect Driving Impairment
Authors Sprajcer M , Dawson D , Kosmadopoulos A, Sach EJ, Crowther ME, Sargent C , Roach GD
Received 12 October 2022
Accepted for publication 3 February 2023
Published 4 April 2023 Volume 2023:15 Pages 175—206
DOI https://doi.org/10.2147/NSS.S392441
Checked for plagiarism Yes
Review by Single anonymous peer review
Peer reviewer comments 2
Editor who approved publication: Professor Ahmed BaHammam
Madeline Sprajcer, Drew Dawson, Anastasi Kosmadopoulos, Edward J Sach, Meagan E Crowther, Charli Sargent, Gregory D Roach
Appleton Institute for Behavioural Sciences, Central Queensland University, Wayville, SA, Australia
Correspondence: Madeline Sprajcer, Central Queensland University, Appleton Institute, 44 Greenhill Road, Wayville, SA, 5034, Australia, Email [email protected]
Abstract: Driver fatigue is a contributory factor in approximately 20% of vehicle crashes. While other causal factors (eg, drink-driving) have decreased in recent decades due to increased public education strategies and punitive measures, similar decreases have not been seen in fatigue-related crashes. Fatigued driving could be managed in a similar way to drink-driving, with an established point (ie, amount of prior sleep) after which drivers are “deemed impaired”. This systematic review aimed to provide an evidence-base for the concept of deemed impairment and to identify how much prior sleep may be required to drive safely. Four online databases were searched (PubMed, Web of Science, Scopus, Embase). Eligibility requirements included a) measurement of prior sleep duration and b) driving performance indicators (eg, lane deviation) and/or outcomes (eg, crash likelihood). After screening 1940 unique records, a total of 61 studies were included. Included studies were categorised as having experimental/quasi-experimental (n = 21), naturalistic (n = 3), longitudinal (n = 1), case–control (n = 11), or cross-sectional (n = 25) designs. Findings suggest that after either 6 or 7 hours of prior sleep, a modest level of impairment is generally seen compared with after ≥ 8 hours of prior sleep (ie, well rested), depending on the test used. Crash likelihood appears to be ~30% greater after 6 or 7 hours of prior sleep, as compared to individuals who are well rested. After one night of either 4 or 5 hours of sleep, there are large decrements to driving performance and approximately double the likelihood of a crash when compared with well-rested individuals. When considering the scientific evidence, it appears that there is a notable decrease in driving performance (and associated increase in crash likelihood) when less than 5h prior sleep is obtained. This is a critical first step in establishing community standards regarding the amount of sleep required to drive safely.
Keywords: fatigue, driving, performance, sleep, safety
Plain Language Summary
- Fatigue contributes to ~20% of road crashes.
- The number of road crashes caused by alcohol has decreased in recent decades, because of the introduction and enforcement of blood alcohol concentration limits for driving.
- When drivers have a blood alcohol concentration over the established limit, they are legally deemed to be impaired.
- In this paper, we establish the concept of deemed impairment for fatigued driving.
- This systematic review presents evidence on where a potential point to deem impairment due to fatigue could be established (ie, how much sleep does an individual need to drive safely?)
- Approximately double the risk of a crash is seen when drivers have had five or fewer hours of sleep in the previous twenty-four hours.
Introduction
Every year in Australia, road crashes result in ~1200 deaths, >40,000 serious injuries and cost the economy AUD$30 billion.1 Fatigue is the primary cause of ~20% of these crashes.1 In recent decades, crashes due to speeding and drink-driving have been reduced through deterrence approaches based on education campaigns and enforcement strategies.2,3 In contrast, the crash rate due to fatigue has not fallen over the same period. Initiatives targeting speeding and drink-driving have been successful because they provide clear guidance regarding what is unsafe in terms of speed or blood alcohol concentration (BAC) and enforcement agencies have technologies to detect people driving over the limits for speed or BAC. Furthermore, people caught driving over those limits are deemed to be driving in an unsafe manner (in the case of speeding) or are deemed impaired (in the case of BAC) and can be sanctioned and/or punished accordingly. Public education campaigns and good guidance materials that enable people to make decisions regarding impaired driving due to alcohol have been highly successful in dramatically reducing the road toll. This reduction in the road toll due to alcohol-related impairment was seen only when clear and specific guidance was provided to road users – compared with previous generations who were provided with only general invocations, ie, “don’t drink and drive”.4
Fatigued driving is still only subject to those general exhortation campaigns. Catchlines such as fatigued/drowsy drivers die or do not drive when fatigued/drowsy do not provide sufficient guidance to help a driver decide if they are fit-to-drive or not. In contrast to drink-driving, the public education and guidance necessary to support safe decision-making is not provided for impairment due to fatigue. People are currently expected to make decisions regarding fatigued driving without clear guidance on what constitutes being “too tired to drive”. While there is clear scientific evidence to determine fitness to drive based on prior sleep-wake behaviour, this information has not yet informed public education campaigns. Similarly, if people do not know how to assess their fitness to drive, then subsequent prosecution is difficult and the deterrent value that flows from that is significantly diminished.
A potential strategy for reducing crashes due to fatigued driving is to introduce the concept of a minimum sleep requirement to legally drive. In the same way as has been done with drink-driving, a threshold minimum sleep requirement could be defined and where drivers have had less sleep than the threshold they can be legally deemed “impaired”. The concept of deeming individuals to be impaired based on prior sleep-wake behaviour has recently been introduced as a potential mechanism for deterring driving while fatigued.5 In one jurisdiction (New Jersey), this has already been done in a 2003 law known as “Maggie’s Law”.6 This law allows individuals to be prosecuted if they cause a vehicle crash after having been awake for ≥24 hours. However, this law was based on evidence equating 24 hours of prior wakefulness with a BAC of 0.10%. Drivers with a BAC of 0.10% would now generally be considered highly impaired (double the legal BAC limit in Australia). Furthermore, evidence suggests that significant cognitive and performance impairments are seen far before a BAC of 0.10%,7–9 or indeed before 24 hours of prior wakefulness.10,11 We therefore propose to determine a minimum sleep threshold based on the best available scientific evidence, community perceptions of fairness and political acceptability. As such, a review of the literature is required to identify how much prior sleep is required to drive safely, and the level of prior sleep below which an individual could be “deemed impaired”. This systematic review aims to provide an evidence base for the concept of deemed impairment, which may impact policy and reduce the likelihood of fatigued driving (and fatigue-related crashes).
Methods
A search strategy was developed to identify studies that have examined the effects of sleep loss on driving outcomes. This search targeted articles published in scientific journals encompassing a variety of multidisciplinary experimental and observational methodologies. This systematic review aligns with the Preferred Reporting Items for Systematic Reviews and Meta-Analyses (PRISMA) guideline12 as indicated by Cochrane methodology.
Eligibility Criteria
Eligible studies were those conducted with human participants and published in English language peer-reviewed scientific journals from January 1, 2000, until October 7, 2021. Participants were required to be from non-clinical, non-sleep disordered populations and to be of legal driving age. Studies were excluded if participants were comprised exclusively of adolescents ≤18 years and/or adults ≥65 years of age. This review was not registered.
Studies were required to include sleep duration or time in bed (TIB) as predictors or comparators of driving performance or impairment. Eligible dependent variables were those sourced from driving real or simulated motor vehicles (eg, cars, trucks). These could be obtained via instrumented on-road vehicles, driving simulators, self-report, or incident reports and databases. Only studies that included two or more sleep dose comparators or specifically used sleep duration as a predictor of driving were assessed.
All types of study designs were eligible for inclusion, including experimental studies and observational designs, including case–control, naturalistic, cross-sectional, or longitudinal methodologies. Experimental studies were limited to those comparing acute sleep loss (either partial or total deprivation) to a control sleep condition (habitual or recommended sleep duration). Studies involving caffeine, alcohol, or other interventions were excluded unless the effects of sleep duration or TIB could be isolated with a placebo/control condition. In contrast, eligible observational studies could investigate the effects of either acute or chronic sleep loss (eg, sleep in the prior 24 h, habitual sleep in the past week).
Information Sources
The literature search obtained records from 4 online databases: PubMed (National Library of Medicine), Web of Science (Clarivate), Scopus (Elsevier), and Embase (Elsevier). Databases were searched on October 7, 2021.
Search Strategy
To limit the number of irrelevant records returned by each database, the search strategy required that articles include key terms in four broad categories:
1. Sleep terms: eg, “sleep”, “nap”, “awake”, etc.
2. Sleep modifiers/descriptors: eg, “extended”, “restricted”, “duration”, “deprivation”, etc.
3. Driving-related terms: eg, “driving”, “automobile”, “motor vehicle”, “road traffic”, etc.
4. Driving performance/impairment terms: eg, “accident”, “crash”, “injury”, “speeding”, “lane position”, etc.
The full list of search terms and Boolean strategy used for each database are described in Supplementary Material A. Additional methodological details, including the selection process, data collection process, data items, synthesis methods, data analysis, and quality assessment can be seen in Supplementary Materials B and C.
Results
Study Selection
Database searches produced a total of 3415 records. After removing duplicate records (n = 1475), 1940 unique records were eligible for screening. Based on the title and abstract, 1615 records were excluded. A total of 325 full-text records were assessed for eligibility, resulting in 61 studies included in the qualitative synthesis. See Figure 1 for the PRISMA flowchart of study screening and inclusion/exclusion.
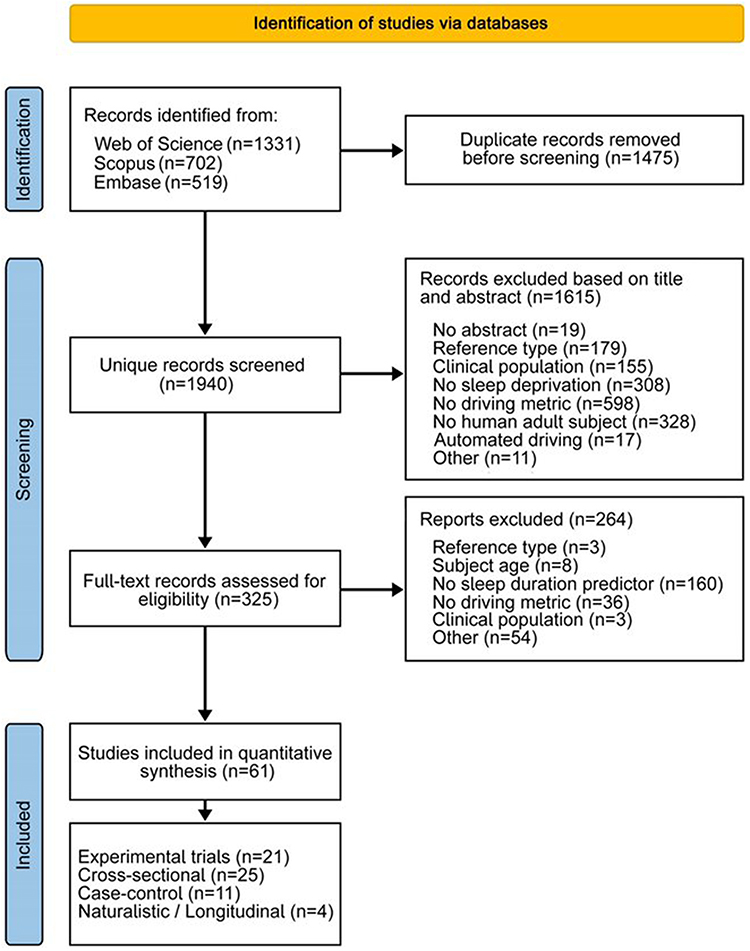 |
Figure 1 PRISMA flowchart. Notes: PRISMA figure adapted from Page MJ, McKenzie JE, Bossuyt PM, et al. The PRISMA 2020 statement: an updated guideline for reporting systematic reviews. Systematic Reviews. 2021/03/29 2021;10(1):89. Creative Commons.12 |
Study Characteristics
Of the 61 studies included in this review, there were 21 experimental or quasi-experimental studies,14–34 3 naturalistic studies,35–37 1 longitudinal study,38 11 case–control studies,39–49 and 25 cross-sectional studies.50–74 A wide range of populations were included, though there were some differences based on study type. Experimental or quasi-experimental studies included university students (n = 2),33,34 young adults (n = 11),15–18,20,22,25,27–29,32 and healthy adults of any age (n = 8).14,19,21,23,24,26,30,31 Naturalistic studies were based on heavy vehicle drivers (n = 2),35,36 and nurses (n = 1).37 The only longitudinal study included was based on a sample of young adult drivers from New South Wales, Australia.38 Case–control studies largely included samples of drivers who had been in a motor vehicle crash and matched controls (ie, drivers who had not been involved in a crash) (n = 10).39–46,48,49 One sample of participants was heavy vehicle drivers who had recently crashed (with matched heavy vehicle driver controls who had not crashed) (n = 1).47 Cross-sectional studies were made up of members of the general driving population (n = 10),51–53,55–57,69,71–73 drivers who had recently been in a crash (n = 1),50 heavy vehicle or commercial drivers (n = 8),61,63–68,70 nurses (n = 1),54 young adults (n = 1),60 university students (n = 2),62,74 drivers in regional Australia (Queensland) (n = 1),58 and drill sergeants (n = 1).59
Experimental and Quasi-Experimental Studies
Twenty-one experimental or quasi-experimental studies met the inclusion criteria (Table 1). All experimental or quasi-experimental studies comprised at least two sleep doses, one of which served as the control condition representing “habitual” or “recommended” sleep durations (usually 7 –9 h), and one which served as the acute sleep loss condition (total or partial sleep deprivation). With the exception of one study using a quasi-experimental repeated measures design29 and two studies which randomly assigned participants to sleep dose conditions,19,34 the remaining 18 studies counterbalanced the order of conditions in within-subject crossover designs. Five studies also included additional experimental conditions, such as real-world versus simulated driving,28 and placebo-controlled interventions involving alcohol,22,32 or caffeine.17,20
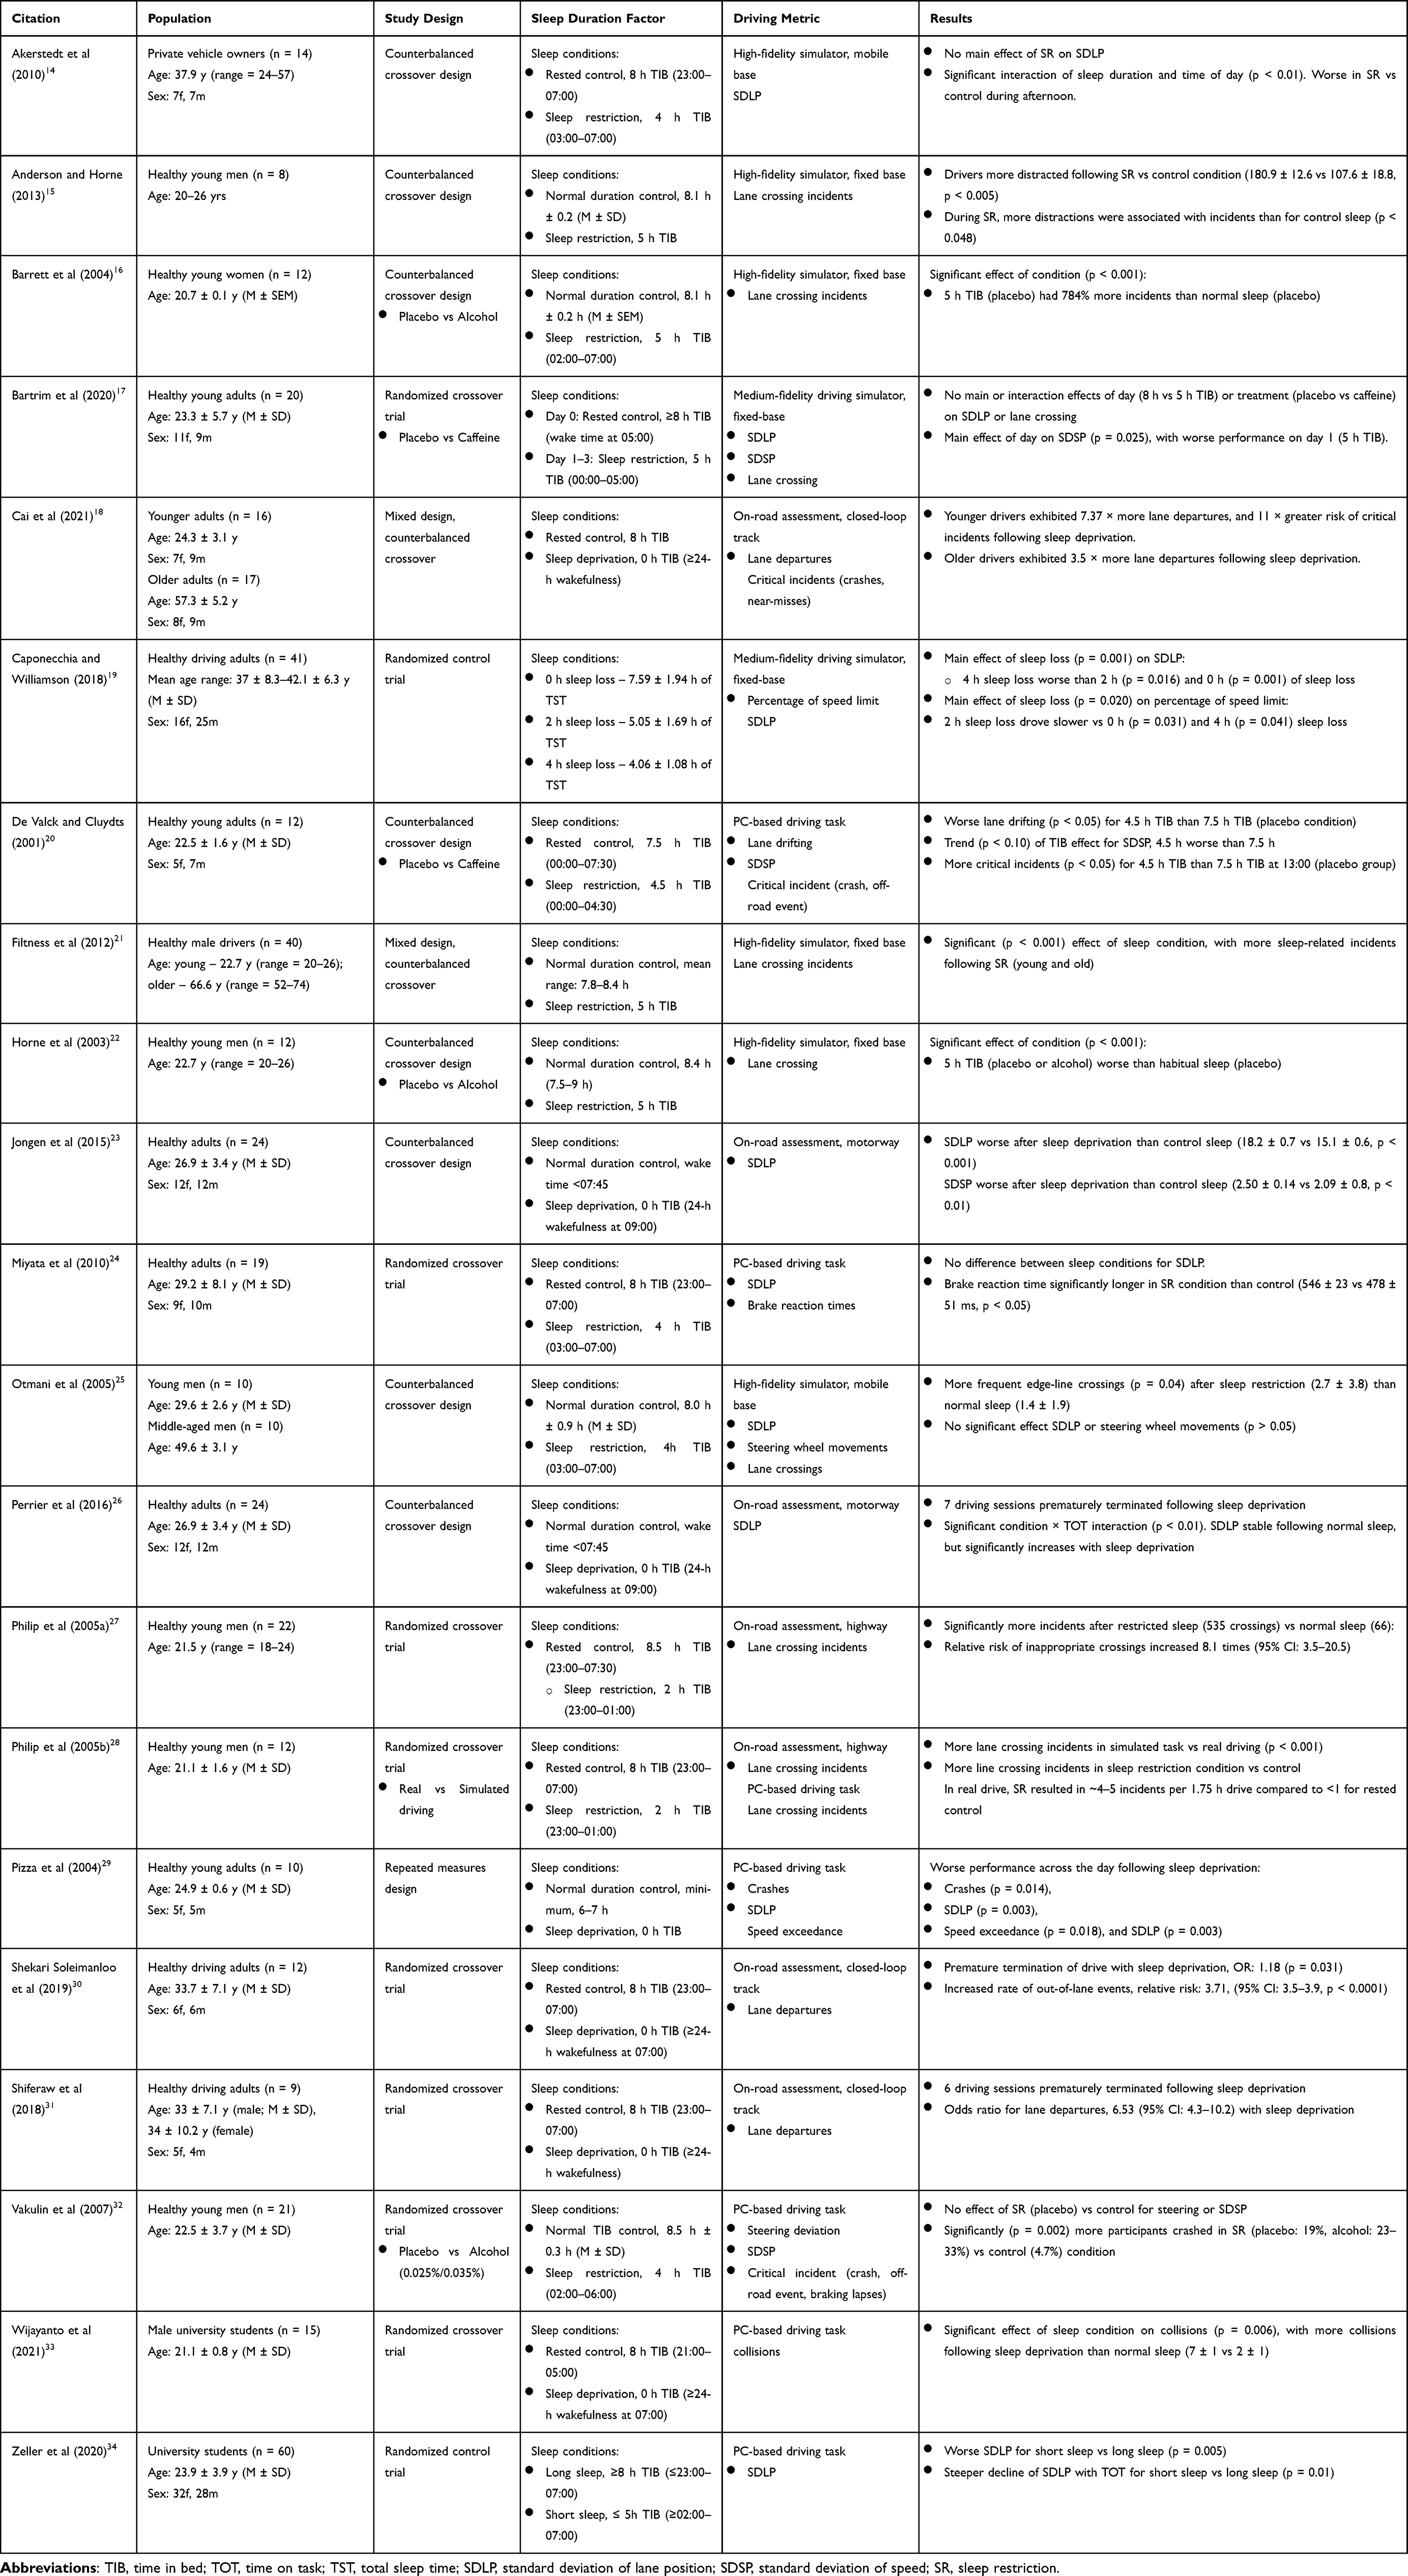 |
Table 1 Experimental and Quasi-Experimental Studies |
Nine experimental studies compared driving following a night-time control sleep with driving following either total sleep deprivation (0 h TIB; n = 7)18,23,26,29–31,33 or severe night-time restriction (2 h TIB; n = 2).27,28 Two of the total sleep deprivation studies were conducted using a computer-based simulated driving task,29,33 while the other five were conducted in real on-road drives, either on closed-loop tracks18,30,31 or on the highway with a licensed instructor.23,26 The two studies involving severe sleep restriction of 2 h TIB also assessed driving on an open highway.27,28 As expected based on the effects of sleep loss in other domains of performance,75,76 these studies all showed severe and significant impairments in both real and simulated driving performance.
The most common measures of driving performance were the standard deviation of lane position (SDLP), the frequency of lane departures/crossings, and crashes. When undergoing total sleep deprivation, a number of studies found that driving performance was significantly worse as compared with well-rested conditions. Pizza et al29 and Jongen et al23 found that SDLP became significantly worse compared to a normal duration of sleep (ie, at least 6–7 h), with on-road and PC-based simulator tasks, respectively. Shiferaw et al31 reported an elevated odds of lane crossings (OR = 6.53), and Shekari Soleimanloo et al30 reported an increased odds (OR = 1.18) of having to terminate the drive prematurely and an increased risk of out-of-lane events (OR = 3.71), both on on-road closed-loop tracks. Similar findings were reported by Cai et al18 on a similar closed-loop track, with lane crossings increasing by 3.5 and 7.4 times in older and younger adults, respectively.
Twelve experimental studies investigated the effects of moderate sleep loss, ranging from 4 h to 5 h TIB. Of these studies, four assessed performance using computer-based simulated driving tasks20,24,32,34 and eight used medium- to high-fidelity driving simulators,14–17,19,21,22,25 which had wider display screens and more realistic vehicle controls. Overall, the results from these studies also indicate significantly worse performance for short sleep durations compared to normal sleep durations of 7.5 h to 8.5 h. When restricted to between 4 h and 5 h TIB, the SDLP tended to become larger and there were more frequent critical incidents, including crashes.20,32,34 This was not uniform across all studies, however, as Miyata et al24 observed no effect of 4-h TIB on SDLP on a PC-based driving task, though brake reaction times did become significantly longer. Research from the high-fidelity driving simulators with fixed base cabins also found significantly more lane crossings and increased SDLP with 5 h TIB. These measures also became significantly worse with high-fidelity driving simulations after 4 h TIB.14,25
In a separate study, Caponecchia and Williamson19 compared the effects of three sleep loss conditions on driving in a medium-fidelity simulator by requiring participants to reduce their normal sleep durations via delayed bedtimes – 0 h (control), 2 h, or 4 h. Participants obtained an average (± SD) of 7.6 (± 1.9) h, 5.1 (± 1.7) h, and 4.1 (± 1.1) h of sleep in each condition, respectively. It was found that SDLP during the subsequent morning drive was significantly worse for participants who slept ~4.1 h than for both other conditions, but sleeping ~5.1 h was not significantly worse than ~7.6 h. In terms of maintaining the speed limit, participants who slept ~5.1 h (mild sleep loss) drove slower than those in the control and moderate sleep loss conditions – possibly an indication of drivers with less sleep loss attempting to be more careful and drivers with greater sleep loss being more reckless. Although the effects of 4–5 h TIB have not compared against a control sleep, all the results show a consistent pattern of impairment on the primary driving measures. No experimental or quasi-experimental studies investigated the effects of sleep restriction to 6 h or 7 h TIB.
Naturalistic and Longitudinal Studies
Naturalistic studies typically involve observation without the classification of participants into groups, and without the implementation of specific conditions. Just one longitudinal and three naturalistic studies were included in this review based on the predetermined selection criteria, the findings of which were all based on self-report measures (Table 2). Two naturalistic studies were based on data collected from professional drivers (heavy vehicle drivers),35,36 with one naturalistic study of a population of nurses37 and the one included longitudinal study based on a large sample of young drivers (aged 17–24 years).38 All studies included real-world driving outcomes, such as crash rates and driving performance measures (ie, lane deviation). Two studies35,38 provided a comparison of driving outcomes in situations where prior sleep was either greater or less than 6 h in the previous day. Findings suggested that where drivers had fewer than 6 h of sleep prior to driving, there was an increased risk of crashes and critical incidents (ie, both crashes and near misses). However, neither study broke down prior sleep duration further than a simple pairwise comparison (ie, comparing a longer sleep with a shorter sleep group). Therefore, it is possible (and indeed likely) that greater performance decrements occur when fewer than 6 hours of prior sleep is obtained. One study36 found that driving performance decrements were seen earlier in the drive in heavy vehicle drivers who obtained fewer than 7 h of sleep as compared with drivers who had obtained more sleep. Conversely, one study indicated that there was no difference in driving performance metrics (swerve and hard braking) based on prior sleep.37 Unfortunately, no appropriate odds ratios were included within any naturalistic or longitudinal study. As a result, we are limited to the conclusions we can draw from these studies on the relationship between prior sleep and driving performance – other than to state that more sleep is typically associated with improved performance.
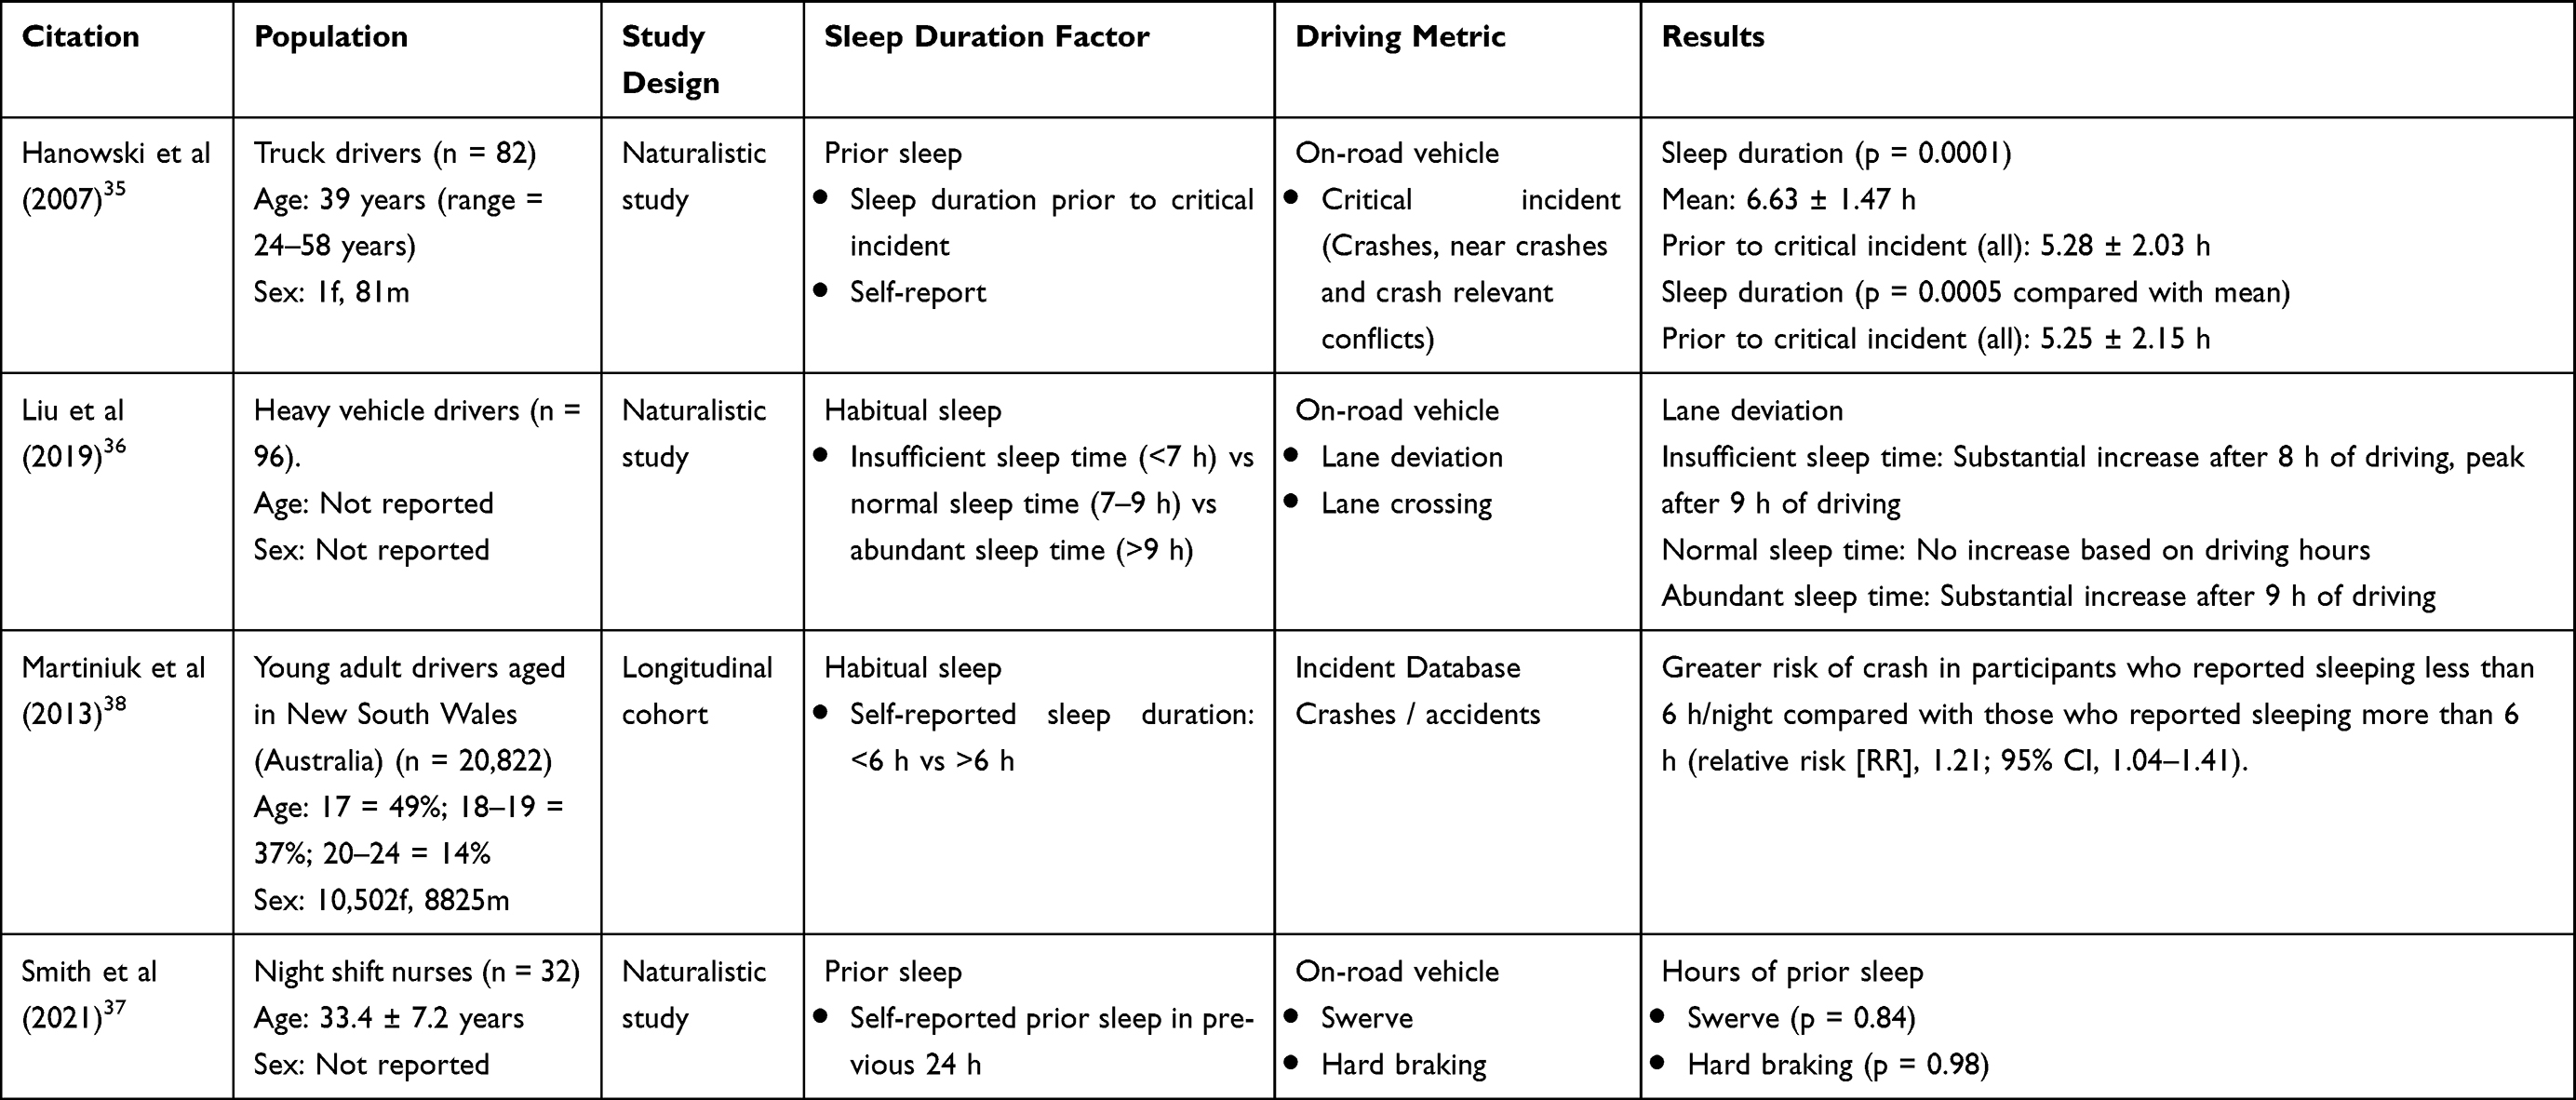 |
Table 2 Naturalistic and Longitudinal Studies |
Case–Control Studies
After screening, 11 case–control studies were deemed eligible for inclusion (Table 3). In the context of this review, these studies obtained driving incident records (cases) from crash databases, police reports, or at hospital emergency rooms. Comparisons of prior sleep duration were then made between these groups and matched controls (who had either not experienced a crash, had only experienced a non-sleep-related crash, or were not deemed culpable of a crash). There were some differences in how sleep-wake history was measured and how cases/controls were defined between case–control studies included in this review. Nine case–control studies measured self-reported sleep duration in the prior sleep period, prior night, or the prior 24 h immediately before the crash.39–41,43–45,48,49 The remaining case–control studies measured average daily sleep over the past week and amount of sleep in the prior 48 h,42 or the average daily sleep in the last three months.46 Cases were defined as crashes where at least one person died or was injured requiring hospitalization;44 where the driver was admitted to the hospital emergency room;46 where a fatality was caused by falling asleep at the wheel;45 reported by police officers;47 and where the drivers were hospitalized and also deemed to be responsible for the crash.39,40,49
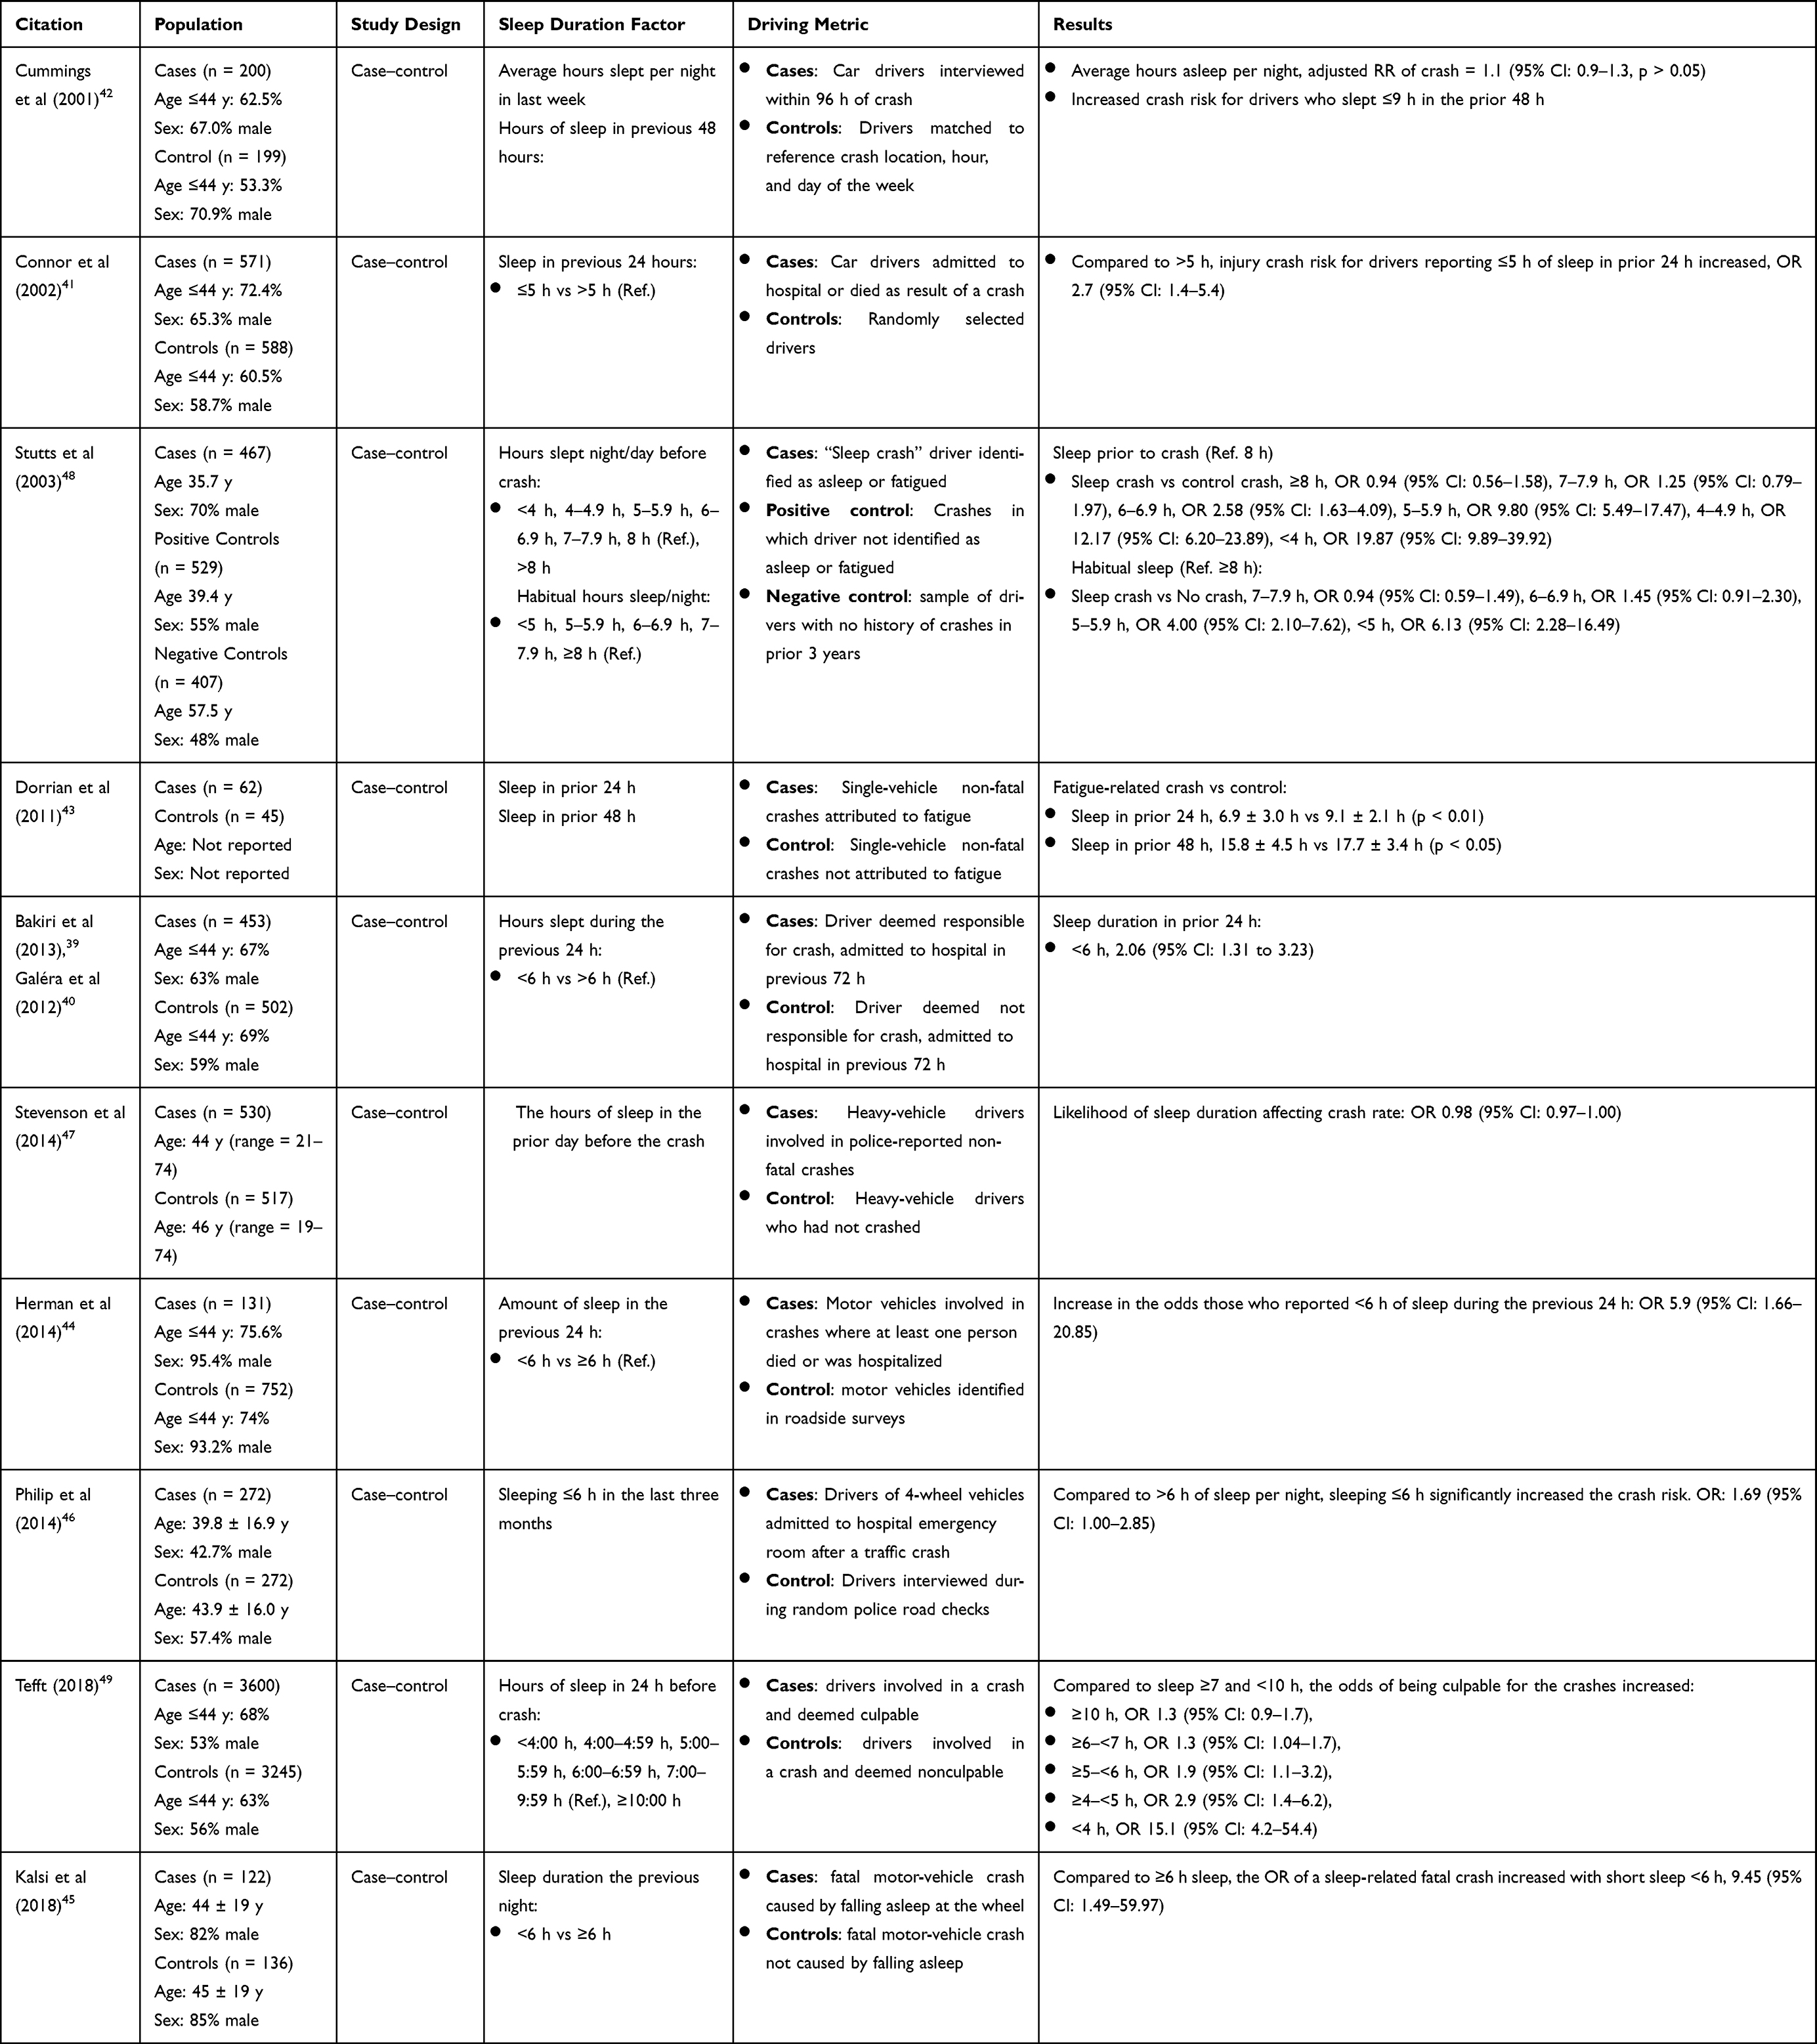 |
Table 3 Case–Control Studies |
Crash likelihood was assessed based on a selected sleep duration cut-point. Five studies investigated the odds of having an incident after <6 h of sleep compared to >6 h of sleep,39,40,44–46 and one study compared the odds of an incident after <5 h compared to >5 h sleep.41 Bakiri et al39 found that there was more than double the odds having a crash with <6 h sleep (OR: 2.06, 95% CI: 1.31–3.23), and Herman et al44 found that the odds of crashing were almost six times greater (OR: 5.9, 95% CI: 1.66–20.85). Kalsi et al45 found that the odds of a fatal accident following <6 h of sleep the previous night were significantly higher than with >6 h of sleep (OR: 9.45, 95% CI: 1.49–59.97). When using a shorter sleep cut-point of <5 h of sleep in the past 24 h, Connor et al41 found that the odds of a serious crash were more than double for the short sleep group (OR: 2.7, 95% CI: 1.4–5.4).
Unlike the aforementioned case–control studies, Stutts et al48 and Tefft49 assessed the odds of having a crash based on multiple sleep duration conditions against a reference sleep. Compared to 8 h of sleep in the prior 24 h, the odds of a fatigue-related crash over a regular crash increased after 6–7 h of prior sleep (OR: 2.6, 95% CI: 1.6–4.1) but even more so after <4 h of prior sleep (OR: 20, 95% CI: 9.9–39.9).48 In the study by Tefft,49 drivers were most likely to be identified as culpable of causing a crash when obtaining less than 4 h sleep (OR: 15.1, 95% CI: 4.2–54.5). However, even a mild form of sleep loss (6–7 h sleep obtained in the last 24 h) increased the odds of being culpable of a crash (OR: 1.3, 95% CI: 1.04–1.7). Approximately double the risk of being culpable for a crash was seen at between ≥5–<6 h (OR: 1.9, 95% CI: 1.1–3.2) and ≥4–<5 h (OR 2.9, 95% CI: 1.4–6.2). See Figure 2 for an overview of crash likelihood based on prior sleep within case–control studies that reported appropriate odds ratios.
 |
Figure 2 Odds ratios for case–control studies assessing the likelihood of a crash based on prior sleep. †OR of a fatigue crash vs non-fatigue crash, *OR of a fatigue crash vs no crash. Note Ref categories differ between studies (range: 6–8 h) but reflect a greater amount of prior sleep. |
Cross-Sectional Studies
Twenty-five cross-sectional studies met the inclusion criteria (Table 4). A number of these studies were performed in large samples of the general population,51–53,55–57,69,71,72 with some performed in occupation-based samples, such as nurses54 and heavy vehicle drivers.61,63–68,70 Typically, these studies were based on either interview or survey data and therefore relied on individual recall.
 |
Table 4 Cross-Sectional Studies |
Most cross-sectional studies were based on habitual reports (ie, how much sleep is generally obtained and/or crashes or incidents that occurred over the previous month/year) (n = 20). As would be expected, poorer driving outcomes were generally seen when fewer hours of sleep were habitually obtained. Many studies broke the amount of prior sleep into categories for direct comparison (ie, comparing driving outcomes in individuals who regularly obtain more or less than X hours of sleep per night). However, due to the real-world nature of these data, and the fact that habitual sleep duration for most individuals is over 6 h,77 few cross-sectional studies included group comparisons based on short periods of sleep (eg, <5 h sleep per night).
Two included articles (based on the same dataset) included participants who reported severely truncated habitual sleep opportunities. This study on truck drivers in India found that when drivers reported a habitual sleep duration of less than 4 h per night, there was an increased likelihood of driving violations, as compared with those who regularly obtained 6–8 h of sleep (OR: 0.87 when <4 h prior sleep used as reference).65 The second article using this dataset reported a similar increase in the likelihood of falling asleep while driving in individuals who regularly obtained less than 4h sleep/night (OR = 2.52).66
In a study of 683 heavy vehicle drivers, individuals who habitually obtained 5 h sleep/night were over twice as likely to fall asleep at the wheel than drivers who regularly obtain more than 7 h/sleep per night.70 This aligns with findings of a study of over 31,000 truck drivers, where a significantly higher likelihood of having fallen asleep while driving over the past month was reported if the driver habitually reported obtaining either 5 h or 6 h of sleep as compared with obtaining 7 h of sleep.67 Within this study, approximately double the crash risk was seen when drivers habitually obtained 5 h of sleep per night as compared with 6 h. Similarly, driving errors (speeding, sudden start and acceleration, sudden deceleration, sudden braking) have been shown to double between 5 h and 6 h of habitual sleep.61 One study examined shorter amounts of prior sleep than 6 h but unfortunately did not report the outcomes of less than 5 h prior sleep separately.59 This study found that in drill sergeants during a multi-day training operation, 47% of participants with an average of ≤5 h sleep/night during the week fell asleep while driving. These participants were more than twice as likely to fall asleep while driving than participants who had ≥6 h/night during the week.
A number of studies included in this review compared driving outcomes between groups who habitually obtained either greater than or less than 6 h prior sleep. The majority of these studies demonstrate that where less then 6h of sleep is obtained, there are significant increases in self-reports of falling asleep while driving,56,62 driving crashes during the previous year,69 and both rear end collisions and single vehicle crashes.50 One study found that the frequency of having fallen asleep while driving during the previous year was significantly greater for individuals who habitually obtain less than 6 h sleep/night (15.4% of all individuals) than those who obtain between 7 h and 8 h of sleep.52 However, this study also showed a significant increase in crash likelihood for individuals who regularly obtain 6–7 h of sleep per night – though to a smaller magnitude (9.7% of individuals).52
When the rate of motor vehicle crashes that the participant attributed to falling asleep at the wheel was assessed as an outcome, a significant increase was seen when <6 h of habitual sleep (2.2% of individuals having experienced a crash caused by falling asleep) was compared with 7–8 h (0.2%).51 A separate study included crash and near miss rates (though these were not necessarily attributed to fatigue/falling asleep at the wheel).63 In this study, participants who habitually obtained less than 6 h sleep/night were far more likely to experience a crash in the previous year (24%) than participants who regularly obtained ≥7 h (0%) or between 6 h and 7 h (8%) of sleep per night. Similarly, approximately double the number of individuals who obtained less than 6 h of sleep per night had experienced a near miss in the previous year, when compared with those who obtained 7 h or more sleep each night. Another study, based on population-level crash data, found that when prior sleep and time awake were included in a predictive model, there was a strong effect for obtaining fewer than 6 h of sleep prior to the crash.72 This study also found a strong effect of prior wake time >16 h when compared with <8 h.
Several cross-sectional studies included in this review compared habitual prior sleep with a higher-level cut-point (ie, 7 or 8 h sleep). One study compared outcomes from a large (~74,000) sample of drivers from the general population who regularly obtained greater or less than 7 h of sleep.55 This study found that the shorter sleep group were more likely to report having fallen asleep while driving in the last 30 days (7.3% vs 3% of participants). Similarly, a study of over 11,000 university students in China found a greater likelihood of being injured in an automobile crash in individuals who habitually obtained less than 7 h of sleep per night (OR = 1.58).74 Additionally, a significant increase in crash risk was shown in a sample of young drivers who regularly obtain less than 8 h of sleep, compared with those who regularly obtain ≥8 h (OR = 1.28).60
Some studies (n = 3) performed correlational or regression analyses (rather than comparing groups) and found that sleep duration was significantly associated with an increased crash risk.54,64 Another study indicated that shorter sleep duration was associated with an increased likelihood of having fallen asleep while driving (as opposed to experiencing a crash) in the previous year.53
Just one study examined sleep duration over the previous 48 h,58 finding that for participants who reported less than 10 h of sleep over this period, there was an increased likelihood of a lane crossing (adjusted OR 2.58). However, this study did not compare the difference in driving performance based on hours of sleep over the previous 48 h in any more granularity than a binary comparison.
Several cross-sectional studies did not find any significant differences in driving outcomes based on prior sleep. For example, when likelihood of experiencing a self-reported accidental injury of any kind (including traffic injuries) was assessed based on prior sleep, there were no differences between individuals who habitually obtained more or less than 7 h sleep per night.57 Similarly, studies have reported no differences in lane crossings,58 near misses, or crashes68 when prior sleep was broken into greater or less than 5 h. Furthermore, one study based on data collected mid-drive at a tollbooth found no relationship between prior sleep and near miss sleepy accidents (NMSA) either during the present drive or in the previous year,71 and also no significant relationships were seen between prior sleep and lapses, errors, code violations, or near misses while driving.73
Figure 3 presents odds ratios for cross-sectional studies based on both prior sleep duration (ie, 5h, 6h, 7h) and outcome measure. Outcome measures have been divided into either driving performance (eg, lane deviation, over-speeding) or the likelihood of a crash or falling asleep while driving. Studies where odds ratios were not available were not included. Figure 4 presents an overview of odds ratio outcomes of both case–control and cross-sectional studies based on the amount of prior sleep.
 |
Figure 3 Odds ratios for cross-sectional studies assessing the adverse driving outcomes based on prior sleep. Note Ref categories differ between studies (range: 6–8 h) but reflect a greater amount of prior sleep. |
 |
Figure 4 Odds ratios for cross-sectional and case–control studies assessing the likelihood of an adverse driving outcome (driving errors, falling asleep while driving, or crashing) based on prior sleep. Note Ref categories differ between studies (range: 6–8 h) but reflect a greater amount of prior sleep. †Fatigued crash versus non-fatigued crash. *Fatigued crash versus no crash. |
Meta-Analysis
Three meta-analyses were conducted: five hours or more sleep vs less than five hours sleep, six hours or more sleep vs less than six hours sleep and seven hours or more sleep vs less than seven hours sleep.
Five Hours vs Less Than Five Hours Sleep
Two studies were eligible for inclusion in the five hours vs less than five hours sleep meta-analysis41,58 (Figure 5). Pooled odds ratio meta-analysis showed a significant difference in odds of a poor driving outcome between the five hours sleep and the less than five hours sleep groups OR = 1.63, 95% CI [0.07; 3.19] p = 0.040. The results showed no significant heterogeneity (I2 = 53.2%, Q = 2.14, p = 0.144). Visual analysis of funnel plots shows some possible publication bias (Supplementary Material D: Supplementary Figure 1, Panel A).
 |
Figure 5 Forest plot of odds ratio meta-analysis for five hours sleep vs less than five hours sleep. Diamond presents the pooled odds ratio of studies included in meta-analysis. Dotted line denotes the odds ratio prediction interval. |
The sensitivity analysis showed that the overall effect did not change with either study omitted. The ORs from sensitivity analysis ranged from 1.04 to 2.70. Subgroup analysis showed no significant difference between study by driving outcome: crash (k = 1) and lane crossing (k = 1), p = 0.144.
Six Hours Sleep vs Less Than Six Hours Sleep
Ten studies were eligible for inclusion in the six hours sleep vs less than six hours sleep meta-analysis38,39,42,44–46,50,59,61,69 (Figure 6). Pooled odds ratio meta-analysis showed a significant difference in odds of poor driving outcome between the six hours sleep and the less than six hours sleep groups, OR = 1.27, 95% CI [1.08; 1.45], p < 0.0001. The results showed no significant heterogeneity I2 = 5.90%, Q = 9.56, p = 0.387. Egger’s test and funnel plot analysis showed possible publication bias (Supplementary Material D: Supplementary Figure 1, Panel B) p = 0.006.
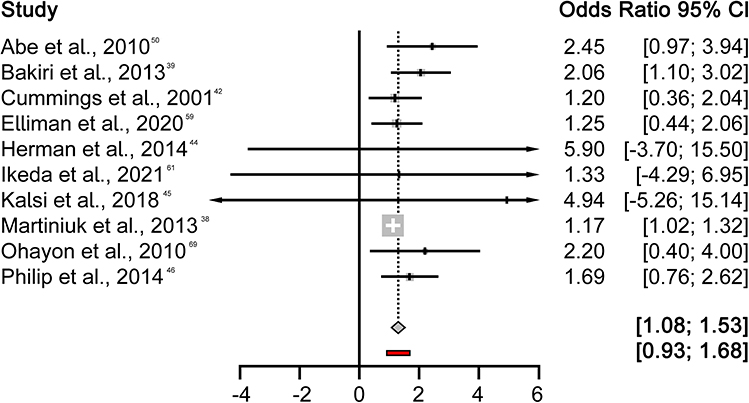 |
Figure 6 Forest plot of odds ratio meta-analysis for six hours or more sleep vs less than six hours sleep. Diamond presents the pooled odds ratio of studies included in meta-analysis. Dotted line denotes the odds ratio prediction interval. The red rectangle denotes the predicted confidence interval for pooled effect. |
The sensitivity analysis showed that the overall effect did not change with any studies omitted. The ORs from sensitivity analysis ranged from 1.20 to 1.63. Subgroup analysis showed no significant difference between study by driving outcome: crash (k = 9) and falling asleep (k = 1) p = 0.083.
Seven Hours Sleep vs Less Than Seven Hours Sleep
Six studies were eligible for inclusion in the seven hours sleep vs less than seven hours sleep meta-analysis49,57,60,67,72,74 (Figure 7). Pooled odds ratio meta-analysis showed a significant difference in odds of poor driving outcome between the seven hours sleep and the less than seven hours sleep groups, OR = 1.45, 95% CI [1.01; 2.50], p < 0.0001. The results showed significant heterogeneity between studies I2 = 73.20%, Q = 18.63, p = 0.002. Egger’s test and funnel plot analysis showed no significant publication bias (Supplementary Material D: Supplementary Figure 1, Panel C), p = 0.080.
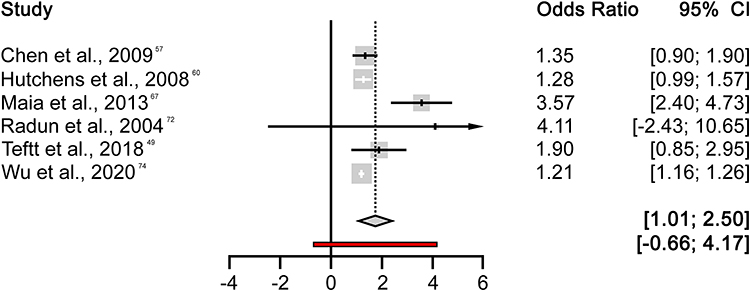 |
Figure 7 Forest plot for meta-analysis of seven hours or more sleep vs less than seven hours sleep. Diamond presents the pooled odds ratio of studies included in meta-analysis. Dotted line denotes the odds ratio prediction interval. The red rectangle denotes the predicted confidence interval for pooled effect. |
The sensitivity analysis showed that the overall effect did not change with any studies omitted. The ORs from sensitivity analysis ranged from 1.22 to 1.94. Subgroup analysis showed a significant difference by driving outcome: crash (k = 4), falling asleep (k = 1) and Injury (k = 1), p < 0.001. Falling asleep contributed the largest OR = 1.23, 95% CI [1.16; 1.26], followed by injury OR = 1.35, 95% CI [0.90; 1.80] and then crash OR = 1.21 95% CI [1.15; 1.26].
Study Quality
The quality of studies included in this review was generally moderate to high, as indicated by completion of JBI critical assessment tools (randomized controlled trial, quasi-experimental, case–control, and cross-sectional tools). As noted above, studies were categorised as being of low quality if they scored ≤40%, moderate quality if they scored >40 to ≤70%, and of high quality if they scored >70%.13 Questions are numbered within the tables, and question text can be found in Supplementary Material C. Quality assessment outcomes with associated percentages of criterion questions answered “yes” for experimental studies can be seen in Supplementary Table 1, for quasi-experimental studies in Supplementary Table 2, for naturalistic and longitudinal studies in Supplementary Table 3, for case–control studies in Supplementary Table 4, and for cross-sectional studies in Supplementary Table 5. Scores ranged from 8 to 11, 6 to 8, 3 to 7, 6 to 10, and 3 to 8 on the experimental, quasi-experimental, naturalistic/longitudinal, case–control, and cross-sectional studies, respectively. The average proportion of criterion answered “yes” was 72.5% for experimental studies, 81.0% for quasi-experimental studies, 56.5% for naturalistic and longitudinal studies, 82.7% for case–control studies, and 68.6% for cross-sectional studies. The average proportion of criterion answered “yes” across all studies was 73.2% (high quality). As such, we can be reasonably confident in the evidence presented within this review as a whole. In particular, the evidence provided by studies with a higher degree of control over variables (ie, experimental, quasi-experimental, and case–control studies) was of particularly high quality. We can therefore be particularly confident in the conclusions drawn from these studies.
Discussion
To determine a point at which it may be legally possible to deem an individual to be impaired, it is critical to review the evidence available on driving performance based on prior sleep-wake behaviour. This systematic review was performed to synthesise relevant literature based on key study designs: experimental or quasi-experimental, naturalistic, longitudinal, case control, and cross-sectional. For all study design types, there were a range of publications available (experimental = 21, naturalistic = 3, longitudinal = 1, case–control = 11, and cross-sectional = 25). As may be expected, findings of the studies included in this review generally indicated that there is a dose–response relationship between prior sleep duration and driving outcomes. That is, participants who had previously had more sleep tended to perform better on driving tasks (both in a simulator and on the road). These driving outcomes typically included either performance measures (eg, lane deviation, speeding) or fatigue-related events (eg, likelihood of a crash or falling asleep behind the wheel).
A meta-analysis was undertaken of 18 eligible studies to compare the odds of a fatigue-related driving incident (including a crash, falling asleep while driving, injury, and driving error) based on amount of prior sleep. Unfortunately, many studies included in the qualitative review could not be included in the meta-analysis as outcomes inconsistent with odds ratio meta-analysis were reported, or comparable reference and outcome categories were not included in study designs. Despite this, all three meta-analyses showed an increased odds of a driving incident. As may be expected, the greatest likelihood of a driving incident was seen when participants who obtained less than five hours of prior sleep were compared with more than 5 hours of prior sleep. It is crucial to acknowledge, however, that very few studies available could be included in the five-hour meta-analysis due to heterogeneity in the available studies (n = 2).
In determining the appropriate BAC at which to deem a driver to be impaired, the degree of associated crash risk is considered – and decisions can be made as to the degree of risk a jurisdiction is willing to accept. At the 0.05%BAC level, there appears to be at a minimum, double the relative crash risk, as compared with 0.00%BAC – regardless of driver age and gender.78 At the 0.08%BAC level, the relative risk of a crash doubles again (ie, a driver is four times more likely to have a crash at this BAC as compared with 0.00%BAC).78 For many industrialised jurisdictions, the point at which relative crash risk reliably doubles is established as the point at which an individual will be “deemed impaired”.78 It may not be unreasonable to consider the point at which relative risk doubles based on fatigue. That is, how much prior sleep can be lost before the risk of a crash doubles – and is this considered an appropriate point at which to deem a driver impaired?
A Potential Point to Deem Impairment
To decide where to deem impairment, outcomes of all study types can be evaluated to establish an amount of prior sleep that is most likely to accurately reflect driving performance outcomes for most drivers, most of the time. Within the present review, most studies that included 4 h or 5 h sleep periods saw significant and severe decreases in driving performance and/or increases in the likelihood of falling asleep at the wheel or experiencing a vehicle crash. These decrements generally reflected approximately double the likelihood of an adverse outcome (with some studies suggesting a far higher likelihood). Of note, the meta-analysis comparing five hours or more sleep with less than five hours sleep was only able to include two studies, due to heterogeneity in the available studies. However, this analysis indicated a near doubling of the odds of a driving error.
Performance decrements seen when drivers had either six or seven hours of prior sleep were both lower in severity and less consistent in their occurrence. Despite reduced impairment, this evidence does not suggest that if >5 h sleep is obtained, all individuals will be safe to drive. That is, while it may be fair to classify individuals as “impaired” if they have had four or five hours of prior sleep (as impairment would likely be experienced by most individuals, most of the time), the opposite is not necessarily true for greater than 5 h of prior sleep.
Arguably, this synthesis of the literature would support the theoretical implementation of deemed impairment at the 4–5 h of prior sleep range, given that the relative risk of a crash and/or serious driving error appears to approximately double after less than 5 h prior sleep. However, we must also consider community expectations and the practicality of implementing and enforcing this type of regulation – in addition to the degree of acceptability from regulatory bodies. As with the advent of blood alcohol concentration limitations, it may be prudent to begin with slightly more permissive restrictions – which most individuals are currently likely to meet during most drives regardless of fatigue-related deemed impairment regulation. The requirement for drivers to obtain at least 4 h of sleep prior to driving may be a more practical first step, rather than requiring 5 h of prior sleep. This is consistent with a 2016 expert consensus statement based on a Delphi methodology, which identified 2 h sleep in the previous 24 h as a potential point after which individuals are definitely unsafe to drive, but note that a high degree of impairment is also likely after 3–5 h prior sleep.79
While a review of the literature may be able to establish a comparison between fatigue-related driving impairment and alcohol-related driving impairment, public policy and regulation are typically based on more than scientific evidence in isolation. For example, community acceptance of driving limitations must be considered, in addition to the appetite of relevant regulatory bodies to both implement and enforce fatigue-related deemed impairment. Furthermore, the practicality of enforcement may also play a role in establishing this type of regulation (eg, the limitations of roadside testing and/or the inclusion of prior sleep-wake behaviour in post-crash legal proceedings). Furthermore, there may be the opportunity to change these restrictions over time as community acceptability and familiarity with the concept of fatigue-related deemed impairment grows. This tightening of restrictions has happened with alcohol use in several jurisdictions, including Australia, with the permitted BAC decreasing from 0.08%BAC to 0.05%BAC over time.80
Considerations When Assessing Fatigue-Related Driving Impairment Literature
Determining what constitutes sufficient sleep to drive safely is, by nature, arbitrary to a degree. However, experimental studies (which include a high degree of control over potentially confounding factors) generally indicated that significant and severe performance decrements were seen when drivers had five or fewer hours of sleep in the previous 24 h period. As may be expected, it appears that greater decrements to driving performance occur when fewer hours of sleep were obtained (ie, performance was poorer after 4 h of prior sleep than after 5 h of prior sleep). This was demonstrated by several high-quality studies, such as Caponecchia and Williamson,19 who found that there was a marked difference in driving performance between individuals who had 4 h of prior sleep and those who had 5 h of prior sleep. Compared to prior sleep of ~8 h, Otmani et al25 found more frequent lane crossings and Åkerstedt,14 in a particularly high-quality study (as determined via JBI assessment), saw a worsening of lane deviation after 4 hours of prior sleep opportunity. Several other key studies with high-fidelity simulators show large performance decrements, including significantly more lane crossings, after a 5 h sleep opportunity compared to 8 h opportunity.15–17,21,22 All included experimental and quasi-experimental studies were classified as either of high or moderate quality according to JBI quality assessments, suggesting that these findings are likely reflective of actual impairment. It therefore appears that based on experimental data, a significant increase in fatigue-related performance impairments to driving is seen when the individual has had fewer than 4 h sleep the previous night, but substantial decrements are also generally seen with less than 5 h sleep.
Experimental studies included in this review were typically based on simulated driving performance and differ from on-road studies in both outcome measures (ie, lane deviation/speeding on a simulated driving task as compared with real-world metrics such as motor vehicle crashes) and the amount of prior sleep that was typically reported. By nature, naturalistic, longitudinal, case–control, and cross-sectional studies are based on either survey-style data collection or similar (eg, sleep and driving recall diaries), or large-scale crash statistics. As a result, there is less capacity for these real-world studies to control the amount of sleep obtained prior to driving. This means that, for many real-world studies, the amount of prior sleep assessed was greater than within experimental studies. Therefore, a number of studies compared real-world driving outcomes after 6, 7, or 8 h of sleep in the previous 24 h. These studies suggest that the most substantial differences in driving outcomes, including crash likelihood, were seen when drivers obtained less than 6 h sleep the night before. Fortunately, several key studies examined driving performance where prior sleep was greater or less than 4 or 5 h the night before.61,65–67 These studies found that for drivers who regularly obtain less than 4 h sleep/night,65,66 the odds of falling asleep while driving were more than double those who regularly obtain 6–8 h sleep/night. However, drivers who habitually obtained less than 5 h sleep/night were also twice as likely to fall asleep than drivers who obtained at least 7 h sleep.70 Double the level of risk (of both crashes and driving errors) was also reported by other studies after obtaining less than 5 h prior sleep.61,67 As such, it appears that based on self-report and habitual data (eg, cross-sectional, naturalistic, and longitudinal studies), a significant (approximately double) level of risk is seen after obtaining less than 5 h sleep the previous night. However, it must be noted that three out of four studies in this category had JBI quality scores of 50% or less, suggesting an overall low quality of evidence.
In a similar way to many of the included cross-sectional, naturalistic, or longitudinal studies, all included case–control studies were based on on-road data. However, these designs allow for more direct comparisons – for example, between groups of individuals who either had (case) or had not experienced a motor vehicle crash (control). From these studies, we can estimate the likelihood of a crash based on prior sleep. Several studies found double or greater risk of a crash after having had less than 6 h sleep the night before, as compared to being well rested.39,44,48 With even less prior sleep (ie, 5 h), a greater likelihood of crash was seen (between two and twelve times more likely41,48,49). However, as with many observational studies included in this review, little granularity is available differentiating between, for example, three, four, and five hours of prior sleep (ie, all sleep periods ≤5 h are categorised together). However, all case–control studies included in this review were of high or moderate quality according to JBI assessments, suggesting that we can have a high degree of trust in these outcomes. It is therefore likely that this high degree of variability in crash likelihood represents differences in total sleep time under 5 h.
When determining a point at which to deem an individual impaired, we must also consider the quality of evidence available. For all study design types, JBI quality assessments indicated that the literature in this area is of moderate-to-high quality. As discussed, studies investigating driving performance have been performed using a variety of research designs. Each of these designs has both benefits and limitations. Experimental and quasi-experimental designs are able to clearly differentiate between participants based on prior sleep (as this is typically controlled by the research team). These studies are able to easily compare groups of individuals who obtained 4, 5, and 6 h of sleep the night before – and thus are able to make clear statements as to the likelihood of certain outcomes based on prior sleep. However, these designs typically do not use real-world measures of driving, and therefore rely on the validity of driving simulators to reflect certain performance decrements. While these simulators are typically good at identifying certain driving outcomes (eg, lane deviations or speeding), they have limited applicability to real-world driving outcomes. They are typically not performed over extended periods of time (and as such are less likely to identify the likelihood of falling asleep at the wheel) and do not measure real-world crash likelihood. Conversely, self-report studies (eg, typically naturalistic, or cross-sectional studies) measure real-world outcomes. However, these designs rely on the participant’s memory, which may not be reliable. Furthermore, these study designs are generally based on reports of habitual sleep duration (ie, how much sleep an individual typically obtains), rather than how much sleep an individual reported obtaining prior to a specific driving-related incident (eg, a crash). There may therefore be either an over- or under-estimation of the amount of sleep obtained prior to an incident. It is critical to note that there are both benefits and drawbacks of each design type in establishing the impact of prior sleep on subsequent driving performance. As such, it is likely prudent to consider the findings of all study designs, with particular weighting given to those identified as being of high quality (Supplementary Tables 1–5).
We must also consider the applicability of findings to all drivers. Many studies – particularly those with experimental designs – were based on small sample sizes, which by nature limit generalisability to the broader population. Many of these studies included participants who were young and healthy, with no major sleep or health problems under optimum laboratory conditions (ie, without external factors that typically result in higher levels of fatigue seen in younger drivers81). Some included experimental studies may therefore overestimate driving performance in the general population. It is possible that different driving performance decrements are seen within older age groups or among individuals with certain health conditions.
Limitations
In the context of this systematic review, deemed impairment has been conceptualised based on the amount of sleep an individual has had over the previous day. However, prior sleep in the previous 24 h does not take into consideration other factors that may impact fatigue. For example, time of day is likely to impact fatigue and cognitive performance,82,83 with greater driving impairment typically seen during the overnight period, independent of prior sleep.10 Additionally, time awake is likely to impact fatigue, and associated cognitive performance.10,11,84,85 That is, even if an individual had an extended sleep period the night before, greater fatigue is generally seen when the individual has been awake for a longer period of time. Not only this but prior sleep-wake history across multiple days can have a cumulative impact on fatigue.86,87 As a result, using prior sleep to deem impairment may not capture all causes of elevated fatigue-related driving risk. Furthermore, there are interindividual differences in impairment of performance based on prior sleep,88 which would be a limitation of using prior sleep to establish driving impairment. That is, some individuals (likely a small minority) may be prevented from driving when they are not impaired, and some individuals would be legally permitted to drive, despite experiencing a high degree of impairment. In addition, drivers who have sleep disorders (where sleep may have reduced restorative value) are likely to experience greater fatigue even in situations where they have had what is deemed to be “sufficient sleep”.89
When comparing the potential impact of deemed impairment for fatigued driving with existing drink-driving regulation and enforcement, we must acknowledge that there are inherent differences. For drink-driving, it is likely that significant decreases in crashes and fatalities can, at least in part, be attributed to the capacity for roadside testing.80 Similar roadside testing for prior sleep or fatigue is less straightforward. While there has been some progress toward establishing a biomarker capable for roadside assessment of fatigue, this is not currently available.90 As such, a prior sleep requirement for driving may be difficult to enforce at the roadside. However, it may be possible to initially use fatigue-related deemed impairment regulation as both a deterrent and as part of post-crash prosecution (ie, where digital and/or surveillance records can be used).
In basing this preliminary conceptualisation of deemed impairment on prior sleep only, we must acknowledge that this methodology has limitations. However, we must also consider potential public acceptance and ease of regulation. In this case, scientifically perfect may be the enemy of good policy. That is, a simple, easy to understand measure for deeming impairment (ie, prior sleep) would likely be much easier to implement and communicate to relevant stakeholders (both drivers and regulatory bodies). However, the use of prior sleep only is likely the first step toward a more complex methodology for deeming impairment. A more complex methodology may, for example, include measures of prior wakefulness and sleep over the previous 48 hours – and thus be able to detect fatigue-related impairment more effectively. If additional factors were added to the methodology for deeming impairment, it may be necessary to make simple calculator tools widely available (eg, smartphone applications). Prior sleep-wake behaviour over several days could be entered, with an algorithm indicating whether it is safe to drive. Fatigue calculator tools are currently used within some organisational fatigue management systems and can be an effective strategy for determining whether a task can or cannot be performed.
The findings of the current meta-analysis must also be interpreted in light of the limitations of available data. A limited number of studies could be included in each meta-analysis due to heterogeneity of reference and outcome categories. It was necessary to ensure that outcome (ie, less than five hours sleep) and reference (ie, more than five hours sleep) groups were consistent amongst all studies to ensure interpretability of findings. However, consequently, many studies did not meet the criteria for meta-analysis, and thus were excluded. Furthermore, there were not sufficient studies available to conduct meta-analyses separately based on driving incident type (eg, falling asleep while driving, crash, etc.) which limits the ability to quantitatively determine differences in specific driving risk in relation to time spent asleep. However, when considering the available studies, subgroup analysis showed no significant differences by driving error outcome.
Implementation of “Deemed Impairment”
The concept of fatigue-related deemed impairment must be considered in the context of community and regulatory appetites. When introducing a new regulatory framework, there is the potential to be too stringent with limitations – with potentially negative unintended consequences. For example, if impairment was strictly deemed at the point at which any degree of impairment is seen (ie, typically under 8h of prior sleep), it is likely that many drivers would be “over the limit” during the vast majority of drives.77 While this may have net positive safety outcomes, this level of stringency would likely be accompanied by low levels of both acceptability and practicality (both for drivers and enforcement). Strict limitations in the first instance would also likely be ethically problematic – given that failure to obtain sufficient sleep may be out of the driver’s control, as compared to the consumption of alcohol or other intoxicants (typically a conscious decision).
There may be negative implications of overly permissive regulations which must also be considered. If initial fatigue-related “deemed impairment” regulations are too permissive, a number of situations where a driver is clearly impaired will not be considered illegal. In this case, drivers may also believe that they are “safe” to drive simply because they have had 5 h prior sleep – despite experiencing a high level of impairment. Overly permissive regulations may therefore not have the desired road safety impact – though there may be legal consequences for certain (likely few) individuals. For example, in New Jersey, the “Maggie’s Law” legislation considers drivers to be deemed impaired due to fatigue if they have been awake for longer than 24 h.6 While this law may be applied if an individual is involved in a crash after having had no sleep the previous night, it is unlikely to a) act as a deterrent for other drivers or b) be applied consistently in any meaningful way (ie, via roadside assessment).
As a result of the potential consequences of either too permissive or too stringent points at which an individual may be “deemed impaired”, it may not be unreasonable to follow the strategy used by some jurisdictions when initially implementing BAC as a method of alcohol-related impairment detection. That is, there may be the opportunity to begin with more permissive limitations, while both community members and enforcement agencies adapt to these requirements. After community and regulatory acceptability are established at a more permissive level, the amount of prior sleep legally required prior to driving could be increased as/when appropriate – likely based on changing community standards.
Conclusion
This systematic review presents an overview of the current literature examining prior sleep duration and driving outcomes in an attempt to identify at what point individuals may be deemed to be impaired (ie, generally unable to safely operate a vehicle). The concept of deemed impairment is not new – and in fact has been used successfully in the context of alcohol-related impairment. It appears that there may be the potential for fatigue-related impairment to be deemed at between 4 and 5 h of prior sleep, where the likelihood of being in a fatigue-related vehicle crash is at least double that of a well-rested individual. However, it must be acknowledged that there is no right answer. In making this decision, it is not only the scientific evidence that must be considered but also community expectations and acceptability, practicality of enforcement, and regulatory appetites. Future investigation of these community attitudes, in addition to practical and enforcement matters, is required to understand the potential impact of fatigue-related deemed impairment on road users and road safety, and how regulation or legislation may be implemented effectively.
Funding
This systematic review is supported by the Australian Government Office of Road Safety’s Road Safety Innovation Fund (RSIF2-73).
Disclosure
Professor Gregory Roach reports grants from Department of Infrastructure, Transport, Regional Development Communications and the Arts, during the conduct of the study. The authors declare no other conflicts of interest in this work.
References
1. International Transport Forum. Road safety report: Australia 2020; 2020.
2. Global Road Safety Partnership. Speed Management: A Road Safety Manual for Decision-Makers and Practitioners. Global Road Safety Partnership; 2008.
3. Davey JD, Freeman JE. Improving road safety through deterrence-based initiatives: a review of research. Sultan Qaboos Univ Med J. 2011;11(1):29–37.
4. Agent KR, Green ER, Langely RE. Evaluation of kentucky’s” you drink and drive. You lose” Campaign; 2002.
5. Dawson D, Sprajcer M, Thomas M. How much sleep do you need? A comprehensive review of fatigue related impairment and the capacity to work or drive safely. Accid Anal Prev. 2021;151:105955. doi:10.1016/j.aap.2020.105955
6. Levine JD. A road to injustice paved with good intentions: maggie’s misguided crackdown on drowsy driving. Hastings Law J. 2004;56:1297.
7. Creaser JI, Ward NJ, Rakauskas ME, Shankwitz C, Boer ER. Effects of alcohol impairment on motorcycle riding skills. Accid Anal Prev. 2009;41(5):906–913. doi:10.1016/j.aap.2009.04.007
8. Moskowitz H, Burns M, Fiorentino D, Smiley A, Zador P. Driver characteristics and impairment at various BACs; 2000.
9. Martin J-L, Gadegbeku B, Wu D, Viallon V, Laumon B. Cannabis, alcohol and fatal road accidents. PLoS One. 2017;12(11):e0187320. doi:10.1371/journal.pone.0187320
10. Matthews RW, Ferguson SA, Zhou X, Kosmadopoulos A, Kennaway DJ, Roach GD. Simulated driving under the influence of extended wake, time of day and sleep restriction. Accid Anal Prev. 2012;45(Supplement):55–61. doi:10.1016/j.aap.2011.09.027
11. Matthews RW, Ferguson SA, Zhou X, et al. Time-of-day mediates the influences of extended wake and sleep restriction on simulated driving. Chronobiol Int. 2012;29(5):572–579. doi:10.3109/07420528.2012.675845
12. Page MJ, McKenzie JE, Bossuyt PM, et al. The PRISMA 2020 statement: an updated guideline for reporting systematic reviews. Syst Rev. 2021;10(1):89. doi:10.1186/s13643-021-01626-4
13. Peimani M, Nasli-Esfahani E, Sadeghi R. Patients’ perceptions of patient–provider communication and diabetes care: a systematic review of quantitative and qualitative studies. Chronic Illn. 2020;16(1):3–22. doi:10.1177/1742395318782378
14. Akerstedt T, Ingre M, Kecklund G, et al. Reaction of sleepiness indicators to partial sleep deprivation, time of day and time on task in a driving simulator – the DROWSI project. J Sleep Res. 2010;19(2):298–309. doi:10.1111/j.1365-2869.2009.00796.x
15. Anderson C, Horne JA. Driving drowsy also worsens driver distraction. Sleep Med. 2013;14(5):466–468. doi:10.1016/j.sleep.2012.11.014
16. Barrett PR, Horne JA, Reyner LA. Sleepiness combined with low alcohol intake in women drivers: greater impairment but better perception than men? Sleep. 2004;27(6):1057–1062. doi:10.1093/sleep/27.6.1057
17. Bartrim K, McCarthy B, McCartney D, Grant G, Desbrow B, Irwin C. Three consecutive nights of sleep loss: effects of morning caffeine consumption on subjective sleepiness/alertness, reaction time and simulated driving performance. Transp Res Part F Traffic Psychol Behav. 2020;70:124–134. doi:10.1016/j.trf.2020.02.017
18. Cai AWT, Manousakis JE, Singh B, et al. On-road driving impairment following sleep deprivation differs according to age. Sci Rep. 2021;11(1):21561. doi:10.1038/s41598-021-99133-y
19. Caponecchia C, Williamson A. Drowsiness and driving performance on commuter trips. J Safety Res. 2018;66:179–186. doi:10.1016/j.jsr.2018.07.003
20. De Valck E, Cluydts R. Slow-release caffeine as a countermeasure to driver sleepiness induced by partial sleep deprivation. J Sleep Res. 2001;10(3):203–209. doi:10.1046/j.1365-2869.2001.00260.x
21. Filtness AJ, Reyner LA, Horne JA. Driver sleepiness-comparisons between young and older men during a monotonous afternoon simulated drive. Biol Psychol. 2012;89(3):580–583. doi:10.1016/j.biopsycho.2012.01.002
22. Horne JA, Reyner LA, Barrett PR. Driving impairment due to sleepiness is exacerbated by low alcohol intake. Occup Environ Med. 2003;60(9):689–692. doi:10.1136/oem.60.9.689
23. Jongen S, Perrier J, Vuurman EF, Ramaekers JG, Vermeeren A. Sensitivity and validity of psychometric tests for assessing driving impairment: effects of sleep deprivation. PLoS One. 2015;10(2):e0117045. doi:10.1371/journal.pone.0117045
24. Miyata S, Noda A, Ozaki N, et al. Insufficient sleep impairs driving performance and cognitive function. Neurosci Lett. 2010;469(2):229–233. doi:10.1016/j.neulet.2009.12.001
25. Otmani S, Pebayle T, Roge J, Muzet A. Effect of driving duration and partial sleep deprivation on subsequent alertness and performance of car drivers. Physiol Behav. 2005;84(5):715–724. doi:10.1016/j.physbeh.2005.02.021
26. Perrier J, Jongen S, Vuurman E, Bocca ML, Ramaekers JG, Vermeeren A. Driving performance and EEG fluctuations during on-the-road driving following sleep deprivation. Biol Psychol. 2016;121(PartA):1–11. doi:10.1016/j.biopsycho.2016.09.010
27. Philip P, Sagaspe P, Moore N, et al. Fatigue, sleep restriction and driving performance. Accid Anal Prev. 2005;37(3):473–478. doi:10.1016/j.aap.2004.07.007
28. Philip P, Sagaspe P, Taillard J, et al. Fatigue, sleepiness, and performance in simulated versus real driving conditions. Sleep. 2005;28(12):1511–1516. doi:10.1093/sleep/28.12.1511
29. Pizza F, Contardi S, Mostacci B, Mondini S, Cirignotta F. A driving simulation task: correlations with multiple sleep latency test. Brain Res Bull. 2004;63(5):423–426. doi:10.1016/j.brainresbull.2003.12.015
30. Shekari Soleimanloo S, Wilkinson VE, Cori JM, et al. Eye-blink parameters detect on-road track-driving impairment following severe sleep deprivation. J Clin Sleep Med. 2019;15(9):1271–1284. doi:10.5664/jcsm.7918
31. Shiferaw BA, Downey LA, Westlake J, et al. Stationary gaze entropy predicts lane departure events in sleep-deprived drivers. Sci Rep. 2018;8(2220):1–10. doi:10.1038/s41598-018-20588-7
32. Vakulin A, Baulk SD, Catcheside PG, et al. Effects of moderate sleep deprivation and low-dose alcohol on driving simulator performance and perception in young men. Sleep. 2007;30(10):1327–1333. doi:10.1093/sleep/30.10.1327
33. Wijayanto T, Marcillia SR, Lufityanto G, Wisnugraha BB, Alma TG, Abdianto RU. The effect of situation awareness on driving performance in young sleep-deprived drivers. IATSS Res. 2021;45(2):218–225. doi:10.1016/j.iatssr.2020.10.002
34. Zeller R, Williamson A, Friswell R. The effect of sleep-need and time-on-task on driver fatigue. Transp Res Part F Traffic Psychol Behav. 2020;74:15–29. doi:10.1016/j.trf.2020.08.001
35. Hanowski RJ, Hickman J, Fumero MC, Olson RL, Dingus TA. The sleep of commercial vehicle drivers under the 2003 hours-of-service regulations. Accid Anal Prev. 2007;39(6):1140–1145. doi:10.1016/j.aap.2007.02.011
36. Liu Y, Guo F, Hanowski RJ. Assessing the impact of sleep time on truck driver performance using a recurrent event model. Stat Med. 2019;38(21):4096–4111. doi:10.1002/sim.8287
37. Smith A, McDonald AD, Sasangohar F. The impact of commutes, work schedules, and sleep on near-crashes during nurses’ post shift-work commutes: a naturalistic driving study. IISE Trans Occup Ergon Hum Factors. 2021;9(1):13–22. doi:10.1080/24725838.2021.1945708
38. Martiniuk ALC, Senserrick T, Lo S, et al. Sleep-deprived young drivers and the risk for crash: the DRIVE prospective cohort study. JAMA Pediatr. 2013;167(7):647–655. doi:10.1001/jamapediatrics.2013.1429
39. Bakiri S, Galera C, Lagarde E, et al. Distraction and driving: results from a case-control responsibility study of traffic crash injured drivers interviewed at the emergency room. Accid Anal Prev. 2013;59:588–592. doi:10.1016/j.aap.2013.06.004
40. Galéra C, Orriols L, M’Bailara K, et al. Mind wandering and driving: responsibility case-control study. Br Med J. 2012;345(dec13 8):e8105. doi:10.1136/bmj.e8105
41. Connor J, Norton R, Ameratunga S, et al. Driver sleepiness and risk of serious injury to car occupants: population based case control study. Br Med J. 2002;324(7346):1125. doi:10.1136/bmj.324.7346.1125
42. Cummings P, Koepsell TD, Moffat JM, Rivara FP. Drowsiness, counter-measures to drowsiness, and the risk of a motor vehicle crash. Inj Prev. 2001;7(3):194–199. doi:10.1136/ip.7.3.194
43. Dorrian J, Sweeney M, Dawson D. Modeling fatigue-related truck accidents: prior sleep duration, recency and continuity. Sleep Biol Rhythms. 2011;9(1):3–11. doi:10.1111/j.1479-8425.2010.00477.x
44. Herman J, Kafoa B, Wainiqolo I, et al. Driver sleepiness and risk of motor vehicle crash injuries: a population-based case control study in Fiji (TRIP 12). Injury. 2014;45(3):586–591. doi:10.1016/j.injury.2013.06.007
45. Kalsi J, Tervo T, Bachour A, Partinen M. Sleep versus non-sleep-related fatal road accidents. Sleep Med. 2018;51:148–152. doi:10.1016/j.sleep.2018.04.017
46. Philip P, Chaufton C, Orriols L, et al. Complaints of poor sleep and risk of traffic accidents: a population-based case-control study. PLoS One. 2014;9(1):e114102. doi:10.1371/journal.pone.0114102
47. Stevenson MR, Elkington J, Sharwood L, et al. The role of sleepiness, sleep disorders, and the work environment on heavy-vehicle crashes in 2 Australian states. Am J Epidemiol. 2014;179(5):594–601. doi:10.1093/aje/kwt305
48. Stutts JC, Wilkins JW, Osberg JS, Vaughn BV. Driver risk factors for sleep-related crashes. Accid Anal Prev. 2003;35(3):321–331. doi:10.1016/s0001-4575(02)00007-6
49. Tefft BC. Acute sleep deprivation and culpable motor vehicle crash involvement. Sleep. 2018;41(10):1–11. doi:10.1093/sleep/zsy144
50. Abe T, Komada Y, Nishida Y, Hayashida K, Inoue Y. Short sleep duration and long spells of driving are associated with the occurrence of Japanese drivers’ rear-end collisions and single-car accidents. J Sleep Res. 2010;19(2):310–316. doi:10.1111/j.1365-2869.2009.00806.x
51. Abe T, Komada Y, Asaoka S, Ozaki A, Inoue Y. Questionnaire-based evidence of association between sleepiness while driving and motor vehicle crashes that are subjectively not caused by falling asleep. Sleep Biol Rhythms. 2011;9(3):134–143. doi:10.1111/j.1479-8425.2011.00498.x
52. Abe T, Komada Y, Inoue Y. Short sleep duration, snoring and subjective sleep insufficiency are independent factors associated with both falling asleep and feeling sleepiness while driving. Intern Med. 2012;51(23):3253–3260. doi:10.2169/internalmedicine.51.7518
53. AlShareef SM. Excessive daytime sleepiness and associations with sleep-related motor vehicle accidents: results from a nationwide survey. Sleep Breath. 2021;25(3):1671–1676. doi:10.1007/s11325-020-02260-5
54. Andreassen CS, Pallesen S, Moen BE, Bjorvatn B, Waage S, Schaufeli WB. Workaholism and negative work-related incidents among nurses. Ind Health. 2018;56(5):373–381. doi:10.2486/indhealth.2017-0223
55. Center for Disease Control and Prevention. Unhealthy sleep-related behaviors—12 States, 2009. Morb Mortal Wkly Rep. 2011;60(8):233–238.
56. Center for Disease Control and Prevention. Drowsy driving—19 states and the District of Columbia, 2009–2010. Morb Mortal Wkly Rep. 2013;61(51–52):1033–1037. doi:10.1001/jama.2013.105
57. Chen YY, Wu KC. Sleep habits and excessive daytime sleepiness correlate with injury risks in the general population in Taiwan. Inj Prev. 2010;16(3):172–177. doi:10.1136/ip.2009.021840
58. Di Milia L, Rogers NL, Akerstedt T, Gamble KL. Sleepiness, long distance commuting and night work as predictors of driving performance. PLoS One. 2012;7(9):e45856. doi:10.1371/journal.pone.0045856
59. Elliman TD, Schwalb ME, Adler AB. Sleep deprivation and hazardous unintended sleep in US army drill sergeants. Sleep Health. 2020;6(3):350–357. doi:10.1016/j.sleh.2020.04.007
60. Hutchens L, Senserrick TM, Jamieson PE, Romer D, Winston FK. Teen driver crash risk and associations with smoking and drowsy driving. Accid Anal Prev. 2008;40(3):869–876. doi:10.1016/j.aap.2007.10.001
61. Ikeda H, Matsumoto S, Kubo T, Izawa S, Takahashi M. Relationship between sleep problems and dangerous driving behaviors in Japanese short-haul commercial truck drivers: a cross-sectional survey using digital tachograph data. Sleep Biol Rhythms. 2021;19(3):297–303. doi:10.1007/s41105-021-00318-9
62. Johnson KM, Simon N, Wicks M, Barr K, O’Connor K, Schaad D. Amount of sleep, daytime sleepiness, hazardous driving, and quality of life of second year medical students. Acad Psychiatry. 2017;41(5):669–673. doi:10.1007/s40596-017-0668-6
63. Kim D, Shin DS, Lee SC, et al. Sleep status and the risk factor of drowsy-related accidents in commercial motor vehicle drivers. Sleep Med Res. 2018;9(2):97–103. doi:10.17241/smr.2018.00283
64. Lemke MK, Apostolopoulos Y, Hege A, Sonmez S, Wideman L. Understanding the role of sleep quality and sleep duration in commercial driving safety. Accid Anal Prev. 2016;97:79–86. doi:10.1016/j.aap.2016.08.024
65. Mahajan K, Velaga NR, Kumar A, Choudhary P. Effects of driver sleepiness and fatigue on violations among truck drivers in India. Int J Inj Control Saf Promot. 2019;26(4):412–422. doi:10.1080/17457300.2019.1660375
66. Mahajan K, Velaga NR, Kumar A, Choudhary A, Choudhary P. Effects of driver work-rest patterns, lifestyle and payment incentives on long-haul truck driver sleepiness. Transp Res Part F Traffic Psychol Behav. 2019;60:366–382. doi:10.1016/j.trf.2018.10.028
67. Maia Q, Grandner MA, Findley J, Gurubhagavatula I. Short and long sleep duration and risk of drowsy driving and the role of subjective sleep insufficiency. Accid Anal Prev. 2013;59:618–622. doi:10.1016/j.aap.2013.07.028
68. Morrow PC, Crum MR. Antecedents of fatigue, close calls, and crashes among commercial motor-vehicle drivers. J Safety Res. 2004;35(1):59–69. doi:10.1016/j.jsr.2003.07.004
69. Ohayon MM, Smolensky MH, Roth T. Consequences of shiftworking on sleep duration, sleepiness, and sleep attacks. Chronobiol Int. 2010;27(3):575–589. doi:10.3109/07420521003749956
70. Perttula P, Ojala T, Kuosma E. Factors in the fatigue of heavy vehicle drivers. Psychol Rep. 2011;108(2):507–514. doi:10.2466/06.13.22.Pr0.108.2.507-514
71. Quera Salva MA, Barbot F, Hartley S, et al. Sleep disorders, sleepiness, and near-miss accidents among long-distance highway drivers in the summertime. Sleep Med. 2014;15(1):23–26. doi:10.1016/j.sleep.2013.06.018
72. Radun I, Summala H. Sleep-related fatal vehicle accidents: characteristics of decisions made by multidisciplinary investigation teams. Sleep. 2004;27(2):224–227. doi:10.1093/sleep/27.2.224
73. Watling CN. Young drivers who continue to drive while sleepy: what are the associated sleep- and driving-related factors? J Sleep Res. 2020;29(3):e12900. doi:10.1111/jsr.12900
74. Wu D, Yang TZ, Yang XY, Hoe CH, Peng SH, Yu LW. Behavioral and psychosocial correlates of road traffic injuries: evidence from a nationwide study on Chinese undergraduates. Traffic Inj Prev. 2020;21(6):375–381. doi:10.1080/15389588.2020.1770236
75. Belenky G, Wesensten NJ, Thorne DR, et al. Patterns of performance degradation and restoration during sleep restriction and subsequent recovery: a sleep dose-response study. J Sleep Res. 2003;12(1):1–12. doi:10.1046/j.1365-2869.2003.00337.x
76. Van Dongen HP, Maislin G, Mullington JM, Dinges D. The cumulative cost of additional wakefulness: dose-response effects on neurobehavioral functions and sleep physiology from chronic sleep restriction and total sleep deprivation. Sleep. 2003;26(2):117–129. doi:10.1093/sleep/26.2.117
77. Adams R, Appleton S, Taylor A, McEvoy D, Antic N. Report to the sleep health foundation 2016 sleep health survey of Australian adults. Sleep Health Foundation; 2016. Available from: https://wwwsleephealthfoundationorgau/pdfs/surveys/SleepHealthFoundation-Surveypdf.
78. Compton RP, Blomberg RD, Moscowitz H, Burns M, Peck RC, Fiorentino DD. Crash Risk of Alcohol Impaired Driving. International Council on Alcohol, Drugs and Traffic Safety; 2002:39–44.
79. Czeisler CA, Wickwire EM, Barger LK, et al. Sleep-deprived motor vehicle operators are unfit to drive: a multidisciplinary expert consensus statement on drowsy driving. Sleep Health. 2016;2(2):94–99. doi:10.1016/j.sleh.2016.04.003
80. Homel R. Drink-driving law enforcement and the legal blood alcohol limit in New South Wales. Accid Anal Prev. 1994;26(2):147–155. doi:10.1016/0001-4575(94)90084-1
81. Lyon C, Mayhew D, Granié M-A, et al. Age and road safety performance: focusing on elderly and young drivers. IATSS Res. 2020;44(3):212–219. doi:10.1016/j.iatssr.2020.08.005
82. Zhou X, Ferguson SA, Matthews RW, et al. Sleep, wake and phase dependent changes in neurobehavioral function under forced desynchrony. Sleep. 2011;34(7):931–941. doi:10.5665/sleep.1130
83. Kosmadopoulos A, Sargent C, Zhou X, et al. The efficacy of objective and subjective predictors of driving performance during sleep restriction and circadian misalignment. Accid Anal Prev. 2017;99:445–451. doi:10.1016/j.aap.2015.10.014
84. Dawson D, Reid K. Fatigue, alcohol and performance impairment. Nature. 1997;388(6639):235. doi:10.1038/40775
85. Lamond N, Dawson D. Quantifying the performance impairment associated with fatigue. Article. J Sleep Res. 1999;8(4):255–262. doi:10.1046/j.1365-2869.1999.00167.x
86. Lamond N, Dorrian J, Roach G, et al. The impact of a week of simulated night work on sleep, circadian phase, and performance. Occup Environ Med. 2003;60(11):e13–e13. doi:10.1136/oem.60.11.e13
87. Riethmeister V, Matthews RW, Dawson D, De Boer MR, Brouwer S, Bültmann U. Time-of-day and days-on-shift predict increased fatigue over two-week offshore day-shifts. Article. Appl Ergon. 2019;78:157–163. doi:10.1016/j.apergo.2019.02.010
88. Van Dongen HP, Caldwell JA Jr, Caldwell JL. Individual differences in cognitive vulnerability to fatigue in the laboratory and in the workplace. Prog Brain Res. 2011;190:145–153.
89. de Mello MT, Narciso FV, Tufik S, et al. Sleep disorders as a cause of motor vehicle collisions. Int J Prev Med. 2013;4(3):246–257.
90. Wolkow AP, Rajaratnam SM, Anderson C, Howard ME, Mansfield D. Recommendations for current and future countermeasures against sleep disorders and sleep loss to improve road safety in Australia. Intern Med J. 2019;49(9):1181–1184. doi:10.1111/imj.14423
 © 2023 The Author(s). This work is published and licensed by Dove Medical Press Limited. The full terms of this license are available at https://www.dovepress.com/terms.php and incorporate the Creative Commons Attribution - Non Commercial (unported, v3.0) License.
By accessing the work you hereby accept the Terms. Non-commercial uses of the work are permitted without any further permission from Dove Medical Press Limited, provided the work is properly attributed. For permission for commercial use of this work, please see paragraphs 4.2 and 5 of our Terms.
© 2023 The Author(s). This work is published and licensed by Dove Medical Press Limited. The full terms of this license are available at https://www.dovepress.com/terms.php and incorporate the Creative Commons Attribution - Non Commercial (unported, v3.0) License.
By accessing the work you hereby accept the Terms. Non-commercial uses of the work are permitted without any further permission from Dove Medical Press Limited, provided the work is properly attributed. For permission for commercial use of this work, please see paragraphs 4.2 and 5 of our Terms.