")
Back to Journals » Journal of Pain Research » Volume 14
How fMRI Analysis Using Structural Equation Modeling Techniques Can Improve Our Understanding of Pain Processing in Fibromyalgia
Authors Warren HJM , Ioachim G, Powers JM, Stroman PW
Received 10 November 2020
Accepted for publication 16 January 2021
Published 10 February 2021 Volume 2021:14 Pages 381—398
DOI https://doi.org/10.2147/JPR.S290795
Checked for plagiarism Yes
Review by Single anonymous peer review
Peer reviewer comments 4
Editor who approved publication: Dr Michael Schatman
Howard JM Warren,1 Gabriela Ioachim,1 Jocelyn M Powers,1 Patrick W Stroman1– 3
1Centre for Neuroscience Studies, Queen’s University, Kingston, Ontario, Canada; 2Department of Biomedical and Molecular Sciences, Queen’s University, Kingston, Ontario, Canada; 3Department of Physics, Queen’s University, Kingston, Ontario, Canada
Correspondence: Patrick W Stroman
Queen’s University, Centre for Neuroscience Studies, 2nd Floor, Botterell Hall, 18 Stuart Street, Kingston, K7L 3N6, Ontario, Canada
Tel +1-613-533-3245
Email [email protected]
Purpose: The purpose of this study was to investigate the utility of data-driven analyses of functional magnetic resonance imaging (fMRI) data, by means of structural equation modeling, for the investigation of pain processing in fibromyalgia (FM).
Patients and Methods: Datasets from two separate pain fMRI studies involving healthy controls (HC) and participants with FM were re-analyzed using both a conventional model-driven approach and a data-driven approach, and the results from these analyses were compared. The first dataset contained 15 women with FM and 15 women as healthy controls. The second dataset contained 15 women with FM and 11 women as healthy controls.
Results: Consistent with previous studies, the model-driven analyses did not identify differences in pain processing between the HC and FM study groups in both datasets. On the other hand, the data-driven analyses identified significant group differences in both datasets.
Conclusion: Data-driven analyses can enhance our understanding of pain processing in healthy controls and in clinical populations by identifying activity associated with pain processing specific to the clinical groups that conventional model-driven analyses may miss.
Keywords: human, brain, pain, neuroimaging, fibromyalgia, chronic pain
Introduction
Functional magnetic resonance imaging (fMRI) has been used extensively since the 1990’s to study both normal and abnormal pain processing in humans. For an overview of recent advances in the pain fMRI literature, we refer the reader to Jensen et al, Morton et al, and van der Miesen et al.1–3 A popular strategy to study abnormal pain processing is to subject both healthy participants, and participants with a pain disorder, to an identical experimental noxious stimulation paradigm while undergoing fMRI. Group-level comparisons of the results are then used to identify which brain areas, if any, have blood oxygenation-level dependent (BOLD) responses that differ between the two study groups.4–7 Although these methods may be limited in their generalizability to real-world pain disorders, they can still provide us with valuable information about acute pain processing, which can potentially lead to a better understanding of chronic pain conditions.
Fibromyalgia (FM) is one pain condition that has been studied in this manner, resulting in some progress in our understanding of this condition. Fibromyalgia is a complex chronic pain syndrome affecting 2–5% of the population.8 Typically, symptoms of FM manifest as widespread pain that fluctuates in intensity and location throughout the body, fatigue and/or sleep disturbances, and cognitive deficits which are often described as “fibro-fog”.8–12 Although FM has been extensively investigated using multiple methods, including fMRI (see Cagnie et al and Dehghan et al for an overview of fMRI findings), the underlying mechanisms of this disorder are still relatively unknown.13,14 Without a proper understanding of the etiology, diagnosis and treatment remain difficult.8
The designs of previous fMRI studies of FM have varied, but most aimed to elicit similar subjective levels of pain in both their healthy control (HC) and FM study groups. In order to achieve a similar level of pain in both study groups, the intensity of the stimuli needed to be higher in the HC groups, as hyperalgesia is a common symptom of FM.4–6,15–25 However, over half of these studies reported little to no significant differences in pain processing between the HC and FM groups within cortical regions, even though the average stimulus intensities used for each study group were significantly different.4–6,15,16,18–20,24 Three explanations for this paradox have been proposed. First, the abnormalities associated with FM may be found in the lower brainstem/spinal cord, and thus conventional brain fMRI studies were unable to detect the differences between the HC and FM groups. Spinal fMRI is not yet as widely-used as brain fMRI, so data to support this theory are limited, however evidence supporting this explanation does exist.19 Second, the cause of FM could lie within the periphery, therefore brain fMRI studies could not detect the differences between the study groups. Evidence both for and against this theory has been discussed in the literature.26–29 Lastly, it is possible that differences within cortical regions do exist, but the standard approaches to fMRI data analysis are unable to detect them.
Conventional analyses of fMRI data from pain studies use “model-driven” approaches. These analyses involve predicting the BOLD response to a noxious stimulation paradigm, and then using a general linear model (GLM) to identify voxels/regions within the fMRI time-series data that adequately match these predicted BOLD response models. Essentially, the brain activity that is expected to be associated with pain processing is presumed to be a convolution of the hemodynamic response function with the timing of the noxious stimulation paradigm.30 Although this method has proven useful within other areas of fMRI research, in the context of pain research it may be too limited. This approach assumes that the only meaningful neurological activity that is associated with pain processing occurs during noxious stimulation, and is thus the direct result of a reaction to the stimulus. However, pain processing is much more complex, involving higher order processes that are influenced by a person’s emotional and cognitive states, as well as their surroundings.30–34 Due to the complexity of the experience of pain, it is invalid to assume that the BOLD responses associated with pain processing can be predicted based on peripheral stimulation timing alone, and previous research has shown that BOLD signaling outside of the stimulation period can be related to pain processing.34,35 We therefore propose that significant differences in pain processing between HC and FM participants are likely being missed due to the limitations of these conventional, model-driven fMRI analysis methods.
Alternative “data-driven” analytical approaches are available which do not require the prediction of BOLD responses, but rather identify meaningful BOLD responses based on temporal correlation or covariance between time-series responses in different brain regions (ie “connectivity”).30 An example of a data-driven approach is structural equation modeling (SEM) to investigate networks of inter-connected brain regions, based on a predefined anatomical model.36 Using SEM, BOLD signal variations can be identified even if they do not match a predicted model, such as due to receptor adaptation, effects such as temporal summation, changes in sensitivity, cognitive or emotional influences, individual differences, etc. Moreover, fMRI data can be separated into time periods and dynamic variations in connectivity strengths over time can be investigated. It is therefore possible that data-driven analyses can provide information about pain processing in much greater detail than the model-driven approaches. It is also expected that data-driven methods have the potential to explore differences between HC and FM groups that the model-driven methods may have missed. Interestingly, out of the previous fibromyalgia fMRI studies mentioned above, the majority of the studies that reported finding at least some differences between the HC and FM groups experiencing similar levels of pain were studies that utilized data-driven techniques.17,20–25
The purpose of the present study was to investigate whether data-driven approaches (specifically SEM) can better inform us about the differences in pain processing between HC and FM groups, than a conventional model-driven approach. This was achieved by separately re-analyzing data from two previous pain fMRI studies conducted by our lab. Both of these studies involved comparing participants with fibromyalgia to age/sex-matched healthy control participants who experienced subjectively equivalent levels of pain, however their study designs differed. We chose to analyze data from two distinct studies, with significant differences in study design, to increase the robustness of our results. Analyses consisted of both a conventional, model-driven approach based on predicted BOLD responses, and an alternative, data-driven SEM approach. Results from the two analyses were compared across the two datasets, and the similarities and differences in the results were identified. We hypothesized that the data-driven analyses would identify more nuanced differences in pain processing between the study groups than the model-driven analyses.
Patients and Methods
The data used to compare the two analysis methods were obtained from two previous fMRI studies conducted by our lab, both of which compared pain processing in women with FM to HC participants. These studies included both brain and brainstem/spinal cord imaging sessions, but only the data pertaining to the brain imaging sessions will be discussed here. For both studies, the methods were reviewed and approved by the Health Sciences Research Ethics board at Queen’s University, and all participants provided written, informed consent before participating. Although these studies shared common features with respect to their aims and study designs, there are significant differences that are worth noting, and the datasets were not combined for any analyses as a result. In order to differentiate the two datasets, the first study, which was conducted between 2013−2014, will be referred to as “Study 1”, and the two groups in this study will be referred to as “HC1” and “FM1”. The second study, conducted between 2018−2019, will be referred to as “Study 2”, and the two groups in this study will be referred to as “HC2” and “FM2”. Details of the methods used for each study, which are relevant to the present analysis, will be described below. Full details of the methods used for Study 1 have been previously published.19
Participant Recruitment
Study 1
Twenty women with FM and 20 healthy women were recruited from the local community. All FM participants required a prior diagnosis from their physician. Additionally, they were assessed with an algometer upon recruitment (FPK 10 pain test algometer, Wagner Instruments) to ensure that they fulfilled the 1990 ACR criteria for FM.37 Exclusion criteria included current use of opioids or nonsteroidal anti-inflammatory drugs (NSAIDs). Of the participants recruited, complete brain fMRI data sets were obtained from 15 HC (age range = 21–55, Mage = 39.1 ± 10.2; mean ± std) and 15 FM (age range = 27–53, Mage = 38.9 ± 6.8) participants that could be used for the current analyses (the other participants either did not complete the brain imaging session, or their data were excluded due to technical issues during the scanning session).
Study 2
Sixteen women with FM and 13 healthy women were recruited from the local community, and were used for this analysis. Participants with FM were required to have received a prior diagnosis from a physician to be included in this study. Exclusion criteria included current use of opioids. All other medication dosages needed to be stable for at least 3 months. Of the total number of participants recruited, complete brain fMRI data sets were obtained from 11 HC (age range = 21–59, Mage = 36.5 ± 11.3) and 15 FM (age range = 24–64, Mage = 49.3 ± 12.6) participants that could be used for the current analyses (the other participants either did not complete the brain imaging session, or their data were excluded due to technical issues during the scanning session).
Personal Characteristics
Every participant was asked to fill out a series of psychological questionnaires so that their personal characteristics could be quantified and related to their subsequent fMRI results and pain ratings. The questionnaires included in both studies were the State-Trait Anxiety Inventory (STAI), the Social Desirability Scale (SDS), the Beck Depression Inventory (BDI), and the Pain Catastrophizing Scale (PCS).38–41 Demographic information (including age, sex, height, weight) were also recorded, as well as each individual’s pain sensitivity (see Characteristic comparisons of Study 1 and Study 2 for more information regarding sensitivity calculations). For the purpose of the current analysis, these data were used to determine if there were any significant differences between the participant groups which could potentially explain any differences in the results.
Participant Training
Prior to fMRI data collection, each participant underwent a 1-hour training session during which they were introduced to the experimental pain stimulus and study design. First, participants were introduced to the standardized numerical pain intensity scale (NPS) which they used to report their pain ratings. The scale ranges from 0 to 100 in increments of 5, with verbal descriptors at increments of 10 (Figure 1).19,42 This pain scale is not typically used for clinical assessment, but it has been used for reporting experimentally-evoked pain in research studies, and has been extensively used in previous pain fMRI studies involving HC and FM study groups because it allows for reporting of non-painful sensations as well, such as after-sensations.18,42–44 After participants understood how to use the scale, a series of calibration tests were conducted with varying stimulus temperatures (between 40 °C and 52 °C) so that participants could become accustomed to the thermal stimulation, and to rating the intensity of the pain that they experienced. In both the training and fMRI sessions, the thermal heat stimulus was administered to the thenar eminence of each participants’ right hand (see fMRI paradigm for study-specific details). Thermal heat stimuli were used to elicit pain in both studies because they can be applied in the MRI environment, they can be calibrated to each participant’s pain sensitivity, and they can be applied to a relatively large region of skin to evoke a robust BOLD response. During the training session, the participants were instructed to verbally call out the intensity of the pain felt after each heat contact based on the NPS. These training sessions were also used to calibrate the temperature to be used during the fMRI studies in order to elicit a rating of 50 ± 10 NPS units for the participant. The goal was to have every participant subjectively feel a similar intensity of pain.
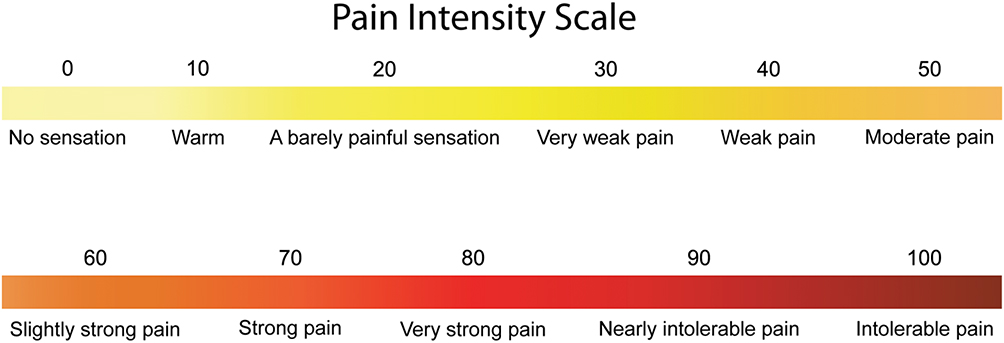 |
Figure 1 Numerical pain intensity scale. Participants were informed how to use the scale during the training session. Although participants were encouraged to rate their pain in increments of 5 (ie 5, 20, 35, etc), they were not corrected if they used other values (ie 17, 33, 46, etc). The threshold for painful sensation is 20. |
To complete the training session, each participant underwent a mock scan in our sham MRI and experienced at least one run of the experimental fMRI stimulation paradigm. Familiarizing the participants to the MRI environment beforehand has been found to help reduce participants’ anxieties, and to ensure that the participant understands the fMRI paradigm and the importance of lying still, which reduces the potential for confounds.45,46 If necessary, the mock scanning session was repeated until the participant was confident in their understanding of the experimental protocol.
fMRI Paradigm
Study 1
Imaging runs were separated into two study conditions: temporal summation of second pain (TSSP) and TSSP-Control (TSSP-C). Five imaging runs for each condition were implemented in a randomized order, and a minimum of 2 minutes of rest was given between each run. The two study conditions differed in experimental heat stimulation. For the TSSP condition, 11 heat spikes with the previously calibrated temperature to elicit a rating of 50 ± 10 NPS units were applied every 3 seconds, which has been shown to induce temporal summation of pain.18,19 The TSSP condition’s stimulation period was preceded by a 52-second rest period and followed by a 65-second rest period (Figure 2). In the TSSP-C condition, 11 heat spikes with the same temperature as the TSSP condition were applied every 6 seconds, which does not induce temporal summation of pain.18,19 The TSSP-C condition’s stimulation period was preceded by a 19-second rest period and was followed by a 65-second rest period. In this way, both study conditions consisted of imaging runs lasting 150 seconds. The heat stimuli were provided by an MRI-compatible Peltier thermode (Medoc®, Ramat Yishai, Israel), which was attached to the thenar eminence of the participants’ right hands. During heat stimulation, the temperature was rapidly raised and lowered under computer control on the Medoc® device. Similar to the training session, participants viewed instructions on a rear-projection screen which notified them when a new scan was about to begin, when the application of the heat stimulus would begin, and when to report their ratings for the first and last heat contacts (Figure 2). Because of the present study’s objective, only the data from the TSSP condition, which was the condition that elicited pain in all participants, were used for the analyses.
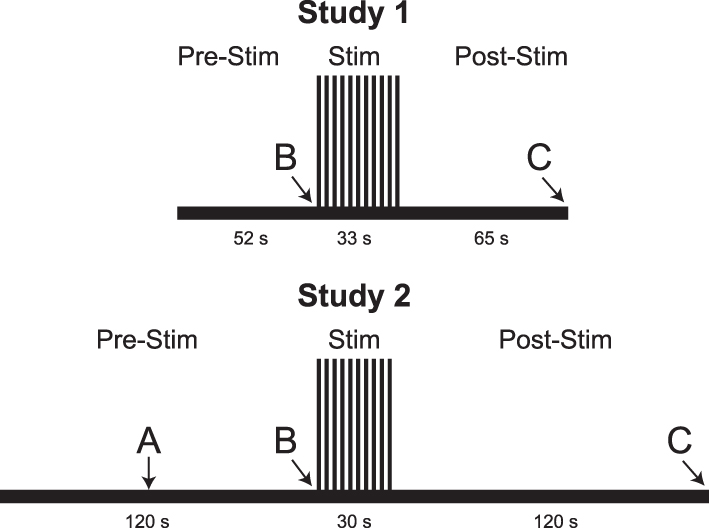 |
Figure 2 fMRI paradigms for Study 1 and Study 2. Functional imaging runs in Study 1 were 150 seconds long, and the heat pain was administered as 11 consecutive heat spikes over a span of 33 seconds. Functional imaging runs in Study 2 were 270 seconds long, and the heat pain was administered as 10 brief heat contacts over a span of 30 seconds. Letters indicate different prompts being delivered to participants over the rear-projection screen. A = “you will feel heat.” B = “the pain stimulus will begin in 3 … 2 … 1 … ” C = “please provide your first and last pain ratings.”. |
Study 2
In this study, a “threat/safety” paradigm was employed. The imaging runs were separated into two study conditions: “Stim” and “Rest”. Four to five imaging runs for each condition were obtained in a randomized order, and a minimum of 2 minutes was given between stimulation periods in successive runs. A rear-projection screen was used to inform the participants when the next imaging run would begin (Figure 2). After 60 seconds of baseline scanning, participants were informed whether that run would involve the thermal heat stimulation (Stim) or not (Rest). If it was a Stim run, the participants were also informed when the stimulation was to begin at the 120-second mark. During Stim runs, 10 heat contacts using the calibrated temperature were administered over 30 seconds. This 30-second stimulation period was followed by a 120-second rest period, for a total time of 4 minutes and 30 seconds (Figure 2). At the end of the Stim runs, the participants were prompted to provide their pain ratings for the first and last heat contacts, via an intercom. For the Rest condition, the participants were informed at the 60-second mark that they would not be feeling the stimulation during that run. Instead, they were instructed to lie as still as possible for the remainder of the imaging run. The Rest runs also spanned 4 minutes and 30 seconds. In this study, the thermal heat contacts were administered via an MRI-compatible Robotic Contact-Heat Thermal Heat Stimulator (RTS-2) which pneumatically raises and lowers a heated aluminum thermode to make contact with the participants’ skin, and is precisely controlled using software written in MATLAB (Mathworks Inc., Natick, MA). Aside from when participants were being provided with information, the rear-projection screen continuously displayed the NPS. Because of the present study’s objective, only the data from the Stim condition, which was the condition that elicited pain in the participants, were used for the analyses.
fMRI Data Acquisition
Study 1 and Study 2
All image data were acquired using a 3 tesla whole-body MRI system (Siemens Magnetom Trio; Siemens, Erlangen, Germany). Participants were positioned supine and were supported by foam padding as needed to ensure comfort and minimize bulk body movement. A sagittal, T1-weighted structural image with 1 x 1 x 1 mm3 resolution was obtained at the beginning of the imaging session using an MPRAGE sequence (TR = 1760 ms, TE = 2.2 ms, Inversion Time = 900 ms, Flip Angle = 9°). The imaging window spanned from the top of C1 to the top of the cortex (although degree of inclusion depended on participants’ head size).
Study 1
Functional images were acquired in 49 contiguous axial slices oriented parallel to the anterior commissure-posterior commissure (AC-PC) line using a gradient-echo echo-planar imaging (GE-EPI) sequence (TR = 3 s, TE = 30 ms, Flip Angle = 90°, FOV = 192 mm x 192 mm, Matrix = 64 x 64, Resolution = 3 x 3 x 3 mm3). A 12-channel head coil was used for detection of the MRI signal, with a body coil for transmission of RF pulses. A total of 50 volumes were acquired for each imaging run, and multiple runs were acquired in each participant.
Study 2
Functional images were acquired in 66 contiguous axial slices using a GE-EPI sequence (TR = 2 s, TE = 30 ms, Flip Angle = 84°, Multiband = 3, 7/8 Partial Fourier, FOV = 180 mm x 180 mm, Matrix = 90 x 90, Resolution = 2 x 2 x 2 mm3). A 32-channel head coil was used for detection of the MR signal, with a body coil for transmission of RF pulses. A total of 135 volumes were acquired for each imaging run, and multiple runs were acquired in each participant.
Data Preprocessing and Analysis
Preprocessing of Study 1 and Study 2 Datasets
Functional MRI data from both studies were preprocessed using SPM12 software (Wellcome Institute of Cognitive Neurology, London, UK). The data were converted to NIfTI format, motion and slice-time corrected, co-registered to their anatomical images, and normalized to the MNI template (Montreal Neurological Institute, Montreal, Quebec). Additional noise modeling and removal was carried out for each fMRI run by 1) extracting data from only white-matter regions in spatially normalized data (based on templates included with the SPM12 software), 2) identifying the first three principal components of the time-series responses as models of global noise, and 3) fitting and subtracting these models from the data in all voxels. Model-driven and data-driven analyses of the pre-processed data were conducted using custom written software in MATLAB (Mathworks Inc., Natick, MA). Due to the differences in experimental setup, the two datasets were analyzed separately, but in an identical manner. Analysis scripts and fMRI data (in anonymized form) are freely available upon request.
Characteristic Comparisons of Study 1 and Study 2
Individual demographic variables (age, sex, body mass index (BMI)), questionnaire scores (STAI, SDS, BDI, PCS), and individual pain sensitivities (average last pain rating ÷ average temperature received) from each dataset were compared using Student’s t-tests to determine if there were significant differences between the datasets that could potentially explain the fMRI results.
Model-Driven fMRI Analyses
BOLD responses were predicted by convolving the stimulation paradigms for each study with the canonical hemodynamic response function and were fit to voxel time-series responses for each voxel, by means of a GLM. For individual analyses, the average BOLD time-series data for each voxel were extracted by averaging the voxel data across the 4 or 5 imaging runs for each participant (from either the TSSP or Stim conditions). Weighting factors (β) for every voxel were calculated by fitting the averaged voxel time-series with the predicted model. T-scores for each voxel were computed to determine the significance of the fit, and a map of t-values was created. Group-level analyses were also carried out by averaging the voxel time-series data from all participants in the same group. Weighting factors at the group-level were then computed, using the same predicted BOLD responses as for the individual analyses, and group-level t-scores for every voxel were obtained. Significance was inferred at a family-wise error rate (FWER) corrected pFWER < 0.05, with Gaussian random field (GRF) theory used to estimate the smoothness of the data and the number of independent comparisons being made. The smoothness and significance threshold (uncorrected p < 4.5 x 10⁻⁶) were determined using data from one healthy control participant as being representative of all datasets, and the same threshold was used for all GLM fits for consistency. Student’s t-tests were performed on the group-level β-values to determine if there were any significant differences between the two study groups in each dataset.
Data-Driven fMRI Analyses
Structural equation modeling is a data-driven statistical analysis method that, in the context of fMRI, can be used to identify coordinated BOLD responses across regions, given the assumption that input signaling to a region is the sum of signaling from other regions within a network.36 Analysis of fMRI data using SEM requires the use of a pre-defined anatomical model. The pre-defined anatomical model used for these analyses included the anterior cingulate cortex (ACC), amygdala (Amg), Heschl’s gyrus (HG), hippocampus (Hipp), hypothalamus (Hyp), insular cortex (IC), nucleus accumbens (NAc), periaqueductal gray matter (PAG), posterior cingulate cortex (PCC), prefrontal cortex (PFC), thalamus (Thal), and ventral tegmental area (VTA), and the connectivity between these regions was determined based on numerous sources (Figure 3).31,47–49 These 12 regions were chosen because they have been consistently identified in previous pain fMRI studies, and their involvement in pain processing has been extensively described.13,18,20,50 However, Heschl’s gyrus, which is not typically associated with pain processing, was included because it was observed to be of interest in our group’s previous studies of music modulation of pain. The same pre-defined model was used for all datasets. For both the model-driven and data-driven analyses, brain regions were defined in spatially normalized data using the anatomical templates included with the CONN15e software package.51
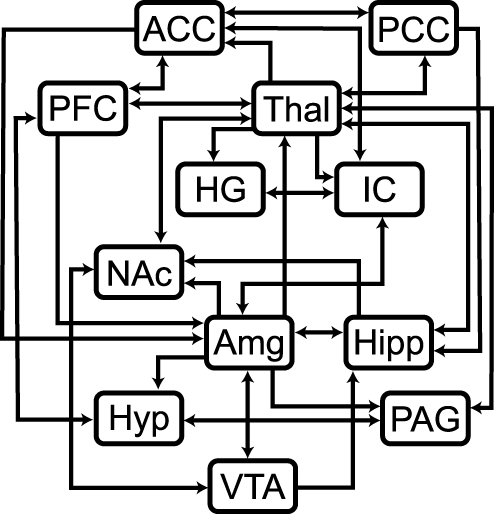 |
Figure 3 Pre-defined anatomical model for the SEM analysis. Lines depict which region is the source, arrowheads depict which region is the target. If lines contain an arrowhead on each end, then it is known that the two regions involved in the connection influence signaling in both directions. Abbreviations: ACC, anterior cingulate cortex; Amg, amygdala; HG, Heschl’s gyrus; Hipp, hippocampus; Hyp, hypothalamus; IC, insular cortex; NAc, nucleus accumbens; PAG, periaqueductal gray; PCC, posterior cingulate cortex; PFC, prefrontal cortex; Thal, thalamus; VTA, ventral tegmental area. |
Group-level time-series data were extracted for each voxel within the anatomical regions associated with the pre-defined anatomical model. Each region was further divided into 7 subregions based on voxel time-series properties using k-means clustering (except for the VTA which was only divided into 4 subregions due to its size). This subdivision is necessary because it groups voxels within each subregion based on BOLD time-series responses (ie based on function) which also helps to separate functionally relevant voxels from non-relevant voxels (ie voxels dominated by physiological noise). Furthermore, the 12 regions included in the pre-defined model are implicated in a number of functions, so it is unlikely that all subregions will be involved with pain processing.34–36 The average BOLD time-course responses were calculated for each subregion for subsequent SEM analysis.
The BOLD time-course response in each “target” subregion (i.e. sub-set of a region) was fit to the BOLD responses in the modelled “source” subregions, by means of a GLM. The linear weighting factors represent the connectivity from each source subregion to the target subregion. For the purposes of this analysis, we refer to the linear weighting factors as “βSEM”, to distinguish them from the β-values of the GLM fit in the model-driven analyses. For example, if region A receives input signaling from regions B and C, and the BOLD signal time-series responses in these regions are SA, SB, and SC respectively, then SA = βAB SB + βAC SC + eA where eA is the residual signal variation that is not explained by the fit. Using our previously validated approach, every combination of network connections within the pre-defined anatomical model were investigated, and the connections that yielded the best fits to the measured data were identified.34–36 The fitting procedure was applied to one target subregion at a time, with one combination of source subregions at a time.
Dynamic variations in linear weighting factors (βSEM) were also identified by analyzing data spanning 45 seconds (15 volumes for Study 1 datasets, 23 volumes for Study 2 datasets). The two epochs of interest were “Before Stimulation” (ie a 45-second window before the start of the stimulation period) and “During Stimulation” (ie a 45-second window containing the entire stimulation period). The goodness-of-fit was determined by computing the amount of variance in each target region that is explained by the fit, expressed as the R2-value. The significance of the fit was estimated by converting the R-value to a Z-score by means of the Fisher Z-transform. The significance (p-value) was estimated using numerical simulations of the Z-value distributions obtained with the same network parameters, using normally-distributed random data, as described previously.36 Additionally, one source region at a time was omitted from the network and the fitting processes were recalculated, in order to identify significant contributions to the overall fit. Network components were inferred to be significant at a FWER corrected pFWER < 0.05, accounting for the total number of network combinations that were tested across combinations of anatomical subdivisions.
In order to identify significant differences in connectivity between the HC and FM groups, the SEM results from the two epochs were further compared using analyses of covariance (ANCOVA) which specifically looked for connectivity differences based on participant group, individual pain sensitivity, as well as group X sensitivity interaction effects. Each participant’s pain sensitivity was calculated by dividing their average last pain ratings during the fMRI runs by the average stimulation temperature received during those same runs (ie pain rating ÷ temperature = pain sensitivity). The ANCOVA was applied to the βSEM-values of each participant as the dependent variable, while individual pain sensitivity was used as a continuous independent variable, and the study group (HC or FM) was used as a discrete independent variable. Significance was inferred at a FWER controlled pFWER < 0.05, which was Bonferroni corrected to account for the multiple subregions and connection comparisons (uncorrected p < 1.07 x 10⁻⁴).
Additional Analysis of Model-Driven Results
For consistency, the model-driven results were further analyzed using an ANCOVA which, similar to the data-driven analyses, specifically looked for differences in GLM β-values based on the participant group, individual pain sensitivity, and group X sensitivity interaction effects. Like the data-driven analyses, this analysis only included data from the regions and subregions associated with the predefined anatomical model (12 regions, 81 subregions total). For each participant, all of the model-driven β-values from the voxels associated with each specific region/subregion combination within the predefined anatomical model were averaged together so that each participant had one β-value per subregion. The averaged β-values for each individual for each subregion were used in the ANCOVA, along with each individual’s pain sensitivities. Significance was inferred at a FWER controlled pFWER < 0.05, which was Bonferroni corrected to account for the multiple comparisons due to the total number of subregions being compared (uncorrected p < 6.17 x 10⁻⁴). Similar to the other analyses, the two studies were analyzed separately.
Results
Participant Characteristics
Independent t-tests of the participant characteristics identified similarities and differences between the study groups in each dataset, and the two studies as a whole (Table 1).
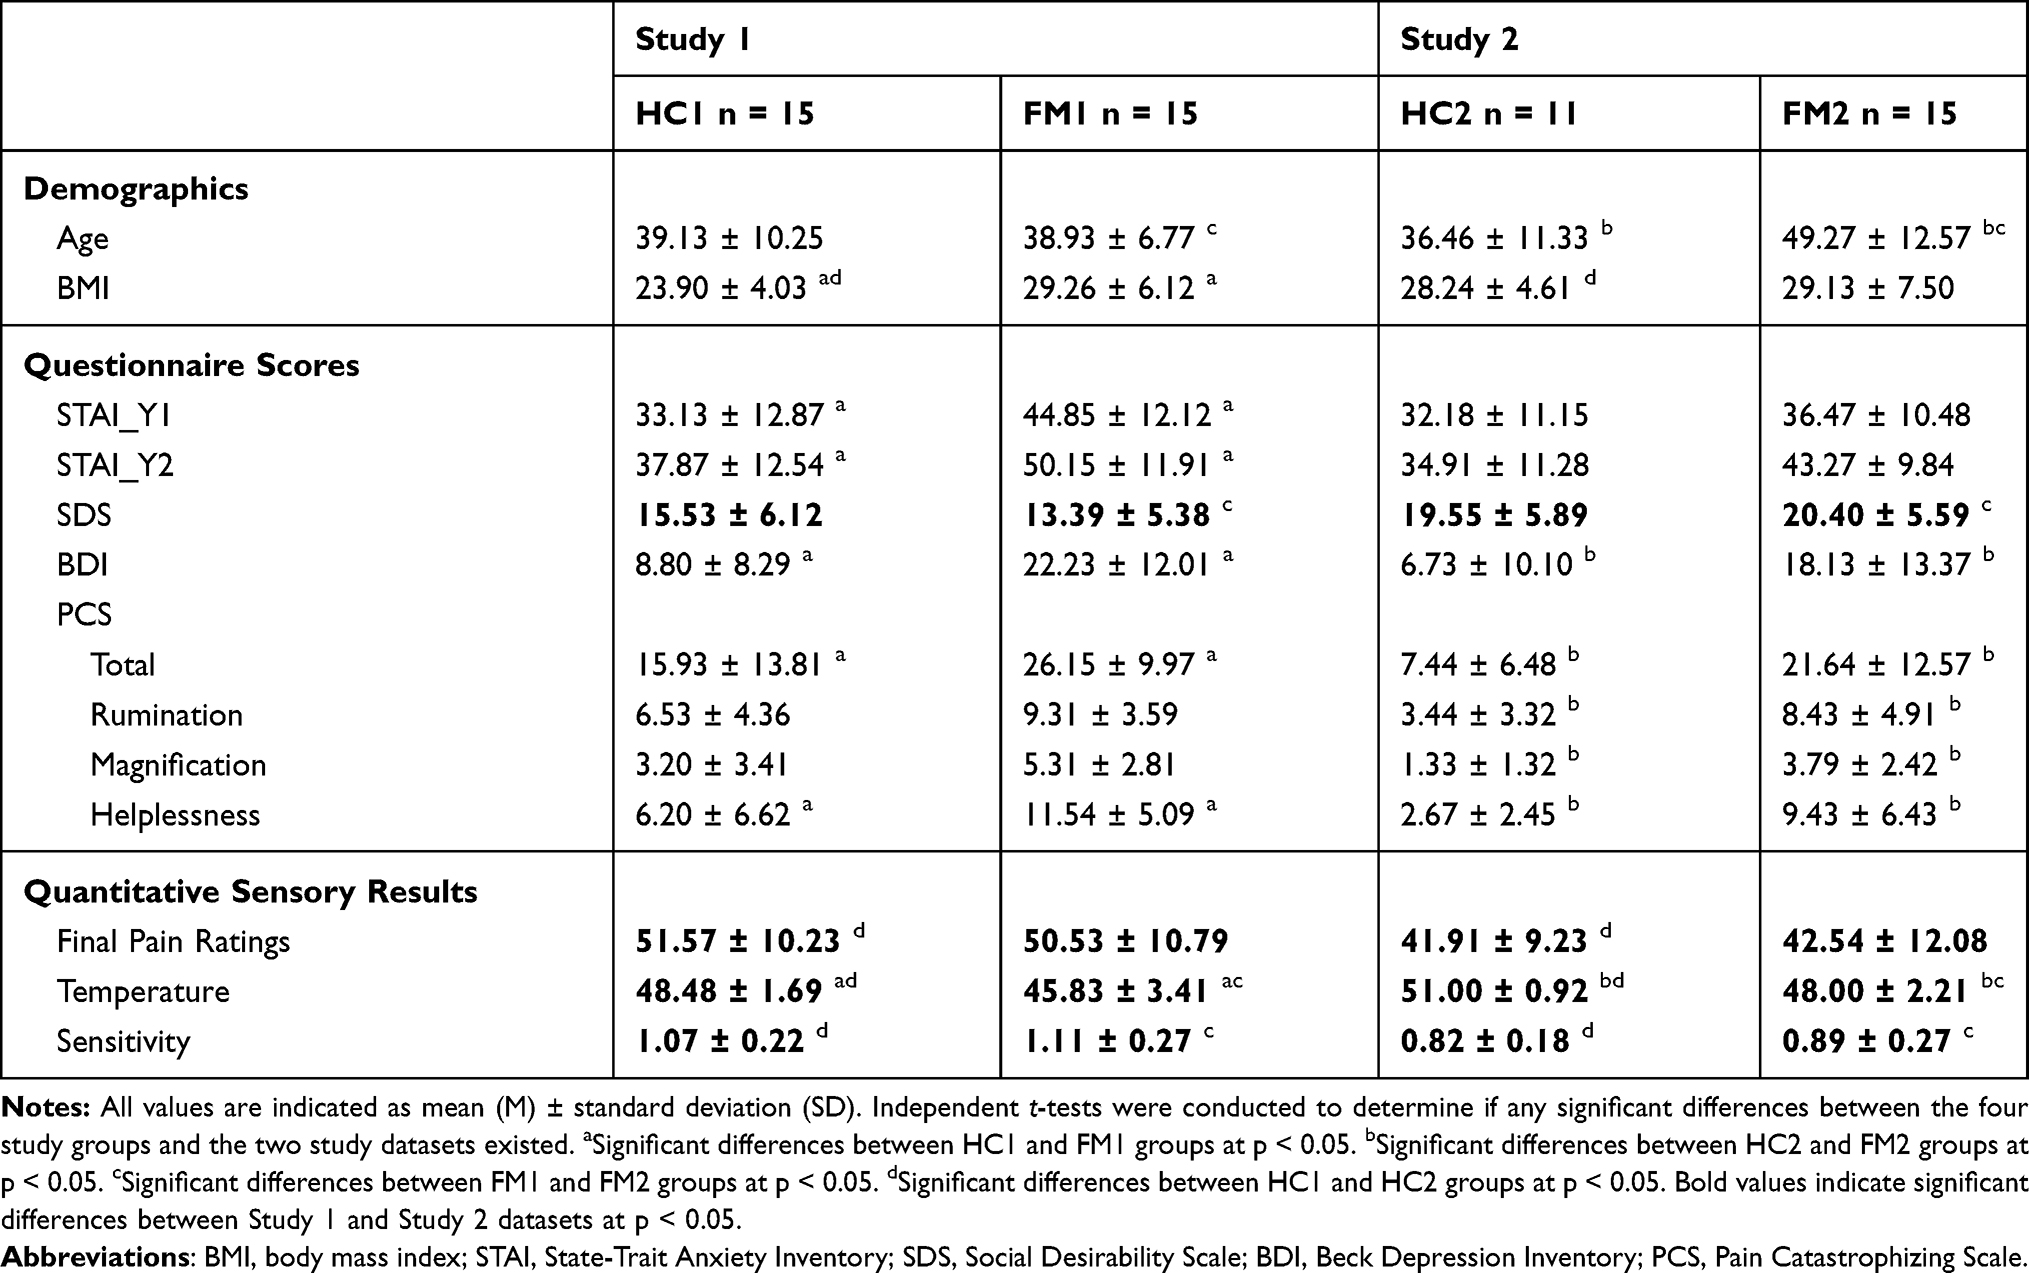 |
Table 1 Comparison of Participant Characteristics |
Study 1
There were no significant differences between the ages (p = 0.95) or the final pain ratings (p = 0.79) between FM and HC groups. However, consistent with previous findings, there was a significant difference in stimulus temperatures between the two groups (p = 0.01). There were also significant differences in BMI (p = 9.10 x 10⁻³), as well as questionnaire scores for STAI (pSTAI-Y1 = 0.02, pSTAI-Y2 = 0.01), BDI (p = 2.80 x 10⁻³), and PCS (pTotal = 0.03, pHelplessness = 0.02) between the two groups.
Study 2
Unlike Study 1, a significant difference in participant age was found between the FM and HC groups (p = 0.01). Similar to Study 1, there was not a significant difference in final pain ratings between the two groups (p = 0.88). Consistent with Study 1 and with previous studies, there was also a significant difference in stimulus temperatures between the two groups (p = 1.31 x 10⁻⁴). There were also significant differences in the BDI (p = 0.02) and PCS (pTotal = 1.90 x 10⁻³, pRumination = 8.50 x 10⁻³, pMagnification = 5.10 x 10⁻³, pHelplessness = 2.30 x 10⁻³) questionnaire scores between the two groups.
Between Studies
There were significant differences in questionnaire scores for SDS (p = 8.4 x 10⁻⁴). There were also significant differences in the quantitative sensory results (pPain = 3.10 x 10⁻³, pTemperature = 4.20 x 10⁻³, pSensitivity = 8.40 x 10⁻⁴) between Study 1 and Study 2.
Model-Driven Analyses
Model-driven GLM analyses revealed regions with BOLD signal time-courses that significantly fit the pre-defined models in all 4 study groups (Figure 4).
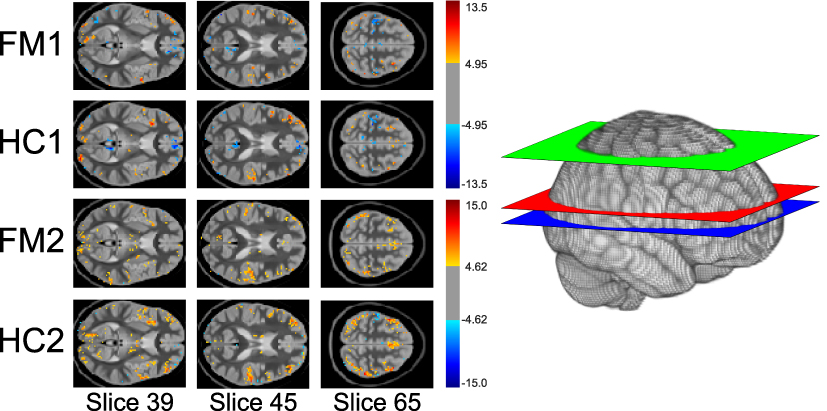 |
Figure 4 Selected slices showing voxels with significant fits to the GLM from the model-driven analyses for each study group. Color indicates significance of the voxel’s fit to the GLM based on the t-scores in the color bars adjacent to the slices. Only significant voxels are shown. The diagram on the right shows the location of each selected slice within the brain. Slice 39 is blue. Slice 45 is red. Slice 65 is green. |
Study 1
Multiple regions significantly fit the GLM in both the HC1 and FM1 groups (Figure 4). Although the uncorrected Student’s t-test comparison of these two study groups identified voxels with differences (Supplementary 1), after appropriate correction, no voxels with significant differences between the HC1 and FM1 groups were identified (Figure 5).
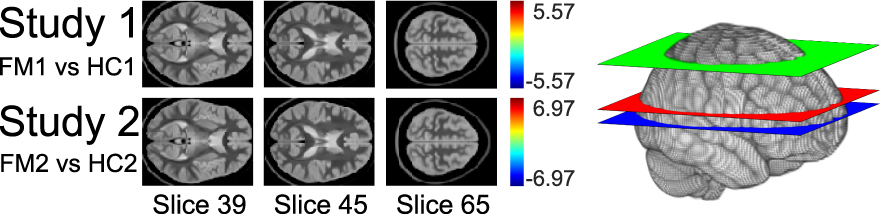 |
Figure 5 Comparison of group-level GLM results from the model-driven analyses. Study 1 compares HC1 and FM1 results. Study 2 compares HC2 and FM2 results. Voxels that were significantly different between the HC and FM groups would have been indicated in color, based on the color bars that represent t-scores adjacent to the slices, but no significant differences were found. The t-threshold for significance was ± 5.41 for Study 1, and ± 5.61 for Study 2. The diagram on the right shows the location of each selected slice within the brain. Slice 39 is blue. Slice 45 is red. Slice 65 is green. |
Study 2
Similar to the results from Study 1, multiple regions significantly fit the GLM in both the HC2 and FM2 groups (Figure 4). The uncorrected Student’s t-test identified voxels with group differences (Supplementary 1), but no voxels with significant differences between the HC2 and FM2 groups were identified after appropriate statistical correction (Figure 5).
Data-Driven Analyses
The SEM analyses identified specific networks in all 4 study groups in both the “Before Stimulation” and “During Stimulation” time periods (Figure 6).
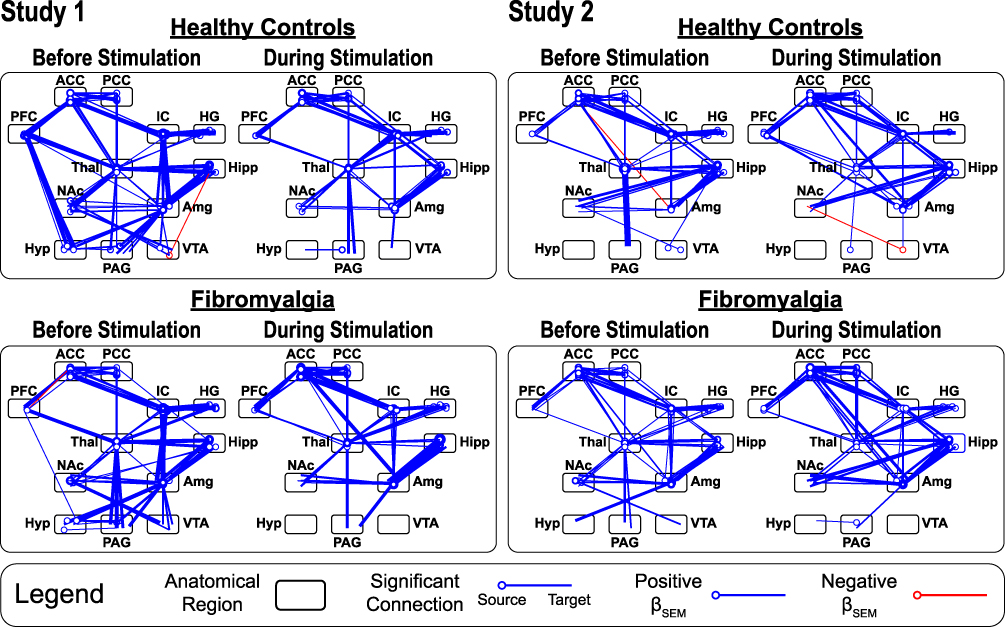 |
Figure 6 Structural equation modeling diagrams identifying the significant connectivity networks within each participant group, in each study, in each time period analyzed. Lines represent significant connections. Circles represent the connection’s source region; the end of the line represents the connection’s target region. Line thickness is related to the size of the linear weighting factor (βSEM) calculated, and line color indicates if the calculated βSEM is positive (blue) or negative (red). The significant connections are shown at a family-wise error rate (FWER) corrected pFWER < 0.05. Abbreviations for each region are described in the text (see Data-driven fMRI analyses section). |
Study 1
The SEM networks in the HC1 and FM1 study groups were similar in both the “Before” and “During” stimulation time periods (Figure 6). The only noticeable differences between the two study groups appears in the “Before Stimulation” networks, in which two prominent descending connections from the PFC to the hypothalamus are seen in the HC group, but not in the FM group (Figure 6).
Study 2
As in Study 1, the overall structures of the networks appear similar (Figure 6). The most prominent difference between the two groups is the descending connection from the ACC to the amygdala in the “Before Stimulation” period, which is negative in the HC group and positive in the FM group (Figure 6).
Between Studies
Overall, there is a high degree of similarity between the SEM networks in Study 1 and Study 2 (Figure 6).
ANCOVA of Data-Driven Results
Analyses of covariance of the SEM results identified significant connections in both Study 1 and Study 2, in both the “Before Stimulation” and “During Stimulation” time periods. Significant connections were detected which depended on the participant group, on individual pain sensitivity, and were observed to have group/sensitivity interaction effects (Figure 7, Tables 2 and 3)
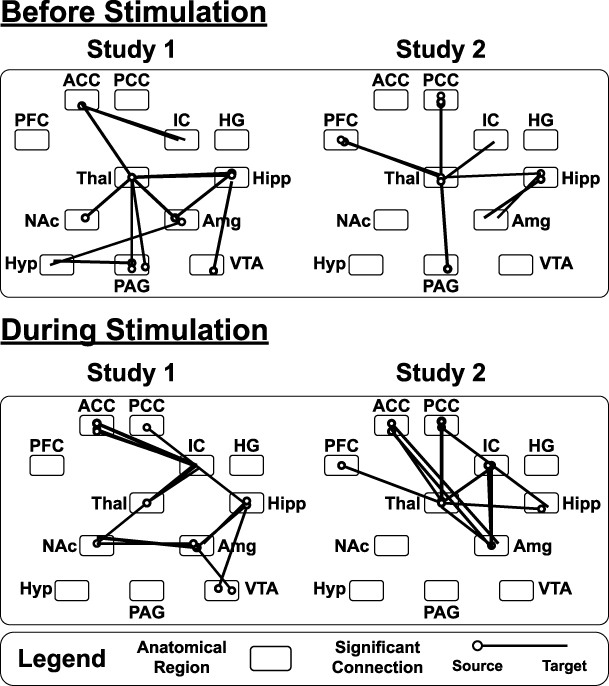 |
Figure 7 Connections with a significant main effect of the group, as identified by ANCOVA of data-driven SEM results, for both studies in each time period analyzed. Lines represent significant group-dependent connections. Circles represent the connection’s source region; the end of the line represents the connection’s target region. Significant connections are shown at a family-wise error rate (FWER) corrected pFWER < 0.05. Abbreviations for each region are described in the text (see Data-driven fMRI analyses section). |
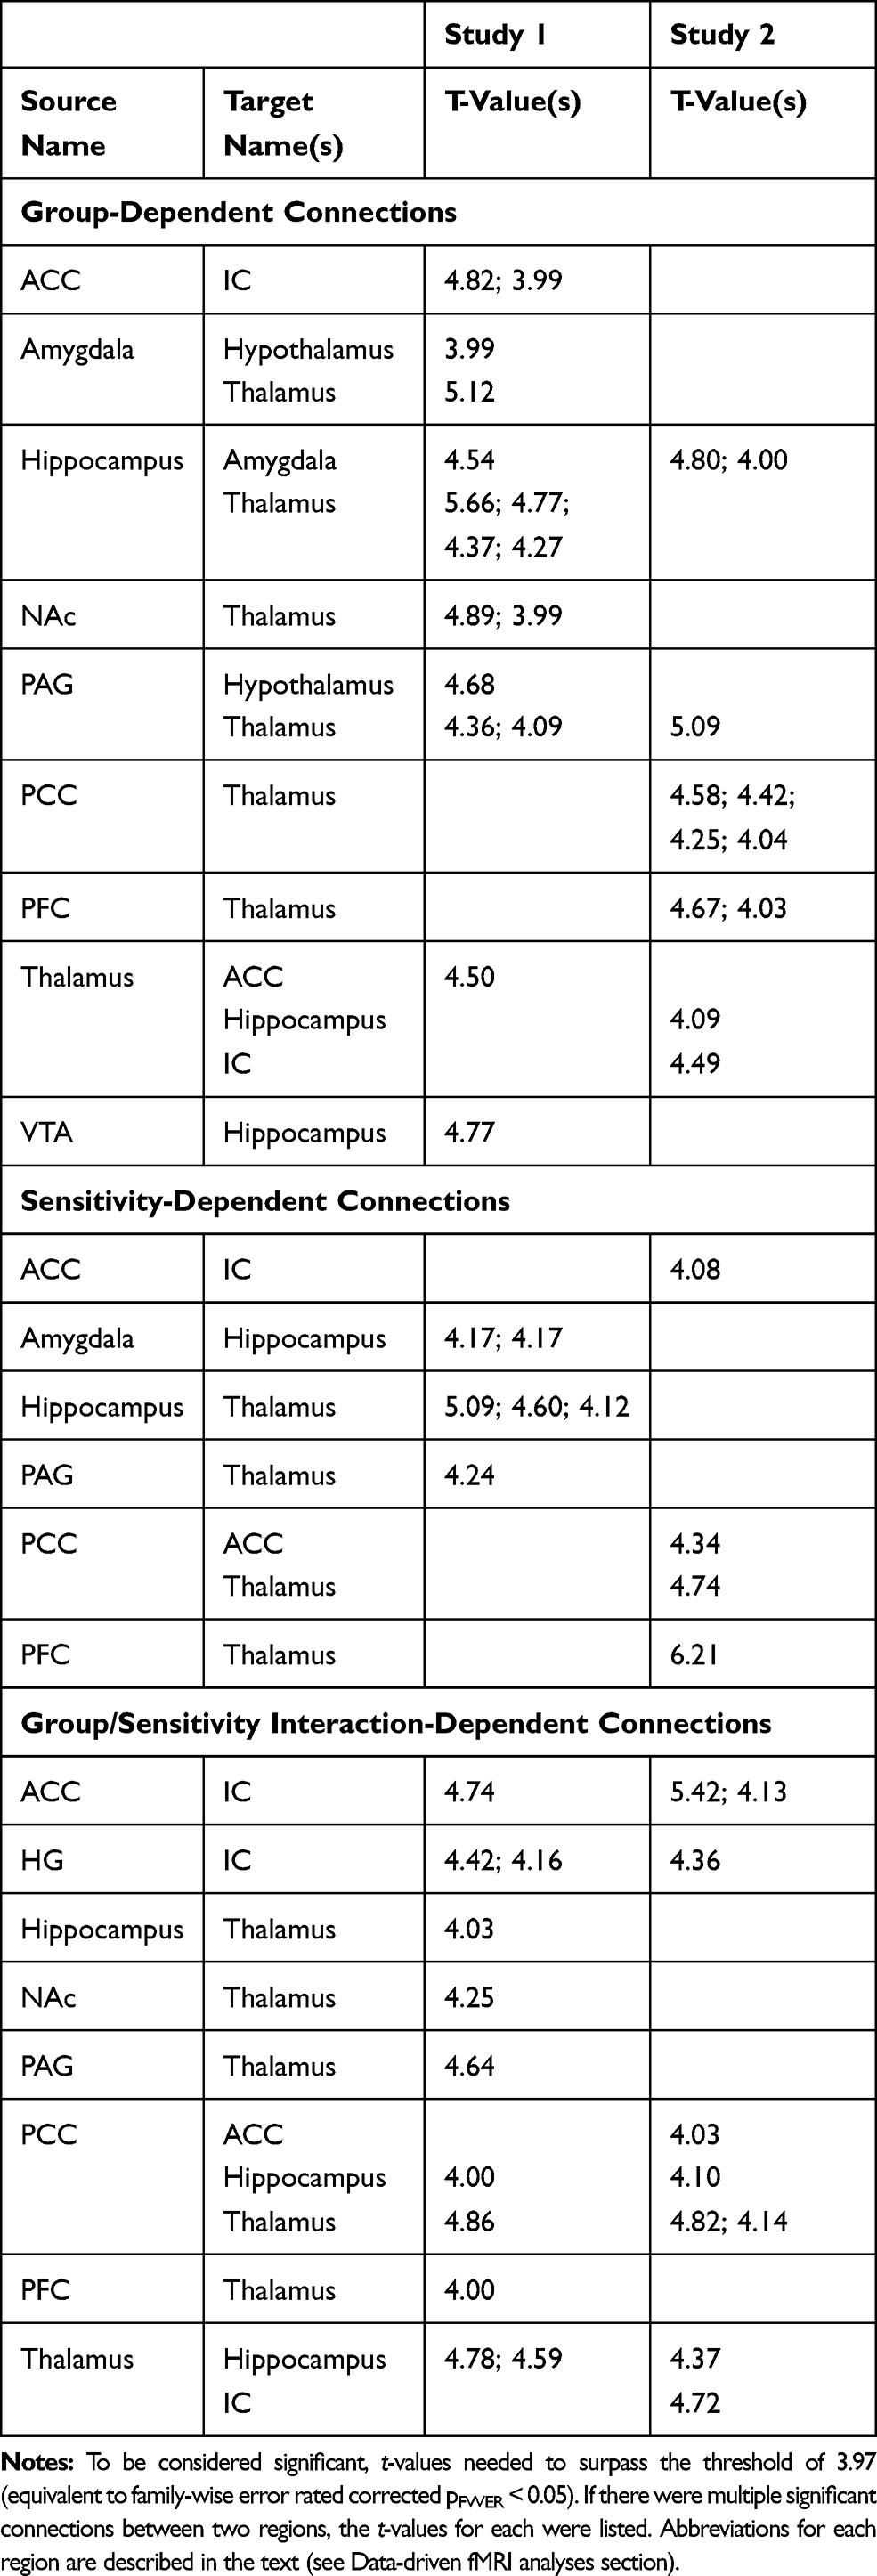 |
Table 2 Comparison of “Before Stimulation” ANCOVA Results from Data-Driven Analyses |
 |
Table 3 Comparison of “During Stimulation” ANCOVA Results from Data-Driven Analyses |
Study 1
In the “Before Stimulation” time period, the majority of the significant group-dependent connections were connections within the forebrain, and most of these connections involved the thalamus (Figure 7, Table 2). Connections that were identified to have group/sensitivity interactions in this time period also involved the thalamus (Table 2). In the “During Stimulation” time period, the majority of the group-dependent connections were between cortical regions (Figure 7, Table 3). However, unlike the “Before Stimulation” period, the thalamus was not as integral. Instead, the majority of connections involved influences from the insula or the amygdala (Figure 7, Table 3). Two connections were also identified which were significantly dependent on group X sensitivity interactions, both involving the hippocampus (Table 3). The ANCOVA also identified connections that were dependent on individual pain sensitivity, independent of the group (Tables 2 and 3). Interestingly, the majority of the connections in the period before stimulation involved the hippocampus, whereas the thalamus was involved in most of the sensitivity-dependent connections during stimulation (Tables 2 and 3).
Study 2
Similar to Study 1, the majority of the group-dependent connections in the “Before Stimulation” time period involved the thalamus (Figure 7, Table 2). The group X sensitivity interaction results also identified a number of connections, with most involving either the thalamus, insula, or the PCC (Table 2). In the “During Stimulation” time period, the thalamus was again involved in the majority of the group-dependent connections (Figure 7, Table 3). The ANCOVA also identified 8 connections with group X sensitivity interactions, and the hippocampus was involved in 4 of them (Table 3). There were also significant connections between regions based on individual pain sensitivity. The ANCOVA identified 4 significant connections in the “Before Stimulation” time period, and 5 connections in the “During Stimulation” time period. Interestingly, 4 out of 5 of the identified connections during stimulation involved the amygdala (Tables 2 and 3).
ANCOVA of Model-Driven Results
Analyses of covariance of the model-driven β-values with individual pain sensitivities revealed multiple regions from the predefined anatomical model with subregions that had group-dependent, sensitivity-dependent or group X sensitivity interaction-dependent results (p < 0.05) in both Study 1 and Study 2 datasets. However, after correcting for multiple comparisons, no significant results were found in either dataset.
Discussion
The aim of this study was to investigate whether alternative, data-driven approaches to fMRI data analysis could provide more information about altered pain processing in people with fibromyalgia and healthy controls than the standard, model-driven approaches in which the BOLD responses associated with pain processing are predicted based off of peripheral stimulation paradigms. A number of alternative analysis methods exist, but for this study we compared the model-driven GLM method to a data-driven SEM method that has been optimized by our lab.36 To test our hypothesis that the standard model-driven method is limited in its ability to reveal differences in pain processing between participants with fibromyalgia and healthy controls, we re-analyzed data from two different pain studies conducted by our lab using both methods and compared the results.
Model-Driven Results
Analysis of the fMRI datasets using the model-driven approach identified a number of regions in both the HC and FM groups that significantly fit the predicted BOLD response models (Figure 4). There was also a high degree of overlap in the regions that significantly fit the predicted models across the two study groups, suggesting that this analysis method is not severely impacted by differences in acquisition parameters (Figure 4). Most importantly, when the results of the two groups in each study were compared (ie HC1 to FM1, and HC2 to FM2), no voxels were found to be significantly different (Figure 5). For comparison consistency, the model-driven results were further analyzed using ANCOVA in an identical manner as the data-driven results. Although some regions within the predefined model had significant group-dependent, sensitivity-dependent and group X sensitivity interaction-dependent effects, none of these results persisted after correcting for multiple comparisons. These results are consistent with previous studies, and further support the previous finding that when HC and FM groups experience the same subjective levels of pain, there are no differences in pain processing within cortical regions.4–6,15,16,18–20,24
Data-Driven Results
Although the model-driven analyses did not identify significant differences between the HC and FM groups, the data-driven analyses identified connections with significant main effects of the study group in both studies, and in both time periods. These group-dependent connections were not the same across datasets. A number of explanations for these differences exist, including the differences in study design and data acquisition previously mentioned. Although the group-dependent connections were different in the two studies, these differences do not affect the validity of our findings because the results from the model-driven analyses were observed to be very similar. Instead, we argue that these inconsistencies highlight the enhanced sensitivity that data-driven analyses have over model-driven methods.
Even though the connections with significant main effects of study group were different across the two studies, a number of the same regions were involved. For example, in both datasets, significant main effects of the study group were detected in connections to the thalamus from several cortical regions and the PAG, in the period before the noxious stimulation. The thalamus is the major relay between the cortex and the brainstem/spinal cord.52 These group differences in thalamic connectivity in the period preceding stimulation could be influencing future pain perceptions, and thus may contribute to the heightened sensitivity to pain associated with FM. The group-dependent connections during the stimulation period mainly involved different regions in the two datasets. In Study 1, the insula and amygdala were involved in the majority of the group-dependent connections whereas the majority of the group-dependent connections in Study 2 involved the amygdala and thalamus. The insula and amygdala are both known to be involved in emotional processing and salience.53–55 Although the group-dependent connections in each dataset were different, the results suggest that the participants with FM may have been experiencing abnormal emotional responses to the painful stimulation which could have influenced their pain perceptions. Analyzing the relationship between the group-dependent connections and abnormal pain processing in FM is beyond the scope of this paper, but these preliminary findings warrant further investigation.
The Complexities of Pain
A likely explanation for the discrepancy between the model-driven and data-driven results stems from the complexity of pain processing. Pain involves both continuous and reactive components that are influenced by emotion, saliency, and the environment, with a high degree of individual variability.31–34 These characteristics make predicting pain responses difficult, and evidence that BOLD responses to painful stimuli do not follow models based on the timing of peripheral stimulation alone have been previously discussed.34,35,56 In the present study, a number of the regions that significantly fit the predicted BOLD responses consistently across study groups and datasets were the same regions consistently found to be associated with the “pain matrix”, such as the insula, ACC, S1, and S2.57,58 However, these same regions were identified in fMRI studies using both noxious and non-noxious external stimuli when the data were analyzed using model-driven methods based on the stimulation paradigms.57–59 This is consistent with the assertion from other research groups that the previously-identified “pain matrix” may be more accurately described as a “saliency matrix”.58,59
If model-driven analyses are highlighting saliency, then it stands to reason that when previous FM pain studies did not detect significant differences between the HC and FM groups within cortical regions, it may have been inaccurate to conclude that there were no differences in pain processing between the HC and FM groups.4–6,15,16,18,19,24 A more accurate interpretation would have been to conclude that there were no consistent differences in the saliency of the stimuli between the two groups. To study all aspects of pain processing, and not just the aspects related to saliency, it appears that data-driven analysis methods are required.
This does not mean that we can conclude that the saliency aspects of pain processing in FM are normal. On the contrary, because the stimulus intensities consistently needed to be increased in the HC groups to elicit subjectively equal levels of pain, there is likely an abnormality in the saliency aspect of pain processing as well, however an alternative experimental approach would be required to detect it. Instead of eliciting subjectively equal levels of pain in each study group, as in this study, it would be interesting to investigate how administering equivalent stimulus temperatures in each group would affect the model-driven and data-driven results. Prior studies utilizing model-driven analyses have already detected differences between HC and FM groups when the stimulus intensities were the same, and a recent study has also reported evidence for differences in saliency detection between HC and FM groups.13,60
Participant Characteristics
As shown in Table 1, both studies were successful in eliciting similar pain ratings between the two study groups. However, only Study 1 successfully age-matched the participant groups. The FM2 group was approximately 12.8 years older than the HC2 group. Consistent with previous findings, although the pain ratings were not significantly different between the two groups of each study, the temperatures required to elicit them were higher in the HC1 and HC2 groups by 2.65 °C and 3 °C, respectively. These results highlight the phenomenon of thermal hyperalgesia in the FM groups, which is a common symptom of FM.
Interestingly, there was a striking difference between the quantitative sensory results of both studies. The average pain ratings from Study 1 were 51.6 ± 10.2 and 50.5 ± 10.8 in the HC1 and FM1 groups, respectively. In Study 2, the pain ratings were much lower, being 41.9 ± 9.2 in HC2 and 42.5 ± 12.1 in FM2. Paradoxically, the stimulus temperatures were higher in Study 2 than they were in Study 1, even though the pain ratings were lower. It is possible that the participants in Study 2 simply had lower pain sensitivities than the participants in Study 1 (Table 1), however it is more likely that these results are due to the differences in stimulation devices between the two studies. Study 1 used a Medoc® Peltier thermode that was constantly attached to the participants’ skin, whereas Study 2 used a robotic device that made repeated brief heat contacts with participants’ skin. Rapidly increasing and decreasing the temperature of a thermode which is constantly in contact with the participants’ hands (Study 1) produces a different stimulation effect than administering repeated brief heat contacts (Study 2). These differences likely account for the discrepancy in quantitative sensory results between the two studies. Nevertheless, the objective of this study was to determine whether data-driven analyses could provide more information about altered pain processing than model-driven analyses when studying pain fMRI data. Because both studies successfully elicited pain in their participants, and the studies were analyzed separately but in an identical manner, the results from these analyses were still able to determine that the data-driven SEM method provided more information about pain processing than the model-driven GLM method.
Limitations
Although this paper highlights the utility of SEM as an alternative, data-driven analytical approach to fMRI pain data, this method has a number of limitations. Structural equation modeling requires a pre-defined anatomical model. Our model includes a number of regions associated with pain processing, but did not contain all possible regions (most importantly the primary somatosensory cortex (S1)). Therefore, this model is incomplete and may not reveal all relevant connectivity. There were also unintended differences in sample size and group age in Study 2, which have to be noted as potential confounds to our results. Furthermore, there were distinct differences in personal characteristics between the participants in the two studies which may also influence our findings. However, due to the larger differences between the study designs of the two studies, and the relatively consistent model-driven and data-driven findings across studies, it is unlikely that these confounding factors affected the results to a significant extent.
Conclusion
A number of the significant group-dependent connections that were consistently identified across the two studies involved regions associated with emotional regulation and saliency detection. These relationships were not identified by the model-driven approach, indicating that using alternative, data-driven approaches is important when studying pain processing using fMRI. The data-driven findings suggest a potential relationship between heightened pain sensitivity and abnormal emotional response in individuals with FM that warrants further research. However, for this relationship to be studied effectively, researchers need to reconsider how they analyze their pain fMRI data. Analyzing pain processing by relying on BOLD response predictions based on peripheral stimulation paradigms is not enough. Alternative analytical approaches are required, and studies need to be designed to optimize the utility of these approaches.
This was not the first study to provide evidence for differences in pain processing between healthy controls and people with fibromyalgia experiencing similar subjective levels of pain. However, most of the previous studies focused on specific areas of the pain-processing network.20–25 Therefore, this study is the first to highlight the large-scale differences in pain processing between the two groups. Interestingly, a number of resting-state studies have also found differences between participants with fibromyalgia and healthy controls.61–64 The common denominator across these studies and the present study is that data-driven analytical approaches were necessary to detect the differences between the HC and FM groups. Combining our results with the results from these studies, it appears that—in the context of pain processing—data-driven analyses are superior to model-driven analyses for the study of differences in neural activity between chronic pain groups and healthy controls.
Acknowledgments
This work was supported by the Natural Sciences and Engineering Research Council (NSERC) of Canada Discovery Grant (RGPIN/06221-2015) and Spectrum Therapeutics © through a MITACS Accelerate Grant. We would also like to thank Rachael Bosma, Don Brien and Janet Mirtle-Stroman for their help with data collection.
Author Contributions
All authors made substantial contributions to conception and design, acquisition of data, or analysis and interpretation of data; took part in drafting the article or revising it critically for important intellectual content; agreed to submit to the current journal; gave final approval of the version to be published; and agree to be accountable for all aspects of the work.
Disclosure
All authors declare no conflicts of interest in the subject matter or materials discussed in this manuscript.
References
1. Jensen KB, Regenbogen C, Ohse MC, et al. Brain activations during pain: a neuroimaging meta-analysis of patients with pain and healthy controls. Pain. 2016;157(6):1279–1286. doi:10.1097/j.pain.0000000000000517
2. Morton DL, Jones A, Sandhu J. Brain imaging of pain: state of the art. J Pain Res. 2016;9:613–624. doi:10.2147/JPR.S60433
3. van der Miesen M, Lindquist M, Wager T. Neuroimaging-based biomarkers for pain: state of the field and current directions. Pain Rep. 2019;4(4):e751. doi:10.1097/PR9.0000000000000751
4. Cook DB, Lange G, Ciccone DS, et al. Functional imaging of pain in patients with primary fibromyalgia. J. Rheumatol. 2004;31(2):364–378.
5. Giesecke T, Gracely RH, Grant MAB, et al. Evidence of augmented central pain processing in idiopathic chronic low back pain. Arthritis Rheum. 2004;50(2):613–623. doi:10.1002/art.20063
6. Gracely RH, Petzke F, Wolf JM, Clauw DJ. Functional magnetic resonance imaging evidence of augmented pain processing in fibromyalgia. Arthritis Rheum. 2002;46:1333–1343. doi:10.1002/art.10225
7. Mertz H, Morgan V, Tanner G, et al. Regional cerebral activation in irritable bowel syndrome and control subjects with painful and nonpainful rectal distention. Gastroenterology. 2000;118(5):842–848. doi:10.1016/S0016-5085(00)70170-3
8. Arnold LM, Bennett RM, Crofford LJ, et al. AAPT diagnostic criteria for fibromyalgia. J Pain. 2019;20(6):611–628. doi:10.1016/j.jpain.2018.10.008
9. Clauw DJ. Fibromyalgia: a clinical review. JAMA. 2014;311(15):1547–1555. doi:10.1001/jama.2014.3266
10. Arnold LM, Choy E, Clauw DJ, et al. Fibromyalgia and chronic pain syndromes: a white paper detailing current challenges in the field. Clin J Pain. 2016;32(9):737–746. doi:10.1097/AJP.0000000000000354
11. Fitzcharles MA, Ste-Marie PA, Goldenberg DL, Pereira JX, Abbey S, Choinière M, Ko G, Moulin DE, Panopalis P, Proulx J, Shir Y; National Fibromyalgia Guideline Advisory Panel. 2012 Canadian Guidelines for the diagnosis and management of fibromyalgia syndrome: executive summary. Pain Res Manag. 2013 May-Jun;18(3):119–26. doi:10.1155/2013/918216
12. Fitzcharles MA, Perrot S, Häuser W. Comorbid fibromyalgia: a qualitative review of prevalence and importance. Eur J Pain. 2018;22:1565–1576.
13. Cagnie B, Coppieters I, Denecker S, et al. Central sensitization in fibromyalgia? A systematic review on structural and functional brain MRI. Semin Arthritis Rheum. 2014;44(1):68–75. doi:10.1016/j.semarthrit.2014.01.001
14. Dehghan M, Schmidt-Wilcke T, Pfleiderer B, et al. Coordinate-based (ALE) meta-analysis of brain activation in patients with fibromyalgia. Hum Brain Mapp. 2016;37(5):1749–1758. doi:10.1002/hbm.23132
15. Loggia ML, Berna C, Kim J, et al. Disrupted brain circuitry for pain-related reward/punishment in fibromyalgia. Arthritis Rheumatol. 2014;66(1):203–212. doi:10.1002/art.38191
16. López-Solà M, Woo C-W, Pujol J, et al. Towards a neurophysiological signature for fibromyalgia. Pain. 2017;158(1):34–47. doi:10.1097/j.pain.0000000000000707
17. Pujol J, López-Solà M, Ortiz H, et al. Mapping brain response to pain in fibromyalgia patients using temporal analysis of fMRI. PLoS One. 2009;4(4):e5224. doi:10.1371/journal.pone.0005224
18. Staud R, Craggs JG, Perlstein WM, Robinson ME, Price DD. Brain activity associated with slow temporal summation of C-fiber evoked pain in fibromyalgia patients and healthy controls. Eur J Pain. 2008;12(8):1078–1089. doi:10.1016/j.ejpain.2008.02.002
19. Bosma RL, Mojarad EA, Leung L, et al. FMRI of spinal and supra-spinal correlates of temporal pain summation in fibromyalgia patients. Hum Brain Mapp. 2016;37(4):1349–1360. doi:10.1002/hbm.23106
20. Craggs JG, Staud R, Robinson ME, Perlstein WM, Price DD. Effective connectivity among brain regions associated with slow temporal summation of C-fiber-evoked pain in fibromyalgia patients and healthy controls. J Pain. 2012;13:390–400. doi:10.1016/j.jpain.2012.01.002
21. Jensen KB, Kosek E, Petzke F, et al. Evidence of dysfunctional pain inhibition in fibromyalgia reflected in rACC during provoked pain. Pain. 2009;144(1):95–100. doi:10.1016/j.pain.2009.03.018
22. Jensen KB, Loitoile R, Kosek E, et al. Patients with fibromyalgia display less functional connectivity in the brain’s pain inhibitory network. Mol Pain. 2012;8:1–9. doi:10.1186/1744-8069-8-32
23. Jensen KB, Srinivasan P, Spaeth R, Tan Y, Kosek E. Overlapping structural and functional brain changes in FMS. Arthritis Rheumatol. 2014;65:3293–3303. doi:10.1002/art.38170
24. Kim SH, Chang Y, Kim JH, et al. Insular cortex is a trait marker for pain processing in fibromyalgia syndrome - blood oxygenation level-dependent functional magnetic resonance imaging study in Korea. Clin Exp Rheumatol. 2011;29.
25. Kim J, Loggia ML, Cahalan CM, et al. The somatosensory link: S1 functional connectivity is altered by sustained pain and associated with clinical/autonomic dysfunction in fibromyalgia. Arthritis Rheumatol. 2015;67:1395–1405. doi:10.1002/art.39043
26. Staud R, Bovee CE, Robinson ME, Price DD. Cutaneous C-fiber pain abnormalities of fibromyalgia patients are specifically related to temporal summation. Pain. 2008;139(2):315–323. doi:10.1016/j.pain.2008.04.024
27. Häuser W, Fitzcharles MA, Hauser W, Fitzcharles MA. Facts and myths pertaining to fibromyalgia. Diaglogues Clin Neurosci. 2018;20:53–62.
28. Üçeyler N, Sommer C. Objective evidence that small-fiber polyneuropathy underlies some illnesses currently labeled as fibromyalgia. Pain. 2013;154(11):2569. doi:10.1016/j.pain.2013.06.037
29. Üçeyler N, Zeller D, Kahn A-K, et al. Small fibre pathology in patients with fibromyalgia syndrome. Brain. 2013;136(6):1857–1867. doi:10.1093/brain/awt053
30. Moayedi M, Salomons TV, Atlas LY. Pain neuroimaging in humans: a primer for beginners and non-imagers. J Pain. 2018;19:
31. Millan MJ. Descending control of pain. Prog Neurobiol. 2002;66:355–474.
32. Fenton BWF, Shih E, Zolton J. The neurobiology of pain perception in normal and persistent pain. Pain Manag. 2017;4:1–26.
33. Kucyi A, Davis KD. The dynamic pain connectome. Trends Neurosci. 2015;38(2):86–95. doi:10.1016/j.tins.2014.11.006
34. Stroman PW, Bosma RL, Cotoi AI, et al. Continuous descending modulation of the spinal cord revealed by functional MRI. PLoS One. 2016;11(12):1–17. doi:10.1371/journal.pone.0167317
35. Stroman PW, Ioachim G, Powers JM, Staud R, Pukall C. Pain processing in the human brainstem and spinal cord before, during, and after the application of noxious heat stimuli. Pain. 2018;159(10):2012–2020. doi:10.1097/j.pain.0000000000001302
36. Stroman PW. Validation of structural equation modeling methods for functional MRI data acquired in the human brainstem and spinal cord. Crit Rev Biomed Eng. 2016;44(4):227–241. doi:10.1615/CritRevBiomedEng.2017020438
37. Wolfe F, Smythe HA, Yunus MB, et al. The american college of rheumatology 1990 criteria for the classification of fibromyalgia. Arthritis Rheum. 1990;33(2):160–172. doi:10.1002/art.1780330203
38. Beck AT, Ward CH, Mendelson M, Mock J, Erbaugh J. Inventory for measuring depression. Arch Gen Psychiatry. 1961;561–571. doi:10.1001/archpsyc.1961.01710120031004
39. Crowne DP, Marlowe D. A new scale of social desirability independent of psychopathology. J Consult Psychol. 1960;24:349–354. doi:10.1037/h0047358
40. Spielberger, C.D. (2010). State‐Trait Anxiety Inventory. In The Corsini Encyclopedia of Psychology (eds I.B. Weiner and W.E. Craighead). doi:10.1002/9780470479216.corpsy0943
41. Sullivan MJL, Bishop SR, Pivik J. The pain catastrophizing scale: development and validation. Psychol Assess. 1995;7:524–532. doi:10.1037/1040-3590.7.4.524
42. Vierck CJ, Cannon RL, Fry G, Maixner W, Whitsel BL. Characteristics of temporal summation of second pain sensations elicited by brief contact of glabrous skin by a preheated thermode. J Neurophysiol. 1997;78:992–1002. doi:10.1152/jn.1997.78.2.992
43. Staud R, Cannon RC, Mauderli AP, et al. Temporal summation of pain from mechanical stimulation of muscle tissue in normal controls and subjects with fibromyalgia syndrome. Pain. 2003;102(1):87–95. doi:10.1016/s0304-3959(02)00344-5
44. Staud R, Vierck CJ, Cannon RL, Mauderli AP, Price DD. Abnormal sensitization and temporal summation of second pain (wind-up) in patients with fibromyalgia syndrome. Pain. 2001;91(1):165–175. doi:10.1016/S0304-3959(00)00432-2
45. van Minde D, Klaming L, Weda H. Pinpointing moments of high anxiety during an MRI examination. Int J Behav Med. 2014;21:487–495. doi:10.1007/s12529-013-9339-5
46. Chapman HA, Bernier D, Rusak B. MRI-related anxiety levels change within and between repeated scanning sessions. Psychiatry Res. 2010;182:160–164. doi:10.1016/j.pscychresns.2010.01.005
47. Gray H, Williams PL. Gray’s Anatomy: The Anatomical Basis of Medicine and Surgery. Churchill Livingstone; 1995.
48. Apkarian AV, Bushnell MC, Treede RD, Zubieta JK. Human brain mechanisms of pain perception and regulation in health and disease. Eur J Pain. 2005. doi:10.1016/j.ejpain.2004.11.001
49. Khan HS, Stroman PW. Inter-individual differences in pain processing investigated by functional magnetic resonance imaging of the brainstem and spinal cord. Neuroscience. 2015;307:231–241. doi:10.1016/j.neuroscience.2015.08.059
50. Bushnell MC, Čeko M, Low LA. Cognitive and emotional control of pain and its disruption in chronic pain. Nat Rev Neurosci. 2013;14(7):502–511. doi:10.1038/nrn3516
51. Whitfield-Gabrieli S, Nieto-Castanon A. Conn: a functional connectivity toolbox for correlated and anticorrelated brain networks. Brain Connect. 2012. doi:10.1089/brain.2012.0073
52. Herrero MT, Barcia C, Navarro JM. Functional anatomy of thalamus and basal ganglia. Childs Nerv Syst. 2002;18:386–404. doi:10.1007/s00381-002-0604-1
53. Richter-Levin G, Akirav I. Amygdala-hippocampus dynamic interaction in relation to memory. Mol Neurobiol. 2000;22:11–20. doi:10.1385/MN:22:1-3:011
54. Zheng J, Anderson KL, Leal SL, et al. Amygdala-hippocampal dynamics during salient information processing. Nat Commun. 2017;8(1). doi:10.1038/ncomms14413
55. Uddin LQ. Salience processing and insular cortical function and dysfunction. Nat Rev Neurosci. 2015;16:55–61. doi:10.1038/nrn3857
56. Ibinson JW, Vogt KM. Pain does not follow the boxcar model: temporal dynamics of the bold fmri signal during constant current painful electric nerve stimulation. J Pain. 2013;14:1611–1619. doi:10.1016/j.jpain.2013.08.004
57. Iannetti GD, Mouraux A. From the neuromatrix to the pain matrix (and back). Exp Brain Res. 2010;205:1–12. doi:10.1007/s00221-010-2340-1
58. Legrain V, Iannetti GD, Plaghki L, Mouraux A. The pain matrix reloaded: a salience detection system for the body. Prog Neurobiol. 2011;93:111–124. doi:10.1016/j.pneurobio.2010.10.005
59. Mouraux A, Diukova A, Lee MC, Wise RG, Iannetti GD. A multisensory investigation of the functional significance of the ‘pain matrix’. Neuroimage. 2011;54:2237–2249. doi:10.1016/j.neuroimage.2010.09.084
60. Hubbard CS, Lazaridou A, Cahalan CM, et al. Aberrant salience? Brain hyperactivation in response to pain onset and offset in fibromyalgia. Arthritis Rheumatol. 2020;72:1203–1213. doi:10.1002/art.41220
61. Ichesco E, Puiu T, Hampson JP, et al. Altered fMRI resting-state connectivity in individuals with fibromyalgia on acute pain stimulation. Eur J Pain. 2016;20(7):1079–1089. doi:10.1002/ejp.832
62. Napadow V, Kim J, Clauw DJ, Harris RE. Brief Report: decreased intrinsic brain connectivity is associated with reduced clinical pain in fibromyalgia. Arthritis Rheum. 2012;64(7):2398–2403. doi:10.1002/art.34412
63. Cifre I, Sitges C, Fraiman D, et al. Disrupted functional connectivity of the pain network in fibromyalgia. Psychosom Med. 2012;74(1):55–62. doi:10.1097/PSY.0b013e3182408f04
64. Napadow V, LaCount L, Park K, et al. Intrinsic brain connectivity in fibromyalgia is associated with chronic pain intensity. Arthritis Rheum. 2010;62(8):2545–2555. doi:10.1002/art.27497
 © 2021 The Author(s). This work is published and licensed by Dove Medical Press Limited. The full terms of this license are available at https://www.dovepress.com/terms.php and incorporate the Creative Commons Attribution - Non Commercial (unported, v3.0) License.
By accessing the work you hereby accept the Terms. Non-commercial uses of the work are permitted without any further permission from Dove Medical Press Limited, provided the work is properly attributed. For permission for commercial use of this work, please see paragraphs 4.2 and 5 of our Terms.
© 2021 The Author(s). This work is published and licensed by Dove Medical Press Limited. The full terms of this license are available at https://www.dovepress.com/terms.php and incorporate the Creative Commons Attribution - Non Commercial (unported, v3.0) License.
By accessing the work you hereby accept the Terms. Non-commercial uses of the work are permitted without any further permission from Dove Medical Press Limited, provided the work is properly attributed. For permission for commercial use of this work, please see paragraphs 4.2 and 5 of our Terms.