")
Back to Journals » International Journal of Chronic Obstructive Pulmonary Disease » Volume 16
Hospital Variation in Non-Invasive Ventilation Use for Acute Respiratory Failure Due to COPD Exacerbation
Authors Fortis S, Gao Y, O’Shea AMJ , Beck B, Kaboli P, Vaughan Sarrazin M
Received 20 May 2021
Accepted for publication 13 September 2021
Published 17 November 2021 Volume 2021:16 Pages 3157—3166
DOI https://doi.org/10.2147/COPD.S321053
Checked for plagiarism Yes
Review by Single anonymous peer review
Peer reviewer comments 3
Editor who approved publication: Dr Richard Russell
Spyridon Fortis,1,2 Yubo Gao,1,3 Amy M J O’Shea,1,3 Brice Beck,1 Peter Kaboli,1,3 Mary Vaughan Sarrazin1,3
1Center for Access & Delivery Research & Evaluation (CADRE), Iowa City VA Health Care System, Iowa City, IA, USA; 2Department of Internal Medicine, Division of Pulmonary, Critical Care and Occupation Medicine, University of Iowa Roy J. and Lucille A. Carver College of Medicine, Iowa City, IA, USA; 3Department of Internal Medicine, Division of General Internal Medicine, University of Iowa Roy J. and Lucille A. Carver College of Medicine, Iowa City, IA, USA
Correspondence: Spyridon Fortis
Department of Internal Medicine, Division of Pulmonary, Critical Care and Occupation Medicine, University of Iowa Roy J. and Lucille A. Carver College of Medicine, University of Iowa Hospitals and Clinics, 200 Hawkins Drive – C33 GH, Iowa City, IA, 52242, USA
Email [email protected]
Background: Non-invasive mechanical ventilation (NIV) use in patients admitted with acute respiratory failure due to COPD exacerbations (AECOPDs) varies significantly between hospitals. However, previous literature did not account for patients’ illness severity. Our objective was to examine the variation in risk-standardized NIV use after adjusting for illness severity.
Methods: We retrospectively analyzed AECOPD hospitalizations from 2011 to 2017 at 106 acute-care Veterans Health Administration (VA) hospitals in the USA. We stratified hospitals based on the percentage of NIV use among patients who received ventilation support within the first 24 hours of admission into quartiles, and compared patient characteristics. We calculated the risk-standardized NIV % using hierarchical models adjusting for comorbidities and severity of illness. We then stratified the hospitals by risk-standardized NIV % into quartiles and compared hospital characteristics between quartiles. We also compared the risk-standardized NIV % between rural and urban hospitals.
Results: In 42,048 admissions for AECOPD over 6 years, the median risk-standardized initial NIV % was 57.3% (interquartile interval [IQI]=41.9– 64.4%). Hospitals in the highest risk-standardized NIV % quartiles cared for more rural patients, used invasive ventilators less frequently, and had longer length of hospital stay, but had no difference in mortality relative to the hospitals in the lowest quartiles. The risk-standardized NIV % was 65.3% (IQI=34.2– 84.2%) in rural and 55.1% (IQI=10.8– 86.6%) in urban hospitals (p=0.047), but hospital mortality did not differ between the two groups.
Conclusion: NIV use varied significantly across hospitals, with rural hospitals having higher risk-standardized NIV % rates than urban hospitals. Further research should investigate the exact mechanism of variation in NIV use between rural and urban hospitals.
Keywords: pulmonary disease, chronic obstructive, epidemiology, non-invasive ventilation
Introduction
Chronic obstructive pulmonary disease (COPD) is a leading cause of mortality in the USA1 and is associated with high resource utilization.2,3 COPD patients experience exacerbations of the disease (AECOPD), defined as acute worsening of respiratory symptoms according to the Global Initiative for Chronic Obstructive Lung Disease (GOLD) guidelines.2 Standard therapy for moderate AECOPDs includes bronchodilators, glucocorticoids, and antibiotics.
Severe AECOPDs, defined as those requiring an emergency room visit or hospitalization, have a 1-year mortality of 26.2% and are associated with high rates of hospital readmission.4 AECOPD-related hospitalizations are also associated with reduced quality of life and are responsible for 70% of the total direct health-care costs for COPD.5,6 Severe AECOPD may lead to acute respiratory failure requiring supplemental oxygen and/or ventilation support in addition to standard therapy. The most effective treatment for acute respiratory failure due to severe AECOPD is non-invasive ventilation (NIV). NIV reduces the need for invasive mechanical ventilation (IMV) by 64% and mortality by 46%, according to a 2017 meta-analysis.7
Despite the benefit of NIV in severe AECOPDs, NIV use in AECOPD-related hospitalizations varies significantly across the USA.8,9 This variation in NIV use may be due to hospital- and patient-level characteristics, such as the patient’s severity of illness (acuity). Facilities with high-acuity patients may use NIV more frequently. Nevertheless, prior studies examining NIV variation across US hospitals did not account for patient acuity.8,9 Variation in NIV use may also be related to the heterogeneity in its adoption across hospitals. High-resource hospitals may use NIV more frequently, as opposed to low-resource facilities, which may often transfer patients who require NIV because they do not feel comfortable treating these patients in case of NIV failure. We hypothesized that NIV varies significantly across US hospitals, even after adjusting for patient acuity. Our primary objective was to investigate NIV use in AECOPD-related hospitalizations across the Veterans Health Administration (VA) and assess whether patient characteristics (eg, demographics, residential location, and comorbidities) or hospital characteristics (eg, location, volume, and resources are) were associated with NIV use.
Methods
This retrospective cohort study included AECOPD-related hospitalizations to acute-care VA hospitals between October 1, 2011 and September 30, 2017. This work was approved by the Institutional Review Boards and Research and Development Committee at the Iowa City VA Health Care System [IRB 201712713] as part of a larger study with a previous publication.10 The study was conducted in accordance with the Declaration of Helsinki. A waiver of informed consent was granted for this retrospective study because the study examined only existing patient-level data. Patients’ data were kept confidential.
Setting
We obtained data from the Veterans Informatics and Computing Infrastructure (VINCI), an integrated system that includes VA’s electronic health records and administrative data. Admissions to VA acute-care hospitals were identified via the Corporate Data Warehouse (CDW) using the inpatient domain. These datasets contain patient demographics, including residential address and ZIP code, diagnosis and procedure codes during admission, admission source, and admission and discharge dates.
Definitions
We identified patients hospitalized with AECOPD based on the International Classification of Diseases, Ninth and Tenth Revisions, Clinical Modification (ICD-9-CM and ICD-10-CM) and using the following criteria: 1) a principal diagnosis of COPD (ICD-9-CM codes: 490.x, 491.xx, 492.xx, and 496.xx; or ICD-10-CM codes: J41, J43, J43.1, J43.2, J43.8, J43.9, J44.0, J44.1, J41.8, J42, or J44.9) or 2) a principal diagnosis of acute respiratory failure (518.81, 518.82, 518.84, or 799.1; ICD-10-CM: J96.00, J96.01, J96.02, J96.11, J96.12, J96.20, J96.21, J96.22, J96.90, J96.92, or R06.03) with a secondary AECOPD diagnosis (ICD-9-CM codes: 491.21, 491.22; ICD-10-CM codes: J44.1, J44.0).
NIV use was defined using ICD-9-CM procedure code 93.90 or, for ICD-10, codes 5A09357, 5A09457, and 5A09557. IMV use was defined using ICD-9-CM procedure codes 96.04 and 96.70–96.72 or, for ICD-10, codes 0BH17EZ, 0BH18EZ, 5A1935Z, 5A1945Z, and 5A1955Z. Primary ventilation support was defined based on whether the patient received NIV and/or IMV within one day from the admission date.
Patient rurality was defined using census tracts based on Rural Urban Commuting Area (RUCA) codes. RUCA codes reflect measures of urbanization, commuting, and population density.11–15 RUCA codes were further condensed to designate an area as urban (RUCA codes: 1 and 1.1), rural (RUCA codes: 2, 2.1, 3, 4, 4.1, 5, 5.1, 6, 7, 7.1, 7.2, 8, 8.1, 8.2, and 9), or isolated rural (RUCA codes: 10, 10.2, 10.2, and 10.3), using the categories defined by the VA Office of Rural Health.16 Travel time to the nearest VA hospital was determined from VA Planning Systems and Support Group (PSSG) geo-coded enrollment files. PSSG calculates distances to tertiary care VA sites for all enrolled patients using actual longitude and latitude coordinates of patient residences and the nearest VA hospitals. Travel time to the nearest VA hospital was estimated using geospatial technologies, which reflect roads and average driving conditions.11 Comorbidities were defined using ICD-9-CM and ICD-10-CM diagnosis codes within 1 year prior to admission in the inpatient, outpatient, or fee-basis data files, except for pneumonia, which was defined based on the presence of the corresponding diagnosis code during the hospitalization, as previously described.17 Severity of illness was quantified using a modified APACHE score (mAPACHE), which includes vital signs and commonly obtained laboratory values,12,18,19 and has also been externally validated.20 In brief, mAPACHE uses the same scoring assignments as APACHE III and includes all the predictor variables from the APACHE III excluding the Glasgow Coma Scale, urine output, arterial blood gas, and mechanical ventilator components. mAPACHE variables include age, comorbidities, mean arterial blood pressure, heart rate, respiratory rate, temperature, hematocrit, white blood cells, sodium, blood urea nitrogen, creatinine, glucose, albumin, and bilirubin. We retrieved all the data from electronic medical records, as described previously.12,18,19 Obstructive sleep apnea was defined using ICD-9 diagnosis code 327.2 or 780.57, or ICD-10 diagnosis codes G47.30–G47.39.
Hospital rurality was defined using the same methods as patient rurality, but the facilities in rural and isolated rural areas were collapsed to one category (rural). Hospital complexity was defined by VA as 1 (high resource), 2 (medium resource), and 3 (low resource).21 Hospital COPD-case volume was classified as high (above the median) or low (below the median) based on the total COPD volume during the study period. Hospital length of stay was calculated from the admission and discharge dates, in days. Hospital mortality was defined using the date of death listed in the VA Vital Status File and the occurrence of this date between the admission and discharge dates inclusive.
We included admissions with AECOPD at 121 VA acute-care facilities from 2011 to 2017. We excluded records admitted to facilities with complexity 3 (low resource) and newly opened facilities because these facilities may not provide ventilator support. We also excluded patients in hospices (V667/Z51.5 code within 1 year prior to the hospitalization date) and admissions of patients who received no oral or intravenous glucocorticoids during the hospitalizations.
Statistical Analysis
As NIV use may vary depending on the patient’s severity of illness (acuity), we calculated the risk-standardized NIV % to assess the NIV variation across the hospitals. We followed a similar approach to that used in a previous study.8 In brief, we created a hierarchical multivariable logistic regression model with NIV use within the first 24 hours of admission as the dependent variable (outcome) among records started on ventilation (records without NIV or invasive ventilation within first 24 hours were not used). Hospital was included as a random effect. Models were adjusted for severity of illness (mAPACHE) and several comorbidities (obstructive sleep apnea, presence of comorbid pneumonia, diabetes mellitus, congestive heart failure, hypertension, peripheral vascular disease, coronary artery disease, cancer, chronic kidney disease, stroke, and liver disease).22 Similarly to the approach used for publicly reported hospital performance metrics,23,24 we calculated the expected and predicted proportion of NIV use for each hospital using these models. Specifically, the expected rate is calculated based on hospital patient characteristics and does not include the hierarchical model hospital-specific random intercepts, whereas the predicted rate does incorporate hospital-specific random intercepts. The risk-standardized proportion of NIV use for each hospital was determined by multiplying the overall unadjusted proportion of NIV use by the ratio of the predicted to expected proportion for each hospital. Then, we stratified hospitals into quartiles based on hospital risk-standardized NIV % and compared patient characteristics among quartiles for trend and differences between Q1 and Q4. We used linear regression to examine trends between risk-standardized NIV % quartiles (Q1 to Q4) for continuous variables (p for trend), and a Cochran–Mantel–Haenszel test to examine trends between risk-standardized NIV % quartiles for categorical variables. The t-test (for continuous variables) and chi-squared test (for categorical variables) were also used to compare differences in characteristics between the lowest (Q1) and highest (Q4) quartiles of risk-standardized NIV %. Subsequently, we compared the risk-standardized NIV % using the Wilcoxon–Mann–Whitney test, and unadjusted hospital mortality using the chi-squared test between: 1) rural and urban, 2) low-volume and high-volume, and 3) complexity 2 (medium-resource) and complexity 1 (high-resource) hospitals. We also created a hierarchical logistic regression model to examine the association of hospital characteristics with hospital mortality adjusted for severity of illness and accounting for repeated admissions. All statistical analyses were conducted using SAS Enterprise Guide, 2014 (SAS Institute Inc).
Results
Of 64,895 admissions with AECOPD exacerbations at 121 VA acute-care facilities from 2011 to 2017, 22,847 records met the exclusion criteria (Figure 1). The final cohort included 42,048 admissions in 106 VA hospitals and all of them were ICU admissions. We stratified these records by ventilator support within the first 24 hours of admission (primary ventilation support). Figure 1 also shows the outcomes of admissions stratified by ventilation support.
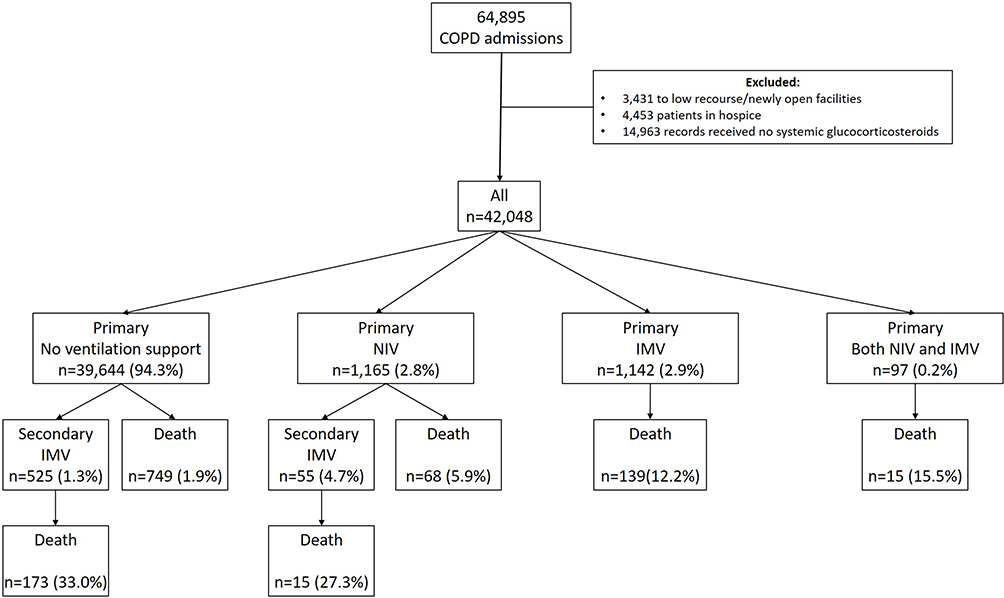 |
Figure 1 Patient flowchart and outcomes by ventilation support within one day from admission. Abbreviations: IMV, invasive mechanical ventilation; NIV, non-invasive ventilation. |
The percentage of total admissions who received any ventilation support (NIV, IMV, or both) within the first 24 hours across all 106 hospitals ranged from 0.8% to 13.7%, with a median of 5.4% (interquartile interval [IQI]=3.7–7.8%) (Figure 2). The percentage of total admissions who received primary NIV ranged from 0% to 9%, with a median of 2.8% (IQI=1.2–4.5%). Among only those admissions who received ventilation support within the first 24 hours (primary NIV, IMV, or both), the unadjusted NIV % use ranged from 0 to 100, with a median of 54.7% (IQI=34.8–68.2%).
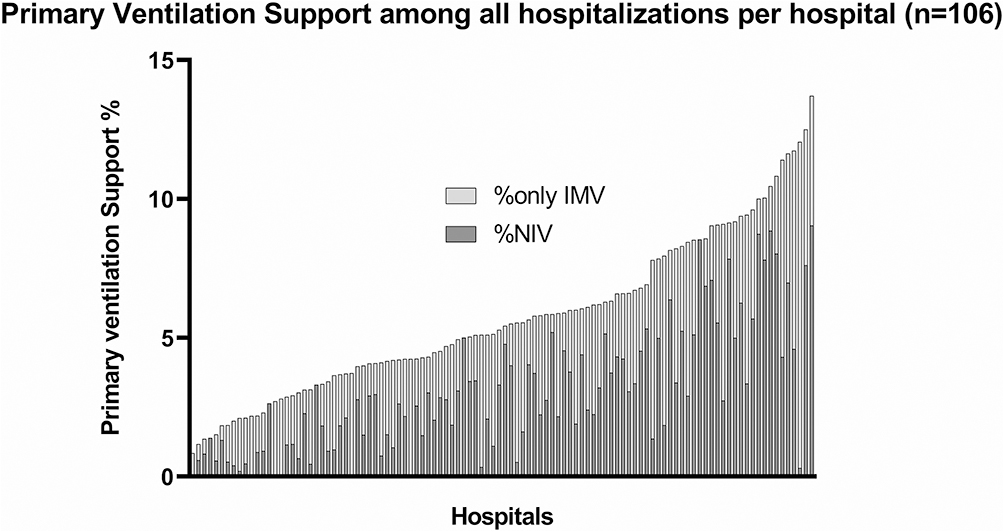 |
Figure 2 Percentage of ventilatory support within one day from admission across the 106 facilities. Abbreviations: IMV, invasive mechanical ventilation; NIV, non-invasive ventilation. |
The risk-standardized NIV % (the adjusted initial NIV of those admissions receiving ventilation support in the initial 24 hours) ranged from 10.8% to 86.6%, with a median of 58.0% (IQI=41.9–64.4%). Table 1 shows the characteristics of the hospitals stratified by risk-standardized NIV % into quartiles. Risk-standardized NIV % use accounted for severity of illness and comorbidities. Quartile 1 (Q1) included hospitals with the lowest risk-standardized NIV while quartile 4 (Q4) included hospitals with the highest risk-standardized NIV; other patient- and hospital-level characteristics are reported by risk-standardized NIV % quartiles. There were more black and rural patients in the highest risk-standardized NIV % relative to lower quartiles. Patients in the highest risk-standardized NIV % quartile had longer travel time to the nearest VA hospitals than those in the lowest quartiles. The IMV rates were lower and hospital length of stay was longer in hospitals in the highest NIV quartiles relative to the lowest quartiles.
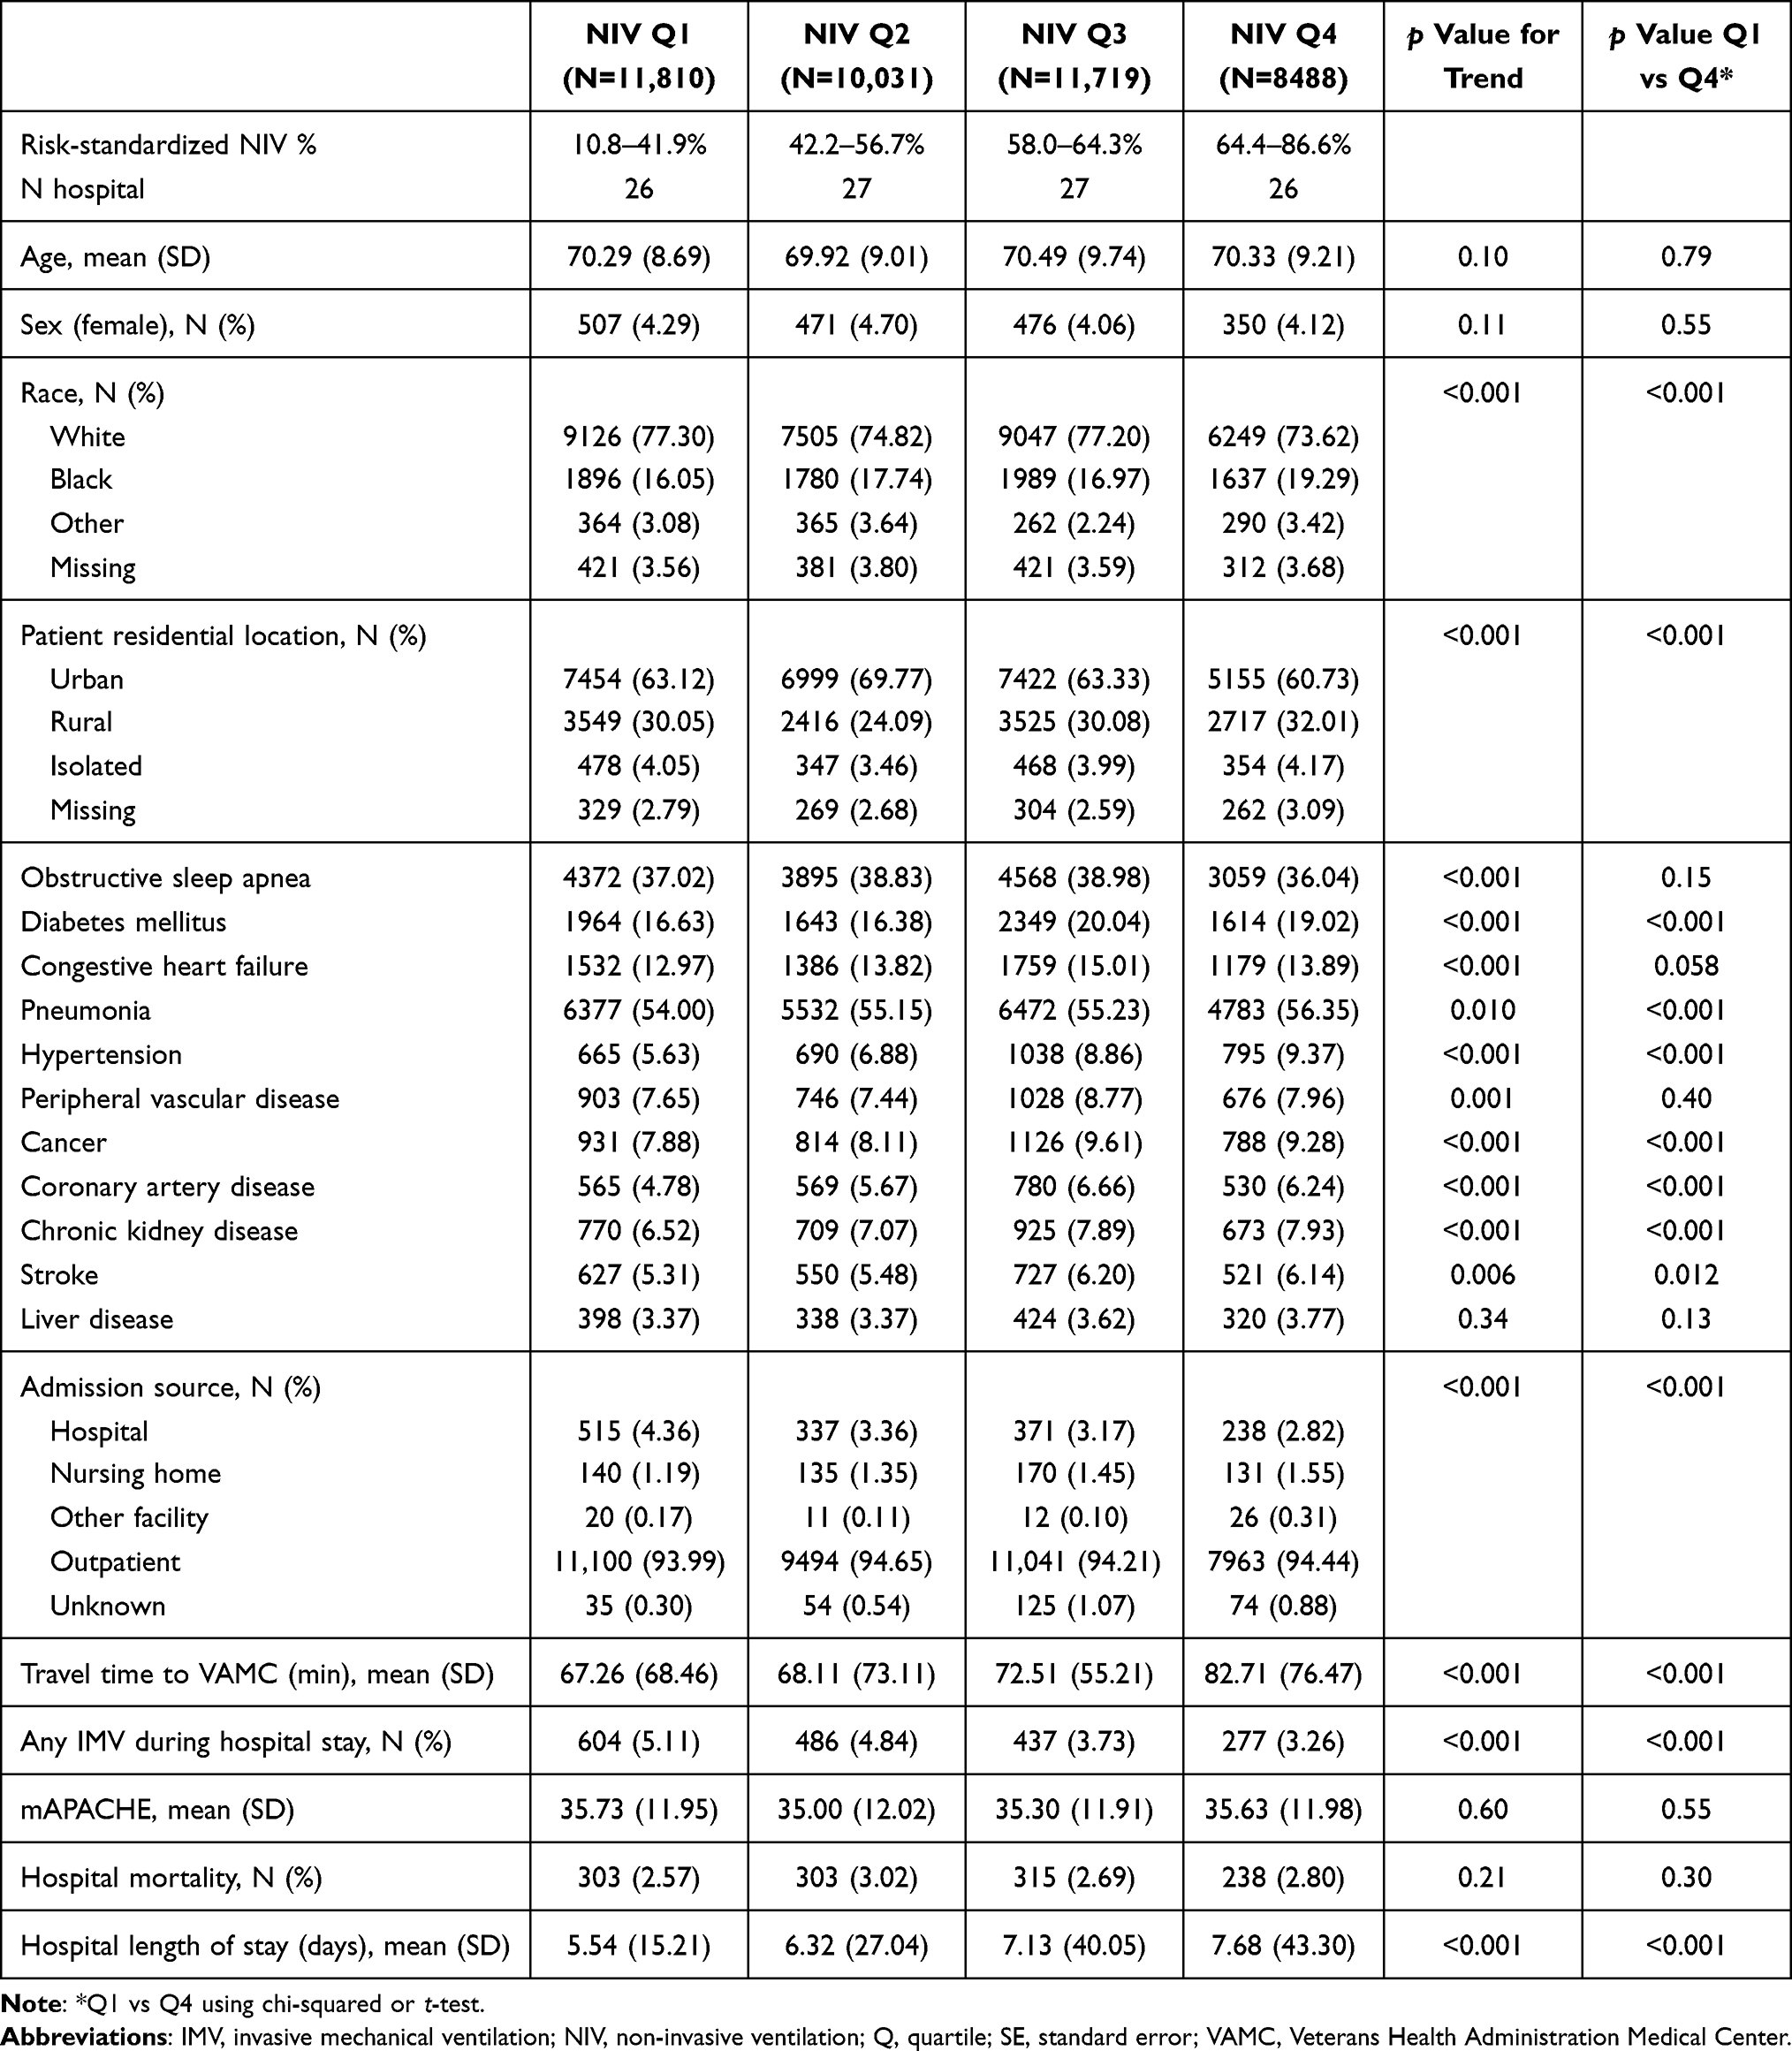 |
Table 1 Patient and Hospital Characteristics of 106 Hospitals Stratified by Risk-Standardized Non-Invasive Ventilation Percentage Within One Day from Admission |
Table 2 shows a risk-standardized NIV % of 55.1% (min=10.8%; max=86.6%) in urban hospitals, while the NIV % was 65.3.5% (min=34.2%; max=84.2%) in rural hospitals (p=0.047). There was no difference in risk-standardized NIV % between high- and low-COPD-volume facilities (p=0.33), or between complexity 1 (high-resource) and complexity 2 (medium-resource) hospitals (p=0.45).
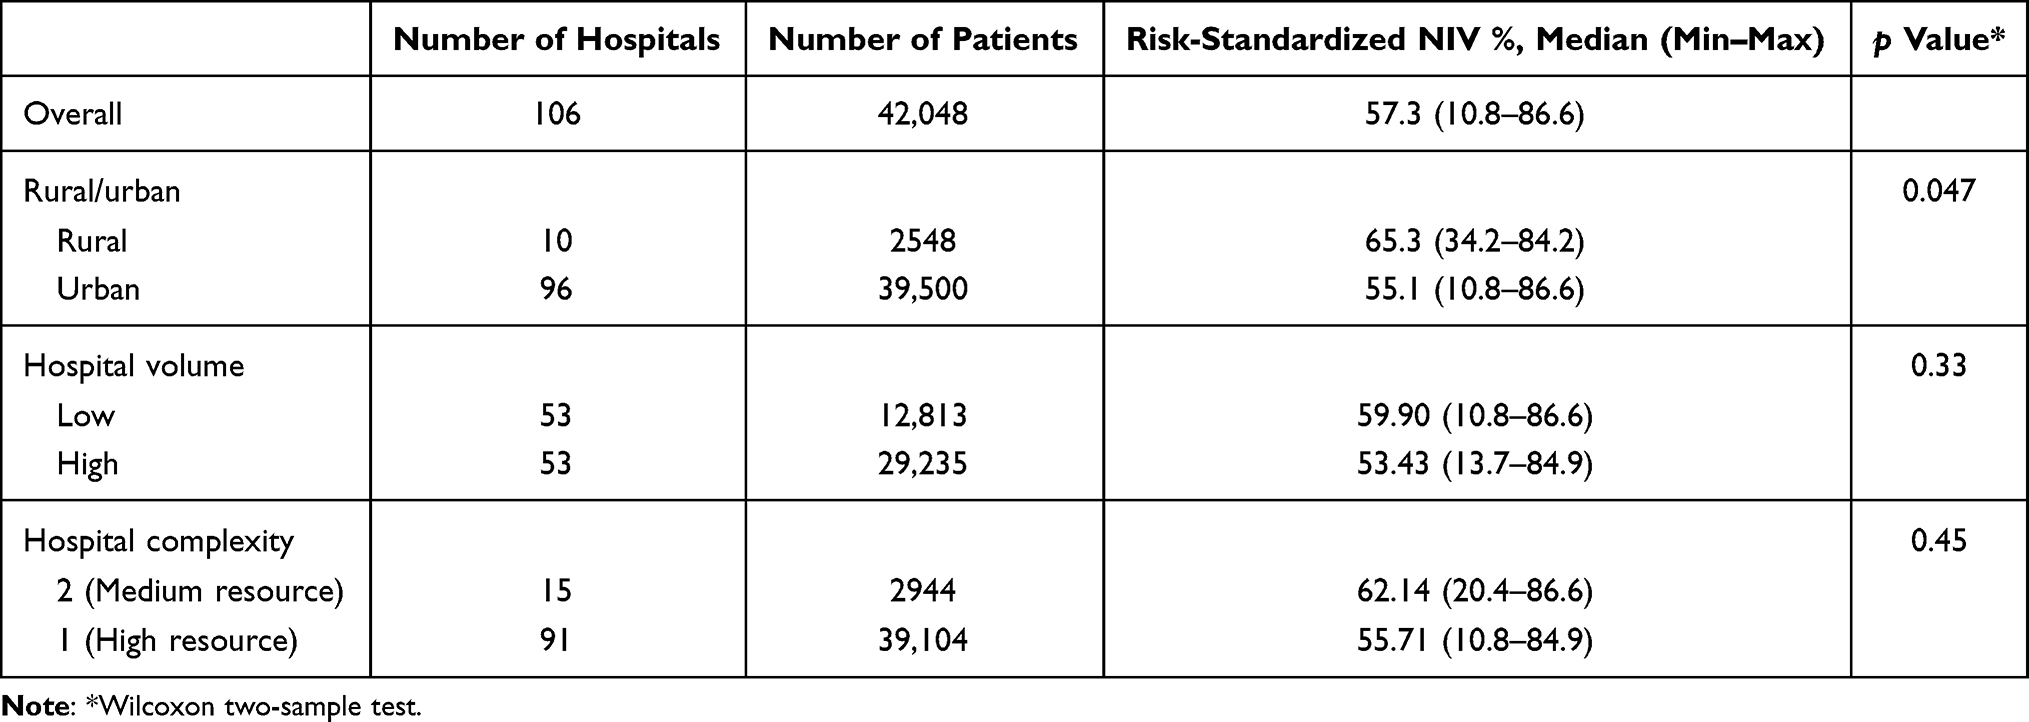 |
Table 2 Risk-Standardized Non-Invasive Ventilation Percentage Stratified by Hospital Characteristics |
Table 3 shows unadjusted mortality stratified by hospital characteristics. After adjusting for patient acuity and taking into account repeated admissions, admission at an urban hospital was not associated with mortality (odds ratio [OR]=0.90; 95% CI=0.68 to 1.19, p=0.46) relative to admission at a rural hospital. Similarly, admission to a low-volume hospital was not associated with mortality (OR=1.00; 95% CI=0.86 to 1.18, p=0.96) relative to admission at a high-volume hospital, but admission to a medium-resource facility (complexity 2) was associated with increased mortality (OR=1.55; 95% CI=1.20 to 2.00, p<0.001) relative to admission at a high-resource facility.
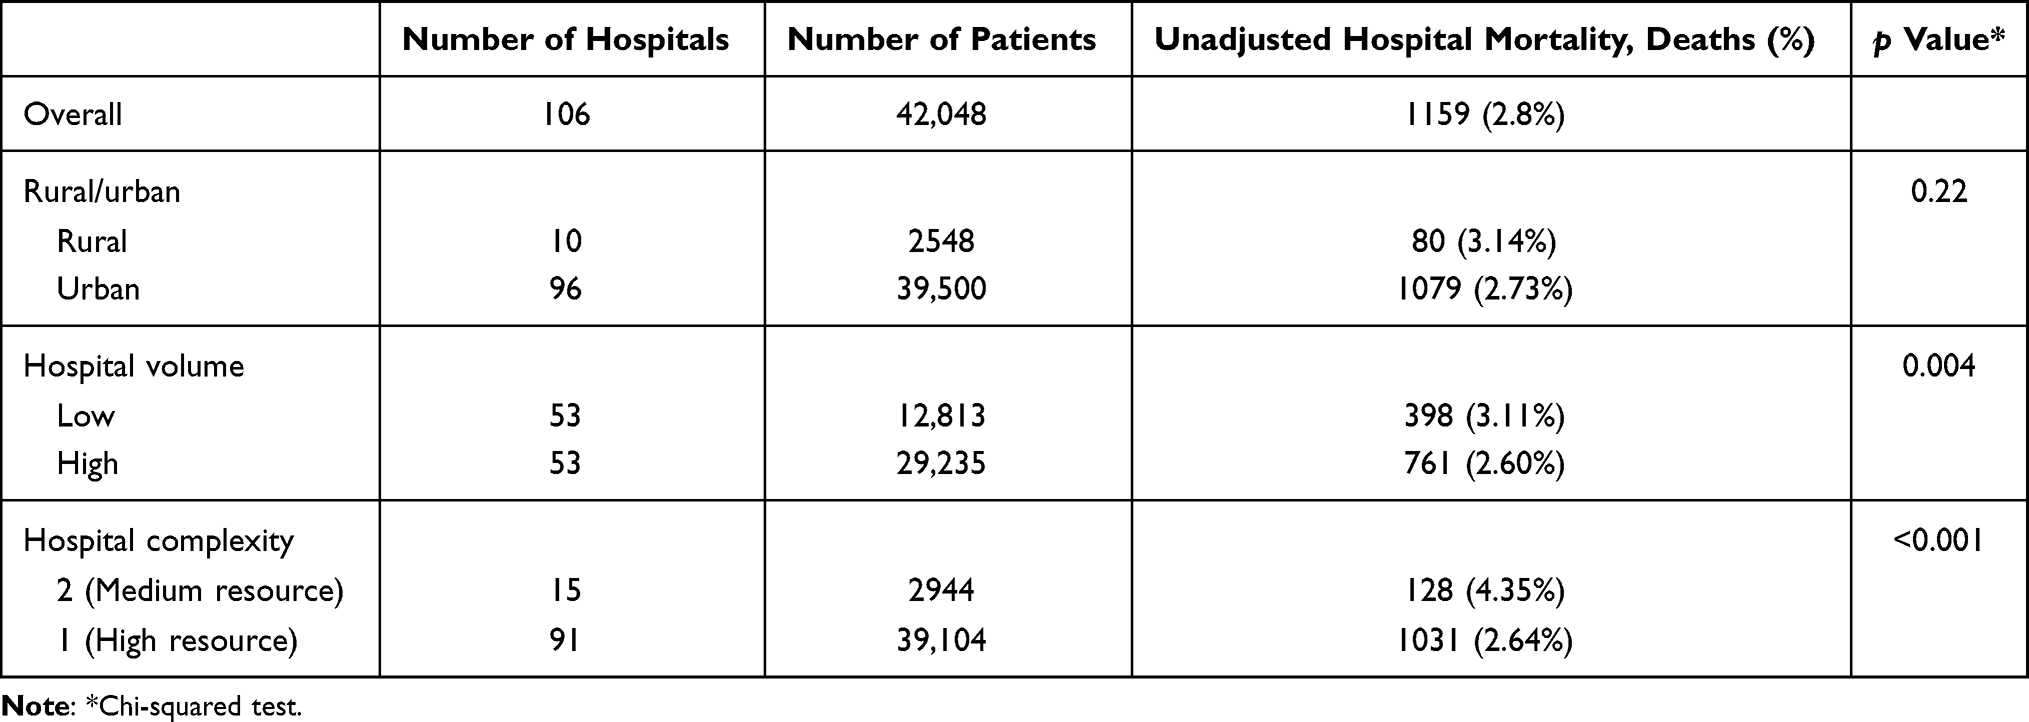 |
Table 3 Unadjusted Mortality Stratified by Hospital Characteristics |
Discussion
In a cohort of 42,048 patients admitted with AECOPD to VA hospitals over 6 years, we observed considerable variation in NIV use across hospitals. After taking into account patient acuity using a validated critical illness severity score18,20,25 and comorbidities, we observed that hospitals in the highest NIV use quartile cared for more rural patients, used IMV less, and had longer length of hospital stay, but had no difference in mortality relative to hospitals in the lowest quartiles. The NIV use rate was higher in rural than in urban hospitals. Hospital mortality did not differ between rural and urban facilities.
It is well established that NIV reduces the need for IMV and hospital length of stay, and improves mortality in acute respiratory failure due to AECOPD26 and heart failure,27 but its role in other causes of respiratory failure, such as pneumonia, is controversial.28 In a study using 2011 claims data from California, the most common reason for NIV (26.1%) was pneumonia. Among hospitalizations with NIV as the primary ventilator support, hospitals that used NIV for strong-evidence conditions (COPD and heart failure) had lower NIV failure rates.9 We found that concomitant pneumonia was present in more than 50% of the AECOPD patients requiring NIV and/or IMV within 24 hours of admission. Although this may merely represent pneumonia overdiagnosis or using an ICD code to order a chest X-ray, pneumonia and AECOPD frequently coexist.29,30 In our analysis, we included only admissions with a primary diagnosis of AECOPD. We also adjusted for concomitant pneumonia when we calculated the risk-standardized NIV use because pneumonia is associated with worse outcomes.30
Several observational studies conducted in various countries have reported approximately a five-fold increase in NIV use rates in the early 2010s compared to those in the early 2000s.31–33 Using the Premier inpatient database, Stefan et al showed that initial NIV use increased by 15.1% annually in the USA.33 In 2001, NIV use was 5.9% but by 2011 it was 14.8%. This increase concurred with a decline in IMV use. The widespread use of NIV is due to its easy application. This may be the reason why we observed an inverse association between NIV and IMV in the hospitals, and not necessarily that NIV reduced the need for IMV.
A plethora of studies have shown significant variation in NIV use across hospitals.8,9,34 Mehta et al showed that the risk-standardized NIV % rate among 37,516 hospitalizations for AECOPD across 250 hospitals in California was 10% (IQI=1.6–35.7%).9 In another cross-sectional analysis of 77,576 hospitalizations across 386 US hospitals, the risk-standardized NIV % among those admissions requiring ventilation support ranged from 47.4% at the 10th percentile to 84.7% at the 90th percentile.8 We also observed significant variation even though we conducted the study in a single health system that has published guidelines to provide care for COPD patients.35
NIV variation across hospitals may be related to the case mix of patients admitted to those hospitals. Large tertiary centers may care for very sick patients, and for that reason, IMV (and not NIV) is more frequently used there than in small rural hospitals. Adjusting for patient illness severity is crucial for studying NIV variation across hospitals. Prior reports studying risk-standardized NIV use were limited because patient acuity was not included in the analysis. Instead, comorbidities identified using ICD-9 codes were used as surrogates for severity of illness. In our analysis, we not only adjusted for comorbidities, but also accounted for severity of illness. Adjusting for patient acuity is critical as NIV may be underused or overused. NIV may be unnecessary in low-acuity patients, but it may be harmful in high-acuity patients who may require IMV, and delays in initiating IMV in these patients may increase the level of mortality.25,36 Our findings showed that rural hospitals used NIV more, which is in agreement with previous literature.8
Numerous hospital factors may also be responsible for variations in NIV use. In the early years of NIV, lack of equipment was the main reason for underuse.37 Subsequent surveys showed that insufficient training of physicians was the main reason for NIV underuse, followed by lack of equipment.38 Inadequate training of respiratory therapists was another contributor. A survey of Canadian physicians conducted in 2003 did not show variation in practice among various facilities, but rather variation among specialties.39 A national survey of VA physicians and respiratory therapists in 2004 revealed that lack of training and experience was a significant factor in NIV underutilization.40 A study using a qualitative approach with in-depth interviews of 32 participants in seven US hospitals, including nurses, physicians, respiratory therapists, and leaders, showed that respiratory therapist autonomy, interdisciplinary teamwork, staff education, and the presence of policies and protocols were features of high-performing hospitals.41
Lindenauer et al demonstrated that among several hospital characteristics, including teaching status, staffing levels, and hospital location and volume, only the presence of intensivists and hospital rurality was associated with high risk-adjusted NIV use.8 Although we found that rural hospitals more frequently use NIV, we did not find any difference in risk-standardized NIV % between medium- and high-resource hospitals, or between low- and high-volume hospitals. We did find fewer black and rural patients in hospitals with higher risk-standardized NIV %. This finding may be related to how and where patients seek medical care (eg, rural patients may seek care in nearby low-resource hospitals). Racial disparities in treatment are also possible. A previous study in VA demonstrated that rates of IMV were higher in black than in white patients.42
Another finding of this study is that hospitals in the highest risk-standardized NIV % use quartiles had longer hospital length of stay and received more rural patients, indicating that these hospitals delay discharging rural patients (perhaps because of a lack of skilled nursing and rehabilitation facilities in the area).
Our study has several limitations. It was conducted in a single health-care system, with most of the patients being male. Therefore, we should generalize our findings with caution. Because we did not have smoking exposure data or pulmonary function data, we cannot confirm the diagnosis of COPD. We cannot exclude the misdiagnosis of hypercapnic respiratory failure due to obesity hypoventilation as COPD-related respiratory failure. Nevertheless, we included only patients who received oral steroids and we took obstructive sleep apnea into account to calculate our risk-standardized NIV %. In addition, our previous work, which used less stringent ICD code criteria, showed an accuracy in identifying AECOPD of between 80% and 90%.10 We did not exclude patients with obstructive sleep apnea, as obstructive sleep apnea–COPD overlap is common, in particular among patients with advanced disease.43 Excluding those patients would have resulted in a sample that was not a good representative of the true population. We have no data regarding NIV modes used (eg, BIPAP). Physiological parameters such as partial pressure of CO2 in the arterial blood, which are indicators of patient acuity, were not available. Moreover, we did not have data from civilian hospitals. Veterans may have been hospitalized at civilian hospitals owing to ease of access or convenience. There were no available data regarding the staffing levels of hospitals, including whether a board-certified critical care physician or ICU telemedicine was available, which are associated with improved outcomes. The above limitations do not undermine the strengths of our study, which are the large sample size, the strict exclusion criteria, and the fact that we used an illness severity scoring system to calculate the risk-standardized NIV %.
Conclusions
Among patients admitted with AECOPD in VA hospitals, NIV use varied significantly across hospitals, with rural hospitals having higher risk-standardized NIV % than urban ones. Hospitals with the highest NIV rates cared for more rural patients and had longer hospital length of stay than hospitals with the lowest NIV rates. Further research should investigate the exact mechanism of variation in NIV use between rural and urban hospitals.
Descriptor
9.6 COPD: Epidemiology
Acknowledgments
The views expressed in this article are those of the authors and do not necessarily reflect the position or policy of the Department of Veterans Affairs or the United States Government.
Author Contributions
All authors made a significant contribution to the work reported, whether that is in the conception, study design, execution, acquisition of data, analysis and interpretation, or in all these areas; took part in drafting, revising or critically reviewing the article; gave final approval of the version to be published; have agreed on the journal to which the article has been submitted; and agree to be accountable for all aspects of the work.
Funding
The work reported here was supported by the Department of Veterans Affairs, Veterans Health Administration, Office of Rural Health, Veterans Rural Health Resource Center (award no. 14380), and the Health Services Research and Development (HSR&D) Service through the Comprehensive Access and Delivery Research and Evaluation (CADRE) Center (CIN 13-412).
Disclosure
Dr Fortis reports grants from the Veterans Health Administration, has received grants from the American Thoracic Society and Fisher & Paykel to study the effect of heat-humidified high-flow air on COPD, and has served as a consultant for Genentech. Dr Amy MJ O’Shea reports grants from the VHA Office of Rural Health, during the conduct of the study. Mr Brice Beck reports receiving a salary from Iowa City VHA Research, during the conduct of the study. The authors have no other conflicts of interest germane to this manuscript. The views expressed in this article are those of the authors and do not necessarily reflect the position or policy of the Department of Veterans Affairs or the United States Government.
References
1. Soriano JB, Kendrick PJ, Paulson KR; GBD Chronic Respiratory Disease Collaborators. Prevalence and attributable health burden of chronic respiratory diseases, 1990-2017: a systematic analysis for the global burden of disease study 2017. Lancet Respir Med. 2020;8(6):585–596. doi:10.1016/S2213-2600(20)30105-3
2. Global Initiative for the Diagnosis, Management, and Prevention of Chronic Obstructive Lung Disease. Global strategy for the diagnosis, management, and prevention of chronic obstructive pulmonary disease (2020 report); 2020.
3. Guarascio AJ, Ray SM, Finch CK, Self TH. The clinical and economic burden of chronic obstructive pulmonary disease in the USA. Clinicoecon Outcomes Res. 2013;5:235–245.
4. Lindenauer PK, Dharmarajan K, Qin L, Lin Z, Gershon AS, Krumholz HM. Risk trajectories of readmission and death in the first year after hospitalization for chronic obstructive pulmonary disease. Am J Respir Crit Care Med. 2018;197(8):1009–1017. doi:10.1164/rccm.201709-1852OC
5. Wang Y, Stavem K, Dahl FA, Humerfelt S, Haugen T. Factors associated with a prolonged length of stay after acute exacerbation of chronic obstructive pulmonary disease (AECOPD). Int J Chron Obstruct Pulmon Dis. 2014;9:99–105. doi:10.2147/COPD.S51467
6. Darnell K, Dwivedi AK, Weng Z, Panos RJ. Disproportionate utilization of healthcare resources among veterans with COPD: a retrospective analysis of factors associated with COPD healthcare cost. Cost Eff Resour Alloc. 2013;11:13. doi:10.1186/1478-7547-11-13
7. Osadnik CR, Tee VS, Carson-Chahhoud KV, Picot J, Wedzicha JA, Smith BJ. Non-invasive ventilation for the management of acute hypercapnic respiratory failure due to exacerbation of chronic obstructive pulmonary disease. Cochrane Database Syst Rev. 2017;7:CD004104.
8. Lindenauer PK, Stefan MS, Shieh MS, Pekow PS, Rothberg MB, Hill NS. Hospital patterns of mechanical ventilation for patients with exacerbations of COPD. Ann Am Thorac Soc. 2015;12(3):402–409. doi:10.1513/AnnalsATS.201407-293OC
9. Mehta AB, Douglas IS, Walkey AJ. Hospital noninvasive ventilation case volume and outcomes of acute exacerbations of chronic obstructive pulmonary disease. Ann Am Thorac Soc. 2016;13(10):1752–1759. doi:10.1513/AnnalsATS.201610-777LE
10. Fortis S, O’Shea AMJ, Beck BF, Comellas A, Vaughan Sarrazin M, Kaboli PJ. Association between rural residence and in-hospital and 30-day mortality among veterans hospitalized with COPD exacerbations. Int J Chron Obstruct Pulmon Dis. 2021;16:191–202. doi:10.2147/COPD.S281162
11. Abrams TE, Vaughan-Sarrazin M, Fan VS, Kaboli PJ. Geographic isolation and the risk for chronic obstructive pulmonary disease-related mortality: a cohort study. Ann Intern Med. 2011;155(2):80–86. doi:10.7326/0003-4819-155-2-201107190-00003
12. O’Shea AMJ, Fortis S, Vaughan Sarrazin M, Moeckli J, Yarbrough WC, Schacht Reisinger H. Outcomes comparison in patients admitted to low complexity rural and urban intensive care units in the veterans health administration. J Crit Care. 2019;49:64–69. doi:10.1016/j.jcrc.2018.10.013
13. Ohl M, Tate J, Duggal M, et al. Rural residence is associated with delayed care entry and increased mortality among veterans with human immunodeficiency virus infection. Med Care. 2010;48(12):1064–1070. doi:10.1097/MLR.0b013e3181ef60c2
14. Ohl ME, Perencevich E, McInnes DK, et al. Antiretroviral adherence among rural compared to urban veterans with HIV infection in the United States. AIDS Behav. 2013;17(1):174–180. doi:10.1007/s10461-012-0325-8
15. Rural-urban commuting area codes. Available from: https://www.ers.usda.gov/data-products/rural-urban-commuting-area-codes.aspx.
16. VHA office of rural health. Available from: https://www.ruralhealth.va.gov/aboutus/ruralvets.asp#atlas.
17. Quan H, Sundararajan V, Halfon P, et al. Coding algorithms for defining comorbidities in ICD-9-CM and ICD-10 administrative data. Med Care. 2005;43(11):1130–1139. doi:10.1097/01.mlr.0000182534.19832.83
18. Fortis S, O’Shea AMJ, Beck BF, et al. An automated computerized critical illness severity scoring system derived from APACHE III: modified APACHE. J Crit Care. 2018;48:237–242. doi:10.1016/j.jcrc.2018.09.005
19. Fortis S, Sarrazin MV, Beck BF, Panos RJ, Reisinger HS. ICU telemedicine reduces interhospital ICU transfers in the veterans health administration. Chest. 2018;154(1):69–76. doi:10.1016/j.chest.2018.04.021
20. Verma AA, Hora T, Jung HY, et al. Characteristics and outcomes of hospital admissions for COVID-19 and influenza in the Toronto area. CMAJ. 2021;193(12):E410–E418. doi:10.1503/cmaj.202795
21. Facilities staffing requirements for the Veterans Health Administration-resource planning and methodology for the future National Academies of Sciences, Engineering, and Medicine; Division of Behavioral and Social Sciences and Education; Board on Human-Systems Integration; Division on Engineering and Physical Sciences; Board on Infrastructure and the Constructed Environment; Committee on Facilities Staffing Requirements for Veterans Health Administration. Washington (DC); 2019.
22. Putcha N, Drummond MB, Wise RA, Hansel NN. Comorbidities and chronic obstructive pulmonary disease: prevalence, influence on outcomes, and management. Semin Respir Crit Care Med. 2015;36(4):575–591. doi:10.1055/s-0035-1556063
23. Keenan PS, Normand SL, Lin Z, et al. An administrative claims measure suitable for profiling hospital performance on the basis of 30-day all-cause readmission rates among patients with heart failure. Circ Cardiovasc Qual Outcomes. 2008;1(1):29–37. doi:10.1161/CIRCOUTCOMES.108.802686
24. Krumholz HM, Wang Y, Mattera JA, et al. An administrative claims model suitable for profiling hospital performance based on 30-day mortality rates among patients with an acute myocardial infarction. Circulation. 2006;113(13):1683–1692. doi:10.1161/CIRCULATIONAHA.105.611186
25. Phua J, Kong K, Lee KH, Shen L, Lim TK. Noninvasive ventilation in hypercapnic acute respiratory failure due to chronic obstructive pulmonary disease vs. other conditions: effectiveness and predictors of failure. Intensive Care Med. 2005;31(4):533–539. doi:10.1007/s00134-005-2582-8
26. Lindenauer PK, Stefan MS, Shieh MS, Pekow PS, Rothberg MB, Hill NS. Outcomes associated with invasive and noninvasive ventilation among patients hospitalized with exacerbations of chronic obstructive pulmonary disease. JAMA Intern Med. 2014;174(12):1982–1993. doi:10.1001/jamainternmed.2014.5430
27. Masip J, Peacock WF, Price S, et al. Indications and practical approach to non-invasive ventilation in acute heart failure. Eur Heart J. 2018;39(1):17–25. doi:10.1093/eurheartj/ehx580
28. Hess DR. Noninvasive ventilation for acute respiratory failure. Respir Care. 2013;58(6):950–972. doi:10.4187/respcare.02319
29. Finney LJ, Padmanaban V, Todd S, Ahmed N, Elkin SL, Mallia P. Validity of the diagnosis of pneumonia in hospitalised patients with COPD. ERJ Open Res. 2019;5:110.
30. Sogaard M, Madsen M, Lokke A, Hilberg O, Sorensen HT, Thomsen RW. Incidence and outcomes of patients hospitalized with COPD exacerbation with and without pneumonia. Int J Chron Obstruct Pulmon Dis. 2016;11:455–465. doi:10.2147/COPD.S96179
31. Toft-Petersen AP, Torp-Pedersen C, Weinreich UM, Rasmussen BS. Trends in assisted ventilation and outcome for obstructive pulmonary disease exacerbations. A nationwide study. PLoS One. 2017;12(2):e0171713. doi:10.1371/journal.pone.0171713
32. de Miguel-diez J, Jimenez-Garcia R, Hernandez-Barrera V, et al. Trends in the use and outcomes of mechanical ventilation among patients hospitalized with acute exacerbations of COPD in Spain, 2001 to 2015. J Clin Med. 2019;8(10):1621. doi:10.3390/jcm8101621
33. Stefan MS, Shieh MS, Pekow PS, Hill N, Rothberg MB, Lindenauer PK. Trends in mechanical ventilation among patients hospitalized with acute exacerbations of COPD in the United States, 2001 to 2011. Chest. 2015;147(4):959–968. doi:10.1378/chest.14-1216
34. Digby GC, Keenan SP, Parker CM, et al. Noninvasive ventilation practice patterns for acute respiratory failure in Canadian tertiary care centres: a descriptive analysis. Can Respir J. 2015;22(6):331–340. doi:10.1155/2015/971218
35. VA/DoD Clinical practice guideline for the management of chronic obstructive pulmonary disease. Veterans Health Admistration, Department of Veterans Affairs, and Department of Defense; 2014.
36. Duan J, Wang S, Liu P, et al. Early prediction of noninvasive ventilation failure in COPD patients: derivation, internal validation, and external validation of a simple risk score. Ann Intensive Care. 2019;9(1):108. doi:10.1186/s13613-019-0585-9
37. Doherty MJ, Greenstone MA. Survey of non-invasive ventilation (NIPPV) in patients with acute exacerbations of chronic obstructive pulmonary disease (COPD) in the UK. Thorax. 1998;53(10):863–866. doi:10.1136/thx.53.10.863
38. Maheshwari V, Paioli D, Rothaar R, Hill NS. Utilization of noninvasive ventilation in acute care hospitals: a regional survey. Chest. 2006;129(5):1226–1233. doi:10.1378/chest.129.5.1226
39. Burns KE, Sinuff T, Adhikari NK, et al. Bilevel noninvasive positive pressure ventilation for acute respiratory failure: survey of Ontario practice. Crit Care Med. 2005;33(7):1477–1483. doi:10.1097/01.CCM.0000168042.59035.D8
40. Bierer GB, Soo Hoo GW. Noninvasive ventilation for acute respiratory failure: a national survey of veterans affairs hospitals. Respir Care. 2009;54(10):1313–1320.
41. Fisher KA, Mazor KM, Goff S, et al. Successful use of noninvasive ventilation in chronic obstructive pulmonary disease. How do high-performing hospitals do it? Ann Am Thorac Soc. 2017;14(11):1674–1681. doi:10.1513/AnnalsATS.201612-1005OC
42. Cannon KT, Sarrazin MV, Rosenthal GE, Curtis AE, Thomas KW, Kaldjian LC. Use of mechanical and noninvasive ventilation in black and white chronic obstructive pulmonary disease patients within the veterans administration health care system. Med Care. 2009;47(1):129–133. doi:10.1097/MLR.0b013e3181809150
43. Soler X, Gaio E, Powell FL, et al. High prevalence of obstructive sleep apnea in patients with moderate to severe chronic obstructive pulmonary disease. Ann Am Thorac Soc. 2015;12(8):1219–1225. doi:10.1513/AnnalsATS.201506-379LE
 © 2021 The Author(s). This work is published and licensed by Dove Medical Press Limited. The full terms of this license are available at https://www.dovepress.com/terms.php and incorporate the Creative Commons Attribution - Non Commercial (unported, v3.0) License.
By accessing the work you hereby accept the Terms. Non-commercial uses of the work are permitted without any further permission from Dove Medical Press Limited, provided the work is properly attributed. For permission for commercial use of this work, please see paragraphs 4.2 and 5 of our Terms.
© 2021 The Author(s). This work is published and licensed by Dove Medical Press Limited. The full terms of this license are available at https://www.dovepress.com/terms.php and incorporate the Creative Commons Attribution - Non Commercial (unported, v3.0) License.
By accessing the work you hereby accept the Terms. Non-commercial uses of the work are permitted without any further permission from Dove Medical Press Limited, provided the work is properly attributed. For permission for commercial use of this work, please see paragraphs 4.2 and 5 of our Terms.