")
Back to Archived Journals » International Journal of Clinical Transfusion Medicine » Volume 4
Historical time trends in red blood cell usage in the Netherlands
Authors van Hoeven L, Koopman M, Koffijberg H, Roes K, Janssen M
Received 5 January 2016
Accepted for publication 28 February 2016
Published 27 June 2016 Volume 2016:4 Pages 67—77
DOI https://doi.org/10.2147/IJCTM.S103644
Checked for plagiarism Yes
Review by Single anonymous peer review
Peer reviewer comments 2
Editor who approved publication: Prof. Dr. Cees Th. Smit Sibinga
Loan R van Hoeven,1,2 Maria MW Koopman,3 Hendrik Koffijberg,4 Kit CB Roes,1 Mart P Janssen1,2
1Julius Center for Health Sciences and Primary Care, University Medical Center Utrecht, Utrecht, 2Transfusion Technology Assessment Department, Sanquin Research, 3Department of Transfusion Medicine, Sanquin Blood Bank, Amsterdam, 4Department of Health Technology and Services Research, MIRA Institute for Biomedical Technology and Technical Medicine, University of Twente, Enschede, the Netherlands
Background: While the number of hospitalized patients in Dutch hospitals has increased since 1997, the demand for red blood cell units (RBCs) has simultaneously decreased. This implies a dramatic change in transfusion practice toward fewer blood transfusions on average per patient.
Objectives: In order to explain the RBC reduction, different patient groups (surgical, medical, obstetrical, and specific age groups) were studied retrospectively in relation to RBC use. In addition, the use of combinations of RBCs, fresh frozen plasma, and platelets during a transfusion episode was examined for trends over time.
Materials and methods: Data from the PROTON database, containing information on all transfusions in twelve Dutch hospitals in the period 1996–2005, including corresponding patient data (age, diagnosis, treatment, and hospitalizations) and blood unit data (type, amount, and date) were analyzed.
Results: The proportion of RBCs used for surgical patients declined from 50% in 1996 to 40% in 2005, whereas medical use increased from 47% to 58% (the remaining 2%–3% went to obstetrical patients). Changes were more marked in the higher age groups. Also, a trend was observed toward the use of only one or two RBCs during a transfusion episode rather than three or more. Among surgical patients who received blood, the use of combinations of blood units, as compared to RBCs only, increased from 32% to 39%.
Conclusion: The results suggest a more restrictive transfusion policy for surgical patients as well as an increase in medical indications for transfusion. This fits well with the current focus on more cost-effective transfusion policies.
Keywords: red blood cell usage, combinations of blood units, trends in blood use, medical and surgical patients
Introduction
Over the past 18 years, the national Dutch Blood Supply (Sanquin Blood Supply) has been confronted with a steady decrease in the demand for red blood cell units (RBCs). During the years 1996–2005, the number of issued RBCs decreased by 20%, which amounts to ∼155,000 RBCs. This decrease is even more distinct in the most recent years (9% over 2012–2013) (Figure 1). At the same time, the number of hospitalized patients has increased since 1996 by 44%,1 implying a dramatic change in blood use in clinical practice. Currently, little is known about the exact reasons why and where these changes occur. Insight in the way in which transfusion practice changes is important to discover opportunities for restrictive transfusion policy on the one hand and predict future demands on the other hand. Therefore, in this study, RBC use in specific patient groups (surgical, medical, and obstetrical) was studied for trends: whether these trends could be confined to certain age categories, diagnoses, or procedures and whether they were consistent over time and hospital type (academic vs general). Furthermore, we assessed whether the decrease in blood use was due to a reduction per operation. Finally, we identified trends in the practice of combining RBCs with fresh frozen plasma (FFP) or platelets (PLTs) during a transfusion episode.
 | Figure 1 Total number of red blood cell components issued in the Netherlands over the past 20 years. Note: The time period under consideration in this study is 1996–2005 (marked area). |
Materials and methods
Data selection
A subset of data from the PROTON database was used, including information on blood transfusions in Dutch hospitals in the years 1996–2005.2 This subset was selected from PROTON based on the completeness of information on diagnosis, procedure, and other patient characteristics required for our analyses, resulting in a set of four academic hospitals, seven general (of which four are teaching) hospitals, and one cancer hospital. This selected dataset encompasses information on 187,096 transfusion recipients, who received 1,544,025 blood units (1,117,652 RBCs, 276,304 FFPs, and 150,069 PLTs) during the years 1996–2005, comprising 19% (17% RBCs, 26% FFPs, and 32% PLTs) of total Dutch blood use. Initial ethical approval for the PROTON study overall was obtained from the University Medical Center Utrecht, and additionally the medical ethical committees from the participating hospitals gave ethical approval for the study. Patient consent did not have to be obtained, as this was a retrospective study, and all data was de-identified.
Classification
The diagnoses and procedures were coded according to the International Classification of Diseases (ninth revision, clinical modification) and the Classification of Medical Specialistic Operations system. Based on these codes, transfusions were classified into surgical, obstetrical, and medical. Transfusions were categorized as surgical when given within 2 weeks after surgical admission or were linked to a registered surgical procedure. Obstetrical patients were operationalized as having an obstetrical procedure and/or the main diagnosis “complications of pregnancy, childbirth, and the puerperium”. The medical group includes patients who were neither surgical nor obstetrical. For surgical and obstetrical patients, a transfusion episode was defined as the time from admission to discharge. Since medical patients were not hospitalized in a large number of cases and trends were studied per calendar year, a transfusion episode for medical patients was defined as one calendar year.3 It must be noted that part of the outpatient transfusions (ie, without a hospitalization) could not be linked to patient diagnosis information and could, therefore, not be classified. As most outpatient transfusions would presumably be classified as medical, in this study, the proportion of medical transfusions is likely underestimated. A detailed description of data quality, comprising completeness of transfusions per hospital and both accuracy and occurrence of missing values for diagnoses and procedures, is included in the Supplementary material.
Statistical analysis
The overall trend in RBC use was modeled with time as predictor for number of RBCs, in three different ways, which each provides different information about the trend (Figure 2, upper part). First, a linear regression model was fitted with the outcome total number of RBCs summed over all hospitals per year (M1). M1 provides an estimate of the overall effect of time. Second, a linear regression model was fitted with the outcome RBC use per hospital and included the interaction between time and hospital type (academic/general) (M2). M2 provides an estimate of the average trend per hospital. Third, a multilevel model was fitted with a fixed effect for time and random intercepts and slopes for each individual hospital (M3). M3 accounts for a potential correlation between measurements within a hospital and estimates whether trends are consistent across hospitals.
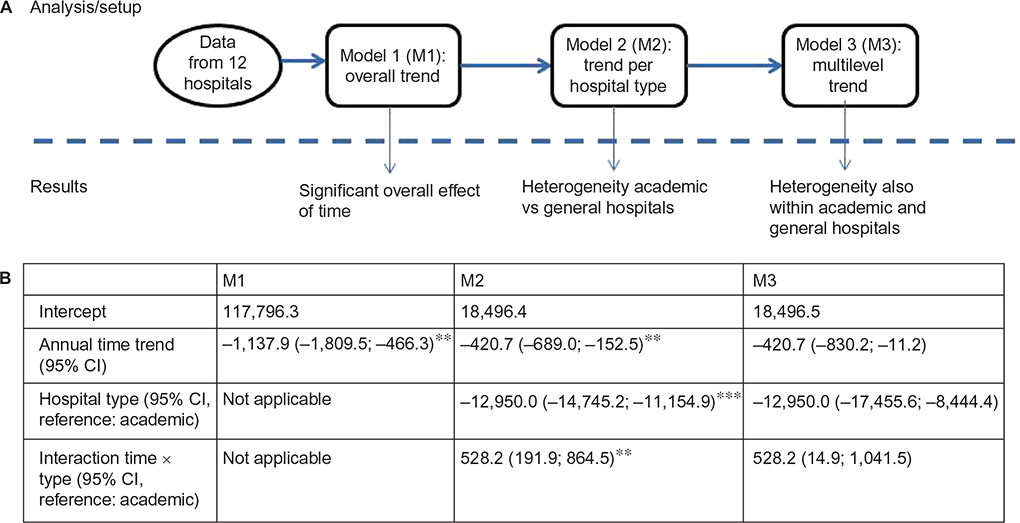 | Figure 2 Three models to analyze time trends in RBC use. Notes: (A) Overview of three models for analyzing the trend over time of number of RBCs, allowing for an overall trend (M1), different trends per hospital type (M2), and different trends for each hospital (M3). The model coefficients are shown in (B) **Significant at P<0.01; ***Significant at P<0.001. Abbreviations: CI, confidence interval; RBC, red blood cell unit. |
In order to reveal changes in the quantity of RBCs used for medical, surgical, and obstetrical patients, the numbers of RBCs per year were plotted against patient age. Changes per year were also identified for the most prevalent main diagnoses and procedures. To investigate changes in the number of transfusions given per transfusion episode, the relative occurrence of 1, 2, 3–4, 5–8, and 9 or more RBC transfusions per episode was plotted per year. Since the decrease in RBC use might also be related to a change in the practice of transfusing combinations of RBCs, FFPs, and PLTs, the relative occurrence of the combinations during a transfusion episode was investigated over time (differences over time were tested using the chi-square test of homogeneity). Moreover, the median number of RBC, FFP, and PLT transfused when given in any combination was visualized over the years. All analyses were performed using R Version 2.15.1.4
Results
The distributions of age and main diagnosis of all hospitalized patients included in this study were, separately for academic and general hospitals, compared to those in the remaining Dutch hospitals (n=82) (one cancer hospital is excluded in this comparison) (Table S1). The similarity of the distributions suggests that the included hospitals are representative for Dutch hospitals, in general, with respect to age and diagnosis. The most notable difference was the percentage of 65+ patients in academic hospitals, which is 26% for hospitals included and 23% for the remaining hospitals, whereas all other differences are limited to one or two percentage points.
Overall trend in RBC use
The overall trend in RBC use in the hospitals studied was downward with a decrease of 1,138 RBCs per year (95% CI –1810; –466; Figure 2: M1). However, the trend over time was different for academic and general hospitals – the interaction coefficient was +528 for general hospitals, indicating an average yearly decrease of 421 for academic hospitals, but an average increase of 108 for general hospitals (Figure 2: M2). The hospital type “cancer hospital” is in the model, but not shown in the results, since it was only one hospital. We repeated the analyses without the cancer hospital; this did not change the direction of the results. The fact that the multilevel model (Figure 2: M3), although showing similar results as M2, is only marginally significant (as illustrated by the wide confidence intervals), indicates that the trend was not consistent across all hospitals.
Surgical, medical, and obstetrical trends
In 1996, more than half of all RBC transfusions (58%) were administered to surgical patients as compared to 40% to medical patients. However, in 2005, this ratio had changed to 47%:50%, with medical transfusions becoming the largest in number (Figure 3A for absolute numbers). This shift is largely located in the general hospitals (surgical:medical, 61%:35% in 1996 and 39%:57% in 2005), whereas in academic hospitals, the usage of both types decreased (Figure 3B and C). Obstetric transfusions represented 3% of all RBC transfusions and remained quite stable both in academic and general hospitals, with a small peak in 2000.
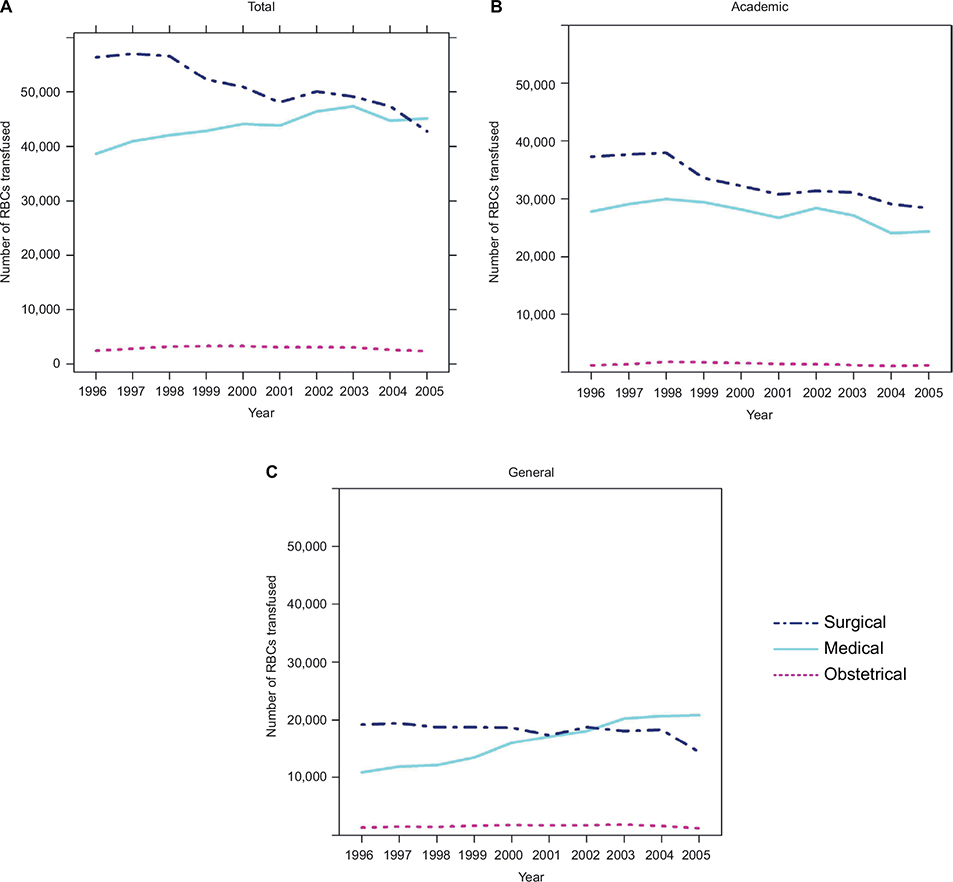 | Figure 3 Trend in total number of RBCs transfused to surgical, medical, and obstetrical patients by year, in (A) all hospitals, (B) academic hospitals, and (C) general hospitals. Abbreviation: RBCs, red blood cell units. |
Distribution over age
For surgical RBC use, the decrease was present over almost the complete age range (except for the very young and very old); the absolute decrease was largest for the 65–85 year olds (Figure 4A). For medical transfusions (Figure 4B), there was a shift over time to the right, indicating an increased RBC use in the higher age groups (55–90 years). For obstetrical patients, transfusions also drifted slightly toward older obstetrical patients (Figure 4C).
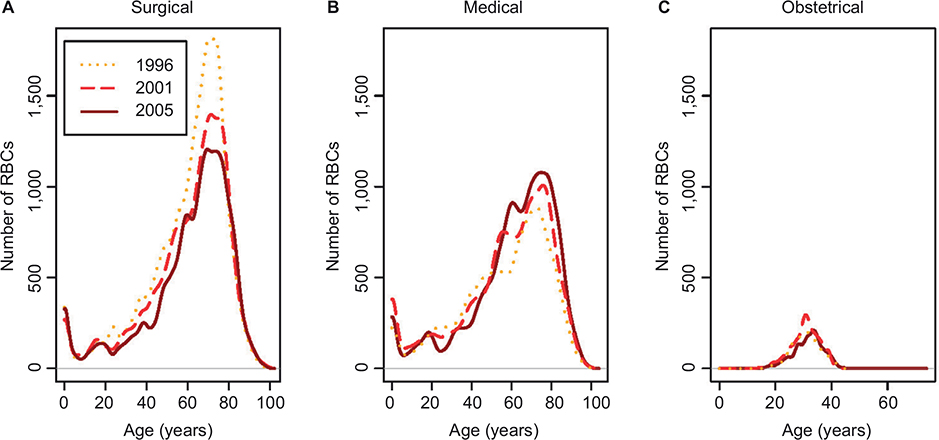 | Figure 4 Trend in age distribution of RBC recipients for (A) surgical, (B) medical, and (C) obstetrical patients in the years 1996, 2001, and 2005. Abbreviation: RBC, red blood cell unit. |
Trends per diagnosis and procedure
RBC use decreased over time for cardiovascular diagnoses and procedures (–13% for medical and –36% for surgical use) and for surgery on blood vessels (–36%) and surgery on the musculoskeletal system and connective tissue (–27%). In contrast, an increase in RBC use was observed for diseases of blood and blood-forming organs (+66%), neoplasms (+17%), and digestive system (+15%) (Table S2). Neoplasms accounted for the largest medical use of RBCs each year, whereas the second largest source of medical blood use changed from cardiovascular diseases (1996) to diseases of blood and blood-forming organs (2005). For surgery-related RBC transfusions, cardiovascular use decreased as well, whereas diseases of the digestive system became more prominent with an increase from 19% (1996) to 25% (2005) of all surgical RBCs used.
Dose of RBCs per transfusion episode
The most likely number of transfusions per episode was two (2005: 36% for surgical patients, 35% for medical patients, and 44% for obstetrical patients; Figures 5A–C). For both surgical and obstetrical patients, the use of one unit per transfusion episode increased over time (with 4% and 8% points). For medical patients, over time, the use of two units increased, whereas the use of more than three units decreased. In contrast, for obstetrical transfusion recipients, the likelihood of receiving nine or more units increased from 2% (1996) to 4% (2005).
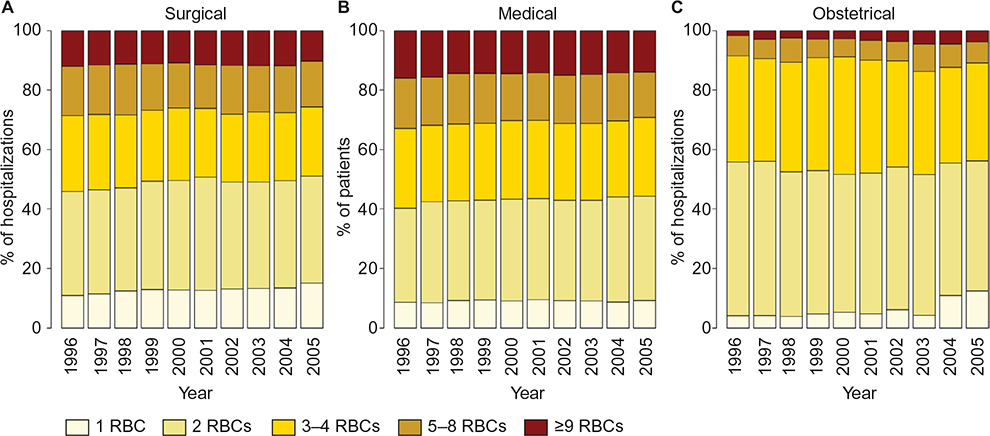 | Figure 5 Trend in transfusion dose per transfusion episode for (A) surgical, (B) medical, and (C) obstetrical patients. Abbreviation: RBCs, red blood cell units. |
Occurrence and quantity of combinations of transfused units
During most transfusion episodes, only RBC products were given. Over time, however, combinations of RBC, FFP, and PLT increased from 32% to 39% of all surgical hospitalizations (Figure S1A). For medical patients, the proportion of transfusion episodes with only RBCs remained quite stable over time, whereas combinations of PLTs only and RBC and PLT increased (Figure S1B). For obstetrical patients, no consistent trends were observed; notably in 2003, the proportion of hospitalizations with PLT only was especially high, and the proportion of RBC only was relatively low; but this reversed in 2005 (Figure S1C).
As shown in Figure S2, patients who received a combination of different types of blood units also received more units in total. For most combinations, the median number of blood units remained quite stable over time. For surgical patients, however, the median number of PLTs in the combination of RBC and PLT increased (Figure S2A). Also for both surgical and medical patients, combinations of RBC, FFP, and PLT had a lower median total number of blood products over time, primarily due to a decrease in the number of RBCs (Figure S2A and B). For obstetrical patients, the combination of RBC, FFP, and PLT showed an increase in median number of products for all types, but this trend was not consistent (Figure S2C).
Discussion
In light of the steadily decreasing demand for RBCs in the Netherlands, we examined the changes in blood use for different patient groups historically from 1996 to 2005. Our selection of hospitals included was, when distinguishing between academic and general hospitals, comparable to the Dutch hospitals that are not included. Over the time period studied, average RBC use per hospital decreased by ∼2.3% per year (equivalent to 421 RBCs). This trend, however, was not consistent across hospitals: Whereas in academic hospitals, a large absolute decrease in RBC use was found, in general hospitals, an average increase was observed (mostly due to an increase in the teaching hospitals). This might be an artifact of the particular selection of hospitals in our sample caused by fusion of hospitals, changing division of tasks, or possibly increased registration of transfusions, but it could also reflect a true increasing trend in general hospitals perhaps because of their older patient population and the centralization of complex care. Complex care (eg, oncological treatments) is increasingly centralized in specialized hospitals. Consequently, the initial treatment starts in the academic hospitals, after which the remaining care is transferred to a general hospital. Improved skills of clinicians due to specialization, for example, in complex surgery likely resulted in a decreased surgical RBC use in academic hospitals, whereas the increasing medical burden for general hospitals could explain the increase in medical RBCs. Time trends also differed between different areas of clinical usage. For surgical patients aged 65–85 years, the absolute number of RBCs transfused consistently declined during the 10-year time period, especially for surgery on the cardiovascular system, blood vessels, and musculoskeletal system and connective tissue. This surgical reduction can be attributed to developments in patient blood management strategies, including cell-saving techniques and noninvasive surgical procedures. Furthermore, the decline was likely to be stimulated in 2004 by the introduction in the Netherlands of new blood transfusion guidelines using hemoglobin level as a transfusion trigger (4-5-6-flexinorm).5 Moreover, the use of RBCs only during a surgical hospitalization decreased relative to combinations of multiple product types. This might be explained by the increased PLT use and indicates that patients who would previously have received one RBC are instead not transfused at all. In contrast, medical use of RBCs has been increasing, reflecting the aging of the population. Since the year 2004, medical use accounts for the majority of RBC transfusions, mainly due to an increased use for neoplasms, diseases in blood and blood-forming organs, and the digestive system (of which the latter two also became more prominent over time relative to other diagnoses). Not surprisingly, the proportion of RBCs used for obstetrical patients remained quite stable; postpartum bleedings are less suitable for patient management strategies as they are nonelective by nature. The slight shift toward higher age in obstetrics might be explained by the fact that the average age of the mother at delivery has increased from 30.32 years in 1996 to 31.06 years in 2005.6
A common trend in the surgical, medical, and obstetrical groups was that an increasing proportion of transfusion recipients received a smaller number of RBCs. We could not calculate the proportion of transfused patients (ie, the “transfusion rate”) as only information on transfusion recipients was available. However, we know that nationally the number of RBCs per inhabitant is continuously decreasing from 38 per 1,000 inhabitants in 2001 to 35 per 1,000 inhabitants in 2005 and 27 per 1,000 inhabitants in 2013.7,8 Moreover, the total number of hospitalized patients in the Netherlands increased, which, by increasing the denominator, leads to a lower transfusion rate. Accordingly, for most combinations, the median number of blood units per episode was stable or decreased over time. The transfusion rate would be useful to investigate in further studies, as it can also be used as a quality metric that is fed back to physicians, leading to less blood being transfused.9 Moreover, collecting (aggregated) information on nontransfused patients adds to a more complete view of transfusion determinants.
Internationally, similar patterns in blood use have been reported; studies in the North of England, Northern Ireland, and South Australia identified medical patients as the main users of RBCs. Even though the exact numbers might not be completely comparable (because of differences between countries in case mix of patients as well as differences in coding systems and classification of patients), common trends are observable. In roughly the same time period as the present study (1999–2009), the total RBC use in the North of England also dropped by 20%, due to a reduction in blood use per procedure.10 In the same direction as the Dutch trends, North of England’s RBC use in the years 2000–2009 changed from 41% (surgical):52% (medical) to 29% (surgical):64% (medical).10,11 These changes were observed only in patients aged between 50 years and 80 years, whereas in the Netherlands a decrease in surgical and medical use was observed also in the younger age groups. In South Australia, medical transfusions in 2006 comprised the largest use of RBCs with 48% (the Netherlands: 50% in 2005), with 46% to surgical patients, and 3.4% of RBC use was obstetrical, almost equal to the Netherlands.12 Accordingly, South Australia found high RBC use for medical diagnoses, such as hematology, medical oncology, and gastroenterology. In Northern Ireland, even 71% of the transfused were medical patients in 2010, leading to the conclusion that “with a likely plateau of efficiency having been reached in the surgical use of RBCs understanding the ‘medical use’ of RBCs is increasingly imperative”.13 In that study, surgical patients most likely received a single unit per transfusion episode (for comparison, in our present study, this was two units), whereas medical patients, especially if being treated for cancer, were more likely to receive two units, as in the present study. In Germany, the surgical use (in this case also including intensive care and trauma patients) and medical use in a typical tertiary care hospital in 2008 were 58% and 42%, respectively, in-line with the ratio in Dutch academic hospitals. In contrast to the Netherlands, RBC use increased between 2000 and 2009 by 10%.14 Finland used 55% of RBCs for surgical patients (including obstetrical surgery) and 45% for medical patients in 2006.15 Differences in age distributions of patient populations could explain part of the differences between countries in RBC use, as both the surgical:medical ratio and the number of units transfused per episode is higher in the older age groups.10,14–16 In addition, transfusion habits and hospital cultures lead to differences in use within both hospitals and countries (eg, already 70% of the total variation in RBC use could be explained by the hospital effect in cardiac procedures17). Still these international numbers, in conjunction with innovations in the areas of surgery, medication and alternative products suggest that a medical:surgical ratio of 70:30 may be expected in the future. Insight into these trends and their impact on the demand for RBCs to be expected is important, as a reduced need for RBCs might negatively affect the availability and cost effectiveness of blood products when the need for blood does not match investments of the blood bank in personnel and donors.
Conclusion
Over the period 1996–2005, RBC use in the Netherlands decreased, especially in the academic centers and for surgical patients. Transfusion recipients tended to receive fewer RBCs during a transfusion episode. For surgical recipients, transfusing combinations of blood products instead of only RBCs became more common over time. Similar to other countries, the data suggest a consistent trend toward conservative blood use for surgical patients, which is in-line with the current focus on a restrictive, cost-effective transfusion policy. New data-warehouse initiatives should consider collecting detailed clinical information on transfusion recipients that could clarify blood use, such as hemoglobin status, comorbidities, and use of medication, and collecting aggregated information on nontransfused patients in order to calculate the transfusion rate.
Acknowledgments
This study was funded by the Sanquin Blood Supply (PPOC-11-042).
Author contributions
All authors contributed toward the study design or data analysis and designing the models used for data analysis, interpreting the findings, critical appraisal of previous draft versions and the final version of the paper, drafting and critically revising the paper, gave final approval of the version to be published, and agree to be accountable for all aspects of the work.
Disclosure
The authors report no conflicts of interest in this work.
References
Statistics Netherlands (CBS) [webpage on the Internet]. Ziekenhuisopnamen; herkomst, geslacht en leeftijd [Hospitalizations; origin, gender and age]. Available from: http://statline.cbs.nl/StatWeb/publication/?VW=T&DM=SLNL&PA=71566NED&D1=0-1&D2=0&D3=0&D4=0&D5=l&D6=a&HD=140311-1454&HDR=G4,G2,T,G5&STB=G1,G3&CHARTTYPE=1. Accessed November 26, 2014. Dutch. | ||
Borkent-Raven BA, Janssen MP, Van Der Poel CL, Schaasberg WP, Bonsel GJ, Van Hout BA. The PROTON study: profiles of blood product transfusion recipients in the netherlands. Vox Sang. 2010;99(1):54–64. | ||
Biggin K, Warner P, Prescott R, McClelland B. REVIEWS: a review of methods used in comprehensive, descriptive studies that relate red blood cell transfusion to clinical data. Transfusion. 2010;50(3):711–718. | ||
R Core Team [home page on the Internet]. R: A Language and Environment for Statistical Computing. R Foundation for Statistical Computing, Vienna, Austria; 2012. Available from: http://www.R-project.org/. Accessed April 22, 2016. | ||
Kwaliteitsinstituut voor de Gezondheidszorg CBO (CBO). Richtlijn Bloedtransfusie [Blood Transfusion Guideline]. Available from: http://www.diliguide.nl/document/2903. Accessed May 24, 2016. Dutch. | ||
Paone G, Brewer R, Likosky DS, et al. Membership of the Michigan Society of Thoracic and Cardiovascular Surgeons. Transfusion rate as a quality metric: is blood conservation a learnable skill? Ann Thorac Surg. 2013;96(4):1279–1286. | ||
Trends and Observations on the Collection, Testing and Use of Blood and Blood Components in Europe – 2001–2011 Report; Directorate for the Quality of Medicines & HealthCare of the Council of Europe (EDQM). Strasbourg: CD-P-TS; 2014. Available from: https://www.edqm.eu/sites/default/files/trends_and_observations_on_the_collection_testing_and_use_of_blood_and_blood_components_in_europe_20.pdf. Accessed May 23, 2016. | ||
The Collection, Testing and Use of Blood and Blood Components in Europe – 2013 Report; Directorate for the Quality of Medicines & HealthCare of the Council of Europe (EDQM). Strasbourg: CD-P-TS; 2016. In preparation. | ||
StatLine [webpage on the Internet]. Statistics Netherlands: Maternal Age at Birth Over Time. Available from: http://statline.cbs.nl/Statweb/publication/?DM=SLNL&PA=37744NED&D1=0&D2=0-35&D3=46-55&VW=T. Accessed February 2, 2016. | ||
Tinegate H, Chattree S, Iqbal A, et al. Northern Regional Transfusion Committee. Ten-year pattern of red blood cell use in the North of England. Transfusion. 2013;53(3):483–489. | ||
Wallis JP, Wells AW, Chapman CE. Changing indications for red cell transfusion from 2000 to 2004 in the north of England. Transfus Med. 2006;16(6):411–417. | ||
Allden RL, Sinha R, Roxby DJ, Ireland S, Hakendorf P, Robinson KL. Red alert – a new perspective on patterns of blood use in the South Australian public sector. Aust Health Rev. 2011;35(3):327–333. | ||
Barr PJ, Donnelly M, Morris K, Parker M, Cardwell C, Bailie KE. The epidemiology of red cell transfusion. Vox Sang. 2010;99(3):239–250. | ||
Seifried E, Klueter H, Weidmann C, et al. How much blood is needed? Vox Sang. 2011;100(1):10–21. | ||
Ali A, Auvinen M-K, Rautonen J. Blood donors and blood collection: the aging population poses a global challenge for blood services. Transfusion. 2010;50(3):584–588. | ||
Schramm W, Berger K. Influencing blood usage in Germany: what is optimal use? Transfusion. 2007;47(2 Suppl):152S–154S. | ||
Jin R, Zelinka ES, McDonald J, et al. Providence Health & Services Cardiovascular Disease Study Group. Effect of hospital culture on blood transfusion in cardiac procedures. Ann Thorac Surg. 2013;95(4):1269–1274. |
Supplementary materials
Data quality
Selection of hospitals from PROTON
Of the 20 hospitals included in the PROTON database, twelve hospitals were included in the present study. Reasons for excluding hospitals were as follows: the data were not covering the entire study period, increased registration in the middle of the study period due to switch of registration system, and fusion of two hospitals in the middle of the study period. Moreover, two hospitals were excluded in part of the analyses because some of the information required was lacking.
Completeness of transfusions per hospital
The completeness in terms of number of transfusions registered in PROTON was checked by comparing the number of transfused red blood cell units (RBCs) per hospital per year with the number of products issued by Sanquin Blood Supply. The number of RBCs issued per year per hospital could be checked for only a small selection of hospitals and years, and normally deviates approximately 5% due to the spilling of a small amount of products. When data on blood products issued by the blood bank were not available, the hospital data were visually checked on unlikely changes over time within one hospital, and since no inconsistencies were observed, the data are likely to accurately reflect the majority of blood use. For one hospital, transfusion data for the last 8 months of 2005 had to be imputed because data were not available; since the preceding years showed no consistent seasonal patterns, a simple weighting method was used. Another hospital switched to a new registration system during the study period, resulting in a gap of data of 1.5 months (and relatively many transfusions in the following months). This resulted in a slight underestimation of the total number of transfusions in 2004, affecting only the analysis of absolute numbers of blood products.
Completeness of diagnoses and procedures
For 12.7% of all transfusions, the International Classification of Diseases diagnosis code was missing because it could not be matched with data from the National Medical Registry (NMR), varying between hospitals from 2% to 26% and from year-to-year with 11%–16%. Per year, per hospital, missingness varied from 0% to 42% (most missing data occurred in small hospitals, whereas academic hospitals were most complete). Considering only RBC transfusions, this was 13.5% in total. It is expected that the variable “procedure” has the same amount of missing data because up to and including 2004 it was obligatory to register them both in the NMR. Transfusions with both unknown diagnosis and procedure that were not associated with surgery (9% of all transfusions) were excluded from the analyses of medical, surgical, and obstetrical patients since classification was not possible.
Accuracy of hospitalization data
The accuracy of the NMR data was investigated in 2001 in order to gain insight into the reliability of these data. The administrative person data and hospitalization and discharge data of the hospitals administration corresponded to the NMR data in 99% of all cases. For main diagnosis, the agreement was 84%, and for procedures, the agreement was 92%.1
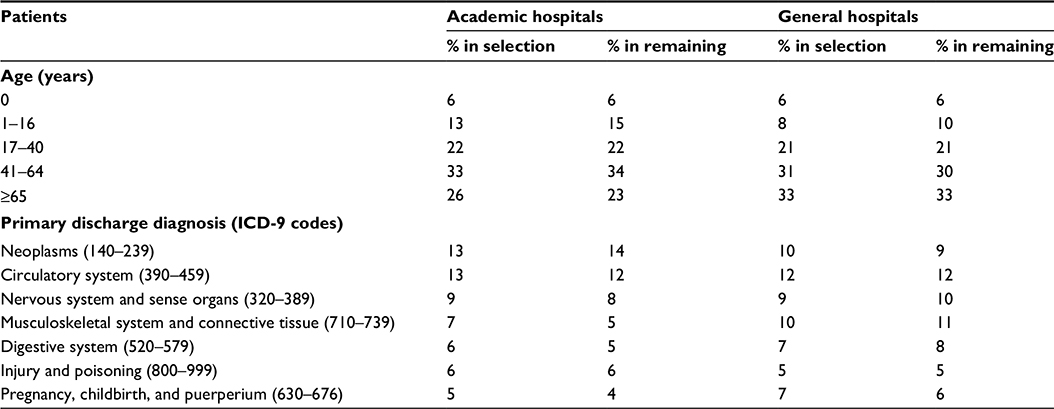 | Table S1 Baseline patient characteristics of included (n=11) and remaining (n=82) academic and general hospitals in the Netherlands in 1996–2005 Abbreviation: ICD-9, International Classification of Diseases, ninth revision. |
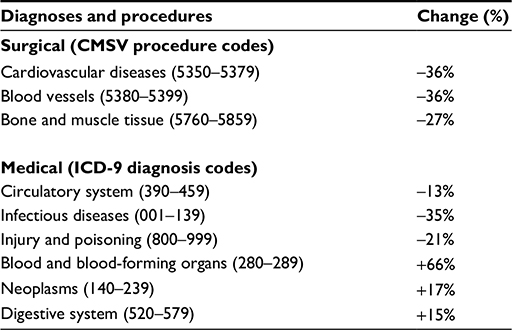 | Table S2 Change (%) in the number of transfused RBCs from 1996 to 2005 for various diagnoses and procedures Abbreviations: CMSV, Classification of Medical Specialistic Operations; ICD-9, International Classification of Diseases, ninth revision; RBCs, red blood cell units. |
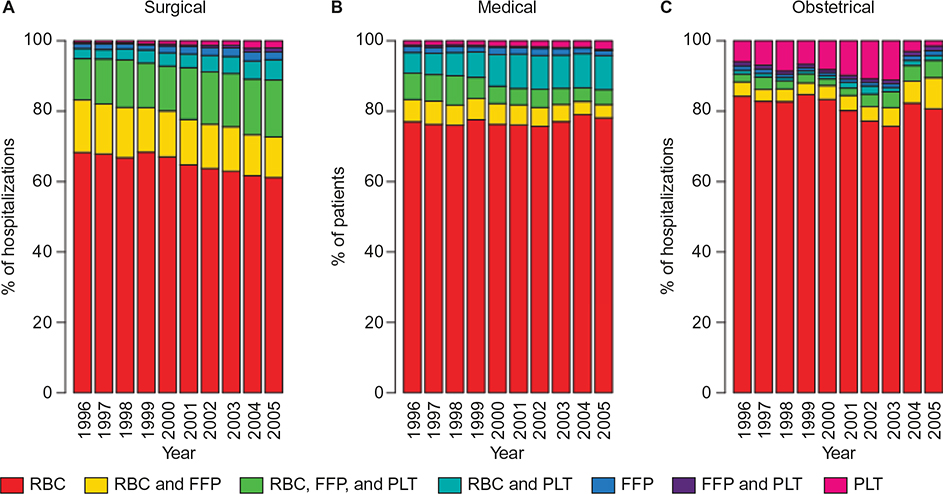 | Figure S1 Use of combinations per transfusion episode in (A) surgical, (B) medical, and (C) obstetrical patients by year. Abbreviations: FFP, fresh frozen plasma; PLT, platelet; RBC, red blood cell unit. |
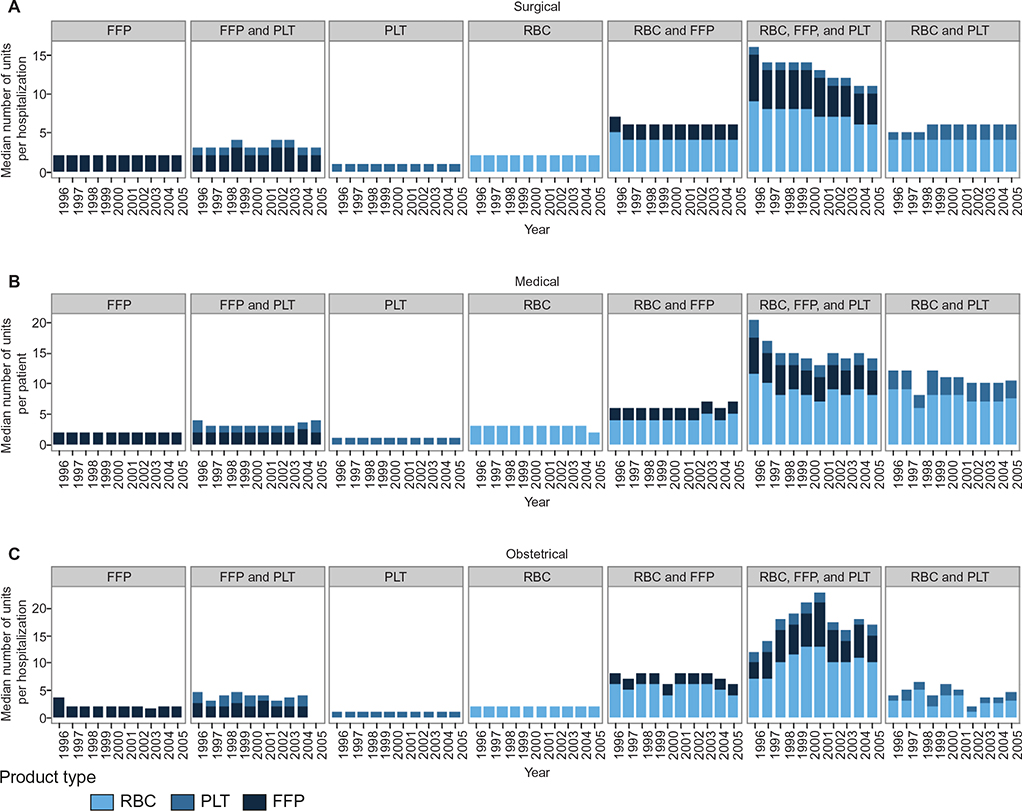 | Figure S2 Median number of blood products per transfusion episode, given in a combination for (A) surgical, (B) medical, and (C) obstetrical patients. Abbreviations: FFP, fresh frozen plasma; PLT, platelet; RBC, red blood cell unit. |
Reference
Paas RA, Veenhuizen CW. Onderzoek naar de betrouwbaarheid van de LMR. Rapportage voor de ziekenhuizen [Research on the reliability of the National Medical Registry. Report for hospitals]. Utrecht: Prismant; 2002. Dutch. |
 © 2016 The Author(s). This work is published and licensed by Dove Medical Press Limited. The full terms of this license are available at https://www.dovepress.com/terms.php and incorporate the Creative Commons Attribution - Non Commercial (unported, v3.0) License.
By accessing the work you hereby accept the Terms. Non-commercial uses of the work are permitted without any further permission from Dove Medical Press Limited, provided the work is properly attributed. For permission for commercial use of this work, please see paragraphs 4.2 and 5 of our Terms.
© 2016 The Author(s). This work is published and licensed by Dove Medical Press Limited. The full terms of this license are available at https://www.dovepress.com/terms.php and incorporate the Creative Commons Attribution - Non Commercial (unported, v3.0) License.
By accessing the work you hereby accept the Terms. Non-commercial uses of the work are permitted without any further permission from Dove Medical Press Limited, provided the work is properly attributed. For permission for commercial use of this work, please see paragraphs 4.2 and 5 of our Terms.