")
Back to Journals » Research and Reports in Urology » Volume 11
Histological changes of the peripheral zone in small and large prostates and possible clinical implications
Authors Guzman JA, Sharma P , Smith LA, Buie JD, de Riese WT
Received 18 September 2018
Accepted for publication 24 January 2019
Published 21 March 2019 Volume 2019:11 Pages 77—81
DOI https://doi.org/10.2147/RRU.S182781
Checked for plagiarism Yes
Review by Single anonymous peer review
Peer reviewer comments 3
Editor who approved publication: Dr Jan Colli
Jonathan A Guzman,1 Pranav Sharma,1 Lisa A Smith,1 John D Buie,2 Werner T de Riese1
1Department of Urology, Texas Tech University Health Sciences Center, Lubbock, TX, USA; 2Department of Pathology, Texas Tech University Health Sciences Center, Lubbock, TX, USA
Introduction: It is well documented in literature that most prostate carcinomas (PCa) arise in the peripheral zone (PZ). Additionally, an inverse relationship between prostate size and the incidence of PCa has been demonstrated in recent studies. However, little is known about gland distribution in the peripheral zone of larger prostates compared to smaller prostates. In this study, we examined the histo-anatomical gland distribution within the peripheral zone in small and large prostates and discuss possible clinical implications.
Methods: A semi-quantitative analysis of gland density and capsule thickness was performed using light microscopy on 10 large (≥80 g) prostate specimens and 10 small (
Results: Large prostates possessed a significantly lower mean gland count per field compared to small prostates (10.34±4.15, n=50 vs 18.00±5.41, n=50; t=8.16, df=49, P<0.001). Additionally, large prostates showed a significantly higher average capsule thickness in millimeters compared to small prostates (1.80 mm, ±1.12 mm, n=30 vs 0.90 mm, ±0.56, n=30; t=8.16, df=49, P<0.001).
Conclusion: The results demonstrate that prostate hypertrophy leads to both decreased gland density in the peripheral zone and increased capsule thickness, suggesting that growth-induced expansion of the prostate against its capsule leads to compression-induced atrophy and fibrosis of glandular tissue within the peripheral zone (PZ). A decrease in gland density within the PZ may have clinical implications shedding light, for instance, on the reduction in PCa incidence in patients with large prostates as compared to smaller prostates, a phenomenon well documented in the literature.
Keywords: prostate, adenocarcinoma, prostatic hyperplasia, peripheral zone
Introduction
The interaction between benign prostatic hyperplasia (BPH) and prostate cancer (PCa), the two common diseases of the prostate, are not well understood.1,2 The prevalence of clinical BPH is fairly uniform worldwide and also consistently age related.1 Symptomatic BPH affects about 20% of men in the age group of 50–59 years, 30% of men in the age group of 60–69 years and 40% in the age group of 70 years and older.3 Prostate cancer is also a significant burden in the health care of older men; it is the most commonly diagnosed non-skin malignancy, accounting for 21% of newly diagnosed cancers in males in 2016, equivalent to 180,800 new cases and causing >26,000 deaths in 2016.4
Though the interplay between BPH and PCa remains not well understood, urologists have questioned the possible associations between these two most common diseases of the prostate. Over the last decades, and in particular since the wide-spread use of PSA screening, numerous clinical studies have shown an inverse association between prostate (BPH) volume and the incidence of prostate cancer.2,5–16 Furthermore, it is well documented in literature that 80% of PCa arises in the peripheral zone (PZ) of the prostate, whereas BPH is caused by growth of the transition zone (TZ).17 Experienced urologists performing surgical treatment of large BPH glands are familiar with the phenomenon that the continuous growth of the TZ compresses the PZ and thus creates the so-called surgical capsule of the prostate, which enables easy enucleation of the BPH component and leaving the surgical capsule behind; the existence of a prostate capsule is well documented despite its incomplete coverage of the prostate from an anterior and anteriolateral defect at the apex.18 However, despite extensive literature search, we were unable to encounter any relevant publications dealing with the histo-anatomical findings of the compressed PZ in large prostates and, in particular, comparing findings to smaller prostates. This comparison may provide possible explanations for the observed lower incidence of PCa in larger prostates. In this context, we performed a comparative histo-anatomical study analyzing the TZ and PZ in small and large prostates.
Methods
Approval from our institutional review board (IRB approval # L17-050) was obtained prior to this study; it was conducted in accordance with the Declaration of Helsinki, and all participants provided written informed consent. A cohort of 20 men was assessed in a prospective fashion in the years between 2010 and 2016 that underwent radical prostatectomy at Texas Tech University Health Sciences Center (TTUHSC). Cases were identified and assigned to two groups based on prostate size: large (≥80 g) and small (<30 g). None of the prostate specimens were from patients treated with androgen-depriving therapy including, but not limited to, finasteride, leuprolide, or flutamide.
Only prostates processed with consistent coronal cuts and inking technique were entered into this study in order to allow reproducible positioning of the slides within the prostate glands. H&E stained slides of the prostate specimens from the posterior prostate, standardized to include the area between the 4 o’clock and 8 o’clock position along the equator region, were obtained and examined by light microscopy using a total magnification of 100 ×. Figure 1 details the region examined under light microscopy. Areas presenting prostate cancer were excluded, only regions identified with BPH tissue and without any malignancy were included in this study.
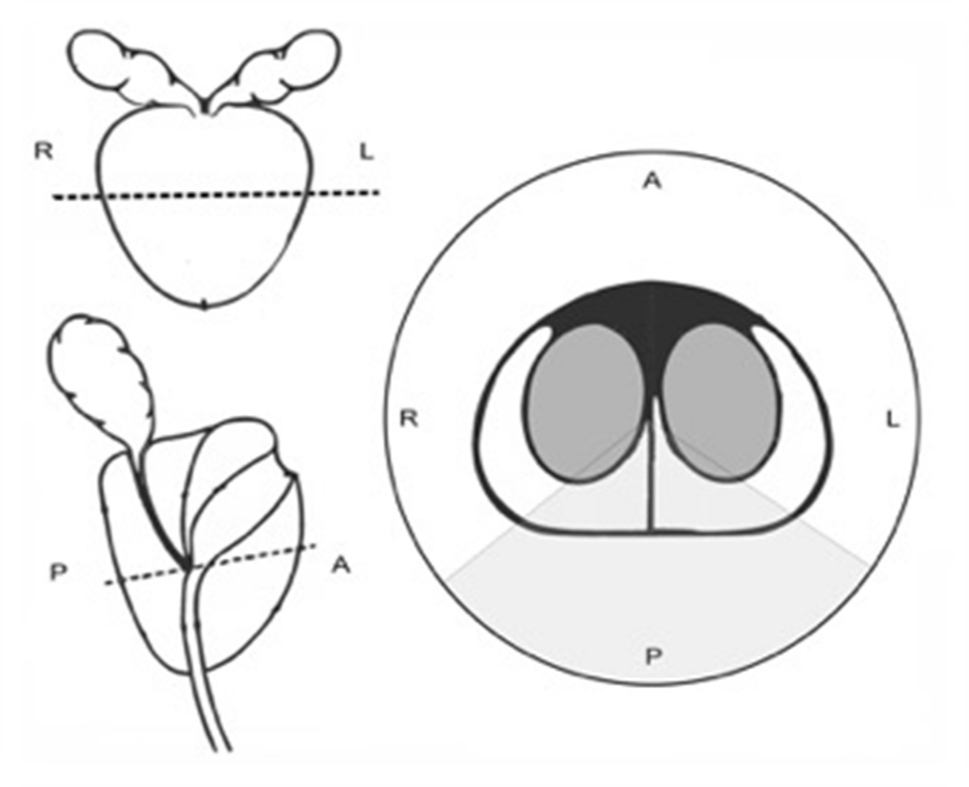 | Figure 1 Schematic representation of the prostate. Notes: On the two images on the left, the dashed lines indicate the equator region of the prostate from which slides were taken. The image on the right shows a typical cross-section at the equator region; gray shaded area indicates the 4 o’clock to 8 o’clock position examined under microscopy. A, anterior; P, posterior, R, right; L, left. |
Gland counts were performed on five random microfields within the area described above. Areas of PCa on each slide, if present, were carefully identified, marked and excluded from the count. Capsule thickness, the distance between the inked free outer margin of the prostate to the nearest normal gland, was also measured in millimeters on three different microfields per specimen. Thus, a total of 50 microfields and 30 microfields of each of the two groups were analyzed for gland count and capsule thickness, respectively. A two-sample t-test was then used to compare the mean mass and mean gland count between the large and small prostate groups.
The biometric specifics of these cases such as total prostate volume, patients age, gleason score, pre-operative PSA levels, etc. are listed in Tables 1 and 2.
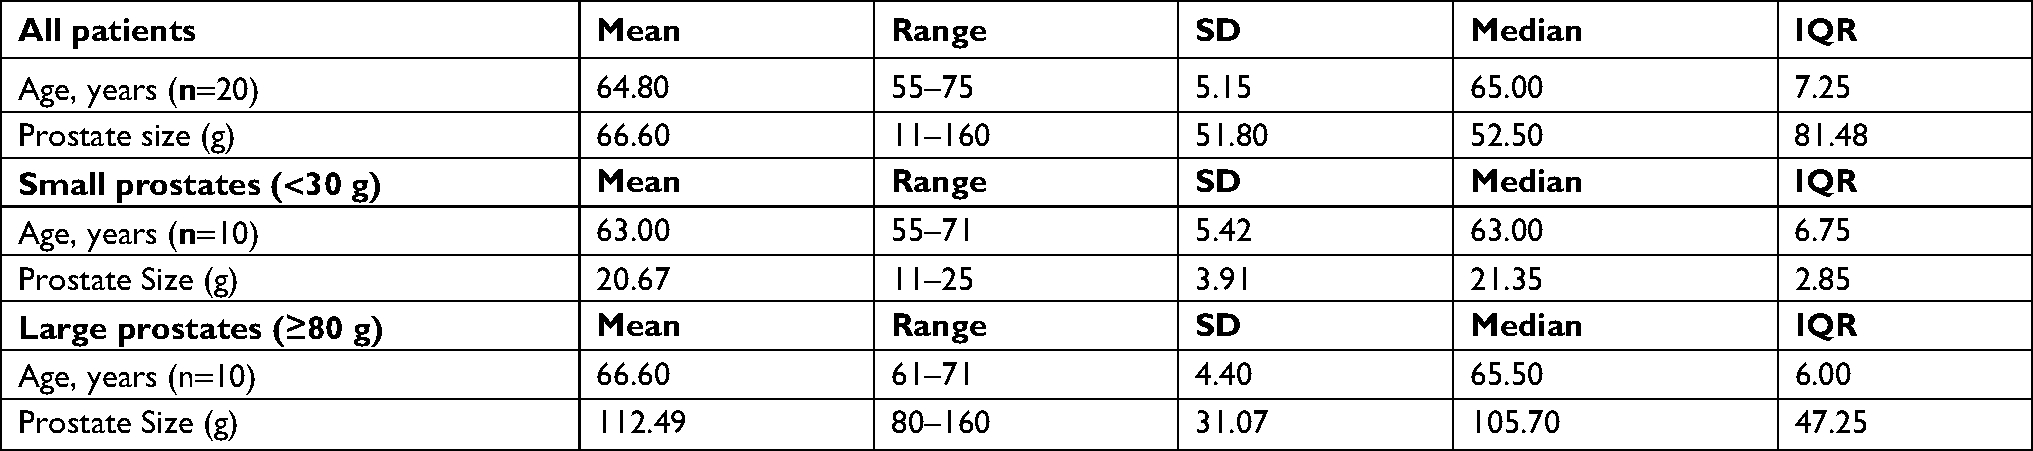 | Table 1 Patient demographics |
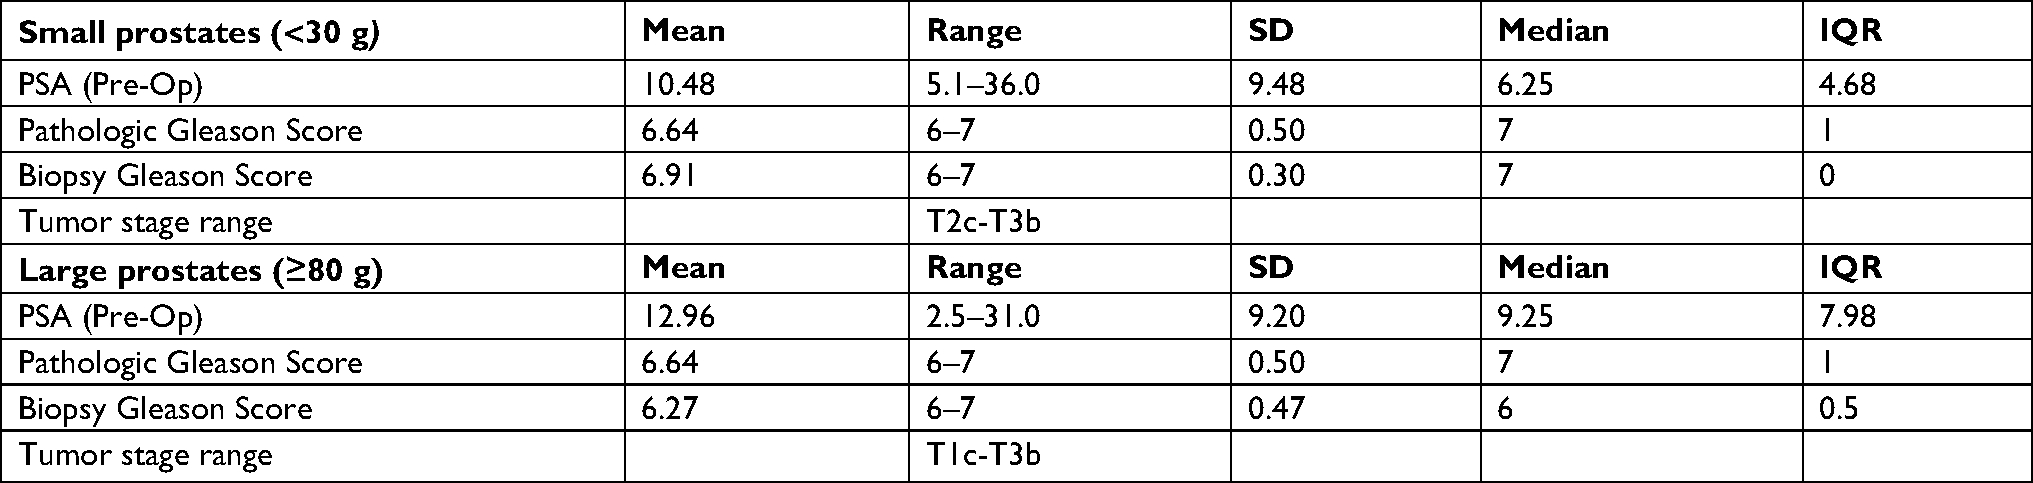 | Table 2 Prostate data Abbreviation: PSA, prostate specific antigen. |
Results
Analysis of the measurements demonstrated both a lower mean gland count and a higher capsule thickness in large prostates compared to small prostates. Prostates ≥80 g in mass showed a mean gland count per microfield of 10.34 (±4.153, n=50) and a mean capsule thickness of 1.467 mm (±0.547 mm, n=30). In contrast, prostates <30 g showed a mean gland count per microfield of 18.00 (±5.41, n=50) and a mean capsule thickness of 0.883 mm (±0.439 mm, n=30). These differences in mean gland count and mean capsule thickness were found to be significant, as shown in Tables 3 and 4.
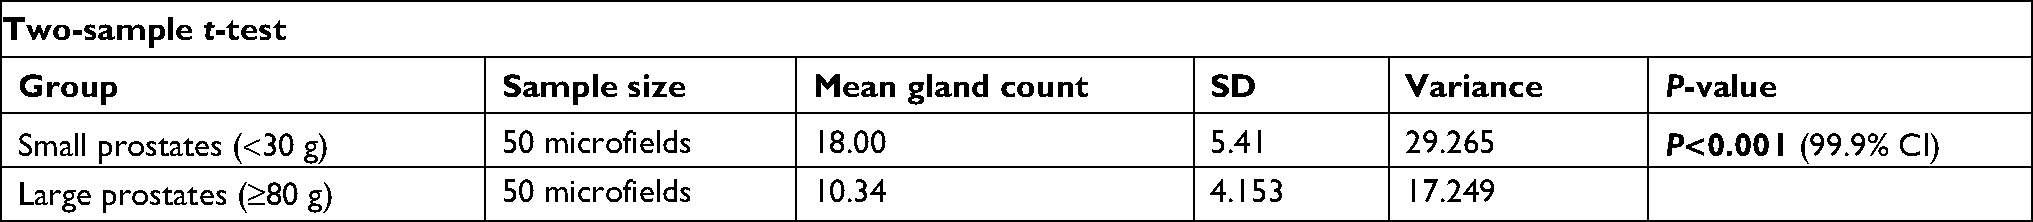 | Table 3 Comparison of mean gland density between small (n=10) and large (n=10) prostates Note: Statistically significant P-value shown in bold. |
 | Table 4 Comparison of mean capsule thickness between small (n=10) and large (n=10) prostates Note: Statistically significant P-value shown in bold. |
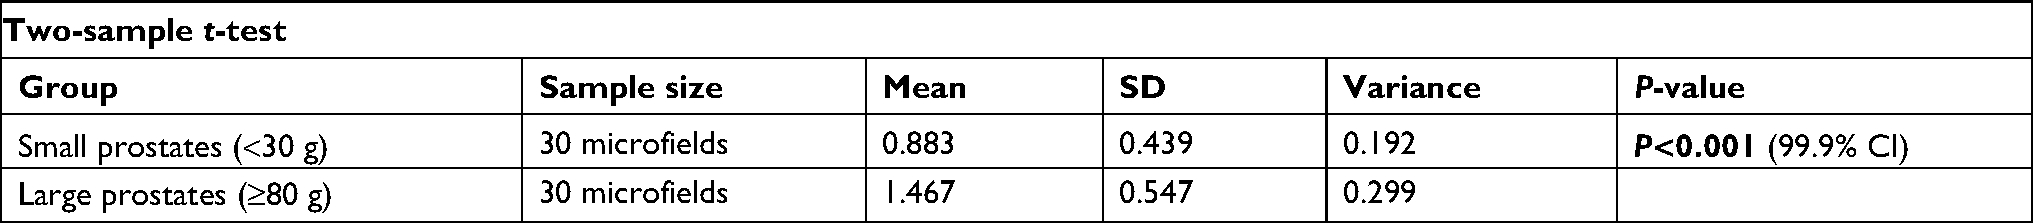
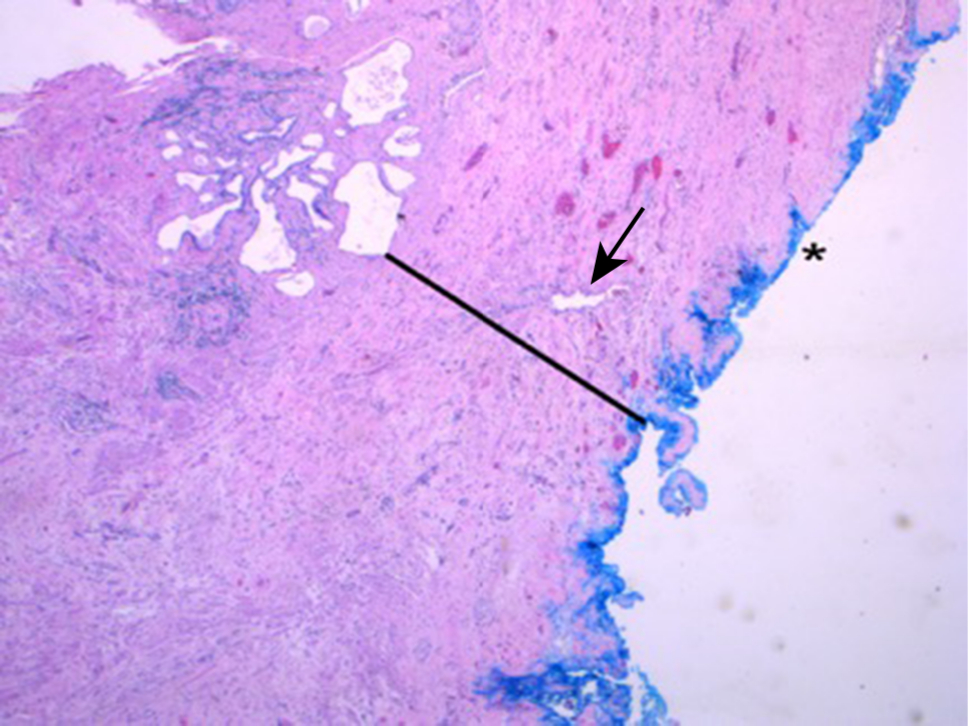
Figure 2 shows a representative H&E slide of a large prostate. Light microscopy reveaed a thicker collagen-rich capsule with only a few atrophic glands left close to the transition zone (TZ). The PZ appears to have been compressed against the true prostatic capsule, contributing to the so-called surgical capsule described in textbooks outlining the Mellin (BPH-prostatectomy) procedure. In contrast, Figure 3 shows, at the same magnification, a representative H&E slide of a small prostate, demonstrating a thinner capsule with a higher density of glandular tissue.
 | Figure 2 H&E staining. Notes: An example of a large prostate (100 g) viewed at magnification × 50. The external, posterior margin is inked and marked with an asterisk (*). The arrow is indicating an atrophic gland within the extended fibrosis layer (black line). |
 | Figure 3 H&E staining. Notes: This slide shows an example of a small prostate (24 g) viewed at 50 × magnification. The external, posterior margin is also inked and marked with an asterisk (*). In contrast to Figure 1, a decent number of glands (arrows) are present and easily visible in the peripheral zone (PZ) close to the margin, with a thin capsule (black line) visible. |
Discussion
Numerous clinical studies have demonstrated an inverse relationship between prostate volume and the incidence and aggressiveness of PCa.2,5–16 As prostate volume increases, incidence of PCa decreases and patients with large prostates showing a better prognosis. Alcaraz and an international group of co-authors published an extensive literature review concerning this phenomenon.15 These findings are barely challenged in literature. In one recent study, the incidence of PCa was reduced by 40% in large prostates with a volume >65 cc when compared to smaller prostates with a volume <35 cc. A possible explanation for this observed phenomenon was given, stating that in large prostates the PZ is exposed to compression-induced atrophy caused by the increased growth of the TZ, leading to the death of the glands in the PZ; the PZ is where roughly 80% of all adenocarcinomas of the prostate originate. It is interesting to find that current literature is lacking any histo-anatomical studies looking into this phenomenon given the logic of this explanation. To our knowledge, this is the first study directly analyzing and comparing the TZ and PZ in small and large prostates.
The results of our study show strong evidence that BPH-related TZ enlargement causes wide-spread atrophy, apoptosis and scarring of the glands and the epithelial cells in the PZ, and as a response forming a collagen-rich layer, which enlarges the true prostate capsule and forms the so-called ‘pseudo-capsule’ or surgical capsule of the prostate. This disease process in large BPH prostates should significantly reduce the risk of developing adenocarcinoma in the remaining epithelial glands of the PZ. This would explain the reduced incidence of prostate cancer in large BPH prostates, a phenomenon well documented in the literature.
Another recent study suggests that there may not only be an association between prostate volume and the incidence but also the aggressiveness (Gleason score) of PCa.19 If this hypothesis is correct, it would explain the findings of the large Prostate Cancer Prevention Trial/Study, which showed that patients in the finasteride-treatment arm had a higher incidence of high-grade PCa, leading to the early closure of the study. Finasteride is known to affect and reduce the growth of the TZ, leaving the PZ and its glands more area within the prostate. These additionally surviving glands could increase the risk in developing adenocarcinoma. Accumulating evidence in the literature suggests that BPH and PCa share important anatomic, pathologic, and genetic links in addition to the well-established epidemiologic association between these conditions.19 Although many of these findings published over the recent years are preliminary and require further research, they offer new insight into the mechanisms of disease process underlying the development of BPH and PCa.
Limitations
This study included a relatively small sample size and its single-center design. This study should be considered a ‘pilot study’ and with these results we want to encourage other institutions to examine this phenomenon, as well as analyze and evaluate their relevant cases. If the hypothesis of interaction between BPH and PCa is correct, it will have significant implications on how we as urologists see and treat patients with BPH.
Conclusion
The results of this histo-anatomical study of small and large prostates demonstrates decreased gland density of the peripheral zone and increased capsule thickness in prostates larger than or equal to 80 g compared to those smaller than 30 g. This corroborates the hypothesis that expansion of the prostate against its capsule leads to compression-induced atrophy and fibrosis of glandular tissue in the PZ, providing possible explanations for the well-documented inverse association between prostate volume and the incidence of prostate cancer. Data from this study and the outlined discussion should encourage other clinicians and investigators to further explore the relationship between prostate volume and the incidence and aggressiveness of prostate cancer, in order to further investigate this phenomenon. If confirmed, this may have relevant future clinical implications in diagnostics and treatment for BPH.
Disclosure
The authors report no conflicts of interest in this work.
References
Lepor H. Pathophysiology, epidemiology, and natural history of benign prostatic hyperplasia. Rev UroL. 2004;6(suppl 9):S3–S10. | ||
Al-Khalil S, Boothe D, Durdin T, et al. Possible interactions between benign prostatic hyperplasia and prostate cancer in large prostates. Int Urol Nephrol. 2016;48(1):91–97. | ||
Bosch JL, Hop WC, Kirkels WJ, Schröder FH. The International prostate symptom score in a community-based sample of men between 55 and 74 years of age: prevalence and correlation of symptoms with age, prostate volume, flow rate and residual urine volume. Br J Urol. 1995;75(5):622–630. | ||
Siegel RL, Miller KD, Jemal A. Cancer statistics, 2016. CA Cancer J Clin. 2016;66(1):7–30. | ||
Kim JS, Ryu J-G, Kim JW, et al. Prostate-specific antigen fluctuation: what does it mean in diagnosis of prostate cancer? Int Braz J Urol. 2015;41(2):258–264. | ||
de Gorski A, Rouprêt M, Peyronnet B, et al. Accuracy of magnetic resonance imaging/ultrasound fusion targeted biopsies to diagnose clinically significant prostate cancer in enlarged compared to smaller prostates. J Urol. 2015;194(3):669–673. | ||
Levine MA, Ittman M, Melamed J, Lepor H. Two consecutive sets of transrectal ultrasound guided sextant biopsies of the prostate for the detection of prostate cancer. J Urol. 1998;159(2):471–476. | ||
Chen ME, Troncoso P, Johnston D, Tang K, Babaian RJ. Prostate cancer detection: relationship to prostate size. Urology. 1999;53(4):764–768. | ||
Filson C, Margolis D, Huang J, et al. MR-US fusion biopsy: importance of both systematic and targeted sampling to diagnose prostate cancer. American Urological Association Annual Meeting; May 15, 2015; New Orleans, LA. | ||
Ung JO, San Francisco IF, Regan MM, Dewolf WC, Olumi AF. The relationship of prostate gland volume to extended needle biopsy on prostate cancer detection. J Urol. 2003;169(1):130–135. | ||
Kozminski MA, Palapattu GS, Mehra R, et al. Understanding the relationship between tumor size, gland size, and disease aggressiveness in men with prostate cancer. Urology. 2014;84(2):373–379. | ||
Hong SK, Poon BY, Sjoberg DD, Scardino PT, Eastham JA. Prostate size and adverse pathologic features in men undergoing radical prostatectomy. Urology. 2014;84(1):153–157. | ||
Werahera PN, Sullivan K, La Rosa FG, et al. Optimization of prostate cancer diagnosis by increasing the number of core biopsies based on gland volume. lnl J Clin Exp Paihol. 2012;5(9):892–899. | ||
Yoon BI, Shin TS, Cho HJ, et al. Is it effective to perform two more prostate biopsies according to prostate-specific antigen level and prostate volume in detecting prostate cancer? prospective study of 10-core and 12-core prostate biopsy. Urol J. 2012;9(2):491–497. | ||
Alcaraz A, Hammerer P, Tubaro A, Schröder FH, Castro R. Is there evidence of a relationship between benign prostatic hyperplasia and prostate cancer? Findings of a literature review. Eur Urol. 2009;55(4):864–875. | ||
Briganti A, Chun FK-H, Suardi N, et al. Prostate volume and adverse prostate cancer features: fact not artifact. Eur J Cancer. 2007;43(18):2669–2677. | ||
Marks LS, Roehrborn CG, Wolford E, Wilson TH. The effect of dutasteride on the peripheral and transition zones of the prostate and the value of the transition zone index in predicting treatment response. J Urol. 2007;177(4):1408–1413. | ||
Ayala AG, Ro JY, Babaian R, Troncoso P, Grignon DJ. The prostatic capsule: does it exist? its importance in the staging and treatment of prostatic carcinoma. Am J Surg Pathol. 1989;13(1):21–27. | ||
Al-Khalil S, Ibilibor C, Cammack JT, de Riese W. Association of prostate volume with incidence and aggressiveness of prostate cancer. Res Rep Urol. 2016;8:201–205. |
 © 2019 The Author(s). This work is published and licensed by Dove Medical Press Limited. The full terms of this license are available at https://www.dovepress.com/terms.php and incorporate the Creative Commons Attribution - Non Commercial (unported, v3.0) License.
By accessing the work you hereby accept the Terms. Non-commercial uses of the work are permitted without any further permission from Dove Medical Press Limited, provided the work is properly attributed. For permission for commercial use of this work, please see paragraphs 4.2 and 5 of our Terms.
© 2019 The Author(s). This work is published and licensed by Dove Medical Press Limited. The full terms of this license are available at https://www.dovepress.com/terms.php and incorporate the Creative Commons Attribution - Non Commercial (unported, v3.0) License.
By accessing the work you hereby accept the Terms. Non-commercial uses of the work are permitted without any further permission from Dove Medical Press Limited, provided the work is properly attributed. For permission for commercial use of this work, please see paragraphs 4.2 and 5 of our Terms.