")
Back to Journals » Journal of Inflammation Research » Volume 14
Higher Serum Leptin Levels are Associated with a Reduced Risk of Sarcopenia but a Higher Risk of Dynapenia Among Older Adults
Authors Kao TW , Peng TC, Chen WL , Chi YC, Chen CL, Yang WS
Received 23 August 2021
Accepted for publication 28 October 2021
Published 3 November 2021 Volume 2021:14 Pages 5817—5825
DOI https://doi.org/10.2147/JIR.S335694
Checked for plagiarism Yes
Review by Single anonymous peer review
Peer reviewer comments 2
Editor who approved publication: Professor Ning Quan
Tung-Wei Kao,1,2 Tao-Chun Peng,1 Wei-Liang Chen,1 Yu-Chiao Chi,2 Chi-Ling Chen,2 Wei-Shiung Yang2– 4
1Division of Geriatric Medicine, Department of Family and Community Medicine, Tri-Service General Hospital, National Defense Medical Center, Taipei, Taiwan; 2Graduate Institute of Clinical Medicine, College of Medicine, National Taiwan University, Taipei, Taiwan; 3Department of Internal Medicine, National Taiwan University Hospital, Taipei, Taiwan; 4Center for Obesity, Life Style and Metabolic Surgery, National Taiwan University Hospital, Taipei, Taiwan
Correspondence: Wei-Shiung Yang Email [email protected]
Background: Leptin plays an important role in regulating the energy homeostasis of fat and muscle. Paradoxical findings existed between serum leptin levels and muscle health conditions. Here, we aimed to investigate the relationship between serum leptin levels and the risk of sarcopenia or dynapenia among older adults.
Methods: Adults aged 65 and older living in the community were recruited at annual health checkups. Body composition, gait speed, and handgrip strength were examined. The cutoff values of muscle mass and strength to define sarcopenia and dynapenia were based on the consensus by the Asia Working Group of Sarcopenia in 2019. Serum leptin level was measured by an immunoassay.
Results: Four hundred sixty participants (55.65% females) were enrolled. There were 16.08% and 23.91% with sarcopenia and dynapenia, respectively. Higher serum leptin levels were positively associated with muscle and fat mass but negatively associated with handgrip strength and gait speed for both sexes. In the logistic regression models adjusted for various confounders, a higher serum leptin level was associated with an increased risk of dynapenia with dose-response effects among both male and female participants (odds ratio [OR]=3.74, 95% confidence interval [CI]= 0.99– 14.17; OR= 3.32, 95% CI=1.03– 10.74, respectively), and a positive trend existed in both genders (p for trend=0.040 and 0.042, respectively). In contrast, a higher leptin level was associated with a reduced risk of sarcopenia with dose-response trends for both sexes (OR= 0.06, 95% CI=0.01– 0.48; OR= 0.26, 95% CI=0.06– 1.17, respectively) in models of multivariate logistic regression analyses, and a negative trend existed in both genders (p for trend = 0.002 and 0.023, respectively).
Conclusion: A positive trend existed between the serum leptin level and the dynapenia risk, whereas it revealed a negative trend in the serum leptin level and sarcopenia risk in both male and female elderly individuals. The biological mechanisms underlying its negative association with muscle strength but its positive association with muscle mass warrants further investigation.
Keywords: leptin, dynapenia, sarcopenia, elderly, muscle, strength, mass
Introduction
Progressive deterioration of muscle health is a critical issue among older adults.1–3 A large number of studies have demonstrated that poor muscle quality may cause more adverse clinical outcomes than a low muscle mass.4,5 In addition, a decline in muscle function, such as low handgrip strength or slower gait speed, is associated with obesity in many reports.6–8 Studies have also pointed out that intramuscular and intermuscular fat infiltration is correlated with poor muscle performance.9–11 Therefore, the interaction between adiposity and muscle function is an issue that deserves further evaluation.
Adipokines, mainly secreted by adipose tissue, mediate metabolic signaling from adipose tissues and help maintain physiological homeostasis. Among them, leptin is the prime example of this adipokine paradigm. The circulating level of leptin is well documented to correlate with the amount of white adipose tissue.12,13 Leptin is now known to play key roles in energy balance regulation, appetite control, insulin sensitivity, and glucose metabolism.12,14 The function of leptin is mainly mediated through its action on leptin receptors in the central nervous system, primarily the hypothalamus, as well as in peripheral tissues such as the skeletal muscle and lymphoid tissue.15 The leptin receptor is expressed ubiquitously in almost all tissues. Studies have found that abundant leptin receptors are also located on skeletal muscle cells.16 Leptin has been reported to increase the rate of fatty acid oxidation and to decrease the lipid content in muscle cells.16–18 Altogether, these studies demonstrate that leptin signaling plays a significant role in skeletal muscle metabolism and function.
From the clinical perspective, serum leptin levels are an independent predictor of many disorders, such as cardiovascular disease19 and diabetes.20 Recently, some reports have suggested that higher serum leptin concentrations are associated with physical function decline in older adults, especially in middle-aged women.21,22 A higher leptin level is associated with a greater risk of frailty, especially exhaustion and muscle weakness in older adults.15 Higher serum leptin concentrations are also implicated in poor handgrip strength and muscle quality deterioration in men on chronic hemodialysis.23 Another report showed that lower serum leptin levels were found in the sarcopenia group among hemodialysis patients, which might be related to poor nutrition.24 Furthermore, the role of leptin in dynapenia, a condition with reduced muscle strength without a loss of mass, has rarely been explored. Therefore, this study aimed to investigate the relationship between serum leptin levels and muscle conditions, including dynapenia and sarcopenia, among older adults dwelling in the community.
Methods
Study Participants
Older adults aged 65 years and older living in communities were recruited when they attended an annual health checkup program at the Tri-Service General Hospital (TSGH) in Taipei as previously described.25 We excluded individuals who were undergoing regular hemodialysis, had congestive heart failure or poor cognitive function, were receiving cancer treatment, or had joint pain or chest pain during exercise. Personal information such as health behaviors, physical activities, and overall health conditions was ascertained through a structured questionnaire. All participants provided their written informed consent. This study was conducted in accordance with the Declaration of Helsinki. The protocol was approved by the Institutional Review Board of TSGH.
Body Composition Measurement
Anthropometric measurements were performed as previously described.25 Briefly, body height was measured with a stadiometer to the nearest 0.1 cm, and body weight was checked by a digital scale to the nearest 0.01 kg. Waist circumference (WC) was measured at the mid-level between the lower border of the 12th rib and the iliac crest when a participant was standing with the feet placed 25 to 30 cm apart. Bioelectric impedance analysis (BIA, InBody720, Biospace, Seoul, South Korea) was used to assess the body composition.26 Appendicular skeletal muscle mass (ASM) was adjusted by the square of body height in meters to define the skeletal muscle mass index (SMI). Body fat mass was divided by the body muscle mass to identify the fat-to-muscle ratio (FMR). Based on the guidelines proposed by the Asian Working Group for Sarcopenia (AWGS) in 2019 (Figure 1), the cutoff value of SMI was 7.0 kg/m2 for men and 5.7 kg/m2 for women as evaluated by using BIA.3
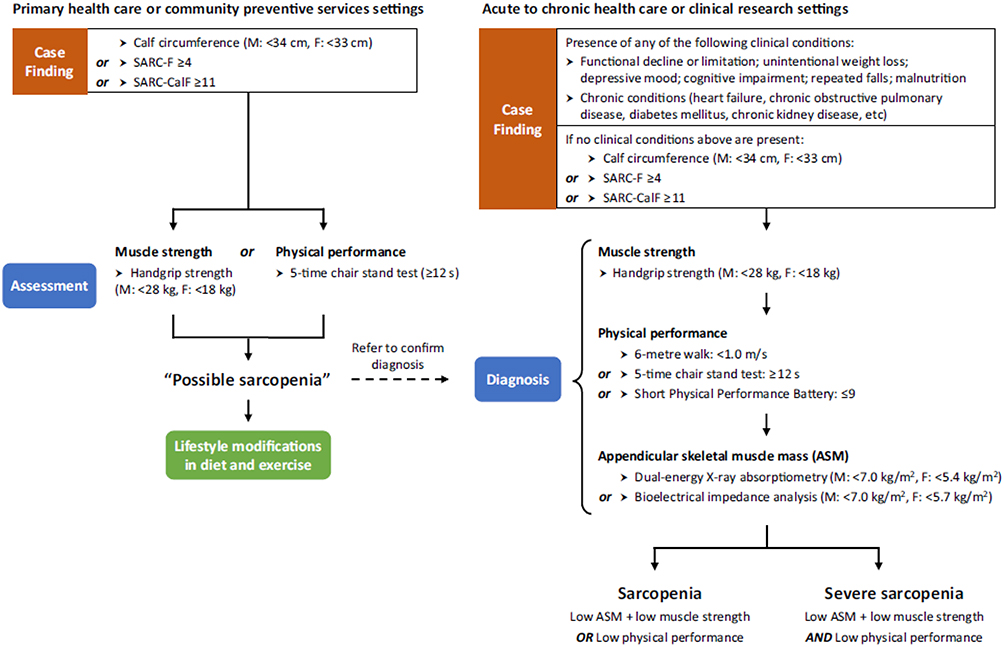 |
Figure 1 Algorithm for sarcopenia diagnosis by 2019 Asia Working Group of Sarcopenia (AWGS). Abbreviations: F, female; M, male. |
Measurement of Muscle Function
An analog isometric dynamometer (Exacta™ Hydraulic Hand Dynamometer; North Coast Medical Inc., Gilroy, CA) was used to examine the dominant hand’s grip strength three times, and then the best performance was recorded. All participants were requested to walk a six-meter distance at their usual pace, and their gait speed was calculated as the distance divided by the walking time. According to the consensus proposed by AWGS in 2019 (Figure 1), the cutoff value of low handgrip strength is below 28 kg in men and lower than 18 kg in women, and low gait speed is defined as slower than 1.0 m/sec in both genders.3
Definition of Dynapenia and Sarcopenia
In 2008, Clark et al proposed age-related loss of muscle strength and power not caused by neurologic or muscular diseases to be called dynapenia.2 Participants with a normal muscle mass but a low handgrip strength and/or low gait speed were categorized into the dynapenia group in our study. Low muscle mass accompanied by poor muscle strength and/or poor physical performance was categorized as sarcopenia based on the consensus by the European Working Group on Sarcopenia in Older People (EWGSOP) in 2010.1
Measurement of the Serum Leptin Level
Serum leptin levels were analyzed via standard Quantikine enzyme-linked immunosorbent assay (ELISA) per the manufacturer’s specification (R&D Systems, Inc., Minneapolis, MN, USA). The limit of detection (LOD) was 7.8 pg/mL, and the intra-assay and inter-assay coefficients of variation (CVs) were all less than 5%.
Covariates
Hypertension was defined as an average blood pressure of 140/90 mmHg or higher, diagnosed by a participant’s physician, or based on the medication used for blood pressure control. Diabetes mellitus was defined as fasting plasma glucose ≥126 mg/dl, current use of oral or injectable hypoglycemic agents, or self-report of a physician’s diagnosis. Alcohol consumption was defined as drinking at least once each week and was treated as a categorical variable. Positive smoking status was defined as ever smoking in life and was dichotomized. The International Physical Activity Questionnaire Short Form (IPAQ) was used to assess the participants’ physical activities.27 The medical history, including stroke and coronary heart diseases, was obtained by self-report. The definition of metabolic syndrome was based on the National Cholesterol Education Program (NECP) expert panel on the Detection, Evaluation, and Treatment of High Blood Cholesterol in Adults (Adult Treatment Panel III) guidelines,28 and the modified criteria of abdominal obesity for Asian people were applied using the International Diabetes Federation criteria.29
Statistical Analysis
Continuous variables are represented as the mean± standard deviation. Categorical data are expressed as numbers with percentages, and the chi-square test was used to examine the differences in these variables. The differences among the leptin quartiles were examined by ANOVA. Pearson’s correlation was performed to examine the relationship between the serum leptin level and the muscle strength, gait speed, and body composition in men and women. The serum leptin level was divided into quartiles in the male and female groups. We used quartile-based multiple logistic regression analysis to examine the risk of dynapenia and sarcopenia among different serum leptin quartiles, with the lowest quartile as the reference group in males and females. A stepwise-model approach was conducted to adjust the covariates: Model 1= age and health behaviors (smoking, alcohol consumption); Model 2= Model 1+ hypertension, diabetes, stroke, coronary artery disease, physical activity, and fat-to-muscle ratio. We used the Statistics Package for Social Science version 16.0 software (SPSS Inc., Chicago, IL).
Results
Characteristics of the Participants
There were 460 participants enrolled in this study, and 55.7% were females (Table 1). The mean age was 72.2±7.5 for males and 71.4±5.8 for females. There were 110 old adults with dynapenia and 74 participants with sarcopenia (23.91% and 16.08%, respectively). Among the male participants, 41.6% had hypertension, 16.2% had diabetes mellitus, 25% had metabolic syndrome, 25% had dynapenia and 13.7% had sarcopenia. Among the female participants, 33.9% had hypertension, 12.5% had diabetes mellitus, 25.3% had metabolic syndrome, 23% had dynapenia and 17.9% had sarcopenia. As expected, people in the quartiles of higher serum leptin levels had a higher BMI, waist circumference, fat mass, body fat percentage, and fat-to-muscle ratio (all p<0.001 in male and female). Participants with higher serum leptin levels were more likely to have metabolic syndrome among both males and females (p<0.001 in both genders, Table 1). In both genders, people in the quartile with higher serum leptin levels tended to have a lower gait speed (p=0.028 in males and p=0.025 in females, Table 1). People with higher serum leptin levels were less likely to have sarcopenia (Table 1).
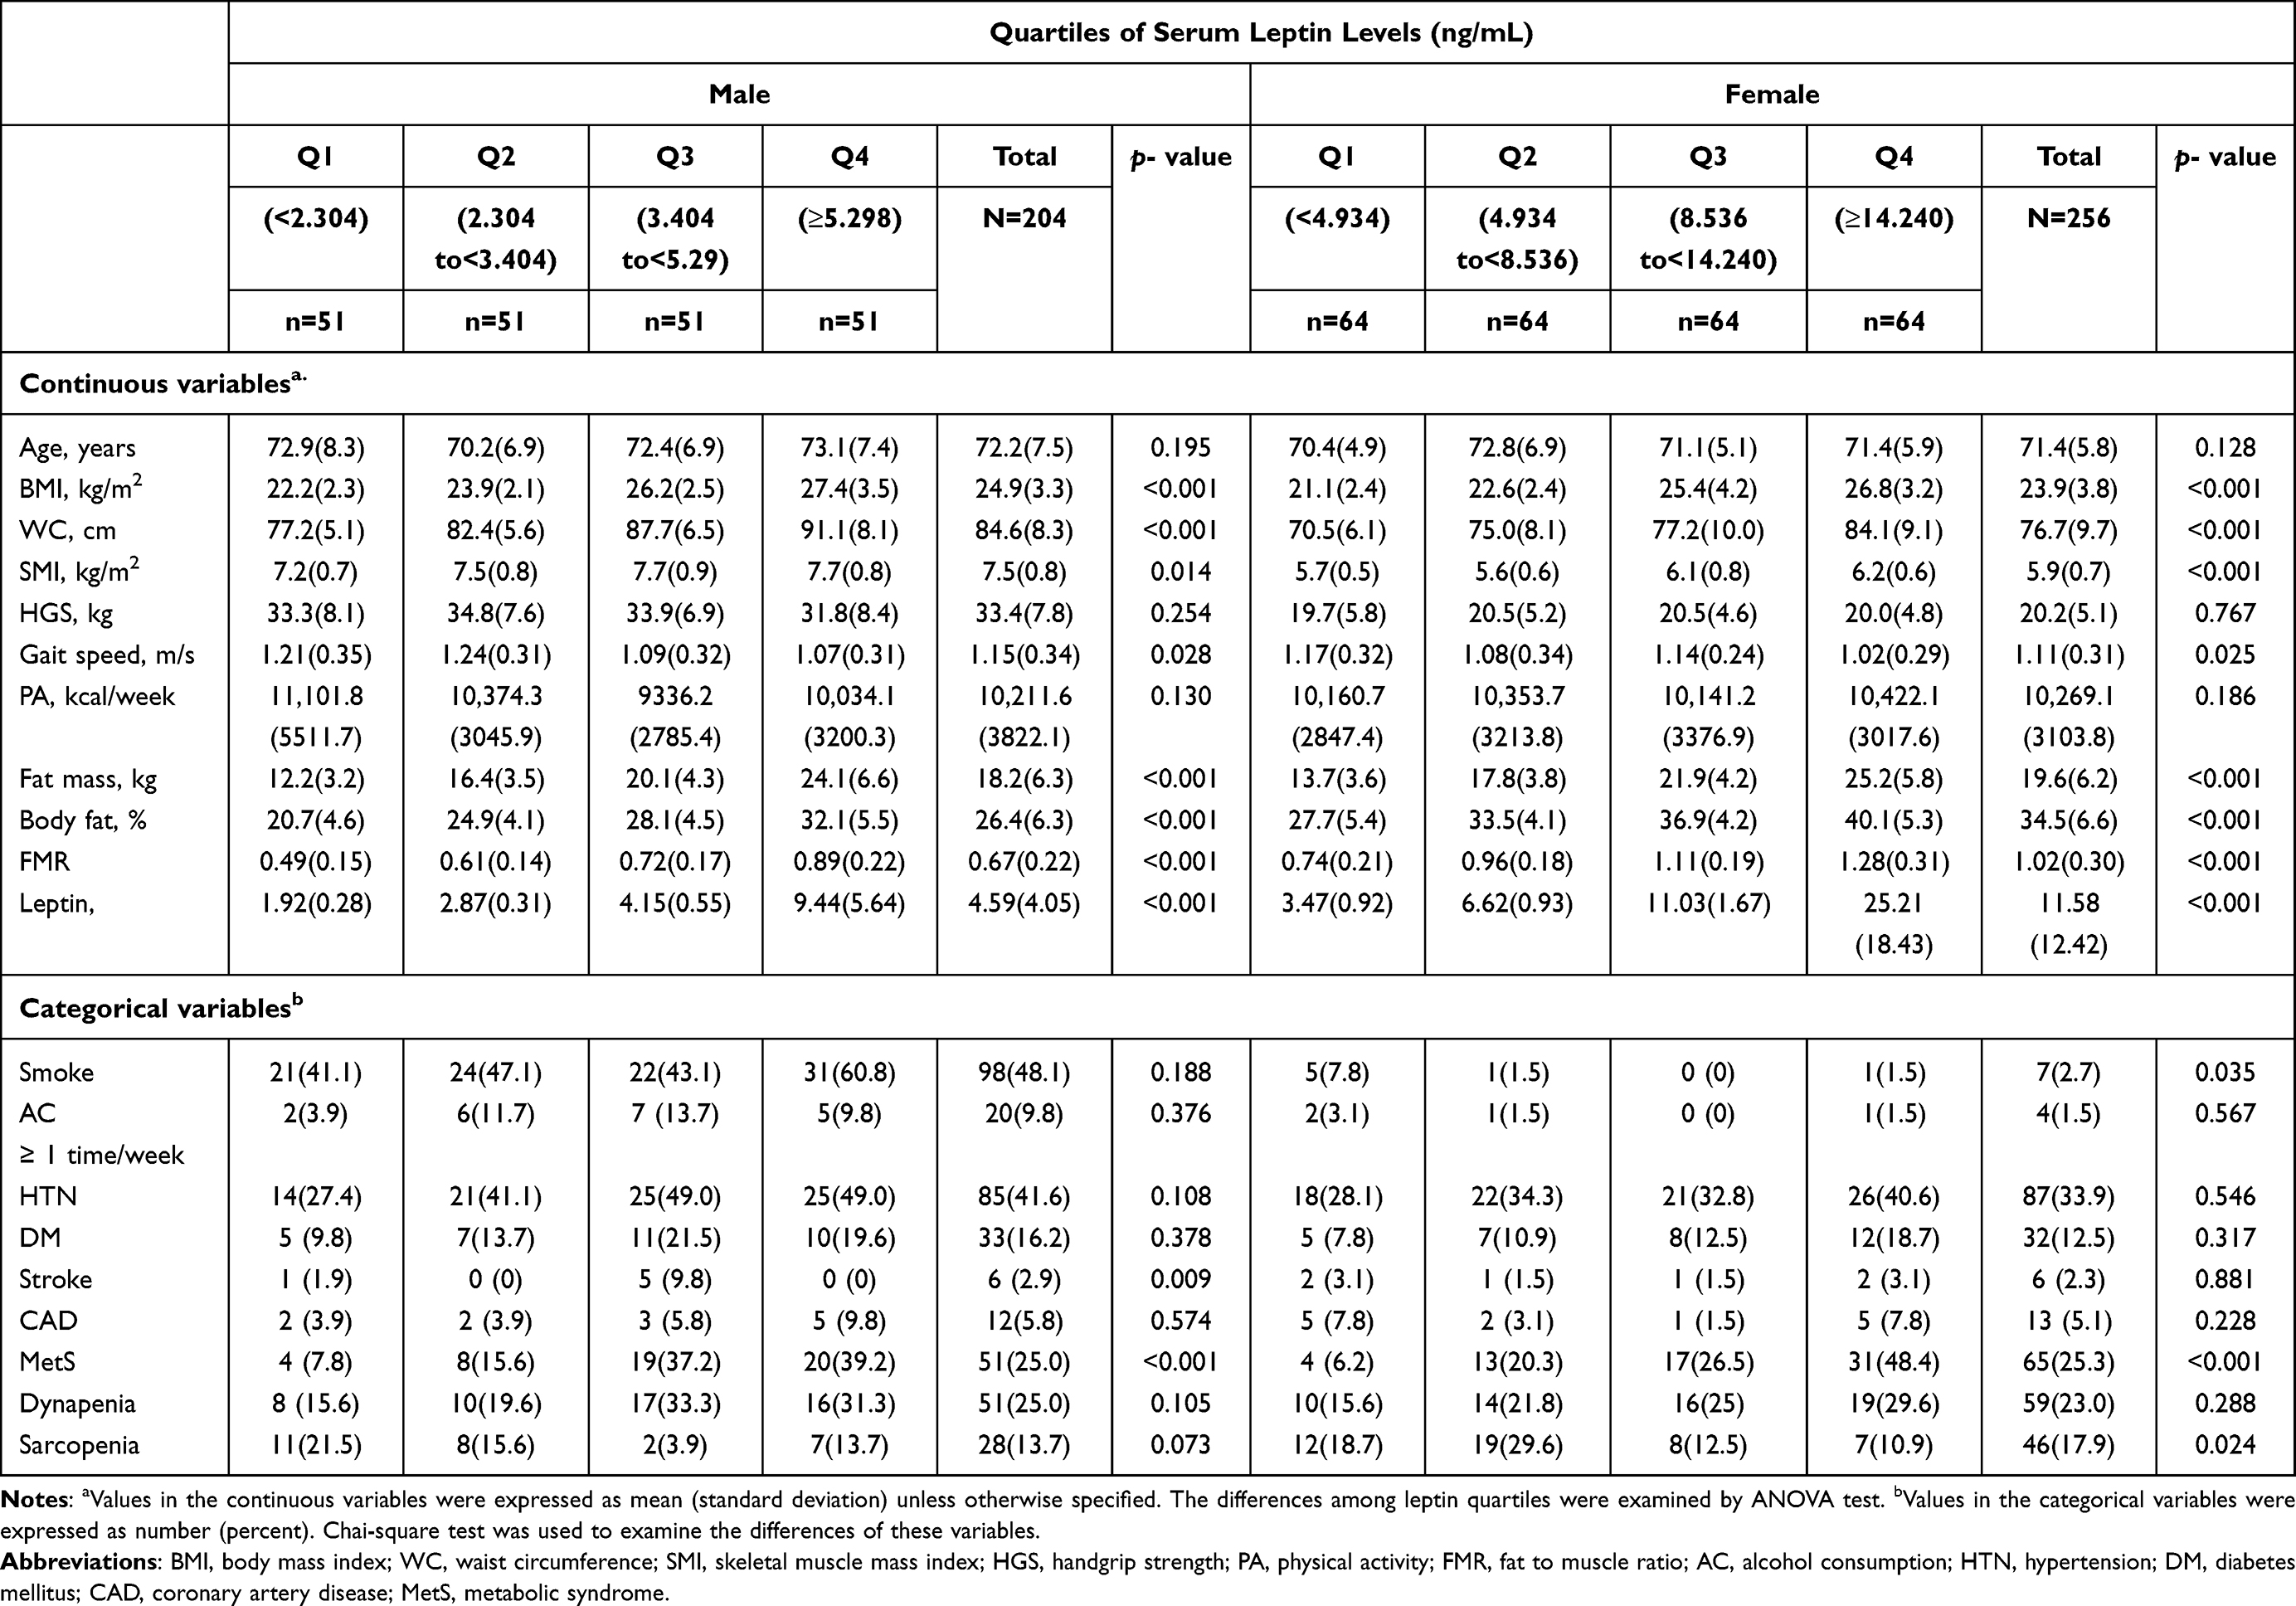 |
Table 1 Characteristics of Study Participants |
Associations of Serum Leptin Level and Body Composition and Muscle Function
Using correlation analysis, we further explored the relationship between serum leptin levels and various parameters. As predicted, serum leptin levels were positively associated with all obesity parameters, including BMI, waist circumference, fat mass, body fat percentage, and fat-to-muscle ratio, for both men and women (all p <0.001, Table 2). In contrast, serum leptin levels were also positively associated with SMI (r=0.186, p=0.009 in men and r=0.213, p=0.001 in women, Table 2). Interestingly, we found that serum leptin levels were negatively associated with two parameters, muscle strength, handgrip strength and gait speed, in both sexes (all p<0.05, Table 2).
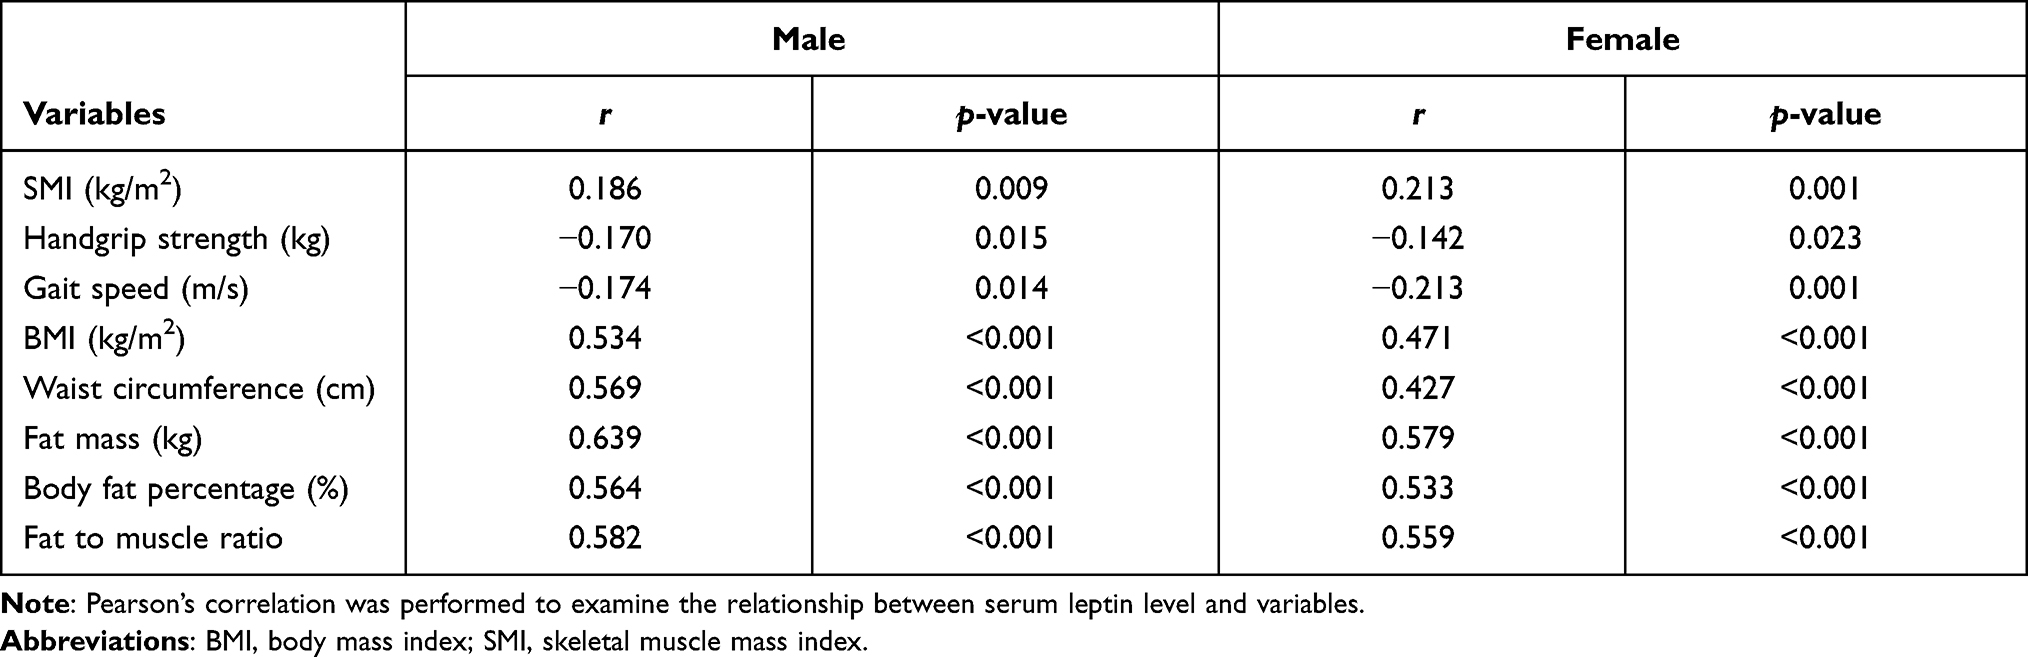 |
Table 2 Correlation Between Serum Leptin Levels and Body Composition, Muscle Function |
Serum Leptin Level and the Risk of Dynapenia or Sarcopenia
To further analyze these associations, we divided the serum leptin levels into quartiles and categorized the muscle quantity and muscle quality as dynapenia and sarcopenia. In multivariate logistic regression, after adjusting for age and health behaviors in Model 1, male participants with the highest quartile of serum leptin level had the highest risk of dynapenia compared to the individuals in the lowest quartile (odds ratio [OR]=2.90, 95% confidence interval [CI]= 1.05–7.98, p=0.039) (Table 3). There appeared to be a dose-response effect (p for trend=0.015). After further adjustment of the other confounding factors in Model 2, the positive association remained but with borderline statistical significance (p=0.052, Table 3). Nevertheless, the dose-response effect between the serum leptin level and the risk of dynapenia remained unaltered (p for trend=0.040, Table 3). In the analysis of sarcopenia risk, male participants in the quartiles of higher serum leptin levels had a lower risk of sarcopenia than those in the lowest quartile in both Models 1 and 2 (Table 3).
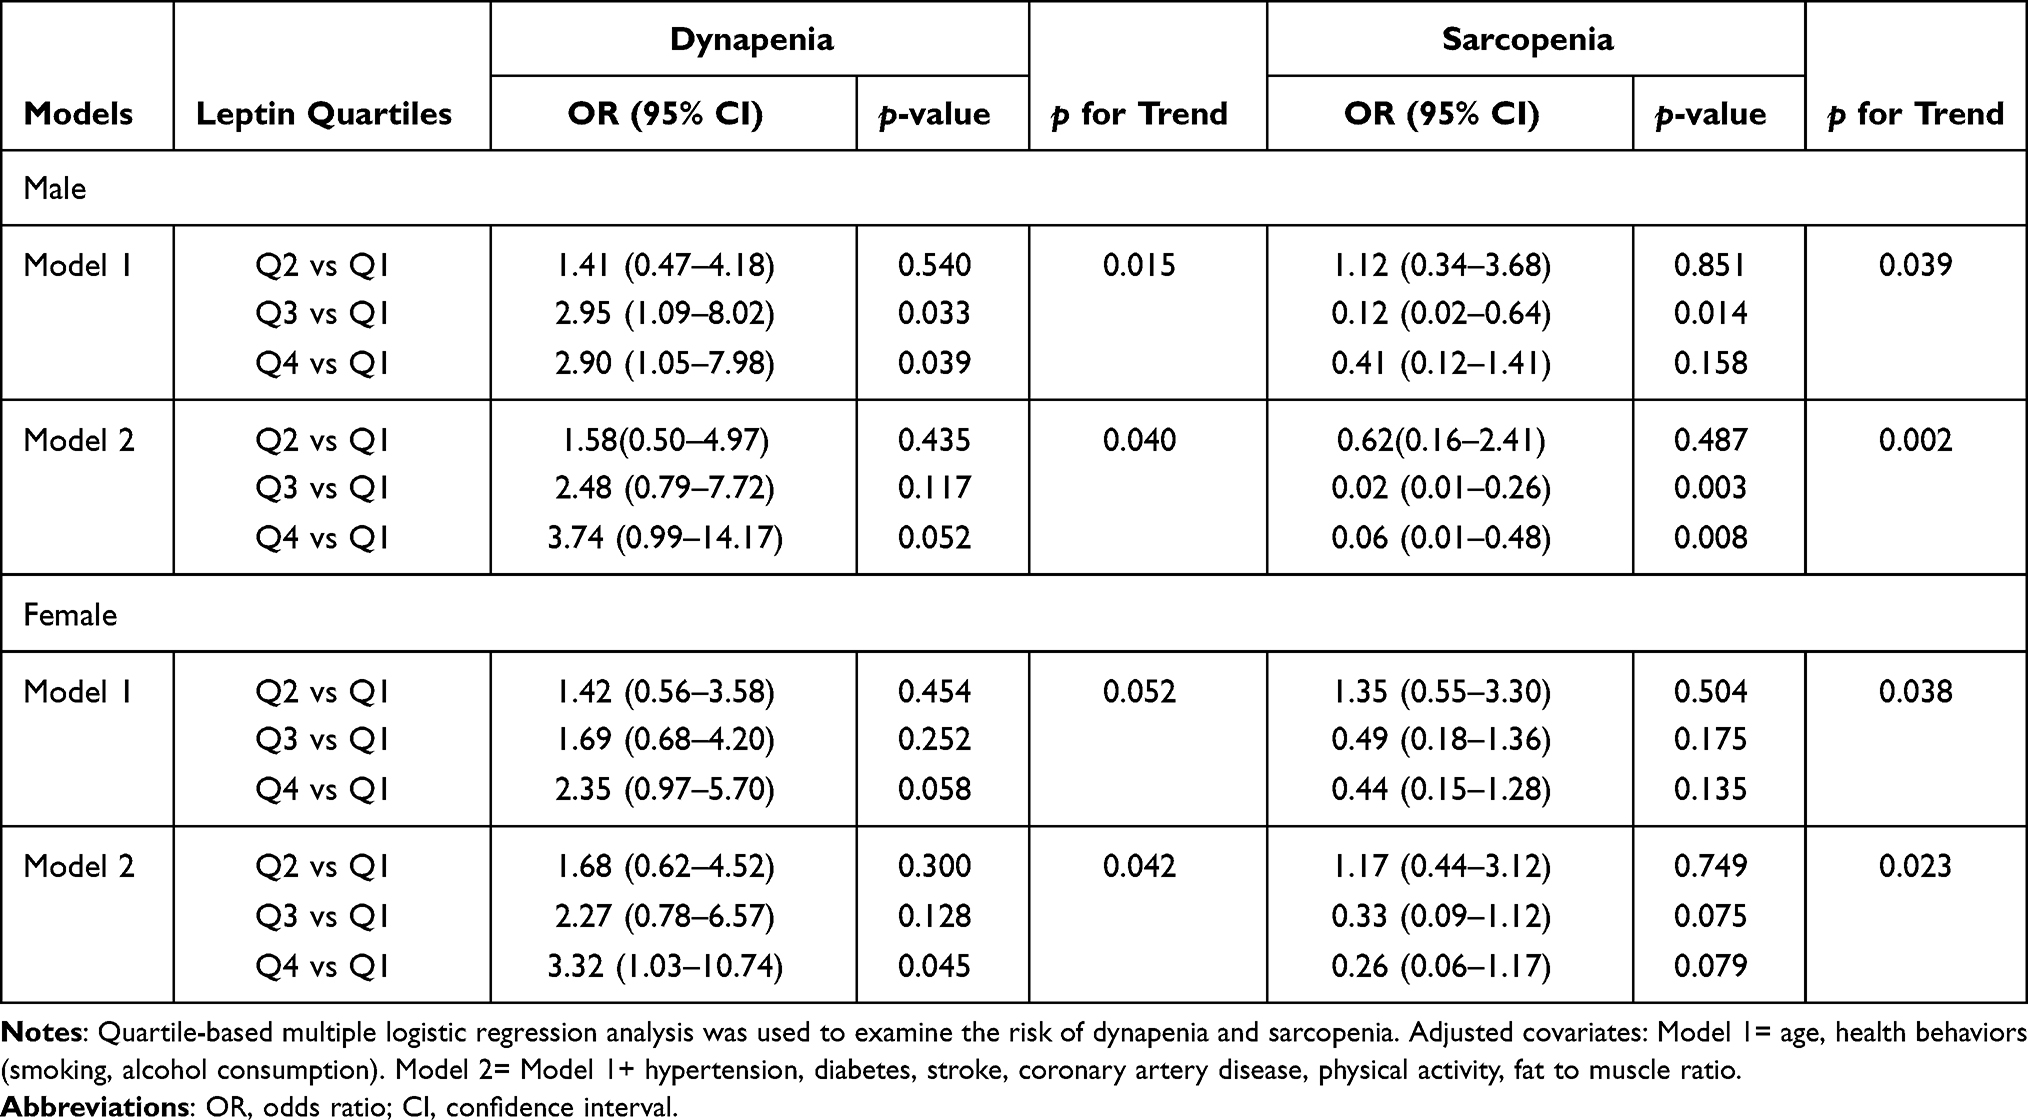 |
Table 3 Serum Leptin Level and Risk of Dynapenia and Sarcopenia |
Similar to the results in males, the female participants in the quartile of the highest serum leptin level seemed to have the highest risk of dynapenia compared to the subjects in the quartile of the lowest serum leptin after multiple covariates adjustment in the multivariate logistic regression models (Models 1 and 2 under dynapenia, Table 3). There appears to be a dose-response relationship, as indicated in Table 3. For sarcopenia risk estimation, female participants with higher serum leptin levels tended to have a lower risk of sarcopenia after multiple covariate adjustment (Table 3), although they did not reach statistical significance. However, there appeared to be a dose-response relationship, and the negative trend remained unchanged (p for trend=0.023, Table 3).
Discussion
Gender Dimorphism in Serum Leptin Levels
In our study, male and female participants with higher serum leptin levels tended to have a higher fat mass, a higher muscle mass, a higher prevalence of metabolic syndrome, and a slower gait speed. Dynapenia was more prevalent than sarcopenia among participants of both sexes. In addition, serum leptin levels were higher in women than in men. It has been reported that some factors, such as obesity, estrogen, and proinflammatory cytokines, may increase serum leptin levels, whereas others, such as leanness, testosterone, and fasting, may reduce leptin secretion.12 Sex differences existed not only in the serum leptin bioactivity in the expression of skeletal muscle leptin receptors but also in muscle strength. All of these phenomena are partly mediated by sex hormones.30–32
Leptin is Associated with Increases in Muscle Mass and Fat Mass
In this research, participants with higher serum leptin concentrations had a higher fat and muscle mass. The serum leptin level was positively associated with all obesity parameters, including BMI, waist circumference, fat mass, body fat percentage, and FMR, consistent with the findings in previous studies.33,34 Interestingly, serum leptin levels were also positively associated with SMI among participants in our study. Sainz et al showed that leptin administration increased muscle mass in mice.35 Hubbard et al also reported that a low serum level of leptin was associated with a decreased mid-arm muscle area in old individuals with frailty.36 Lin et al observed that leptin levels were positively associated with appendicular skeletal muscle mass among hemodialysis patients.24 In summary, serum leptin levels might be an indicator of long-term nutritional status.
High Serum Leptin Levels Indicate a Better Nutritional Status
Emerging studies have supported the relationship between serum leptin levels and nutritional status. Kara et al discovered that higher leptin levels were negatively associated with malnutrition inflammation scores after adjustment for BMI among nonobese hemodialysis patients.37 Markaki et al reported that a lower level of serum leptin was associated with malnourishment and a poor prognosis in a prospective follow-up among end-stage renal disease patients.38 In our study, the participants with dynapenia had higher obesity parameters and higher serum leptin levels; in contrast, those with sarcopenia had lower obesity parameters and lower serum leptin levels. This specific characteristic of the body composition among elderly individuals with sarcopenia and dynapenia has been explored in our previous study, showing that elderly adults with dynapenia tend to be more obese than elderly individuals with sarcopenia,25 which may be due to poor nutritional status among older persons who encounter a situation with a loss of both muscle mass and muscle function. Therefore, higher serum leptin is associated with a reduced risk of sarcopenia.
Leptin is Associated with Decreased Muscle Strength
On the other hand, we observed that serum leptin levels were negatively associated with muscle function, such as handgrip strength and gait speed, in the correlation analysis. Some previous research was in line with our study findings. Leptin levels were negatively correlated with handgrip strength and gait speed among hemodialysis patients.24 A higher serum leptin concentration increased the odds ratio of functional decline, especially muscle weakness and exhaustion, among older adults in a cohort study.15 Karvonen-Gutierrez et al found that premenopausal women with higher baseline leptin concentrations were prone to have reduced muscle strength and a worse physical performance.22 In the seniors-ENRICA study, an inverse association was found between serum leptin levels and self-reported physical performance, especially for lower extremity function, among community-dwelling older adults.21 In summary, higher serum leptin levels are related to muscle functional decline in cross-sectional and longitudinal studies. For this negative association, it has also been reported that higher serum leptin levels were implicated in insulin resistance and decelerating fatty acid oxidation in skeletal muscle cells among obese individuals, leading to excessive lipid accumulation,39 which may impair muscle quality and hamper muscle strength. On the other hand, hyperleptinemia also indicates leptin resistance, rendering blunting of normal leptin signaling.23 This may also impair fatty acid oxidation in muscle cells18 and lead to increased intramuscular fat infiltration, contributing to the decline of muscle quality.9,17 In fact, the fat composition may interfere with muscle function, as suggested by other clinical studies.25,40
Serum Leptin Level and the Risk of Dynapenia or Sarcopenia
We found that the serum level of leptin was positively associated with SMI but negatively associated with handgrip strength and gait speed, which corresponds to the situation of a normal muscle mass but low muscle function, which is defined as dynapenia. Further assessments of serum leptin levels and the risk of dynapenia and sarcopenia in this population were conducted. In both male and female participants, a higher serum level of leptin was significantly associated with a decreased rate of sarcopenia. On the other hand, a trend of an increasing dynapenia risk among quartile groups existed in both genders. To the best of our knowledge, a paucity of studies has explored the relationships between serum leptin levels and sarcopenia and dynapenia. Lana et al reported that higher serum leptin levels independently increased the risk of frailty among elderly individuals, a possible condition of sarcopenia.15 In contrast, another study showed that a lower serum leptin concentration was an independent predictor for sarcopenia in chronic hemodialysis patients.24 There were some possible speculations for these paradoxical results. In healthy subjects, a higher serum leptin concentration leads to increased eating gratification and decreased food ingestion with higher energy expenditure.12 Although higher serum leptin levels are common in obese individuals, it is supposed that there might be a state of leptin resistance among this population, whereby leptin is unable to control the appetite by reducing food consumption.41 Hence, leptin may express diverse effects in different populations, including those defined by sex, multiple chronic diseases, age, and healthy and obese subjects. In addition, the function or numbers of leptin receptors have scarcely been discussed in related clinical studies and may be important determinants of the action of leptin signals.
The strength of this study is to use the clinical cutoff point based on the consensus of AWGS to define low muscle mass and low muscle function. In contrast to the previous studies, we categorized muscle quantity and muscle quality into the clinical diagnoses of dynapenia and sarcopenia, providing more practical information in the clinical setting. Some previous studies used obesity indicators such as BMI to examine the independent association of serum leptin level and physical function.22 However, in this research, we used FMR as the indicator of obesity because it has a better diagnostic performance than other parameters for sarcopenia and dynapenia.25 Considering the clinical implications, it is relatively easy to measure serum leptin levels in clinical practice. Older adults with higher serum leptin levels provided information regarding relatively better nutritional status or were obese, resulting in lower muscle function. Diet control and exercise should be considered for these populations.
There are some limitations of this study to be addressed. First, even though we controlled for nutritional status by adequate obesity parameters, other potential confounders, such as inflammatory and nutritional biomarkers, were not available in this study. Second, this is a cross-sectional study, a causal relationship could not be obtained, and extrapolating the results to other populations is limited. Furthermore, a direct effect of leptin on skeletal muscle functions, especially muscle strength, needs to be explored.
Conclusion
Our study demonstrated that higher serum leptin levels were positively associated with both muscle mass and fat mass, which may indicate a better nutritional status. Therefore, a higher blood leptin level is associated with a reduced risk of sarcopenia. More importantly, higher blood leptin levels were negatively associated with handgrip strength and gait speed. As a result, a higher blood leptin level is associated with an increased risk of dynapenia.
Acknowledgments
This study was supported by grant MOST 104-2314-B-016-011 -MY3, MOST 107-2314-B-016-054 from the Ministry of Science and Technology (MOST) in Taiwan, and ATSGH-C107-203 from the Tri-Service General Hospital.
Disclosure
All authors declared that they have no conflicts of interest.
References
1. Cruz-Jentoft AJ, Baeyens JP, Bauer JM, et al. Sarcopenia: European consensus on definition and diagnosis: report of the European Working Group on Sarcopenia in Older People. Age Ageing. 2010;39(4):412–423. doi:10.1093/ageing/afq034
2. Clark BC, Manini TM. Sarcopenia =/= dynapenia. J Gerontol a Biol Sci Med Sci. 2008;63(8):829–834. doi:10.1093/gerona/63.8.829
3. Chen LK, Woo J, Assantachai P, et al. Asian working group for sarcopenia: 2019 consensus update on sarcopenia diagnosis and treatment. J Am Med Dir Assoc. 2020;21(3):300–307 e2. doi:10.1016/j.jamda.2019.12.012
4. Cawthon PM, Fox KM, Gandra SR, et al. Do muscle mass, muscle density, strength, and physical function similarly influence risk of hospitalization in older adults? J Am Geriatr Soc. 2009;57(8):1411–1419. doi:10.1111/j.1532-5415.2009.02366.x
5. Cawthon PM, Fox KM, Gandra SR, et al. Clustering of strength, physical function, muscle, and adiposity characteristics and risk of disability in older adults. J Am Geriatr Soc. 2011;59(5):781–787. doi:10.1111/j.1532-5415.2011.03389.x
6. Sternfeld B, Ngo L, Satariano WA, Tager IB. Associations of body composition with physical performance and self-reported functional limitation in elderly men and women. Am J Epidemiol. 2002;156(2):110–121. doi:10.1093/aje/kwf023
7. Meng P, Hu YX, Fan L, et al. Sarcopenia and sarcopenic obesity among men aged 80 years and older in Beijing: prevalence and its association with functional performance. Geriatr Gerontol Int. 2014;14(Suppl 1):29–35.
8. Chang CI, Huang KC, Chan DC, et al. The impacts of sarcopenia and obesity on physical performance in the elderly. Obes Res Clin Pract. 2015;9(3):256–265.
9. Hamrick MW, McGee-Lawrence ME, Frechette DM. Fatty infiltration of skeletal muscle: mechanisms and comparisons with bone marrow adiposity. Front Endocrinol (Lausanne). 2016;7:69. doi:10.3389/fendo.2016.00069
10. Visser M, Goodpaster BH, Kritchevsky SB, et al. Muscle mass, muscle strength, and muscle fat infiltration as predictors of incident mobility limitations in well-functioning older persons. J Gerontol A Biol Sci Med Sci. 2005;60(3):324–333. doi:10.1093/gerona/60.3.324
11. Delmonico MJ, Harris TB, Visser M, et al. Longitudinal study of muscle strength, quality, and adipose tissue infiltration. Am J Clin Nutr. 2009;90(6):1579–1585. doi:10.3945/ajcn.2009.28047
12. Park HK, Ahima RS. Physiology of leptin: energy homeostasis, neuroendocrine function and metabolism. Metabolism. 2015;64(1):24–34. doi:10.1016/j.metabol.2014.08.004
13. Cameron AJ, Zimmet PZ, Shaw JE, et al. The metabolic syndrome: in need of a global mission statement. Diabet Med. 2009;26(3):306–309. doi:10.1111/j.1464-5491.2009.02681.x
14. Mantzoros CS, Magkos F, Brinkoetter M, et al. Leptin in human physiology and pathophysiology. Am J Physiol Endocrinol Metab. 2011;301(4):E567–84. doi:10.1152/ajpendo.00315.2011
15. Lana A, Valdés-Bécares A, Buño A, et al. Serum leptin concentration is associated with incident frailty in older adults. Aging Dis. 2017;8(2):240–249. doi:10.14336/AD.2016.0819
16. Guerra B, Santana A, Fuentes T, et al. Leptin receptors in human skeletal muscle. J Appl Physiol (1985). 2007;102(5):1786–1792. doi:10.1152/japplphysiol.01313.2006
17. Dyck DJ, Heigenhauser GJ, Bruce CR. The role of adipokines as regulators of skeletal muscle fatty acid metabolism and insulin sensitivity. Acta Physiol (Oxf). 2006;186(1):5–16. doi:10.1111/j.1748-1716.2005.01502.x
18. Minokoshi Y, Toda C, Okamoto S. Regulatory role of leptin in glucose and lipid metabolism in skeletal muscle. Indian J Endocrinol Metab. 2012;16(Suppl 3):S562–8. doi:10.4103/2230-8210.105573
19. Wallace AM, McMahon AD, Packard CJ, et al. Plasma leptin and the risk of cardiovascular disease in the west of Scotland coronary prevention study (WOSCOPS). Circulation. 2001;104(25):3052–3056. doi:10.1161/hc5001.101061
20. Wannamethee SG, Lowe GDO, Rumley A, et al. Adipokines and risk of type 2 diabetes in older men. Diabetes Care. 2007;30(5):1200–1205. doi:10.2337/dc06-2416
21. Lana A, Struijk E, Guallar-Castillón P, et al. Leptin concentration and risk of impaired physical function in older adults: the seniors-ENRICA cohort. Age Ageing. 2016;45(6):819–826. doi:10.1093/ageing/afw142
22. Karvonen-Gutierrez CA, Zheng H, Mancuso P, et al. Higher leptin and adiponectin concentrations predict poorer performance-based physical functioning in midlife women: the Michigan study of women’s health across the nation. J Gerontol a Biol Sci Med Sci. 2016;71(4):508–514. doi:10.1093/gerona/glv123
23. Hsu BG, Wang C-H, Lai Y-H, et al. Elevated serum leptin levels are associated with low muscle strength and muscle quality in male patients undergoing chronic hemodialysis. Tzu Chi Med J. 2021;33(1):74–79. doi:10.4103/tcmj.tcmj_20_20
24. Lin YL, Wang CH, Lai YH, Kuo CH, Syu RJ, Hsu BG. Negative correlation between leptin serum levels and sarcopenia in hemodialysis patients. Int J Clin Exp Pathol. 2018;11(3):1715–1723.
25. Kao TW, Peng TC, Chen WL, Han DS, Chen CL, Yang WS. Impact of adiposity on muscle function and clinical events among elders with dynapenia, presarcopenia and sarcopenia: a community-based cross-sectional study. Aging (Albany NY). 2021;13:7247.
26. Roubenoff R. Applications of bioelectrical impedance analysis for body composition to epidemiologic studies. Am J Clin Nutr. 1996;64(3):459S–462S. doi:10.1093/ajcn/64.3.459S
27. Qu NN, Li KJ. Study on the reliability and validity of international physical activity questionnaire (Chinese Version, IPAQ). Zhonghua Liu Xing Bing Xue Za Zhi. 2004;25:265–268.
28. Ervin RB. Prevalence of metabolic syndrome among adults 20 years of age and over, by sex, age, race and ethnicity, and body mass index: United States, 2003–2006. Natl Health Stat Report. 2009;5(13):1–7.
29. Alberti KG, Eckel RH, Grundy SM, et al. Harmonizing the metabolic syndrome: a joint interim statement of the International Diabetes Federation Task Force on Epidemiology and Prevention; National Heart, Lung, and Blood Institute; American Heart Association; World Heart Federation; International Atherosclerosis Society; and International Association for the Study of Obesity. Circulation. 2009;120(16):1640–1645.
30. Valencak TG, Osterrieder A, Schulz TJ. Sex matters: the effects of biological sex on adipose tissue biology and energy metabolism. Redox Biol. 2017;12:806–813. doi:10.1016/j.redox.2017.04.012
31. Guerra B, Fuentes T, Delgado-Guerra S, et al. Gender dimorphism in skeletal muscle leptin receptors, serum leptin and insulin sensitivity. PLoS One. 2008;3(10):e3466. doi:10.1371/journal.pone.0003466
32. Rosenbaum M, Leibel RL. Clinical review 107: role of gonadal steroids in the sexual dimorphisms in body composition and circulating concentrations of leptin. J Clin Endocrinol Metab. 1999;84(6):1784–1789.
33. Kohara K, Ochi M, Tabara Y, et al. Leptin in sarcopenic visceral obesity: possible link between adipocytes and myocytes. PLoS One. 2011;6(9):e24633. doi:10.1371/journal.pone.0024633
34. Antony B, Jones G, Stannus O, Blizzard L, Ding C Body fat predicts an increase and limb muscle strength predicts a decrease in leptin in older adults over 2.6 years. Clin Endocrinol (Oxf). 2013;79(5):652–660.
35. Sainz N, Rodríguez A, Catalán V, et al. Leptin administration favors muscle mass accretion by decreasing FoxO3a and increasing PGC-1alpha in ob/ob mice. PLoS One. 2009;4(9):e6808. doi:10.1371/journal.pone.0006808
36. Hubbard RE, O’Mahony MS, Calver BL, et al. Nutrition, inflammation, and leptin levels in aging and frailty. J Am Geriatr Soc. 2008;56(2):279–284. doi:10.1111/j.1532-5415.2007.01548.x
37. Kara E, Ahbap E, Sahutoglu T, et al. Elevated serum leptin levels are associated with good nutritional status in non-obese chronic hemodialysis patients. Clin Nephrol. 2015;83(3):147–153. doi:10.5414/CN108409
38. Markaki A, Grammatikopoulou MG, Venihaki M, et al. Associations of adiponectin and leptin levels with protein-energy wasting, in end stage renal disease patients. Endocrinol Nutr. 2016;63(9):449–457. doi:10.1016/j.endonu.2016.07.003
39. Yang J. Enhanced skeletal muscle for effective glucose homeostasis. Prog Mol Biol Transl Sci. 2014;121:133–163.
40. Straight CR, Brady AO, Evans EM. Muscle quality and relative adiposity are the strongest predictors of lower-extremity physical function in older women. Maturitas. 2015;80(1):95–99. doi:10.1016/j.maturitas.2014.10.006
41. Sainz N, Barrenetxe J, Moreno-Aliaga MJ, et al. Leptin resistance and diet-induced obesity: central and peripheral actions of leptin. Metabolism. 2015;64(1):35–46. doi:10.1016/j.metabol.2014.10.015
 © 2021 The Author(s). This work is published and licensed by Dove Medical Press Limited. The full terms of this license are available at https://www.dovepress.com/terms.php and incorporate the Creative Commons Attribution - Non Commercial (unported, v3.0) License.
By accessing the work you hereby accept the Terms. Non-commercial uses of the work are permitted without any further permission from Dove Medical Press Limited, provided the work is properly attributed. For permission for commercial use of this work, please see paragraphs 4.2 and 5 of our Terms.
© 2021 The Author(s). This work is published and licensed by Dove Medical Press Limited. The full terms of this license are available at https://www.dovepress.com/terms.php and incorporate the Creative Commons Attribution - Non Commercial (unported, v3.0) License.
By accessing the work you hereby accept the Terms. Non-commercial uses of the work are permitted without any further permission from Dove Medical Press Limited, provided the work is properly attributed. For permission for commercial use of this work, please see paragraphs 4.2 and 5 of our Terms.