")
Back to Journals » International Journal of General Medicine » Volume 14
High STK40 Expression as an Independent Prognostic Biomarker and Correlated with Immune Infiltrates in Low-Grade Gliomas
Authors Pan H, Liu Q, Zhang F, Wang X, Wang S, Shi X
Received 24 August 2021
Accepted for publication 22 September 2021
Published 5 October 2021 Volume 2021:14 Pages 6389—6400
DOI https://doi.org/10.2147/IJGM.S335821
Checked for plagiarism Yes
Review by Single anonymous peer review
Peer reviewer comments 2
Editor who approved publication: Dr Scott Fraser
Heyue Pan,1,* Qirui Liu,2,* Fuchi Zhang,1 Xiaohua Wang,1 Shouyong Wang,1 Xiangsong Shi1
1Department of Neurology, The Third People’s Hospital of Huai’an, Huai’an, Jiangsu, 223001, People’s Republic of China; 2Department of Neurology, The Affiliated Hospital of Xuzhou Medical University, Xuzhou, Jiangsu, 221000, People’s Republic of China
*These authors contributed equally to this work
Correspondence: Xiangsong Shi; Shouyong Wang
Department of Neurology, The Third People’s Hospital of Huai’an, No. 272 Huaihai West Road, Huai’an, 223001, Jiangsu, People’s Republic of China
Tel +86-15861702210
; +86-13861583130
Email [email protected]; [email protected]
Background: Expression of STK40 is observed in some cancer types, while its role in low-grade gliomas (LGG) is unclear. The present study aimed to demonstrate the relationship between STK40 and LGG based on The Cancer Genome Atlas (TCGA) database and bioinformatics analysis.
Methods: Kruskal–Wallis test, Wilcoxon sign-rank test, and logistic regression were used to evaluate the relationship between clinicopathological features and STK40 expression. Kaplan–Meier method and Cox regression analysis were used to evaluate prognostic factors. Gene set enrichment analysis (GSEA) and immuno-infiltration analysis were used to determine the significant involvement of STK40 in function.
Results: High STK40 expression in LGG was associated with WHO grade (P< 0.001), IDH status (P< 0.001), primary therapy outcome (P=0.027), 1p/19q codeletion (P< 0.001) and histological type (P< 0.001). High STK40 expression predicted a poorer overall survival (OS) (HR: 3.07; 95% CI: 2.09– 4.51; P< 0.001), progression-free survival (PFS) (HR:2.11; 95% CI: 1.59– 2.81; P< 0.001) and disease specific survival (DSS) (HR: 3.27; 95% CI: 2.17– 4.92; P< 0.001). STK40 expression (HR: 2.284; 95% CI: 1.125– 4.637; P=0.022) was independently correlated with OS in LGG patients. GSEA demonstrated that pathways including cell cycle mitotic, neutrophil degranulation, signaling by Rho GTPases, signaling by interleukins, M phase, PI3K-Akt signaling pathway and naba secreted factors were differentially enriched in STK40 high expression phenotype. Immune infiltration analysis showed that STK40 expression was correlated with some types of immune infiltrating cells.
Conclusion: STK40 expression was significantly correlated with poor survival and immune infiltration in LGG, and it may be a promising prognostic biomarker in LGG.
Keywords: low-grade gliomas, serine/threonine kinase 40, immune infiltrates, prognosis, biomarker
Introduction
Gliomas are the most common intracranial tumor, accounting for approximately 70% of all primary brain tumors.1 In 2016, the WHO provided a molecular classification of gliomas and noted that molecular features have an important impact on the diagnosis and prognosis of gliomas.2 Gliomas are generally classified into low-grade gliomas (LGG) and glioblastoma multiforme (GBM).3 GBM is the most aggressive subtype of glioma, with a median overall survival (OS) of 12–16 months.4 LGG is less aggressive and the clinical outcome of LGG patients varies widely.5 In patients with LGG, gross total resection is associated with improved progression-free survival (PFS) and OS.6 The median survival time for patients with low-grade gliomas is approximately 5 to 10 years.7 Clear diagnosis and molecularly targeted therapy are important to improve the survival time and quality of life of patients with LGG. However, there are few valid and reliable biomarkers that can predict poor prognosis and direct treatment strategies in LGG. Therefore, it is of great importance to accurately predict the prognosis of LGG patients using novel and accessible biomarkers.
Serine/threonine kinase 40 (STK40), a target gene of transcriptional factor Oct4, is capable of activating the Erk/MAPK signaling pathway.8 Studies have shown that Stk40 deficiency leads to disturbances in adipogenesis, myogenesis, and erythropoiesis.9–11 STK40 could be a novel therapeutic target candidate for Triple-negative breast cancers (TNBC).12 However, the correlation between STK40 and LGG has not been studied. This study aims to explore the expression of STK40 in LGG, which may provide new directions for the development of diagnostic and therapeutic strategies for LGG.
Bioinformatics, as a science combining molecular biology and information technology, has discovered many clinically applicable tumor markers by studying the molecular mechanisms of diseases at the molecular level through data mining.13 These discoveries are important for improving the early diagnosis and prognosis of tumors and revealing the molecular mechanisms of tumor pathogenesis.14 In this study, the correlation between STK40 expression levels and clinicopathological features of LGG was explored based on the Cancer Genome Atlas (TCGA) database and LGG RNA-seq data in GTEx, comparing the difference in STK40 expression between tumor tissues and normal samples. The prognostic value of STK40 in LGG was assessed. Genomic enrichment analysis (GSEA) was performed on the high and low expression groups of STK40 to reveal its possible functions. By analyzing the correlation between STK40 expression and immune infiltration, the potential mechanisms by which STK40 regulates LGG occurrence and development were comprehensively explored and discussed.
Materials and Methods
Differential Expression of STK40
Baseline Information Sheet
The analysis method is described in the previous literature.15 Molecule: STK40[ENSG00000196182]. Data: RNAseq data and clinical data in level 3 HTSeq-FPKM format from the TCGA (https://portal.gdc.cancer.gov/) LGG project. Owing to the freely accessible resource TCGA database, the study let off the institutional review board approval of the ethics committee of The Third People’s Hospital of Huai’an. The authors are accountable for all aspects of the work in ensuring that questions related to the accuracy or integrity of any part of the work are appropriately investigated and resolved. The study was conducted in accordance with the Declaration of Helsinki (as revised in 2013). All data for this study were obtained from TCGA database and we did not obtain these data directly from patients or animals, nor did we intervene in these patients. Therefore, no ethical approval was necessary.
Unpaired Samples
The analysis method is described in the previous literature.15 Molecule: STK40. Data: UCSC XENA (https://xenabrowser.net/datapages/) RNAseq data in TPM format for TCGA and GTEx processed in unison by the Toil process.16 Extraction of LGG from TCGA and corresponding normal tissue data from GTEx.
ROC Analysis
The analysis method is described in the previous literature.15 Molecule: STK40. Data: UCSC XENA (https://xenabrowser.net/datapages/) RNAseq data in TPM format for TCGA and GTEx processed in unison by the Toil process.16 Extraction of LGG from TCGA and corresponding normal tissue data from GTEx.
The Relationship Between STK40 and Clinical Characteristics
Correlation of Gene Expression with Clinical Characteristics
The analysis method is described in the previous literature.15 Molecule: STK40. Clinical variables: WHO grade, 1p/19q codeletion, primary therapy outcome, IDH status, and histological type. Data: RNAseq data and clinical data in level 3 HTSeq-FPKM format from the TCGA LGG project.
Logistics Analysis
The analysis method is described in the previous literature.15 Dependent variable: STK40. Data: RNAseq data in level 3 HTSeq-FPKM format from the TCGA LGG project.
The Relationship Between STK40 and Prognosis
Kaplan–Meier Method
The analysis method is described in the previous literature.15,17 Molecule: STK40. Prognosis type: OS, PFS, and disease specific survival (DSS). Data: RNAseq data and clinical data in level 3 HTSeq-FPKM format from the TCGA LGG project.
COX Regression
The analysis method is described in the previous literature.17,18 Prognosis type: OS. Included variables: clinical characteristics and STK40. Data: RNAseq data and clinical data in level 3 HTSeq-FPKM format from the TCGA LGG project.
Forest Plot
The analysis method is described in the previous literature.18
Nomogram Plot
R package: rms package and survival package. Statistical method: Cox. Prognosis type: OS. Included variables: WHO grade, 1p/19q codeletion, primary therapy outcome, IDH status, age, histological type, and STK40. Data: RNAseq data and clinical data in level 3 HTSeq-FPKM format from the TCGA LGG project. Additional data: prognostic data from article.17
Gene Set Enrichment Analysis (GSEA)
Single Gene Differential Analysis
The analysis method is described in the previous literatures.18,19 Molecule: STK40. Data: RNAseq data in level 3 HTSeq-Counts format from the TCGA LGG project.
GSEA Analysis
The analysis method is described in the previous literatures.18,20,21
Immune Infiltration Analysis by ssGSEA
The analysis method is described in the previous literature.18,22,23 Molecule: STK40. Data: RNAseq data and clinical data in level 3 HTSeq-FPKM format from the TCGA LGG project.
Results
Clinical Characteristics
As shown in Table 1, a total of 528 patients were in this study. According to WHO grading, we had 224 patients of Grade II (48%) and 243 patients of Grade III (52%). According to the IDH status, we had 97 patients (WT, 18.5%) and 428 patients (Mut, 81.5%). According to the 1p/19q codeletion, we had 171 patients (codel, 32.4%), and 357 patients (non-codel, 67.6%). According to the 1p/19q codeletion, we had 110 patients (PD, 24%), 146 patients (SD, 31.9%), 64 patients (PR, 14%), and 138 patients (CR, 30.1%). According to the gender, we had 239 patients (female, 45.3%) and 289 patients (male, 54.7%). According to race, we had 487 white patients, 8 Asian patients, and 22 Black or African American patients. According to the age, we had 264 patients (≤40, 50%) and 264 patients (>40, 50%). According to the histological type, we had 195 patients (astrocytoma, 36.9%), 134 patients (oligoastrocytoma, 25.4%), and 199 patients (oligodendroglioma, 37.7%). According to the laterality, we had 256 patients (left, 48.9%), 6 patients (midline, 1.1%), and 261 patients (right, 49.9%). The age range was 32 to 53 years, with a median of 40.5 years.
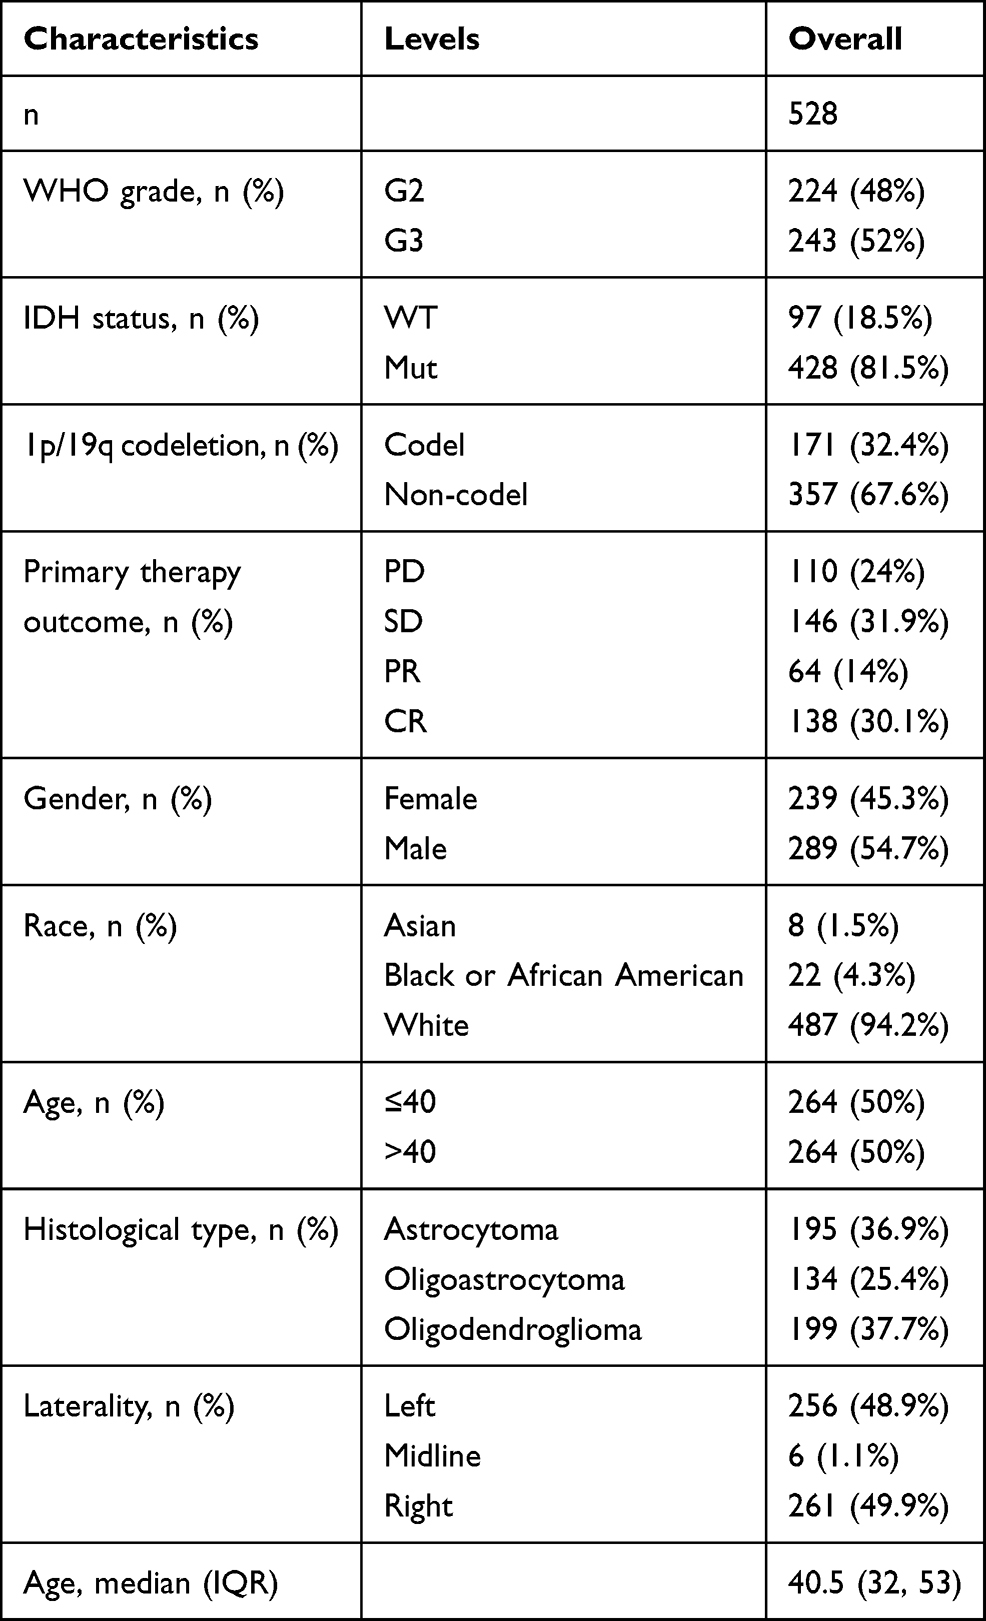 |
Table 1 Clinical Characteristics of the LGG Patients Based on TCGA |
STK40 Expression is Correlated with Poor Clinical Characteristics of LGG
As shown in Figure 1, it was found that STK40 was highly expressed in LGG tissues (3.535 ± 0.023 vs 4.117 ± 0.031, P<0.001) based on 523 LGG tissues and 1152 normal brain tissues of GTEx combined TCGA database. As shown in Table 2, STK40 expression was associated with WHO grade (P<0.001), IDH status (P<0.001), 1p/19q codeletion (P<0.001), primary therapy outcome (P<0.001) and histological type (P<0.001). As shown in Figure 2 and Table 3, STK40 was significantly related to WHO grade (P<0.001), IDH status (P<0.001), primary therapy outcome (P=0.027), 1p/19q codeletion (P< 0.001) and histological type (P<0.001).
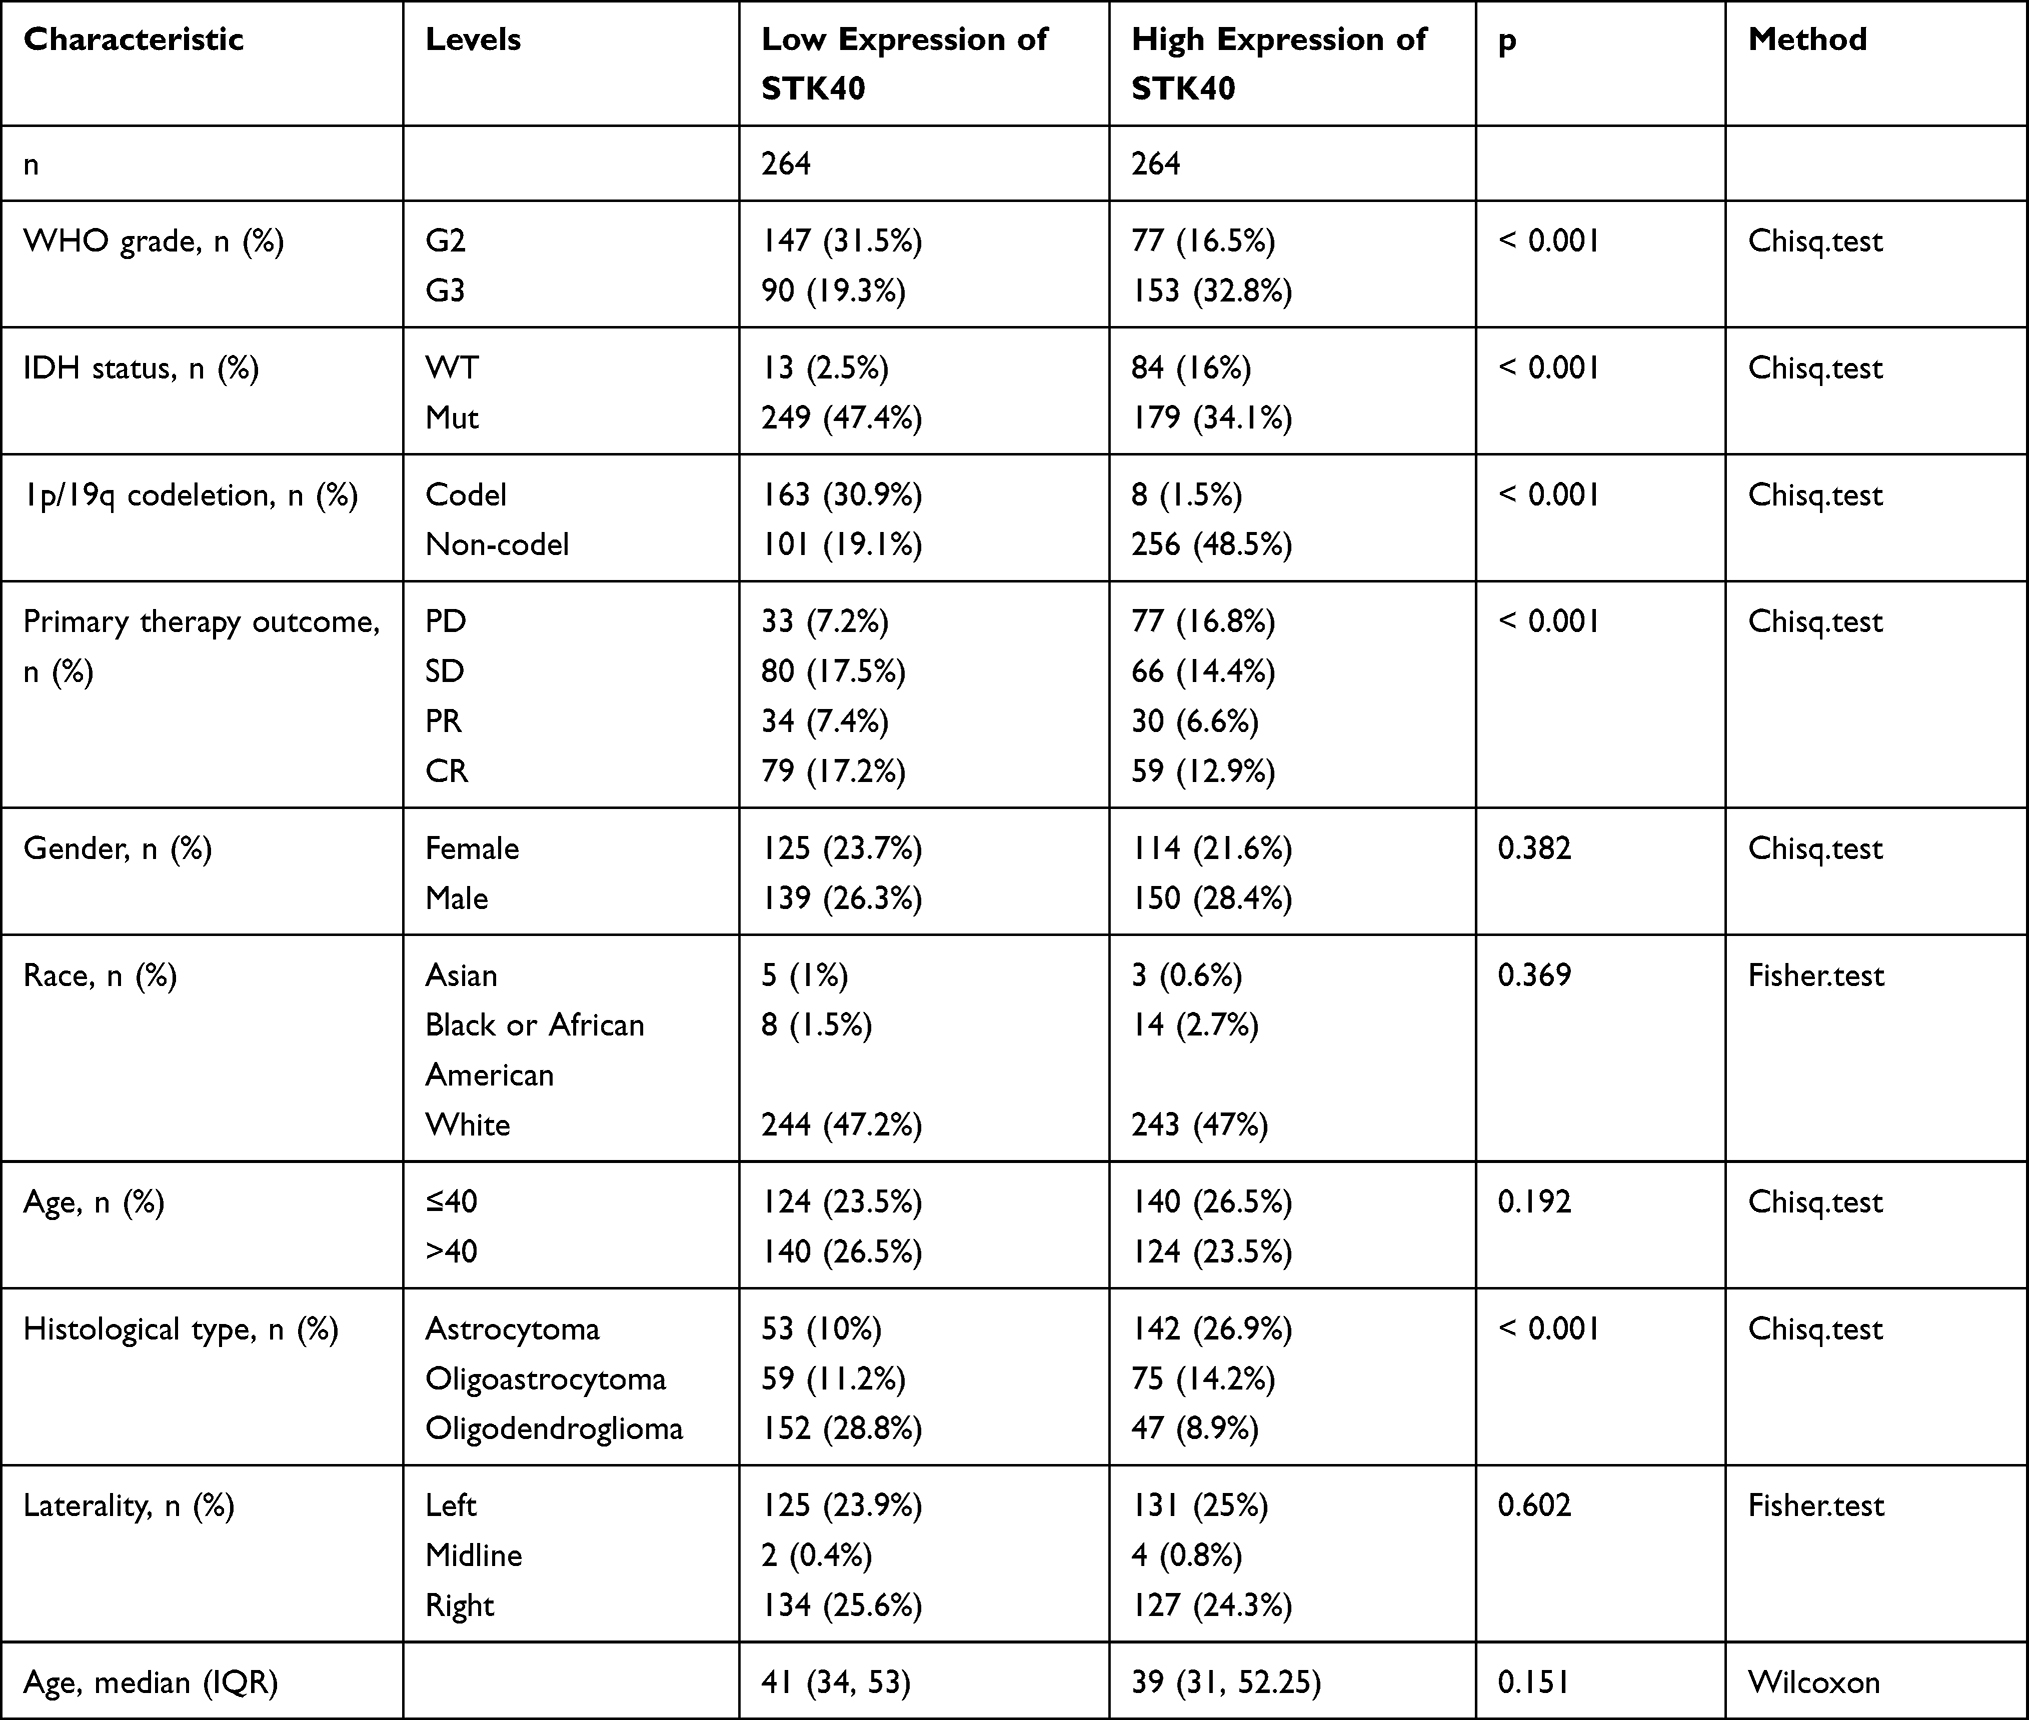 |
Table 2 Correlation Between STK40 Expression and Clinicopathological Characteristics in LGG |
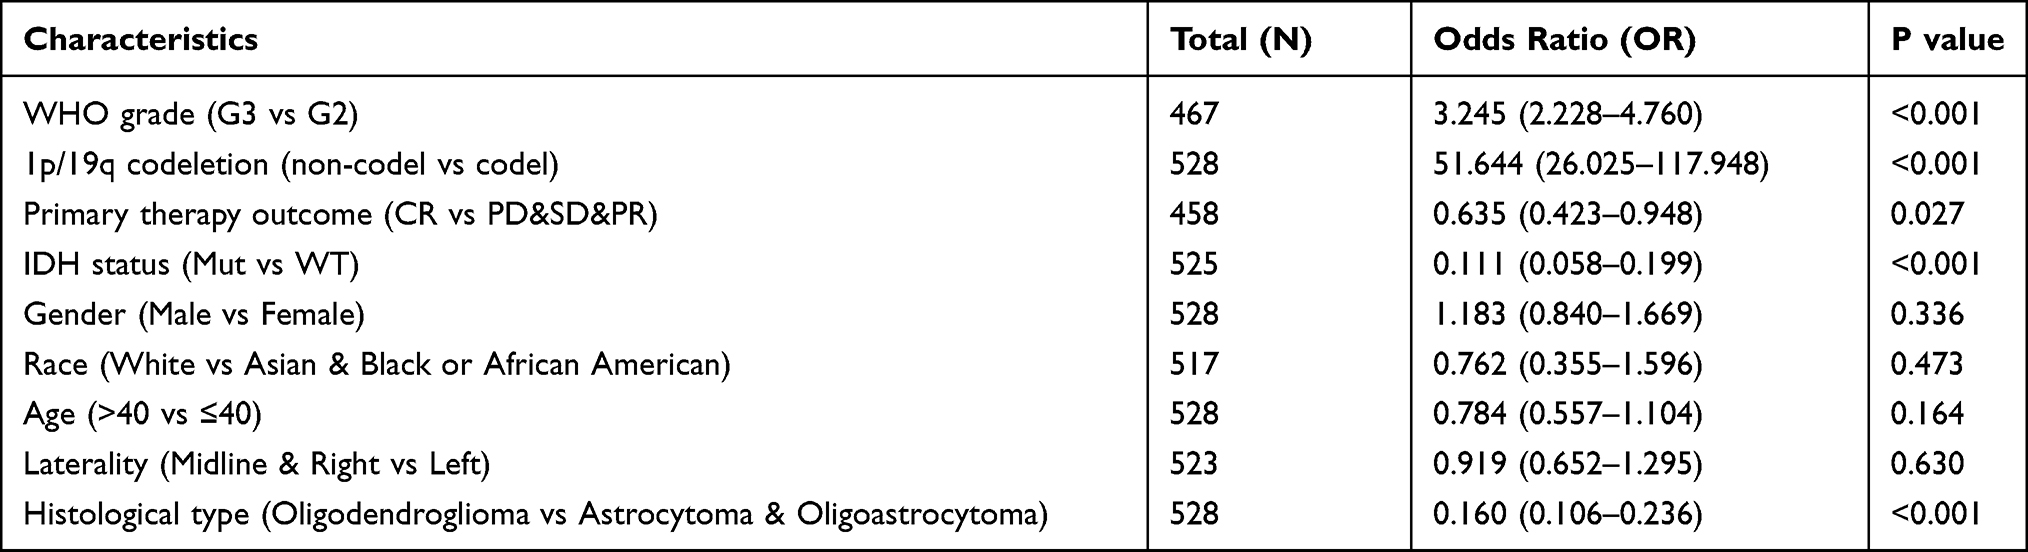 |
Table 3 Logistic Analysis of the Association Between STK40 Expression and Clinical Characteristics |
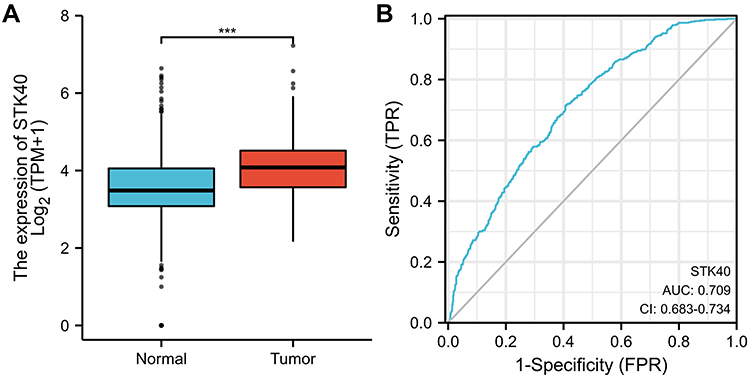 |
Figure 1 STK40 is significantly upregulated in LGG than normal tissues. (A) The difference expression of TLX1 in LUAD and unpaired normal lung tissues. (B) ROC curve. Significance markers: ***P<0.001. |
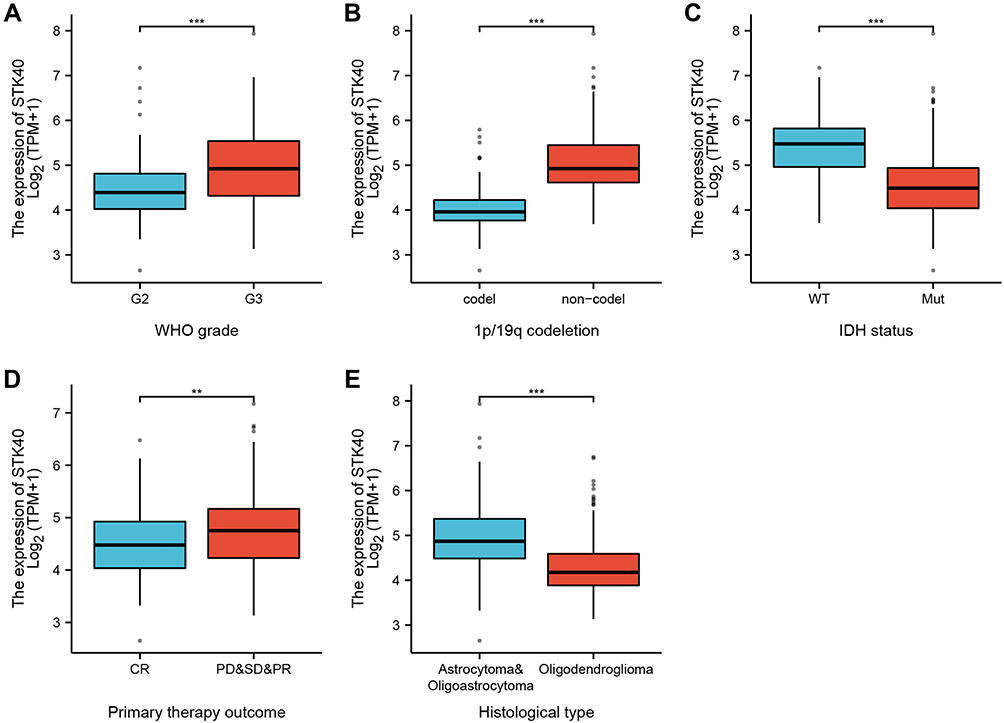 |
Figure 2 Box plot evaluating STK40 expression of patients with LGG according to different clinical characteristics. (A) WHO grade. (B) 1p/19q codeletion. (C) IDH status. (D) primary therapy outcome. (E) histological type. Significance markers: **P<0.01; ***P<0.001. |
Role of STK40 in LGG Patient Survival
As shown in Figure 3, STK40 was positively correlated with poor OS (HR: 3.07; 95% CI: 2.09–4.51; P<0.001), PFS (HR:2.11; 95% CI: 1.59–2.81; P<0.001), and Disease specific survival (DSS) (HR: 3.27; 95% CI: 2.17–4.92; P<0.001) of LGG patients. As shown in Table 4, high STK40 expression levels were associated with worse OS (HR: 3.07; 95% CI: 2.09–4.51; P<0.001), WHO grade (HR: 3.059; 95% CI: 2.046–4.573; P<0.001), 1p/19q codeletion (HR: 2.493; 95% CI: 1.590–3.910; P<0.001*), primary therapy outcome (HR: 0.203; 95% CI: 0.094–0.437; P<0.001), IDH status (HR: 0.186; 95% CI: 0.130–0.265; P<0.001), age (HR: 2.889; 95% CI: 2.009–4.155; P<0.001), histological type (HR: 0.673; 95% CI: 0.471–0.961; P=0.029). As shown in Table 4 and Figure 4, STK40 (HR: 2.284; 95% CI: 1.125–4.637; P=0.022), WHO grade (HR: 1.735; 95% CI: 1.073–2.808; P=0.025), primary therapy outcome (HR: 0.276; 95% CI: 0.127–0.601; P=0.001), IDH status (HR: 0.353; 95% CI: 0.215–0.580; P<0.001), age (HR: 3.315; 95% CI: 2.092–5.254; P<0.001) were independently correlated with OS in multivariate analysis. The above data indicated STK40 is a prognostic factor and increased STK40 level is associated with poor OS. A nomogram was constructed to predict the 1-, 3-, and 5-year survival probability of LGG patients by combining the expression level of STK40 with clinical variables (Figure 5).
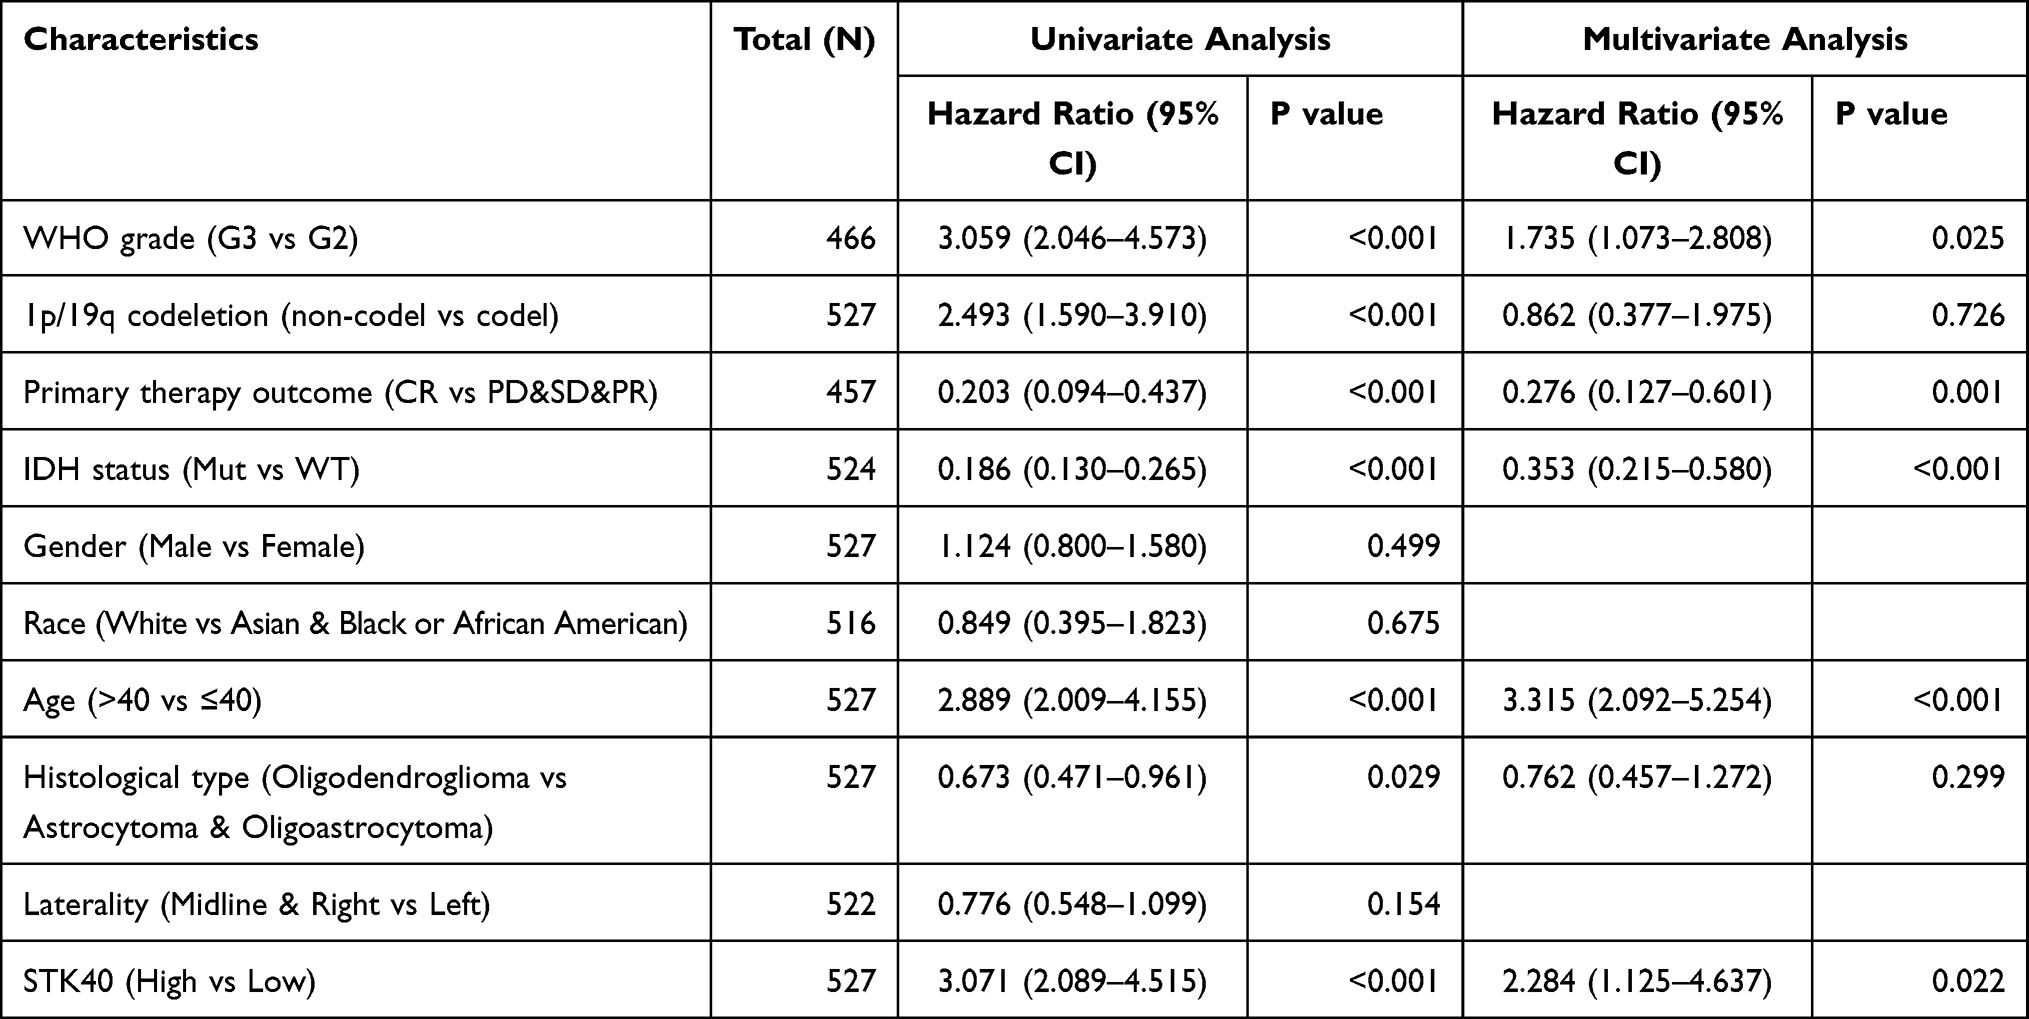 |
Table 4 Univariate and Multivariate Cox Regression Analyses of Clinical Characteristics Associated with OS |
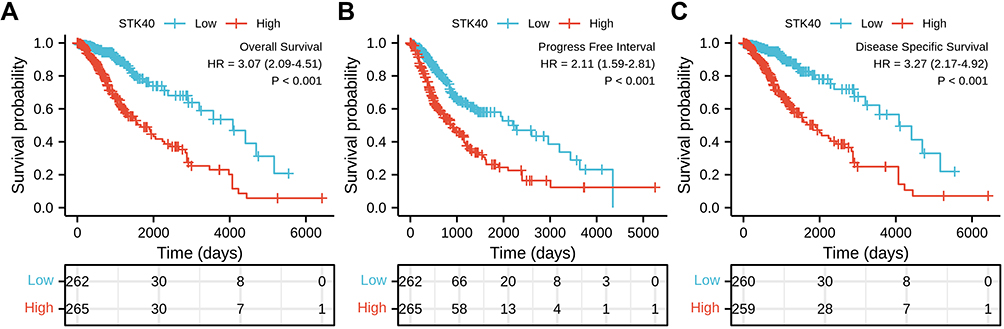 |
Figure 3 High expression of STK40 is associated with poor OS and DSS in patients with LGG. (A) The Kaplan–Meier curves and number at risk of OS in LGG. (B) The Kaplan–Meier curves and number at risk of PFS in LGG. (C) The Kaplan–Meier curves and number at risk of DSS in LGG. Abbreviations: OS, over survival; PFS, progress free interval; DSS, disease specific survival. |
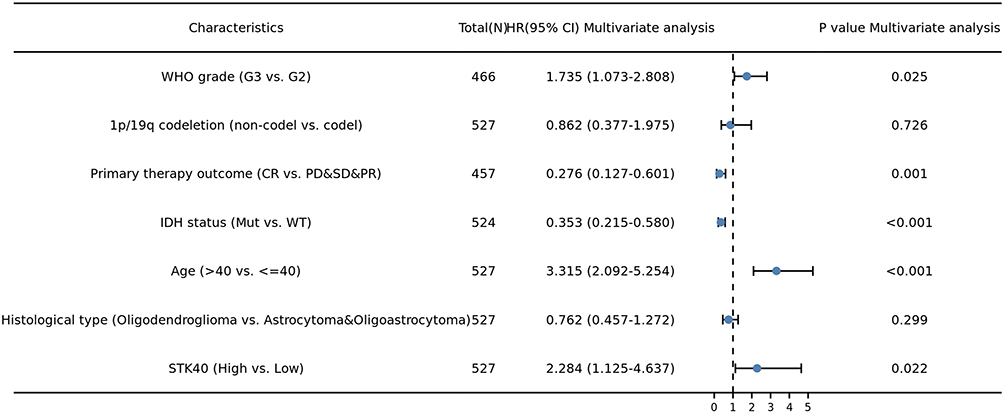 |
Figure 4 Forest plot of the multivariate Cox regression analysis for LGG. |
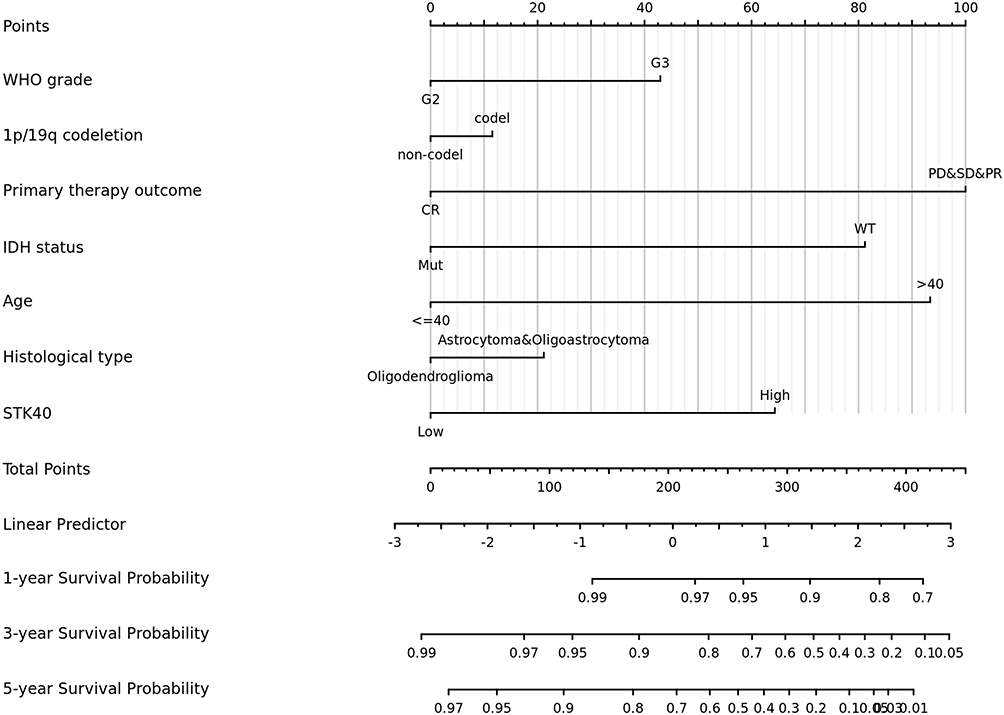 |
Figure 5 Nomogram for predicting the probability of patients with 1-, 3- and 5-year overall survival. |
STK40-Related Pathways Based on GSEA
There were 111 data sets which showed significantly differential enrichment in STK40 high expression phenotype, and we selected the top 9 data sets with high values of normalized enrichment score (NES), in Table 5 and Figure 6, including cell cycle mitotic, neutrophil degranulation, signaling by Rho GTPases, signaling by interleukins, M phase, Rho GTPase effectors, extracellular matrix organization, PI3K-Akt signaling pathway and naba secreted factors.
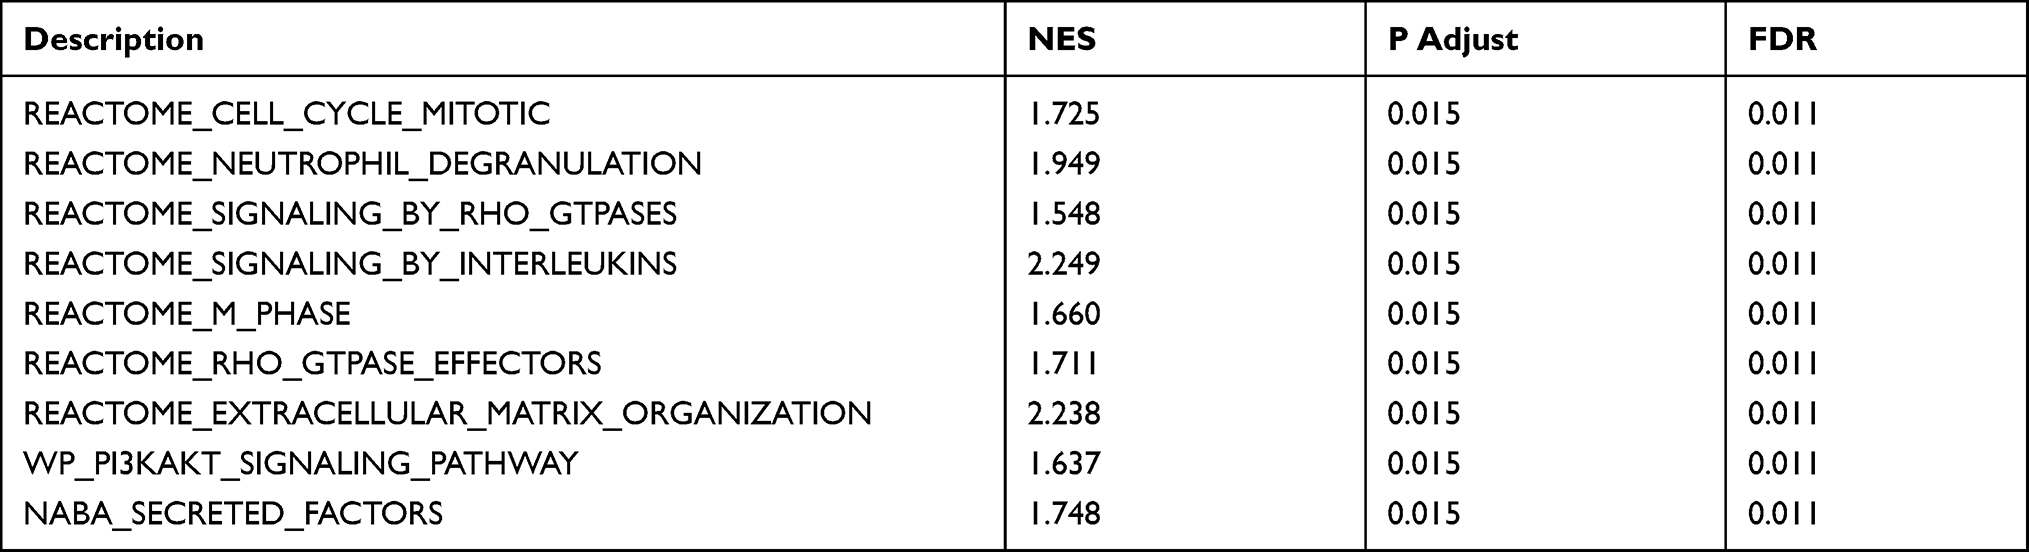 |
Table 5 Gene Sets Enriched in the High STK40 Expression Phenotype |
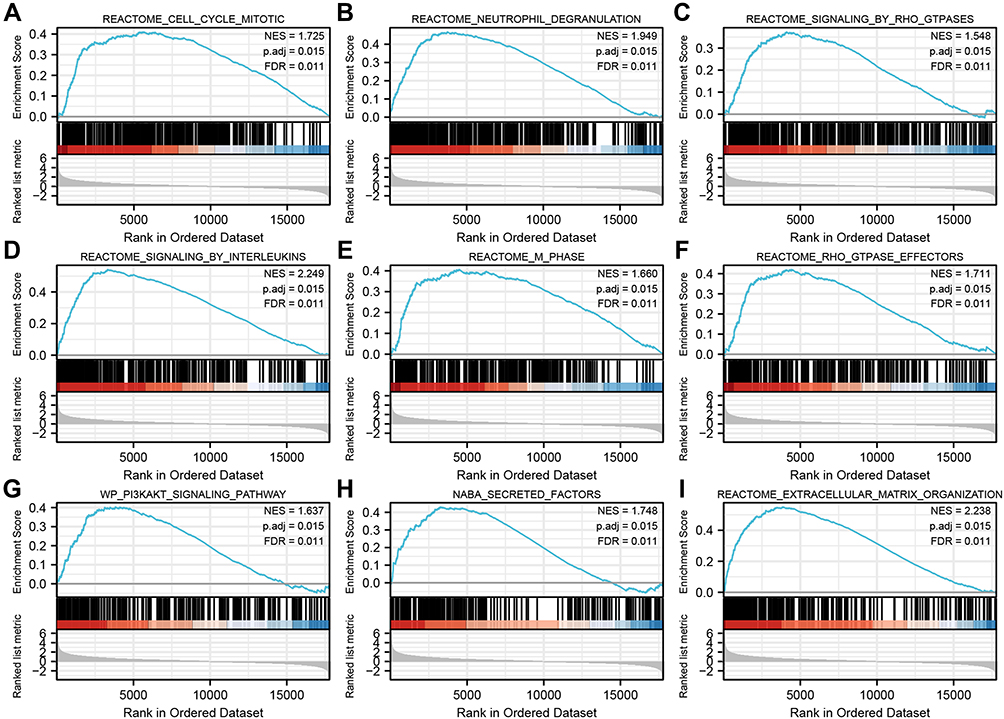 |
Figure 6 Enrichment plots from gene set enrichment analysis (GSEA). (A) neutrophil degranulation, (B) signaling by interleukins, (C) GPCR-ligand binding, (D) G alpha (I) signaling events, (E) VEGFAVEGFR-2 signaling pathway, (F) Class A 1 Rhodopsin-Like Receptors, (G) naba secreted factors, (H) PI3K-Akt signaling pathway, and (I) Focal Adhesion-PI3K-Akt-mTOR-signaling pathway, were differentially enriched in STK40-related OC. Abbreviations: NES, normalized ES; FDR, false discovery rate. |
The Correlation Between STK40 Expression and Immune Infiltration
The correlation between expression of STK40 and immune infiltration by ssGSEA with Spearman r in Figure 7 and Table 6 showed that STK40 expression was negatively correlated with infiltration levels of (P=0.001), NK CD56bright cells (P<0.001), pDC (Plasmacytoid DC) (P<0.001) and Treg (P<0.001), and positively correlated with that of aDC (activated DC) (P<0.001), B cells (P=0.002), cytotoxic cells (P<0.001), eosinophils (P<0.001), iDC (immature DC) (P<0.0018), macrophages (P<0.001), neutrophils (P<0.001), NK CD56dim cells (P<0.001), NK cells (P<0.001), T cells (P<0.001), T helper cells (P<0.001), Tem (T effector memory) (P=0.044), Tgd (T gamma delta) (P<0.001), Th1 cells (P=0.031), Th17 cells (P<0.001) and Th2 cells (P<0.001).
 |
Table 6 The Correlation Between STK40 Expression and Immune Cells Detected by Spearman Correlation Method |
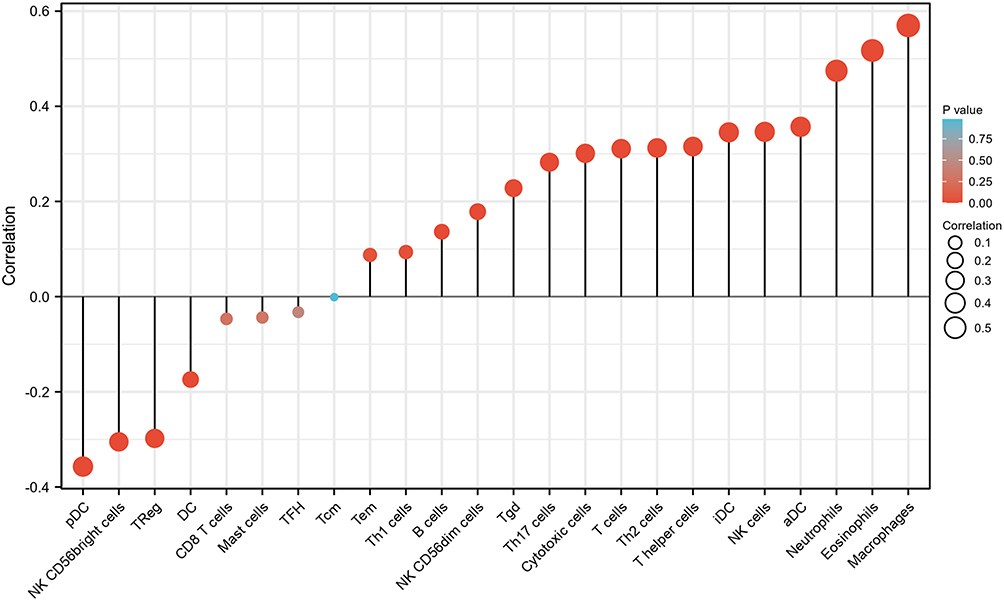 |
Figure 7 Correlation of STK40 expression levels with immune infiltration (Spearman r). Abbreviations: DC, dendritic cells; aDC, activated DC; iDC, immature DC; pDC, plasmacytoid DC; Tem, T effector memory; Tgd, T gamma delta. |
Discussion
With the development of molecular detection and sequencing technologies, the distinction between low-grade and high-grade gliomas has shifted from histology to molecular markers.24 KLF11 expression is an independent prognostic factor for poor survival in glioma patients.25 IRF7 could be a potential biomarker for the prognosis of LGG patients.26 APOB methylation may serve as a novel and promising prognostic biomarker for LGG patients.3 KIF4A, 9, 18A, 23 contribute to improved treatment and prognosis of LGG.27 The IRX1 gene exhibits oncogenic effects in glioma disease and may be clinically important as a future therapeutic target.28 SEMA3B is a potential target for the targeted treatment of gliomas.29 SASH1 expression was positively associated with better postoperative survival in glioma patients.30 Therefore, it is important to study mRNAs as new LGG biomarkers and therapeutic targets in the future.
STK40 is overexpressed in TNBC.12 In this study, High STK40 expression in LGG was associated with WHO grade (P< 0.001), IDH status (P< 0.001), primary therapy outcome (P=0.027), 1p/19q codeletion (P< 0.001) and histological type (P< 0.001). LGG expressed more STK40 than adjacent brain tissue, especially in patients with high grade (G3). These phenomena suggested that STK40 may be involved in tumorigenesis and promote proliferation. Primary therapy outcome (PD&SD&PR) may be due to a large tumor burden due to high STK40. ELF3 expression was high in LGG patients with WT IDH status and non-codel 1p/19q codeletion, the reasons for which need to be further investigated. High STK40 expression predicted a poorer OS (HR: 3.07; 95% CI: 2.09–4.51; P<0.001), PFS (HR:2.11; 95% CI: 1.59–2.81; P<0.001) and DSS (HR: 3.27; 95% CI: 2.17–4.92; P<0.001). And STK40 expression (HR: 2.284; 95% CI: 1.125–4.637; P=0.022) was independently correlated with OS in LGG patients.
The miR-31 target Stk40 was de-inhibited, thereby inhibiting the STK40-NF-κΒ-controlled inflammatory pathway, with the result that cell proliferation was reduced and apoptosis was activated in esophageal squamous cell carcinoma (ESCC).31 STK40 is a pseudokinase that binds the E3 biotin ligase COP1.32 STK40 is one of two genes specifically down-regulated shortly after LRP5 depletion.12 In this study, based on GESA, STK40 was related to pathways including cell cycle mitotic, neutrophil degranulation, signaling by Rho GTPases, signaling by Interleukins, M phase, Rho GTPase effectors, extracellular matrix organization, PI3K-Akt signaling pathway and naba secreted factors.
Another important aspect of this study was to investigate the relationship between STK40 expression and the level of diverse immune infiltration in LGG. Immune infiltration with LGG is currently a hot topic and knowledge of immune infiltrating cells is beneficial to the development of immunotherapy for LGG. The results showed modest correlations between STK40 expression and infiltration levels of DC, NK CD56bright cells, pDC and Treg, aDC, B cells, cytotoxic cells, eosinophils, iDC, macrophages, neutrophils, NK CD56dim cells, NK cells, T cells, T helper cells, Tem, Tgd, Th1 cells, Th17 cells and Th2 cells in LGG. These correlations may suggest potential mechanisms by which STK40 inhibits the function of DC, NK CD56bright cells, pDC, and Treg, and subsequently promotes the function of aDC, B cells, cytotoxic cells, eosinophils, iDC, macrophages, neutrophils, NK CD56dim cells, NK cells, T cells, T helper cells, Tem, Tgd, Th1 cells, Th17 cells and Th2 cells.
Despite some limitations, this is the first work to explore the relationship between STK40 and LGG. This study was performed based on RNA sequencing from the TCGA database. We were unable to illustrate the expression of STK40 at the protein level or to clearly evaluate the direct mechanism of STK40 involvement in LGG. However, the results of bioinformatics analysis need to be demonstrated by some experiments. Further studies are needed regarding the direct mechanism of STK40-mediated LGG.
Conclusion
STK40 was highly expressed in LGG relative to normal tissue and related to poor OS, PFS, and DSS. STK40 might participate in the development of LGG by pathways including cell cycle mitotic, neutrophil degranulation, signaling by Rho GTPases, signaling by interleukins, M phase, Rho GTPase effectors, extracellular matrix organization, PI3K-Akt signaling pathway and naba secreted factors and immune infiltrating cells. This study partly revealed the role of STK40 in LGG, providing a potential biomarker for the diagnosis and prognosis of LGG.
Data Sharing Statement
All data generated or analyzed during this study are included in this article.
Acknowledgments
The authors thank TCGA for providing the data.
Author Contributions
All authors made a significant contribution to the work reported, whether that is in the conception, study design, execution, acquisition of data, analysis and interpretation, or in all these areas; took part in drafting, revising or critically reviewing the article; gave final approval of the version to be published; have agreed on the journal to which the article has been submitted; and agree to be accountable for all aspects of the work.
Funding
There is no funding to report.
Disclosure
The authors declare that they have no competing interests.
References
1. Ostrom QT, Bauchet L, Davis FG, et al. The epidemiology of glioma in adults: a “state of the science” review. Neuro Oncol. 2014;16(7):896–913. doi:10.1093/neuonc/nou087
2. Louis DN, Perry A, Reifenberger G, et al. The 2016 World Health Organization classification of tumors of the central nervous system: a summary. Acta Neuropathol. 2016;131(6):803–820. doi:10.1007/s00401-016-1545-1
3. Han C, He Y, Chen L, et al. Low expression of APOB mRNA or its hypermethylation predicts favorable overall survival in patients with low-grade glioma. Onco Targets Ther. 2020;13:7243–7255. doi:10.2147/OTT.S257794
4. Wen PY, Kesari S. Malignant gliomas in adults. N Engl J Med. 2008;359(5):492–507. doi:10.1056/NEJMra0708126
5. Huang SP, Chan YC, Huang SY, Lin YF. Overexpression of PSAT1 gene is a favorable prognostic marker in lower-grade gliomas and predicts a favorable outcome in patients with IDH1 mutations and chromosome 1p19q codeletion. Cancers. 2019;12(1):13. doi:10.3390/cancers12010013
6. Smith JS, Chang EF, Lamborn KR, et al. Role of extent of resection in the long-term outcome of low-grade hemispheric gliomas. J Clin Oncol. 2008;26(8):1338–1345. doi:10.1200/JCO.2007.13.9337
7. Claus EB, Black PM. Survival rates and patterns of care for patients diagnosed with supratentorial low-grade gliomas: data from the SEER program, 1973-2001. Cancer. 2006;106(6):1358–1363. doi:10.1002/cncr.21733
8. Li L, Sun L, Gao F, et al. Stk40 links the pluripotency factor Oct4 to the Erk/MAPK pathway and controls extraembryonic endoderm differentiation. Proc Natl Acad Sci USA. 2010;107(4):1402–1407. doi:10.1073/pnas.0905657107
9. Yu H, He K, Wang L, et al. Stk40 represses adipogenesis through translational control of CCAAT/enhancer-binding proteins. J Cell Sci. 2015;128(15):2881–2890.
10. He K, Hu J, Yu H, et al. Serine/Threonine Kinase 40 (Stk40) functions as a novel regulator of skeletal muscle differentiation. J Biol Chem. 2017;292(1):351–360. doi:10.1074/jbc.M116.719849
11. Wang L, Yu H, Cheng H, et al. Deletion of Stk40 impairs definitive erythropoiesis in the mouse fetal liver. Cell Death Dis. 2017;8(3):e2722. doi:10.1038/cddis.2017.148
12. Maubant S, Tahtouh T, Brisson A, et al. LRP5 regulates the expression of STK40, a new potential target in triple-negative breast cancers. Oncotarget. 2018;9(32):22586–22604. doi:10.18632/oncotarget.25187
13. Li S, Yang R, Sun X, et al. Identification of SPP1 as a promising biomarker to predict clinical outcome of lung adenocarcinoma individuals. Gene. 2018;679:398–404. doi:10.1016/j.gene.2018.09.030
14. Shen Y, Liu J, Zhang L, et al. Identification of potential biomarkers and survival analysis for head and neck squamous cell carcinoma using bioinformatics strategy: a study based on TCGA and GEO datasets. Biomed Res Int. 2019;2019:7376034. doi:10.1155/2019/7376034
15. Lu X, Li G, Liu S, Wang H, Zhang Z, Chen B. Bioinformatics analysis of KIF1A expression and gene regulation network in ovarian carcinoma. Int J Gen Med. 2021;14:3707–3717. doi:10.2147/IJGM.S323591
16. Vivian J, Rao AA, Nothaft FA, et al. Toil enables reproducible, open source, big biomedical data analyses. Nat Biotechnol. 2017;35(4):314–316. doi:10.1038/nbt.3772
17. Liu J, Lichtenberg T, Hoadley KA, et al. An integrated TCGA pan-cancer clinical data resource to drive high-quality survival outcome analytics. Cell. 2018;173(2):400–416.e411.
18. Xu H, Wang H, Li G, Jin X, Chen B. The immune-related gene ELF3 is a novel biomarker for the prognosis of ovarian cancer. Int J Gen Med. 2021;14:5537–5548. doi:10.2147/IJGM.S332320
19. Love MI, Huber W, Anders S. Moderated estimation of fold change and dispersion for RNA-seq data with DESeq2. Genome Biol. 2014;15(12):550. doi:10.1186/s13059-014-0550-8
20. Yu G, Wang LG, Han Y, He QY. clusterProfiler: an R package for comparing biological themes among gene clusters. Omics. 2012;16(5):284–287. doi:10.1089/omi.2011.0118
21. Subramanian A, Tamayo P, Mootha VK, et al. Gene set enrichment analysis: a knowledge-based approach for interpreting genome-wide expression profiles. Proc Natl Acad Sci U S A. 2005;102(43):15545–15550. doi:10.1073/pnas.0506580102
22. Hänzelmann S, Castelo R, Guinney J. GSVA: gene set variation analysis for microarray and RNA-seq data. BMC Bioinform. 2013;14:7. doi:10.1186/1471-2105-14-7
23. Bindea G, Mlecnik B, Tosolini M, et al. Spatiotemporal dynamics of intratumoral immune cells reveal the immune landscape in human cancer. Immunity. 2013;39(4):782–795. doi:10.1016/j.immuni.2013.10.003
24. Young JS, Prados MD, Butowski N. Using genomics to guide treatment for glioblastoma. Pharmacogenomics. 2018;19(15):1217–1229. doi:10.2217/pgs-2018-0078
25. Xi Z, Zhang R, Zhang F, Ma S, Feng T. KLF11 expression predicts poor prognosis in glioma patients. Int J Gen Med. 2021;14:2923–2929. doi:10.2147/IJGM.S307784
26. Peng S, Wang G, Cheng Z, Guo Z. IRF7 as an immune-related prognostic biomarker and associated with tumor microenvironment in low-grade glioma. Int J Gen Med. 2021;14:4381–4393. doi:10.2147/IJGM.S324307
27. Cho SY, Kim S, Kim G, Singh P, Kim DW. Integrative analysis of KIF4A, 9, 18A, and 23 and their clinical significance in low-grade glioma and glioblastoma. Sci Rep. 2019;9(1):4599. doi:10.1038/s41598-018-37622-3
28. Zhang P, Liu N, Xu X, et al. Clinical significance of Iroquois Homeobox Gene - IRX1 in human glioma. Mol Med Rep. 2018;17(3):4651–4656.
29. Pang CH, Du W, Long J, Song LJ. Mechanism of SEMA3B gene silencing and clinical significance in glioma. Genet Mol Res. 2016;15(1). doi:10.4238/gmr.15017664
30. Yang L, Zhang H, Yao Q, Yan Y, Wu R, Liu M. Clinical significance of SASH1 expression in glioma. Dis Markers. 2015;2015:383046. doi:10.1155/2015/383046
31. Taccioli C, Garofalo M, Chen H, et al. Repression of esophageal neoplasia and inflammatory signaling by anti-miR-31 delivery in vivo. J Natl Cancer Inst. 2015;107(11):djv220. doi:10.1093/jnci/djv220
32. Durzynska I, Xu X, Adelmant G, et al. STK40 is a pseudokinase that binds the E3 ubiquitin ligase COP1. Structure. 2017;25(2):287–294. doi:10.1016/j.str.2016.12.008
 © 2021 The Author(s). This work is published and licensed by Dove Medical Press Limited. The full terms of this license are available at https://www.dovepress.com/terms.php and incorporate the Creative Commons Attribution - Non Commercial (unported, v3.0) License.
By accessing the work you hereby accept the Terms. Non-commercial uses of the work are permitted without any further permission from Dove Medical Press Limited, provided the work is properly attributed. For permission for commercial use of this work, please see paragraphs 4.2 and 5 of our Terms.
© 2021 The Author(s). This work is published and licensed by Dove Medical Press Limited. The full terms of this license are available at https://www.dovepress.com/terms.php and incorporate the Creative Commons Attribution - Non Commercial (unported, v3.0) License.
By accessing the work you hereby accept the Terms. Non-commercial uses of the work are permitted without any further permission from Dove Medical Press Limited, provided the work is properly attributed. For permission for commercial use of this work, please see paragraphs 4.2 and 5 of our Terms.