")
Back to Journals » Diabetes, Metabolic Syndrome and Obesity » Volume 14
High Prevalence of Obesity but Low Physical Activity in Children Aged 9–11 Years in Beijing
Authors Liu M , Cao B, Liu M, Liang X, Wu D, Li W, Su C, Chen J, Gong C
Received 13 May 2021
Accepted for publication 6 July 2021
Published 20 July 2021 Volume 2021:14 Pages 3323—3335
DOI https://doi.org/10.2147/DMSO.S319583
Checked for plagiarism Yes
Review by Single anonymous peer review
Peer reviewer comments 2
Editor who approved publication: Prof. Dr. Antonio Brunetti
Meijuan Liu, Bingyan Cao, Min Liu, Xuejun Liang, Di Wu, Wenjing Li, Chang Su, Jiajia Chen, Chunxiu Gong
Department of Endocrinology, Genetics and Metabolism, Beijing Children’s Hospital, Capital Medical University, National Center for Children’s Health, Beijing, People’s Republic of China
Correspondence: Chunxiu Gong
Department of Endocrinology, Genetics and Metabolism, Beijing Children’s Hospital, Capital Medical University, National Center for Children’s Health, Beijing, 100045, People’s Republic of China
Tel +86-10-59616161
Email [email protected]
Objective: To investigate the prevalence and associated factors of childhood overweight/obesity in the Shunyi district of Beijing, China.
Methods: This study adopted a cross-sectional survey and included 10,855 children aged 6– 18 years in the Shunyi district of Beijing, China. Analyses were stratified by age group (6– 8, 9– 11, 12– 14, and 15– 18 years).
Results: The prevalence of overweight and obesity among children aged 6– 18 years was high with 17.62% and 29.05% in boys, 17.57% and 18.04% in girls, respectively. Both boys and girls aged 9– 11 years had the highest rate of obesity in comparison with the other age groups, though the differences in children aged 9– 11 years and 12– 14 years were not statistically significant. Compared with age 6– 8 years, age 9– 11 years (OR=1.59, 95% CI 1.41– 1.79, P< 0.01) and 12– 14 years (OR=1.26, 95% CI 1.48– 1.73, P< 0.01) were independently positively associated with obesity. Importantly, in all subjects, the percentages of being physically active (exercise time ≥ 120 minutes/week) were lower in children aged 9– 11 years in comparison to children in other age groups. This phenomenon remained when this comparison was performed respectively in the normal-weight, overweight, and obesity groups. Even after adjustment for other potential confounders, the probability of being physically active (exercise time ≥ 120 minutes/week) was lower in children aged 9– 11 years (OR=0.86, 95% CI 0.78– 0.94, P< 0.01), but higher in children aged 12– 14 years (OR=1.91, 95% CI 1.69– 2.17, P< 0.01) and aged 15– 18 years (OR=2.22, 95% CI 1.85– 2.66, P< 0.01), when compared with children aged 6– 8 years.
Conclusion: Children aged 9– 11 years had a higher prevalence of obesity, but a lower percentage of being physically active. Targeted intervention programs in this key group are needed to address this problem in China.
Keywords: overweight, obesity, prevalence, risk factors, exercise time
Introduction
Childhood overweight and obesity have reached an alarming level that mandates urgent action. According to the data collected from the China Health and Nutrition Survey (CHNS), the prevalence of overweight and obesity among children increased rapidly between 1997–2011, from 6.5% to 15.5% in boys and from 4.6% to 10.4% in girls, respectively.1 It is widely known that childhood overweight and obesity are associated with a variety of adverse consequences, including comorbidities in pulmonary, cardiovascular, gastrointestinal, renal, endocrine, dermatologic, orthopedic, neurologic, etc.2–4 It is worth noting that with the increased prevalence of childhood overweight and obesity, the associated comorbidities have also increased.4 Based on a multiyear data file of the National Hospital Discharge Survey in the USA, from 1979–1981 to 1997–1999, obesity-associated annual hospital costs increased more than threefold.5 Many factors contribute to the development of childhood obesity, which can be divided into two groups, unmodifiable factors (eg, genetic factor, endocrine disorders) and modifiable factors (eg, parental determinants, individual lifestyle, socioeconomic status). It is thus imperative to make a comprehensive view of the risk factors to assist with performing effective intervention and prevention strategies for overweight and obesity among children.
Previous studies have suggested that the prevalence of childhood overweight and obesity could be varied in different age span. In Egypt, Abdelkarim showed that children aged 9–11 years had a higher prevalence of overweight than those aged 6–8 years old.6 Similarly, in the USA, Ogden et al reported a significant decrease in the obesity rate in children aged 2–5 years old compared with children aged 6–11 years and 12–19 years old.7 Up to now, in China, several studies have examined the prevalence of childhood overweight and obesity in some provinces and cities, such as Harbin,8 Jiangsu,9,10 Shandong,11–13 Guangdong,14 etc. Beijing is the capital and one of the most urbanized cities in China. However, only a few studies have investigated the prevalence of childhood overweight and obesity, especially in different periods of childhood. Shan et al studied in a total of 21,198 children aged 2–18 years in Beijing found that over 20% of children in Beijing were overweight or obese.15 Additionally, they also reported that physical inactivity was one of the key contributors to the increasing prevalence levels of childhood overweight and obesity.15 There is a plethora of evidence assessing the association between physical activity and overweight/obesity in different age groups in childhood.16–18 However, evidence in the same study population is also lacking to determine if the association between physical activity and overweight/obesity varies in different age groups in childhood.
With these issues in mind, the objectives of the present study were: (1) to estimate the prevalence of childhood overweight/obesity, especially in different periods of childhood; (2) to assess the contributing factors associated with overweight/obesity; (3) to explore the association between physical activity and overweight/obesity in different age groups in childhood. In our study, overweight was defined as BMI >85th but ≤95th, whereas obesity was defined as BMI >95th, which according to age- and sex-specific BMI cut-off points proposed by the Working Group for Obesity in China (WGOC).19 We found that children aged 9–11 years had a higher prevalence of obesity, but a lower percentage of being physically active. Our results may be important for taking more targeted and flexible intervention strategies for childhood overweight and obesity in the future.
Methods
Study Population
Data for this study were obtained from a cross-sectional survey on students’ constitution and health that was carried out in the Shunyi district of Beijing, China. The survey covered nine primary schools and five secondary schools. All participants answered a self‐reported questionnaire and underwent physical examinations. Participants who did not complete the questions in the questionnaires, or did not sign the informed consent were excluded from the study. After these exclusions, a total of 10,855 students (5500 boys and 5355 girls) aged 6–18 years (4179 aged 6–8 years, 3382 aged 9–11 years, 2341 aged 12–14 years, 953 aged 15–18 years) were recruited in this study. The study was performed according to the Helsinki Declaration and was approved by the ethics committee of Beijing Children’s Hospital, Capital Medical University. All subjects voluntarily joined this study were informed about the interview process and underwent a verbal and written informed consent process. Written informed consent was received from all children and their parents before they participating in the study.
Anthropometric Measurements and Definitions
Body weight and height of all children and their parents were measured by well-trained health staff by using the same type of apparatus and following the same procedures. Briefly, body weight was measured using a scale (Tanita HA 503, Tanita Corporation, Tokyo, Japan) to the nearest 0.1 kg with subjects wearing lightweight clothing. Height was measured with a portable Seca 213 stadiometer (Seca GmbH, Hamburg, Germany) to the nearest 0.1 cm with subjects in standing position, wearing no shoes. Two measurements were obtained and the average was used for the analysis (a third measurement was obtained if the first two measurements were more than 0.2 kg or 0.2 cm, for body weight and height, respectively, and the closest two were averaged for analysis). Body mass index (BMI) was calculated as the weight in kilograms divided by the height in meters squared (kg/m2). For children, overweight was defined as BMI >85th but ≤95th, whereas obesity was defined as BMI >95th, which according to age- and sex-specific BMI cut-off points recommended by the WGOC.19 For parents, obesity was defined as the BMI ≥ 28 kg/m2.20
Questionnaire
Self-reported questionnaires collected information on parental determinants, individual lifestyle, and socioeconomic status was filled out by parents. It included questions about the children’s age, gender, parent’s BMI (obesity vs not obesity),20 parent’s education level (primary school vs high school vs university degree vs graduate degree),21 mother’s glucose level during pregnancy (high vs normal), infant breast feeding (yes vs no), birth weight (≥4 kg vs <4 kg), household income (<10 ten thousand yuan/year vs 10–20 ten thousand yuan/year vs 20–30 ten thousand yuan/year vs >30 ten thousand yuan/year), siblings (yes vs no), frequency of breakfast (<4 times/weeks vs ≥4 times/week),22 having breakfast at home (yes vs no), having dinner with parents (yes vs no), frequency of restaurant (<3 times/weeks vs ≥3 times/week), watching TV (<2 hours/day vs ≥2 hours/day),23 frequency of exercise (never vs 1–3 times/week vs 4–6 times/week vs every day),24 exercise time (<90 minutes/week, 90–120 minutes/week, 120–150 minutes/week, ≥ 150 minutes/week), and sleep duration (<9 hours/day vs ≥9 hours/day).25 Mother’s high glucose levels during pregnancy were referred to those who were diagnosed as gestational diabetes mellitus during pregnancy. All questionnaires were checked for completeness at the time of collection to ensure high-quality data.
Statistical Analyses
All values were expressed as percentages, and comparisons were assessed by the χ2 test. Bivariate regression analysis, where a binary variable (either overweight and normal or obesity and normal weight) was used as the dependent variable and the potential contributing factors were used as independent variables was used to assess the associations between overweight/obesity and the potential contributing factors. The odds ratios (Ors) and the 95% confidence intervals (CIs) were obtained with forwarding stepwise regression. Univariate and multivariate logistic regression analyses were performed to estimate the association between different age groups and exercise time. In our analysis, children aged 6–8 years were the reference category and were compared with children aged 9–11 years, 12–14 years, and children aged 15–18 years. Multiple variables as potential confounders were adjusted in a series of models. Model 1 was adjusted for gender and body weight (normal, overweight, obesity). Model 2 was additionally adjusted for other potential confounders including father BMI (obesity or not obesity), father’s education (primary school, high school, university degree or graduate degree), mother BMI (obesity or not obesity), mother’s education (primary school, high school, university degree or graduate degree), mother’s glucose level during pregnancy (high or normal), infant breastfeeding (yes or no), birth weight ≥4 kg (yes or no), household income (<10 ten thousand yuan/year or 10–20 ten thousand yuan/year or 20–30 ten thousand yuan/year or >30 ten thousand yuan/year) and siblings (yes or no). Model 3 was additionally adjusted lifestyle confounders, including frequency of breakfast (<4 times/weeks or ≥4 times/week), having breakfast at home (yes or no), having dinner with parents (yes or no), frequency of restaurant (<3 times/weeks or ≥3 times/week), watching TV (<2 hours/day or ≥2 hours/day) and sleep duration (<9 hours/day or ≥9 hours/day). All statistical analyses were performed with the SPSS version 20.0 for Windows (SPSS Inc, Chicago, IL, USA) and graphs were plotted using GraphPad Prism version 7.0 (San Diego, CA). P<0.05 was considered to indicate statistical significance.
Results
Baseline Characteristics of Study Participants
Overall, 10,855 children (6381 normal weight, 1910 overweight, 2564 obesity) aged 6–18 years were screened. The baseline demographic characteristics and information about parental determinants, socioeconomic status, and individual lifestyle behaviors for the enrolled participants in normal weight, overweight, and obesity groups were summarized in Table 1. Children in overweight and obesity groups had significantly higher percentages of children aged 9–11 years and 12–14 years, but a lower percentage of children aged 6–8 years as compared to those in the normal-weight group (P<0.05). The percentages of boys, father obesity, mother obesity, birth weight ≥4 kg, and exercise time <90 minutes/week were significantly higher in the overweight group, and even higher in the obesity group when compared with those in the normal-weight group (P all <0.05). Additionally, subjects in the obesity group had significantly higher percentages of high mother’s glucose level during pregnancy, low household income, having breakfast <4 times/week, watching TV ≥2 hours/day, less frequency, and less time of exercise, but lower percentages of infant breastfeeding, having siblings and sleep duration ≥9 hours/day in comparison than those in the normal weight (P all <0.05).
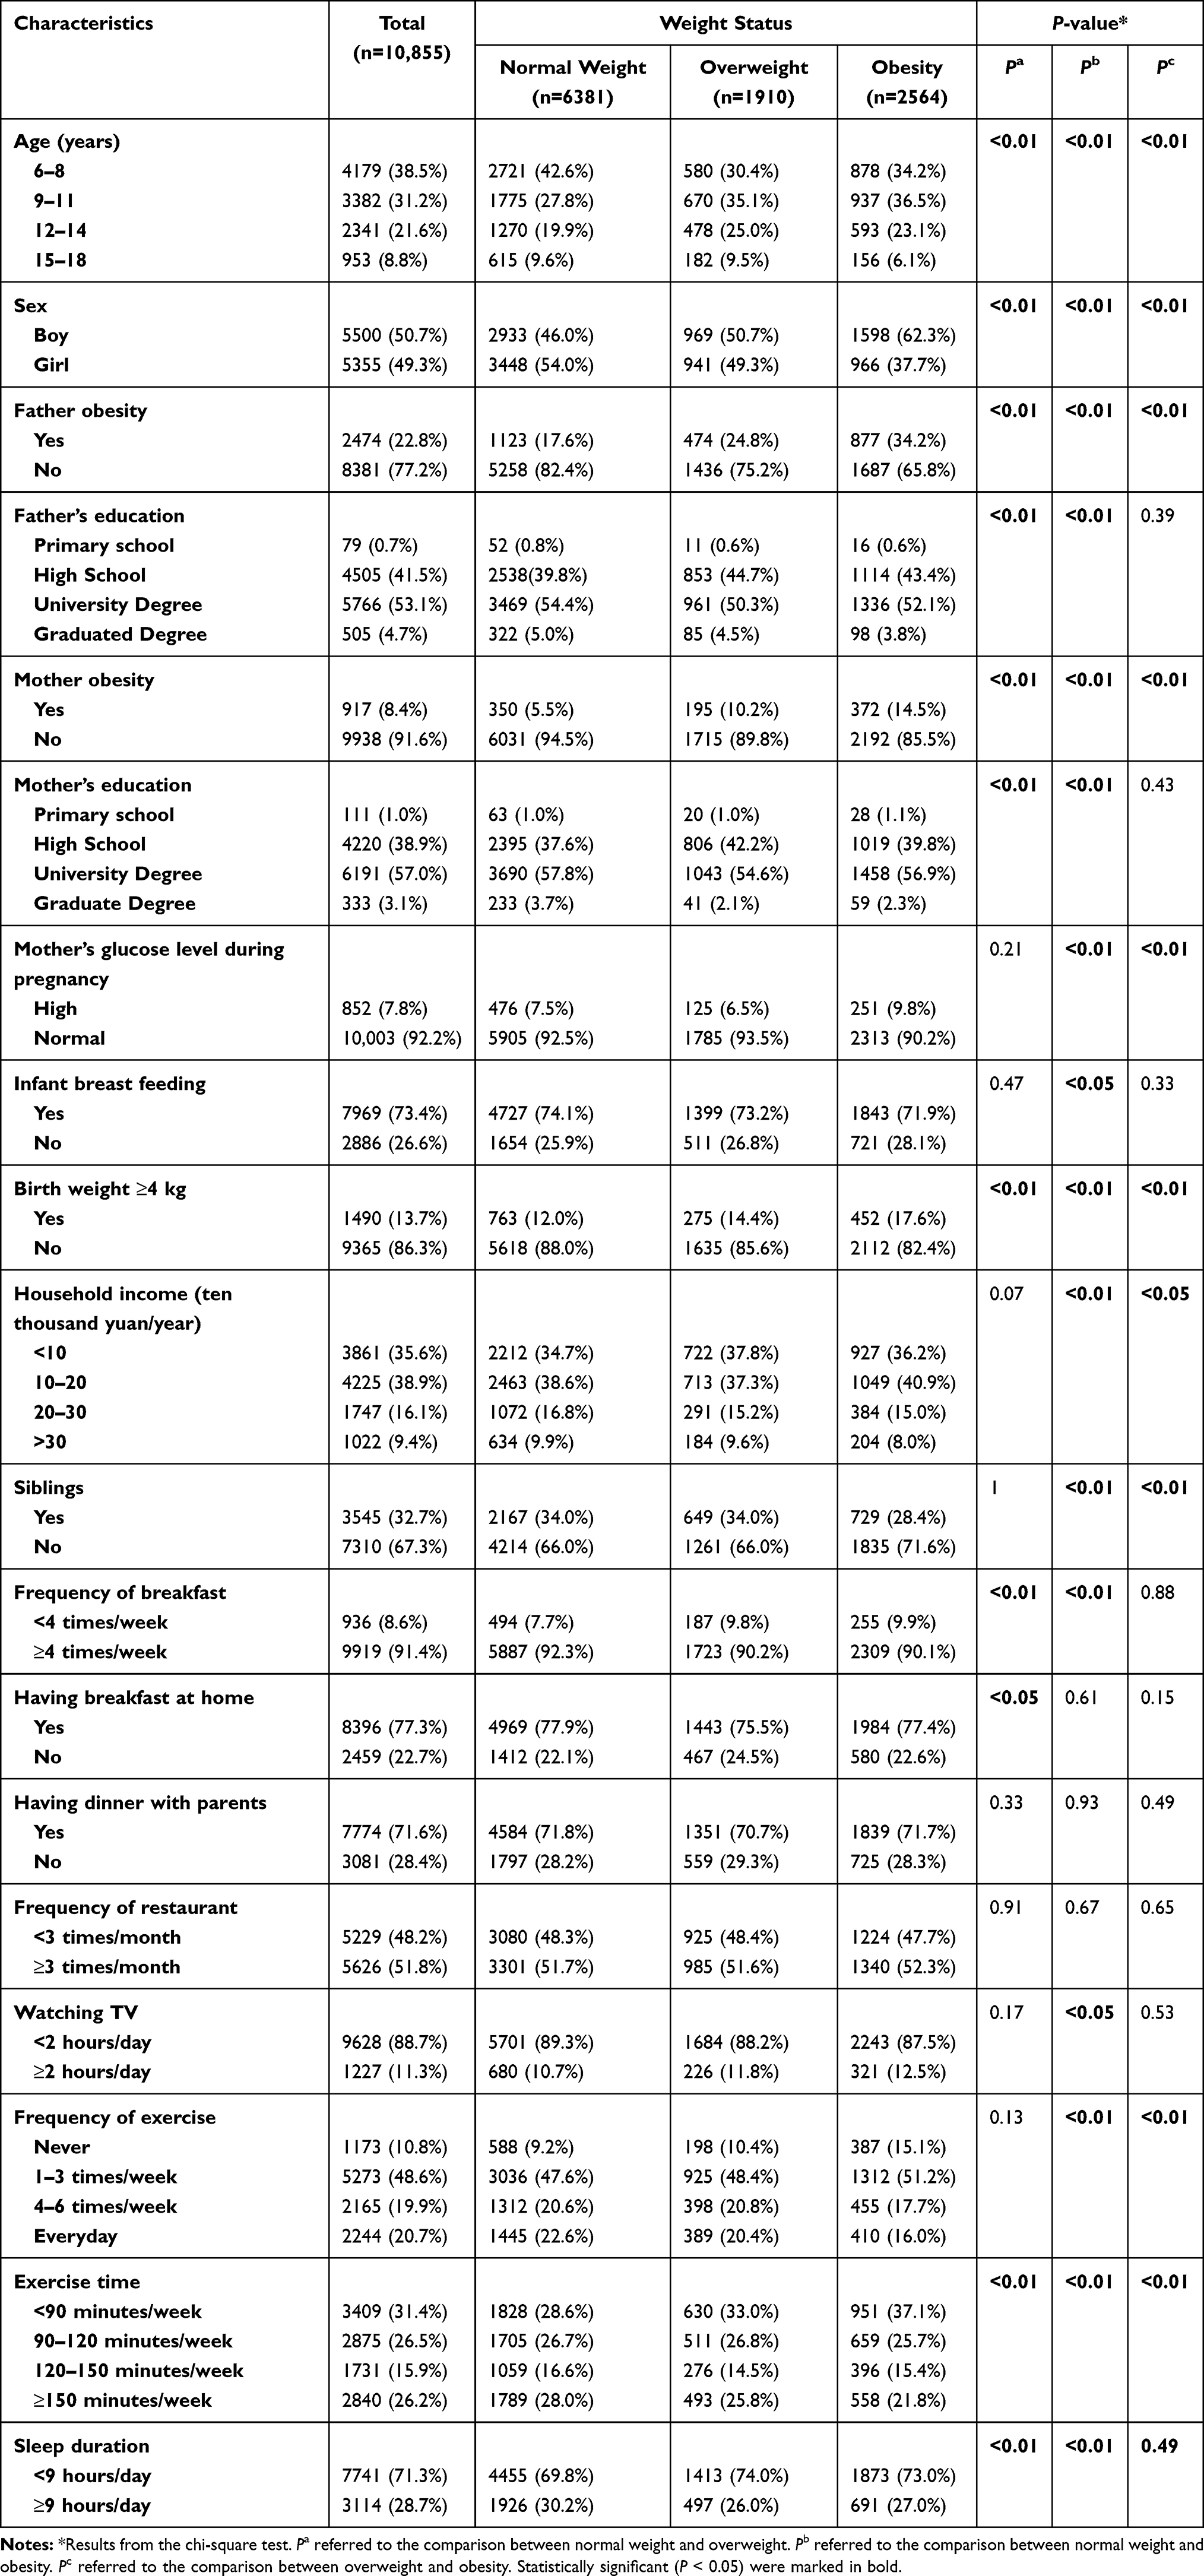 |
Table 1 Characteristics of the Participants by Weight Status |
Prevalence of Overweight and Obesity Among Children
Figure 1 shows the prevalence of overweight and obesity among Chinese children aged 6–18 years in Beijing. According to the WGOC criteria, the overall prevalence of overweight was 17.62% in boys and 17.57% in girls. Subgroup analyses by age showed that the prevalence of overweight among children aged 9–11 years, 12–14 years, and 15–18 years were significantly higher than those aged 6–8 years as shown in Figure 1A (P all <0.05). No significant difference was found in the prevalence of overweight between boys and girls, not only in the total subjects, but also in subjects in different age groups (P all >0.05). As depicted in Figure 1B, the overall prevalence of obesity was 29.05% in boys and 18.04% in girls. Further evaluating the obesity rate in different age groups, we noticed that children aged 9–11 years have the highest obesity rate, though the differences in obesity rate between children aged 9–11 years and children aged 12–14 years were not statistically significant. Additionally, we found a much higher prevalence of obesity among boys than among girls not only for all children but also for children in different age groups (P all <0.05).
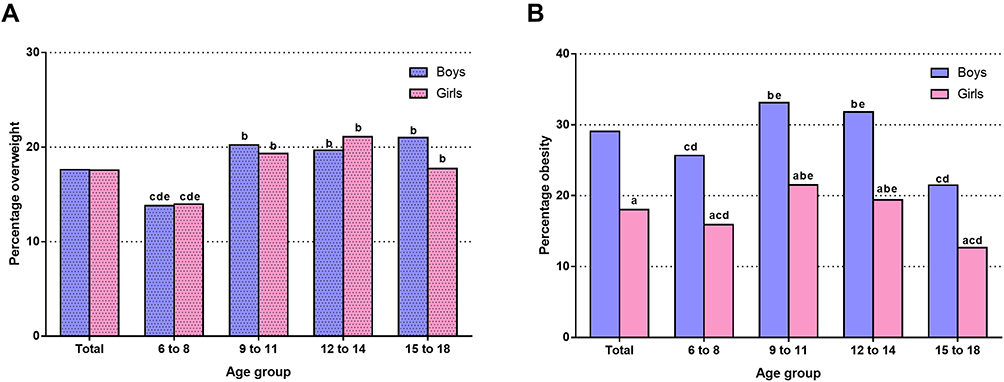 |
Figure 1 The percentage of overweight and obesity (by age group) for boys and girls. aP<0.05 compared with boys; bP<0.05 compared with children aged 6–8 years; cP<0.05 compared with children aged 9–11 years; dP<0.05 compared with children aged 12–14 years; eP<0.05 compared with children aged 15–18 years. |
Factors Associated with Childhood Overweight and Obesity
Figure 2 depicts the individual factors associated with the prevalence of overweight and obesity among children and adolescents. In the multivariate logistic regression analyses, men (OR=1.116, 95% CI 1.240–1.378), age (9–11 years OR=1.524, 95% CI 1.738–1.981, 12–14 years OR=1.447, 95% CI 1.725–2.055, 15–18 years OR=1.064, 95% CI 1.375–1.777), father obesity (OR=1.537, 95% CI 1.857–2.243, P<0.01), mother obesity (OR=1.333, 95% CI 1.510–1.711), birth weight ≥4 kg (OR=1.026, 95% CI 1.195–1.391), and exercise time (90–120 minutes/week OR=0.722, 95% CI 0.843–0.985, 120–150 minutes/week OR=0.665, 95% CI 0.786–0.930) were independently associated with overweight (P all <0.05) (Figure 2A). As shown in Figure 2B, men (OR=1.931, 95% CI 1.748–2.133), age (9–11 years OR=1.589, 95% CI 1.413–1.788, 12–14 years OR=1.261, 95% CI 1.478–1.733), father obesity (OR=2.078, 95% CI 2.317–2.585), mother obesity (OR=2.293, 95% CI 2.703–3.188), having siblings (OR=0.703, 95% CI 0.783–0.872), high mother’s glucose level during pregnancy (OR=1.095, 95% CI 1.299–1.543), birth weight ≥4 kg (OR=1.471, 95% CI 1.285–1.684), having dinner with parents (OR=0.864, 95% CI 0.768–0.971), frequency of exercise (1–3 times/week OR=0.526, 95% CI 0.429–0.646, 4–6 times/week OR=0.642, 95% CI 0.525–0.785, everyday OR=0.760, 95% CI 0.645–0.896), exercise time (90–120 minutes/week OR=0.777, 95% CI 0.667–0.906, ≥150 minutes/week OR=0.833, 95% CI 0.728–0.952) were independently associated with obesity (P all <0.05) (Figure 2B). Overall, men, older age, father obesity, mother obesity, birth weight ≥4 kg, and physically inactive were risk factors for overweight and obesity. Mother’s high glucose level during pregnancy was a risk factor for obesity while having siblings and having dinner with parents were protective factors for obesity.
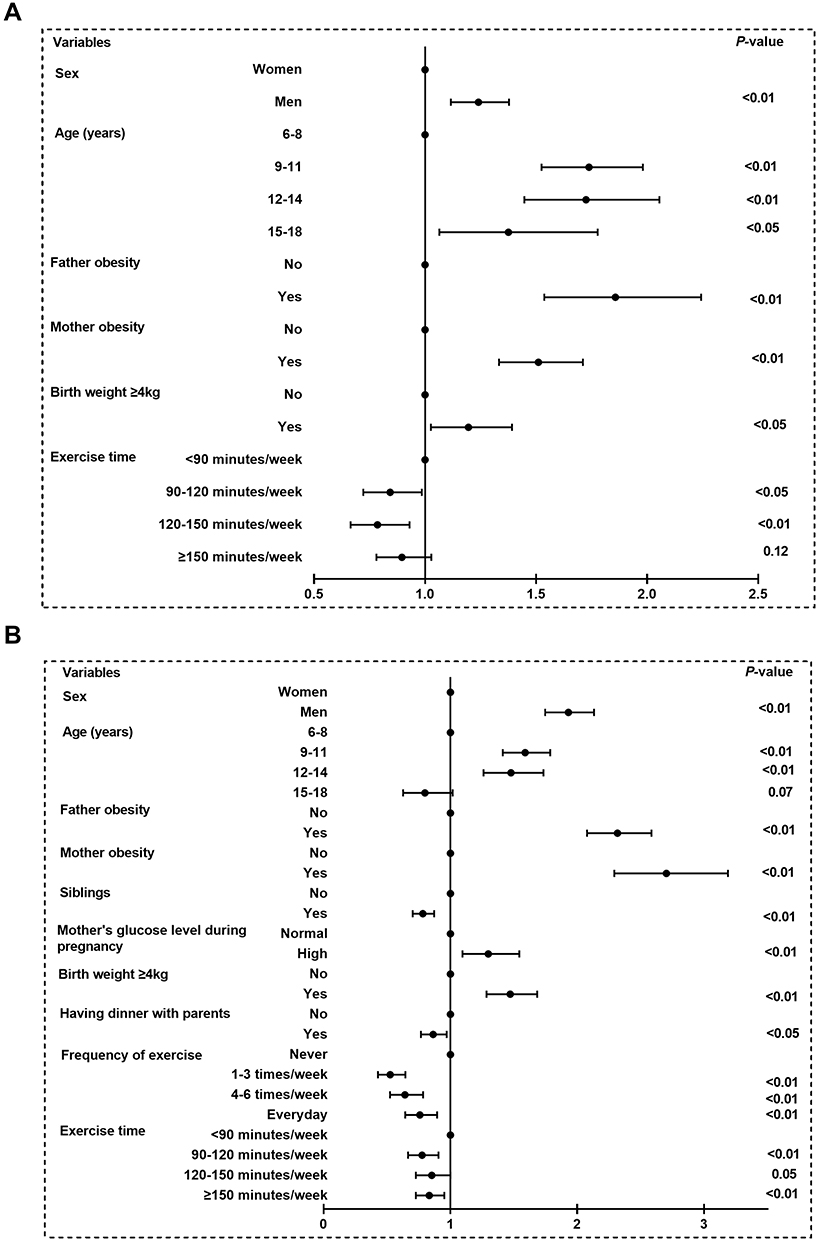 |
Figure 2 Logistic regression analysis of risk factors for overweight/obesity. Multivariate odds ratios (OR) and 95% confidence interval (CI) from bivariate regression models were used in the analysis. Variables including age, sex, father obesity, father’s education, mother obesity, mother’s education, mother’s glucose level during pregnancy, infant breastfeeding, birth weight ≥4 kg, household income (ten thousand yuan/year), siblings, frequency of breakfast, having breakfast at home, having dinner with parents, frequency of restaurant, watching TV, frequency of exercise, exercise time and sleep duration were entered in the model. |
Association Between Exercise Time and Age Among Children
As mentioned above, children aged 9–11 years had a high prevalence of overweight/obesity, and exercise time was one of the shared factors independently associated with childhood overweight/obesity, we further explored the distribution and percentages of exercise time by weight groups in children aged 9–11 years. As shown in Figure 3, compared with children in the normal weight group, exercise time <90 minutes/week was increased in the overweight group, and even gradually increased in the obesity group. In contrast, compared with children in the normal weight group, exercise time ≥150 minutes/week was decreased in the overweight group, and even gradually decreased in the obesity group (P<0.05) (Figure 3).
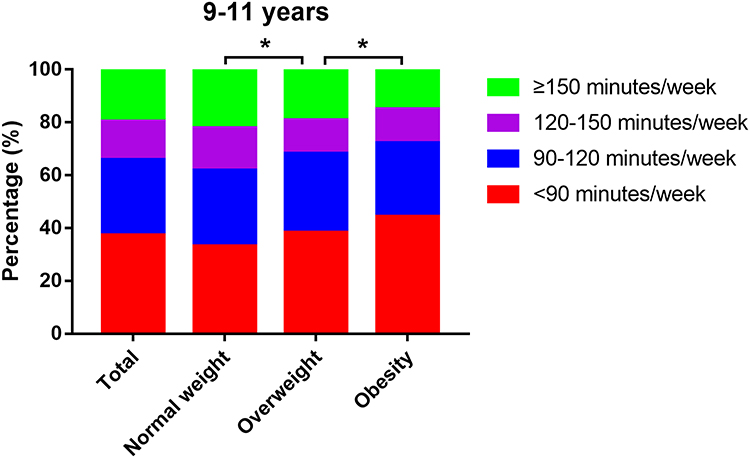 |
Figure 3 Distribution and percentages of exercise time by weight groups in children aged 9–11 years. * means P<0.05. |
Additionally, after further explored the distribution and percentages of exercise time by age groups, we found that in all subjects, the percentages of being physically active (exercise time ≥120 minutes/week) were lower in children aged 9–11 years in comparison to children in other age groups (Figure 4A). This phenomenon remained when this comparison was performed respectively in the normal-weight, overweight, and obesity groups (Figure 4B–D).
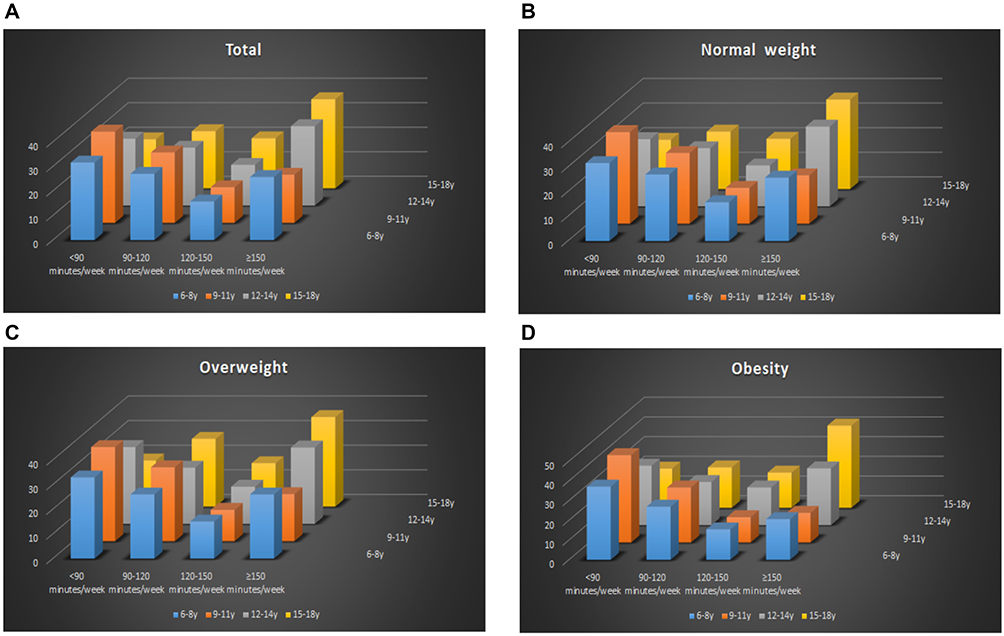 |
Figure 4 Distribution and percentages of exercise time by age and weight groups. |
To further investigate the association between exercise time and age, the unconditional logistic regression analysis was performed, and all subjects were stratified into four sections according to age (6–8 years, 9–11 years, 12–14 years, 15–18 years). As presented in Table 2, compared with subjects aged 6–8 years, the probability of being physically active (exercise time ≥120 minutes/week) was decreased by 26.8% in subjects aged 9–11 years, but increased by 36.2% and 85.1% in subjects aged 12–14 years and 15–18 years, respectively (OR=0.732, 95% CI 0.667–0.804 for 9–11 years; OR=1.362, 95% CI 1.230–1.508 for 12–14 years, OR=1.851, 95% CI 1.606–2.134 for 15–18 years, respectively, P all <0.01). This phenomenon has still existed after adjustment for age and body weight in Model 1 (OR=0.753, 95% CI 0.685–0.828 for 9–11 years; OR=1.411, 95% CI 1.274–1.564 for 12–14 years, OR=1.884, 95% CI 1.633–2.173 for 15–18 years, respectively, P all <0.01). After further adjusting father obesity, father’s education, mother obesity, mother’s education, mother’s glucose level during pregnancy, infant breastfeeding, birth weight ≥4kg, household income (ten thousand yuan/year), and siblings in Model 2, the decreased probability of being physically active (exercise time ≥120 minutes/week) in subjects aged 9–11 years (OR=0.827, 95% CI 0.751–0.911, P<0.01) and the increased probabilities observed in subjects aged 12–14 years and 15–18 years remained (OR=1.829, 95% CI 1.633–2.050 for 12–14 years, OR=2.350, 95% CI 2.020–2.734 for 15–18 years, respectively, P all <0.01). Even after adjusting all variables in Model 3, this phenomenon was still preserved (OR=0.855, 95% CI 0.775–0.943 for 9–11 years; OR=1.913, 95% CI 1.687–2.170 for 12–14 years, OR=2.218, 95% CI 1.852–2.656 for 15–18 years, respectively, P all <0.01).
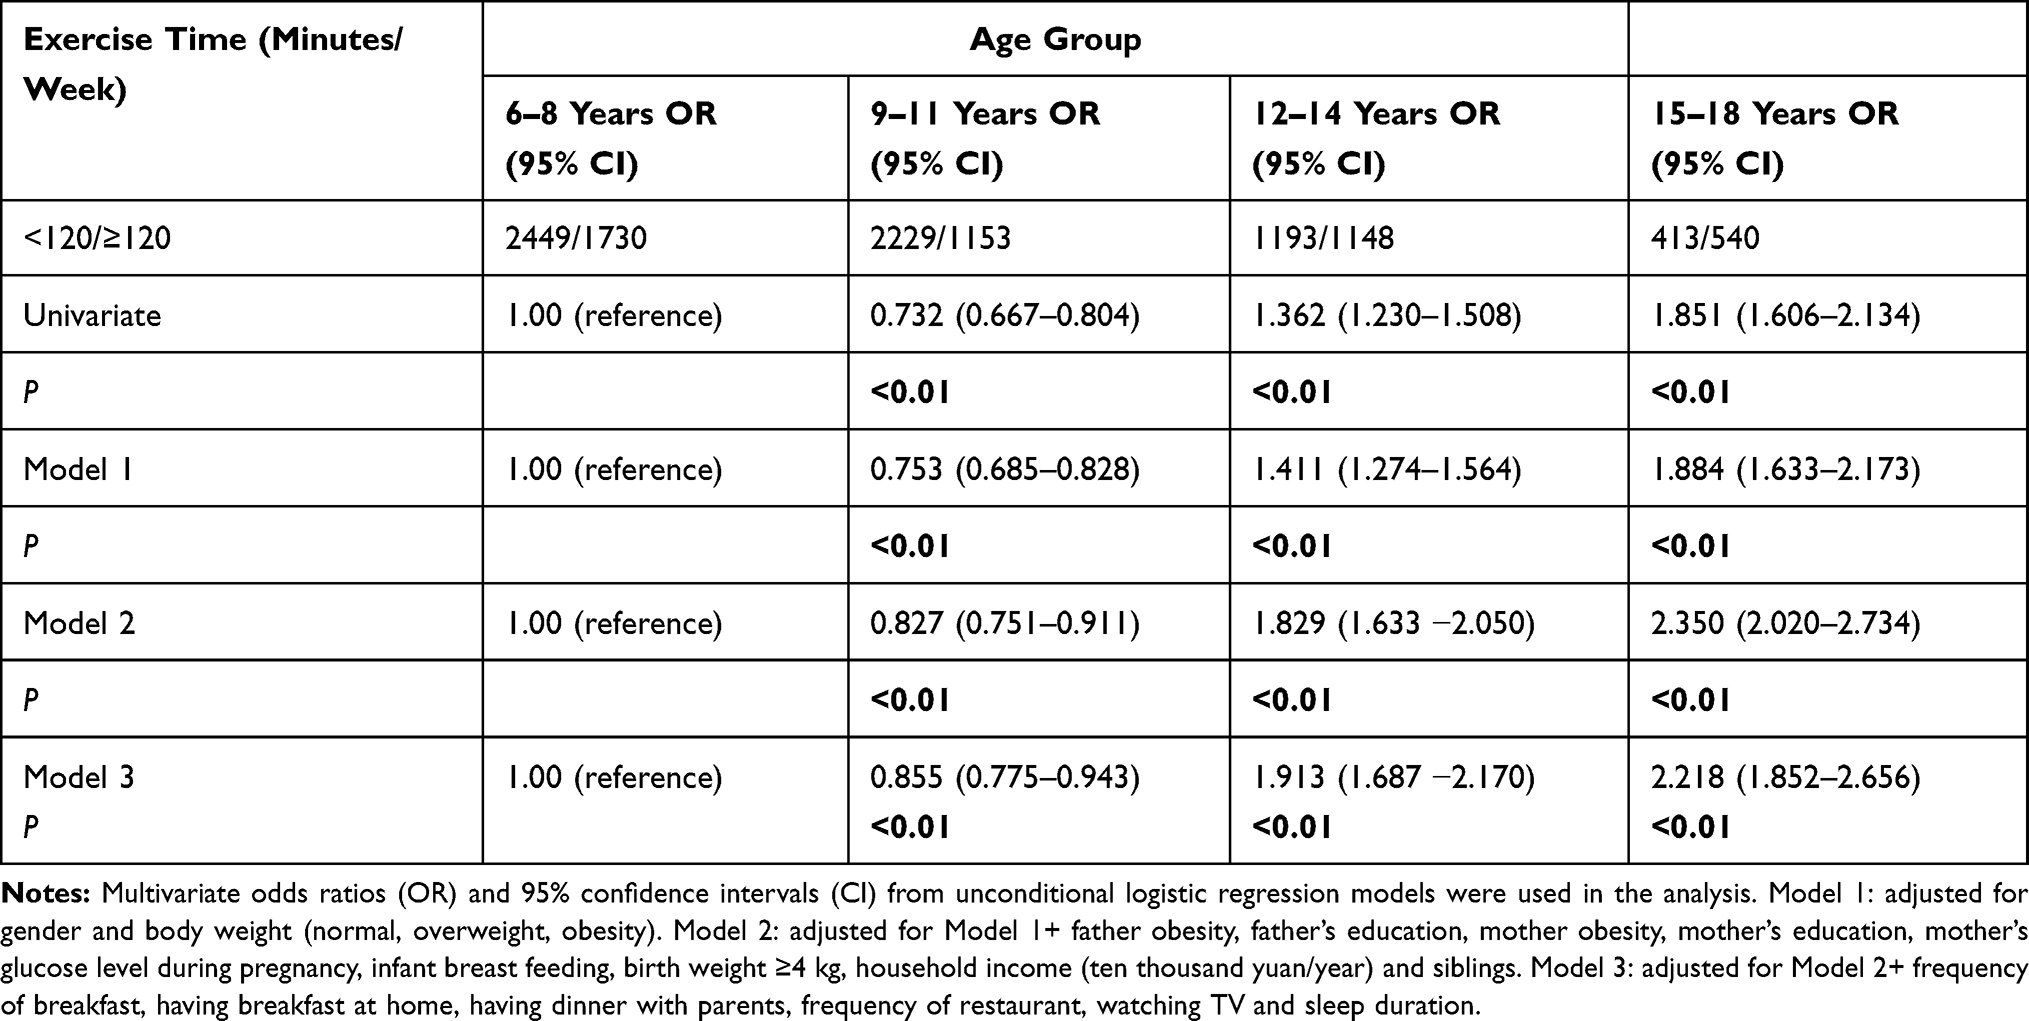 |
Table 2 Unconditional Logistic Regression Analysis of Exercise Time According to the Age Group |
Discussion
Our study found that the prevalence of overweight and obesity among children in Beijing were 17.62% and 29.05% in boys, 17.57% and 18.04% in girls, respectively. The prevalence of overweight and obesity in our study appeared to be much higher than that in developed countries. In a systematic analysis conducted by the Global Burden of Disease (GBD) 2013, the prevalence of overweight and obesity among children and adolescents in developed countries in 2013 was reported to be 23.8% in boys and 22.6% in girls.26 Comparing with other studies conducted in China, the prevalence of overweight and obesity estimated in our study also tended to be higher. Based on the data from the 2010 Chinese National Surveys on Students’ Constitution and Health (CNSSCH), the prevalence of overweight and obesity among Chinese children aged 7–18 years was 23.4% in boys and 14.5% in girls.27 Differences in ethnic and geographical factors could partly contribute to the higher prevalence of overweight and obesity observed in our study. Additionally, the prevalence of overweight and obesity estimated in our study also higher than the previously reported data in Beijing, suggesting an increase in recent years. Based on our previously published data of 19,593 children aged 6–18 years from Beijing in 2004, the estimated prevalence of obesity was 12.34% in boys and 7.2% in girls, respectively.28 Similarity, Shan et al collected 19,517 children aged 6–18 years from Beijing in 2004 found that, according to the WGOC reference, the estimated prevalence of obesity was 12.4% in boys and 7.1% in girls, respectively.15 In 2016, Ding et al recruited a total of 3249 children aged 6–18 years from the Beijing Child and Adolescent Metabolic Syndrome (BCAMS) study and reported an estimated prevalence of obesity as 35.1%,29 which was also lower than the data in our study. The alarmingly high prevalence of overweight and obesity revealed an urgent need for preventative interventions among Chinese children and adolescents.
Additionally, stratified analyses indicated that the prevalence of obesity among children and adolescents differed by gender and age. The prevalence of obesity was found higher among boys compared with girls, which was similar to the previous studies in other cities in China.1,9,30–33 Previous studies by Wang et al found that gender differences existed in various obesity-related genes in Chinese children, as rs6548238 (TMEM18) was associated with four obesity-related indices in boys, but not in girls, while rs9939609 (FTO) showed a strong association only in girls.34 Besides, following the Chinese cultural value, girls usually pursue a slim shape and are more likely to control or lose weight compared to boys. This may further partly explain the gender difference in obesity prevalence. Additionally, our study also found that both in girls and boys, 9–11 years age group had a higher prevalence of obesity compared to the other age groups. Similarly, a study by Zhang et al on Shanghai children documented that the prevalence of overweight and obesity for both boys and girls peaked at 9–13 years.31 Shan et al collected 21,198 children aged 2–18 years old in Beijing reported that children aged 10–12 years had higher overweight and obesity rates compared with other age groups.15 In another study by Ji et al in Guangdong, children aged 9–11 years also had higher overweight and obesity rates compared with other age groups.14 Given the minimum age of onset for adolescence is 8 years for girls and 9 years for boys, the age of 9–11 is a critical period for the transition from childhood to adolescence. The particular biological and psychosocial changes may help explain why a bigger proportion of obesity is observed among children aged 9–11 years. These findings highlighted the importance for Chinese policymakers to pay particular attention to reducing the high overweight and obesity prevalence in 9–11 age group.
Overweight and obesity are the results of complex interactions of multiple factors that have gradually led to the imbalance between energy intake and energy expenditure.35 In the present study, parents’ obesity was an individual risk variable affecting childhood overweight and obesity. This finding is in line with the study of Whitaker et al among 7078 children aged 2–15 years in Europe,36 also, the study of Freeman et al among children aged 809 years in Australia,37 both of which showed a significant relationship between parents’ BMI and children’s BMI. Similar results have been reported by Danielzik et al on German children, which found that parental overweight was the strongest independent risk factor of childhood overweight and obesity.38 Moreover, a 2-year follow-up study by Xu et al in Chinese school-aged children indicated that both maternal and paternal obesity was associated with a greater increase in their children’s BMI and waist circumstance.39 The influence of parental obesity on childhood overweight and obesity most likely result from a mixture of genetic and environmental influences.40 Genetic factors are the primary cause of the association between parental and childhood overweight and obesity, but shared social and nutritional factors may also play a role. In the present study, birth weight ≥4 kg was another individual shared risk variable affecting childhood overweight and obesity identified in the multivariate linear regression analysis. In support of our results, Yang et al studied a total number of 30,486 children and adolescents aged 6–17 years old found that children with birth weight ≥4 kg had a higher risk of abdominal obesity in all age groups, with the Ors ranging from 1.27 (95% CI: 1.03–1.58) to 1.59 (95% CI: 1.29–1.97).41 Intrauterine environmental conditions, genetic and lifestyle factors may explain partial associations between birth weight and the prevalence of overweight and obesity.42 Our study also revealed that a high mother’s glucose level during pregnancy was an individual risk factor for obesity. In another multinational cross-sectional study of 4740 children aged 9–11 years, maternal gestational diabetes mellitus was associated with increased odds of childhood obesity.43 However, after additional adjustment for maternal BMI, this association was not significant for general obesity.43 Therefore, more studies in the future are needed to confirm the association between the mother’s glucose level during pregnancy and childhood obesity.
Previous studies have shown that children with no siblings had a higher probability of being obese.44,45 In the present study, likewise, we found that children who had siblings were less obese after adjustment for various confounders in the whole study group. Some studies verified that the number of siblings may reduce the time, energy, and financial resources that parents spend with each child,46 and siblings may also decrease the food availability for each child, particularly for poor families.47 Furthermore, evidence has shown that siblings may increase physical activity and reduce sedentary behavior than those without siblings.48 Our findings together with others suggest the beneficial effect of siblings in reducing childhood obesity risk. Additionally, in the present study, we firstly found that children who had dinner with their parents were less obese after adjustment for various confounders in the whole study group. Parents play a vital role in the development of children’s eating behaviors by serving as providers (ie, bring food to the home), models (ie, show the child how to eat), and regulators of the food environment (ie, decide what to purchase and serve).49 However, recently, parents spend more time working or commuting, and less time having dinner at home with their children. One consequence of these trends was that the parental supervision and control of children’s intake had decreased, with shifts away from meals to snacks and from at-home to away-from-home consumption.50
Physical exercise is one of the well-known variables associated with childhood overweight and obesity.51 Extending the findings of previous studies, we have found that children aged 9–11 years have a lower percentage of being physically active (exercise time ≥120 minutes) than children in other age groups. Further unconditional logistic regression analysis showed that compared with subjects aged 6–8 years, the probability of being physically active (exercise time ≥120 minutes) was lower in subjects aged 9–11 years, but higher in subjects aged 12–14 years and 15–18 years (P all <0.01). This phenomenon still existed even after adjustment for other confounding factors in Model 3 (OR=0.855, 95% CI 0.775–0.943 for 9–11 years; OR=1.913, 95% CI 1.687–2.170 for 12–14 years, OR=2.218, 95% CI 1.852–2.656 for 15–18 years, respectively, P all <0.01). In China, children aged 9–11 years were mostly in the fourth and fifth grades and under the pressure of entering the junior middle school from primary school. One explanation is that children spent more time on reading or doing homework, and thus the time spent on exercise was reduced. As children aged 9–11 years had a higher prevalence of obesity, but a lower percentage of being physically active, we hypothesized that the reduction in physical activity levels in children aged 9–11 years contributes to the age-specific high prevalence of obesity, creating a vicious cycle. Our findings emphasize the importance of launching effective interventions that are designed for children with low levels of physical activity, especially for children aged 9–11 years.
This study has several limitations. First, even though the study involved 14 schools, it does not provide a representative sample of Beijing, and cannot perfectly represent the general overweight/obesity prevalence in Beijing. Besides, our sample of school children was from only one city, the generalizability of our results may be low. Second, the validity and reliability of the questionnaire used in the present study were not examined here or in the existing studies. Third, all variables from the questionnaires were provided based on parental reports and may have recall bias and reporting bias, the magnitude of which may be different in different age groups. Fourth, this was a cross-sectional study, and may have recall bias. Besides, we could not make causal inferences due to the cross-sectional design. We are collecting follow-up data which would allow us to perform longitudinal studies in the future.
In conclusion, this study reported the high prevalence of overweight and obesity in children from Beijing. Sex, age, parental obesity, birth weight, and exercise time were shared factors individually associated with overweight and obesity, while siblings, mother’s glucose level during pregnancy, having dinner with parents, and frequency of exercise were individually associated with obesity. Children aged 9–11 years had a higher prevalence of obesity, but a lower percentage of being physically active. Our findings could aid the clinical doctors to identify youth at risk of overweight and obesity, and have the potential to improve intervention strategies to combat the childhood obesity epidemic in China.
Acknowledgments
All authors contributed to data analysis, drafting or revising the article, have agreed on the journal to which the article will be submitted, gave final approval of the version to be published, and agree to be accountable for all aspects of the work.
Funding
This study was funded by The Pediatric Medical Coordinated Development Center of Beijing Hospitals Authority (XTYB201808), the National Key Research and Development Program of China (2016YFC0901505, 2016YFC1305304), and the Beijing Municiple Administration of Hospital Clinical Medicine Development of Special Funding Support (No. ZYLX201821).
Disclosure
The authors declare that they have no competing interests.
References
1. Wang H, Xue H, Du S, Zhang J, Wang Y, Zhang B. Time trends and factors in body mass index and obesity among children in China: 1997–2011. Int J Obes. 2017;41:964–970. doi:10.1038/ijo.2017.53
2. Koskinen J, Juonala M, Dwyer T, et al. Impact of lipid measurements in youth in addition to conventional clinic-based risk factors on predicting preclinical atherosclerosis in adulthood: international childhood cardiovascular cohort consortium. Circulation. 2018;137:1246–1255. doi:10.1161/CIRCULATIONAHA.117.029726
3. Afshin A, Forouzanfar MH, Reitsma MB, et al. Health effects of overweight and obesity in 195 countries over 25 years. N Engl J Med. 2017;377:13–27. doi:10.1056/NEJMoa1614362
4. Dietz WH, Robinson TN. Clinical practice. Overweight children and adolescents. N Engl J Med. 2005;352:2100–2109. doi:10.1056/NEJMcp043052
5. Wang G, Dietz WH. Economic burden of obesity in youths aged 6 to 17 years: 1979–1999. Pediatrics. 2002;109:E81. doi:10.1542/peds.109.5.e81
6. Abdelkarim O, Ammar A, Trabelsi K, et al. Prevalence of Underweight and Overweight and Its Association with Physical Fitness in Egyptian Schoolchildren. Int J Environ Res Public Health. 2019;17:75. doi:10.3390/ijerph17010075
7. Ogden CL, Carroll MD, Kit BK, Flegal KM. Prevalence of childhood and adult obesity in the United States, 2011–2012. JAMA. 2014;311:806–814. doi:10.1001/jama.2014.732
8. Liu W, Li Q, Li H, Li J, Wang HJ, Li B. 20-year trends in prevalence of overweight and obesity among children aged 0–6 in Harbin, China: a multiple cross-sectional study. PLoS One. 2018;13:e198032. doi:10.1371/journal.pone.0198032
9. Musa TH, Wei L, Li XS, Pu YP, Wei PM. Prevalence of Overweight and Obesity among Students Aged 7–22 Years in Jiangsu Province, China. Biomed Environ Sci. 2016;29:697–705. doi:10.3967/bes2016.094
10. Zhang X, Zhang F, Yang J, et al. Prevalence of overweight and obesity among primary school-aged children in Jiangsu Province, China, 2014–2017. PLoS One. 2018;13:e202681. doi:10.1371/journal.pone.0202681
11. Zhang YX, Wang SR. Distribution of body mass index and the prevalence changes of overweight and obesity among adolescents in Shandong, China from 1985 to 2005. Ann Hum Biol. 2008;35:547–555. doi:10.1080/03014460802334239
12. Zhang Y, Wang S. Prevalent change in overweight and obesity in children and adolescents from 1995 to 2005 in Shandong, China. Asia Pac J Public Health. 2011;23:904–916. doi:10.1177/1010539509360571
13. Ying-Xiu Z, Shu-Rong W. Secular trends in body mass index and the prevalence of overweight and obesity among children and adolescents in Shandong, China, from 1985 to 2010. J Public Health. 2012;34:131–137. doi:10.1093/pubmed/fdr053
14. Ji GY, Dun ZJ, Jiang Q, et al. Prevalence and trend of overweight and obesity in children and adolescents in Guangdong province, 2002–2012. Zhonghua Liu Xing Bing Xue Za Zhi. 2016;37:1242–1247. doi:10.3760/cma.j.issn.0254-6450.2016.09.012
15. Shan XY, Xi B, Cheng H, Hou DQ, Wang TF, Prevalence MJ. and Behavioral Risk Factors of Overweight and Obesity Among Children Aged 2–18 in Beijing, China. Int J Pediatr Obes. 2010;5:383–389. doi:10.3109/17477160903572001
16. Rennie KL, Livingstone MB, Wells JC, et al. Association of physical activity with body-composition indexes in children aged 6-8y at varied risk of obesity. Am J Clin Nutr. 2005;82:13–20. doi:10.1093/ajcn.82.1.13
17. Almas A, Islam M, Jafar TH. School-based physical activity programme in preadolescent girls (9–11 years): a feasibility trial in Karachi, Pakistan. Arch Dis Child. 2013;98:515–519. doi:10.1136/archdischild-2012-303242
18. Qiao Y, Zhang T, Liu H, et al. Joint association of birth weight and physical activity/sedentary behavior with obesity in children ages 9–11 years from 12 countries. Obesity. 2017;25:1091–1097. doi:10.1002/oby.21792
19. Group of China Obesity Task Force. Body mass index reference norm for screening overweight and obesity in Chinese children and adolescents. Zhonghua Liu Xing Bing Xue Za Zhi. 2004;25:97–102.
20. Zhou B. Predictive values of body mass index and waist circumference to risk factors of related diseases in Chinese adult population. Zhonghua Liu Xing Bing Xue Za Zhi. 2002;23:5–10.
21. Klabunde RA, Lazar NF, Louzada A, et al. Prevalence and predictors of overweight and obesity in Brazilian immigrants in Massachusetts. BMC Public Health. 2020;20:42. doi:10.1186/s12889-020-8144-8
22. Armoon B, Karimy M. Epidemiology of childhood overweight, obesity and their related factors in a sample of preschool children from Central Iran. BMC Pediatr. 2019;19:159. doi:10.1186/s12887-019-1540-5
23. Gong QH, Li SX, Wang SJ, Li H. Dinner-to-bed time is independently associated with overweight/obesity in Chinese school-aged children. Eat Weight Disord. 2021. doi:10.1007/s40519-021-01129-0
24. Li X, Xiang ST, Dong J, et al. Association between physical activity and age among children with overweight and obesity: evidence from the 2016–2017 National Survey of Children’s Health. Biomed Res Int. 2020;2020:9259742. doi:10.1155/2020/9259742
25. Li S, Arguelles L, Jiang F, et al. Sleep, school performance, and a school-based intervention among school-aged children: a sleep series study in China. PLoS One. 2013;8:e67928. doi:10.1371/journal.pone.0067928
26. Ng M, Fleming T, Robinson M, et al. Global, regional, and national prevalence of overweight and obesity in children and adults during 1980–2013: a systematic analysis for the Global Burden of Disease Study 2013. Lancet. 2014;384:766–781. doi:10.1016/S0140-6736(14)60460-8
27. Sun H, Ma Y, Han D, Pan CW, Xu Y. Prevalence and trends in obesity among China’s children and adolescents, 1985–2010. PLoS One. 2014;9:e105469. doi:10.1371/journal.pone.0105469
28. Cao BY, Mi J, Gong CX, et al. The prevalence of diabetes in children and adolescents of Beijing. Zhonghua Liu Xing Bing Xue Za Zhi. 2007;28:631–634.
29. Ding W, Cheng H, Yan Y, et al. 10-year trends in serum lipid levels and dyslipidemia among children and adolescents from several schools in Beijing, China. J Epidemiol. 2016;26:637–645. doi:10.2188/jea.JE20140252
30. Zhang YX, Wang ZX, Zhao JS, Chu ZH. Trends in overweight and obesity among rural children and adolescents from 1985 to 2014 in Shandong, China. Eur J Prev Cardiol. 2016;23:1314–1320. doi:10.1177/2047487316643830
31. Zhang J, Li X, Hawley N, et al. Trends in the prevalence of overweight and obesity among Chinese school-age children and adolescents from 2010 to 2015. Child Obes. 2018;14:182–188. doi:10.1089/chi.2017.0309
32. Zhang J, Wang H, Wang Z, et al. Prevalence and stabilizing trends in overweight and obesity among children and adolescents in China, 2011–2015. BMC Public Health. 2018;18:571. doi:10.1186/s12889-018-5483-9
33. Guo Y, Yin X, Wu H, Chai X, Yang X. Trends in overweight and obesity among children and adolescents in China from 1991 to 2015: a meta-analysis. Int J Environ Res Public Health. 2019;16. doi:10.3390/ijerph16234656
34. Wang J, Mei H, Chen W, et al. Study of eight GWAS-identified common variants for association with obesity-related indices in Chinese children at puberty. Int J Obes. 2012;36:542–547. doi:10.1038/ijo.2011.218
35. Ang YN, Wee BS, Poh BK, Ismail MN. Multifactorial influences of childhood obesity. Curr Obes Rep. 2013;2:10–22. doi:10.1007/s13679-012-0042-7
36. Whitaker KL, Jarvis MJ, Beeken RJ, Boniface D, Wardle J. Comparing maternal and paternal intergenerational transmission of obesity risk in a large population-based sample. Am J Clin Nutr. 2010;91:1560–1567. doi:10.3945/ajcn.2009.28838
37. Freeman E, Fletcher R, Collins CE, Morgan PJ, Burrows T, Callister R. Preventing and treating childhood obesity: time to target fathers. Int J Obes. 2012;36:12–15. doi:10.1038/ijo.2011.198
38. Danielzik S, Czerwinski-Mast M, Langnäse K, Dilba B, Müller MJ. Parental overweight, socioeconomic status and high birth weight are the major determinants of overweight and obesity in 5–7 y-old children: baseline data of the Kiel Obesity Prevention Study (KOPS). Int J Obes Relat Metab Disord. 2004;28:1494–1502. doi:10.1038/sj.ijo.0802756
39. Xu RY, Zhou YQ, Zhang XM, Wan YP, Gao X. A two-year study of parental obesity status and childhood obesity in China. Nutr Metab Cardiovasc Dis. 2019;29:260–267. doi:10.1016/j.numecd.2018.11.004
40. Nielsen LA, Nielsen TR, Holm JC. The Impact of Familial Predisposition to Obesity and Cardiovascular Disease on Childhood Obesity. Obes Facts. 2015;8:319–328. doi:10.1159/000441375
41. Yang Z, Dong B, Song Y, et al. Association between birth weight and risk of abdominal obesity in children and adolescents: a school-based epidemiology survey in China. BMC Public Health. 2020;20:1686. doi:10.1186/s12889-020-09456-0
42. Poston L. Maternal obesity, gestational weight gain and diet as determinants of offspring long term health. Best Pract Res Clin Endocrinol Metab. 2012;26:627–639. doi:10.1016/j.beem.2012.03.010
43. Zhao P, Liu E, Qiao Y, et al. Maternal gestational diabetes and childhood obesity at age 9–11: results of a multinational study. Diabetologia. 2016;59:2339–2348. doi:10.1007/s00125-016-4062-9
44. Chen AY, Escarce JJ. Family structure and childhood obesity: an analysis through 8th grade. Matern Child Health J. 2014;18:1772–1777. doi:10.1007/s10995-013-1422-7
45. Meller FO, Loret DMC, Assunção M, Schäfer AA, Dahly DL, Barros FC. Birth order and number of siblings and their association with overweight and obesity: a systematic review and meta-analysis. Nutr Rev. 2018;76:117–124. doi:10.1093/nutrit/nux060
46. Downey DB. Number of siblings and intellectual development. Resource Dilution Explanation Am Psychol. 2001;56:497–504. doi:10.1037//0003-066x.56.6-7.497
47. Chen AY, Escarce JJ. Family structure and childhood obesity, Early Childhood Longitudinal Study - Kindergarten Cohort. Prev Chronic Dis. 2010;7:A50.
48. Kracht CL, Sisson SB, Guseman EH, et al. Difference in objectively measured physical activity and obesity in children with and without siblings. Pediatr Exerc Sci. 2019;31:348–355. doi:10.1123/pes.2018-0184
49. Balantekin KN, Anzman-Frasca S, Francis LA, Ventura AK, Fisher JO, Johnson SL. Positive parenting approaches and their association with child eating and weight: a narrative review from infancy to adolescence. Pediatr Obes. 2020;15:e12722. doi:10.1111/ijpo.12722
50. Nielsen SJ, Siega-Riz AM, Popkin BM. Trends in energy intake in U.S. between 1977 and 1996: similar shifts seen across age groups. Obes Res. 2002;10:370–378. doi:10.1038/oby.2002.51
51. DiPietro L, Al-Ansari SS, Biddle S, et al. Advancing the global physical activity agenda: recommendations for future research by the 2020 WHO physical activity and sedentary behavior guidelines development group. Int J Behav Nutr Phys Act. 2020;17:143. doi:10.1186/s12966-020-01042-2
 © 2021 The Author(s). This work is published and licensed by Dove Medical Press Limited. The full terms of this license are available at https://www.dovepress.com/terms.php and incorporate the Creative Commons Attribution - Non Commercial (unported, v3.0) License.
By accessing the work you hereby accept the Terms. Non-commercial uses of the work are permitted without any further permission from Dove Medical Press Limited, provided the work is properly attributed. For permission for commercial use of this work, please see paragraphs 4.2 and 5 of our Terms.
© 2021 The Author(s). This work is published and licensed by Dove Medical Press Limited. The full terms of this license are available at https://www.dovepress.com/terms.php and incorporate the Creative Commons Attribution - Non Commercial (unported, v3.0) License.
By accessing the work you hereby accept the Terms. Non-commercial uses of the work are permitted without any further permission from Dove Medical Press Limited, provided the work is properly attributed. For permission for commercial use of this work, please see paragraphs 4.2 and 5 of our Terms.