")
Back to Journals » International Journal of Nanomedicine » Volume 13
High-performance reoxygenation from PLGA-PEG/PFOB emulsions: a feedback relationship between ROS and HIF-1α
Authors Wang J, Wang R, Li N, Shen X, Huang G, Zhu J, He D
Received 29 October 2017
Accepted for publication 24 January 2018
Published 22 May 2018 Volume 2018:13 Pages 3027—3038
DOI https://doi.org/10.2147/IJN.S155509
Checked for plagiarism Yes
Review by Single anonymous peer review
Peer reviewer comments 2
Editor who approved publication: Dr Linlin Sun
Jie Wang,1,* Ruochen Wang,1,* Niannian Li,1 Xi Shen,2 Gang Huang,3 Jun Zhu,1,4 Dannong He1,4
1School of Materials Science and Engineering, Shanghai Jiao Tong University, Shanghai, People’s Republic of China; 2The Department of Ophthalmology, Ruijin Hospital, Shanghai Jiao Tong University, Shanghai, People’s Republic of China; 3Shanghai University of Medicine and Health Sciences, Shanghai, People’s Republic of China; 4National Engineering Research Center for Nanotechnology, Shanghai, People’s Republic of China
*These authors contributed equally to this work
Background: Hypoxemia is one of the most common pathological processes in various clinical diseases.
Methods: A novel emulsion of poly(lactide-co-glycolide)-poly(ethylene glycol)/perfluorooctyl bromide has been developed to improve arterial hypoxemia through pulmonary drug delivery. Hypoxia-reoxygenation experiment was used to investigate the ability of the emulsion to supply oxygen and the saline lavage acute lung injury model was established to evaluate oxygen supply of the emulsion.
Results: It has been demonstrated that an apparent increase has been detected in the cytotoxicity test of the emulsion, indicating its lower cell toxicity. A hypoxia-reoxygenation experiment uncovered the fact that notable cell growth was observed after reoxygenation with poly(lactide-co-glycolide)-poly(ethylene glycol)/perfluorooctyl bromide emulsion because of the ability of the emulsion to supply oxygen adequately and reasonably. Moreover, the level of intracellular reactive oxygen species was significantly enhanced during hypoxia, which further influenced the concentration and activity of hypoxia-inducible factor-1α (HIF-1α). Furthermore, the upregulated expression of HIF-1α during hypoxia has verified that certain emulsions can increase HIF-1α content and relieve hypoxia, which further indicates HIF-1α plays an essential role in improving cell viability. Afterwards, the saline lavage acute lung injury model was established to evaluate oxygen supply of the emulsion and the result shows considerable improvement of lung ventilation of rabbits.
Conclusion: We recommend that the feedback relationship between reactive oxygen species and HIF-1 plays an essential role in improving cell viability. It is anticipated that the emulsion will be applied in the field of alleviating hypoxemia.
Keywords: perfluorocarbon, oxygen concentration, hypoxia-reoxygenation, reactive oxygen species, hypoxia-inducible factor-1α, lung ventilation
Introduction
Oxygen is the indispensable factor of cell survival and metabolism. Previous studies have reported intracellular changeable signals varying with oxygen concentration.1–7 And these signals have revealed an essential effect on the cell proliferation, apoptosis, as well as signal transduction.8–10 Particularly, the signals of reactive oxygen species (ROS) and hypoxia-inducible factor-1α (HIF-1α) are of significant importance.11–13 ROS, the by-product of biological oxygen metabolism process, plays a vital role as a second messenger in cell signaling. It can cause damage of DNA, lipid and protein, even leading to DNA mutation, cell apoptosis, cell aging, as well as eventually death of biological individuals. Transcription factor HIF-1 consists of subunit HIF-1α and HIF-1β. The content of HIF-1 in cells is very low at normal oxygen concentration. When cells are cultured in hypoxic condition, HIF-1α accumulates quickly, then translocates into the nucleus and binds HIF-1β to form complete HIF-1. The activated HIF-1 combined with hypoxia response element core sequence activates the expression of downstream genes, which further bring about the regulation of a series of events in cells and the organism.14
The interaction between ROS and HIF-1 under hypoxia condition has attracted much attention in the field of hypoxemia.15–17 Under normal oxygen condition, the level of ROS is upregulated by HIF-1α whose concentration and activity are controlled by growth factors, vasoactive peptides, as well as metal ions. The regulation of HIF-1α during hypoxia by ROS has two completely opposite effects; one is the positive regulation by inhibiting the activity of prolyl hydroxylase (PHD), the other is the negative regulation by the HIF-1α redox activity regulatory site. Under normal circumstances, ROS plays a positive role in the regulation of HIF-1 as it expresses an inhibitory influence on HIF-1α when the accumulation and activity of HIF-1α are increased excessively by external stimulation.18–21 Therefore, the regulation of the concentration and activity of HIF-1α is controlled in terms of the adjustment of ROS level. If the level of ROS changes over this range, either decreases or increases, the concentration and activity of HIF-1α are affected. For example, Luo et al discovered that the stabilization of HIF-1α required the generation of ROS under hypoxia condition and ROS promoted the stabilization of the expression of HIF-1α by inhibiting partial function of PHD.5
However, researchers seldom focus on the expression situation of intracellular-related signals by using perfluorocarbon emulsion to make a hypoxia-reoxygenation treatment. It has been reported that perfluorocarbon-encapsulated poly(lactide-co-glycolide)-poly(ethylene glycol) (PLGA-PEG) emulsion was synthesized successfully and characterized by transmission electron microscopy (TEM), dynamic light scattering (DLS), and Fourier-transform infrared spectroscopy.22 Moreover, cell cytotoxicity has shown lower cell toxicity at normoxia, but is unknown at hypoxia. Furthermore, a cell hypoxia-reoxygenation experiment was carried out through the liquid paraffin model, which failed to monitor the accurate oxygen concentration and had a certain discrepancy. The levels of ROS and HIF-1α were examined in different conditions, which failed to amply confirm the relationship between them. The animal model and measurement technique to detect oxygen supply were inaccurate.
In the present work, the cytotoxicity of A549 cells of the emulsion during hypoxia has been examined minutely with oxygen control (tri-gas) CO2 incubator. Moreover, the levels of intracellular ROS and HIF-1α during hypoxia have been carefully measured under the same conditions to evaluate the mechanism of the effect of PLGA-PEG/perfluorooctyl bromide (PFOB) emulsion on cell growth and the interrelation between them. In addition, the saline lavage-induced lung injury model of rabbits has been established to study the oxygen supply in vivo, which could further indicate the effect of the emulsion. And, the pathological changes of lung tissue could further prove this conclusion. Results of in vitro and in vivo experiments have both indicated that the emulsion is capable of supplying oxygen for cells and organisms, revealing potential application in the hypoxia alleviation of the emulsion. Finally, the distribution and metabolism features of the emulsion have been evaluated to research its effects further.
Experiment details
Materials
Amine-PEG-Acid (NH2-PEG-COOH, molecular weight [MW]=3,400 g/mol) and Resomer grade RG502 consisting of poly(lactide-co-glycolide) (PLGA-COOH, MW=20,000 g/mol) were separately obtained from Seebio Biotech (Shanghai, People’s Republic of China) and Daigang Biomaterials Co, Ltd (Shandong, People’s Republic of China). All chemicals were obtained from Sinopharm Chemical Reagent (Shanghai, People’s Republic of China) or Sigma-Aldrich (St Louis, MO, USA) and were of analytical grade or higher in purity. N,N-diethylethanamine and dichloromethane (DCM) were stored on KOH pellets to ensure dryness. Human pulmonary adenocarcinoma cell line A549 was obtained from the cell bank of the Chinese Academy of Sciences. Nude mice (experimental animal center of Shanghai Jiao Tong University) and rabbits (Second Military Medical University) were used in this experiment. Cultivate reagents were provided by Life Technologies (Gibco, Grand Island, NY, USA). Other materials, including cell counting kit-8 (CCK-8) (Fanbo Biochemicals, Beijing, People’s Republic of China), reagents of Western blot analysis (Weiao BioTech, Shanghai), blood gas analyzer (ABL-50) (Radiometer, Copenhagen, Denmark), and agents for lung slice preparations of rabbits (Sinopharm Chemical Reagent) were purchased.
Synthesis of copolymer PLGA-PEG
The PLGA-PEG diblock copolymer was synthesized by conjugating NH2-PEG-COOH with PLGA-COOH through 1-ethyl-[3-(3-dimethylamino)propyl]carbodiimide hydrochloride (EDC)/N-hydroxysuccinimide (NHS) coupling chemistry. The preparation is according to a previously reported method with some modifications.23 Briefly, 200 mg PLGA-COOH was dissolved in 10 mL DCM under magnetic stirring at room temperature. Then, 1 mg 4-dimethylaminopyridine (DMAP) was added, followed by addition of 2.9 mg EDC and 1.8 mg NHS to create PLGA-NHS. After 24 h, 34 mg NH2-PEG-COOH and 8.6 μL N,N-diethylethanamine (TEA) were added to PLGA-NHS, stirring for another 8 h. After removal of DCM on a rotary evaporator, 5 mL of N,N-dimethylformamide (DMF) was added. The synthesized copolymer was dialyzed (molecular weight cut-off [MWCO] 8.0–14.0 kDa) against deionized water for 3 days to remove unreacted PEG and other small molecules. The solution inside the dialysis bag was dried in vacuum overnight.24,25
Synthesis of copolymer PLGA-FITC
The previous process was repeated with some modifications to synthesize copolymer PLGA-fluorescein isothiocyanate (FITC). First, 200 mg PLGA-COOH was dissolved in 10 mL DCM under magnetic stirring at room temperature. Then, 1 mg DMAP was added followed by addition of 2.9 mg EDC and 1.8 mg NHS to create PLGA-NHS. Then, 1.8 mg ethylenediamine and 8.6 μL TEA were added to PLGA-NHS. After 3 h, 35 mg FITC was added to the mixture, stirring for another 8 h. After removal of DCM on a rotary evaporator, 5 mL of DMF was added. The synthesized copolymer was dialyzed (MWCO 8.0–14.0 kDa) against deionized water for 3 to 5 days to remove unreacted FITC and other small molecules. The solution inside the dialysis bag was dried in vacuum overnight.
Preparation of PLGA-PEG/PFOB emulsion
PFOB (perfluorooctyl bromide, 99%)-loaded PLGA-PEG nanoparticle contrast agent was prepared using the emulsion evaporation technique to obtain capsules with PFOB as described previously.24,26,27 Briefly, 10 mg PLGA-PEG was dissolved into 200 μL DCM and 200 μL 15% Span80@DCM (w/v) was mixed, added the desired amount of PFOB. A total of 2 mL organic solution was vigorously mixed using an Ultra-turrax T10 (IKA, Staufen, Germany) to form a pre-emulsion. Emulsification was performed in a 15 mL centrifuge tube placed over ice for 1 min. Then, the pre-emulsion was sonicated at 300 W with a vibrating metallic tip, JY 92-IIN (SCIENTZ, Ningbo, Zhejiang, People’s Republic of China), for 3 min over ice. After that, further stirring was conducted with IKA for 10 min. DCM was then evaporated by magnetic stirring for 3 h at room temperature.26–28 For contrast, PLGA-PEG emulsion was prepared in a similar process with no PFOB added. For in vivo fluorescence bio-distribution imaging experiments, PLGA-PEG mixed with 50% PLGA-FITC was used to prepare the emulsion.
Characterization
Mean particle size (Z-average) and zeta potential were measured by using Malvern Zetasizer Nano ZS (Malvern, Worcester, UK). The TEM micrograph was obtained using a JEOL JEM-2100F transmission electron microscope with a field emission gun operating at 200 kV. Fluorine content was determined by high performance ion chromatography (Dionex 500, Waltham, MA, USA) with conductivity detection through oxygen flask combustion (Separating column: IonPac AG14–AS14; Eluent: NaHCO3 0.0010M+Na2CO3 0.0035M). In vivo optical imaging was achieved in an in vivo imaging system (IVIS Lumina II, Caliper Life Sciences, Hopkinton, MA, USA). Dissolved oxygen was performed by Dissolved Oxygen Meter (HACH, Ames, IA, USA).
Cell viability assay during hypoxia treatment
The oxygen control (tri-gas) CO2 incubator is used to construct the hypoxia model of cell culturing, and A549 cells were chosen. An appropriate number of A549 cells (5,000 per well) were first seeded in 96-well plates for 24 h before the treatment day. Then, the media was replaced with 100 μL DMEM with 10% fetal bovine serum and 1% antibiotics. Then, cells were put into the 3 gas incubator with 1%, 5%, or 10% oxygen concentration to provide hypoxic environments for 4 h, while the control group was continuously cultured with the normal oxygen concentration. After that, the supernatant was removed. Cell viability was determined using the CCK-8 assay by measuring the optical density.29–31
Cell viability assay during hypoxia-reoxygenation treatment
An appropriate number of A549 cells (5,000 per well) were first seeded in 96-well plates for 24 h before the treatment day. Then, the cells were put into the 3 gas incubator with 1% oxygen concentration for hypoxic treatment for 12 h, while the control group was always cultured at normal oxygen concentration. After that the supernatant was removed and different concentrations of PLGA-PEG/PFOB emulsion were added to reoxygenate under normoxia condition. After 2 h, the supernatant was removed. Cell viability was determined using the CCK-8 assay by measuring the optical density.
ROS measurement
Neutrophil intracellular ROS generation was measured using fluorescence spectrophotometry with 2′, 7′-dichlorofluorescin diacetate (DCFH-DA). Once inside the cell the acetyl groups are cleaved by cytosolic enzymes to form the polar non-fluorescent dichlorofluorescein (DCFH), which is rapidly oxidized to highly fluorescent 2′, 7′-dichlorofluorescein (DCF) in the presence of hydrogen peroxide.32 A549 cells plated on 6-well plates were maintained under normoxic condition for 24 h, after which medium was replaced with different concentrations of PLGA-PEG/PFOB emulsion under hypoxic condition (10% O2, 5% CO2, balanced N2) for 4 h. The cells were then incubated with growth medium in the presence of 10 μM DCFH-DA under normoxic condition for another 0.5 h. The medium was removed carefully and cells were washed 3 times with medium through centrifugation (1,000 rpm, 3 min, 4°C). The DCF fluorescence intensity was observed by a bright green fluorescence when excited with blue light (488 nm) using fluorescence microscopy and also detected by flow cytometer.
Western blot analysis
For the detection of HIF-1α by Western blot analysis, an HIF-1α primary antibody was employed. Cells were harvested and lysed in radio immunoprecipitation assay lysis buffer containing 1 nM phenylmethylsulfonyl fluoride. The mixture was centrifuged at 12,000 rpm for 5 min at 4°C, and the supernatant was collected. The protein concentration was determined using bicinchoninic acid assay kit, and each sample contained 2 μg protein per 1 μL. The supernatant was electrophoresed using sodium dodecyl sulfate polyacrylamide gel electrophoresis and then transferred onto a polyvinylidene fluoride membrane. The membranes were blocked with 3% bovine serum albumin (BSA) plus tris-buffered saline (TBS), and 0.1% Tween-20 (tris-buffered saline with Tween 20 [TBS-T]) for 1 h at room temperature and then incubated with HIF-1α primary antibody in 3% BSA plus TBS-T at 4°C overnight. After the membranes were washed with TBS-T, they were further incubated with a secondary antibody conjugated with horseradish peroxidase for 1 h at room temperature. The membranes were washed three times with TBS-T and the color was developed by an enhanced chemiluminescence method. For the detection of β-actin, a β-actin antibody was employed. The membrane was stripped and re-probed with β-actin antibody against actin (1:1,500 dilution). HIF-1α blots were quantified via densitometric analysis and normalized to β-actin levels.
In vivo oxygen supply
All animal experiments were approved by the Institutional Animal Care and Use Committee of Shanghai Jiao Tong University and performed following the National Institutes of Health guidelines for the use of experimental animals. New Zealand white rabbits were used to establish a saline lavage acute lung injury model for exploring oxygen supply in vivo.33,34 The experimental animals were randomly assigned to 2 groups; control group and experimental group. Rabbits were anesthetized and restrained in the supine position. In the experimental group, lung injury was induced by a saline lavage protocol, with minor modification of the technique described previously by Lachmann et al.49 The warmed sterile saline (10 mL/kg) was instilled via the endotracheal tube, and the rabbits were gently rocked from side to side to distribute saline uniformly. The lavage process was repeated 3 times and each lavage was performed at 5 min intervals. After 30 min, blood gas sampling was done. When the oxygenation index was maintained below 300 mmHg for 30 min, we assumed that the acute respiratory distress syndrome model was completed. After induction of lung injury, the experimental group was treated with aerosolized PLGA-PEG/PFOB emulsion for 20 min with a flow rate of 4 L/min, while the control group was treated with nebulized 0.9% NaCl. Blood gas sampling was done at baseline, control (after the induction of lung injury), 0 (inhalation only), 15, 30, and 45 min, and 1, 2, 3, and 4 h. The rabbits were euthanized with sodium pentobarbital and lungs were prepared for histological analyses. The changes in the lungs were evaluated under macroscopic observation and then lung tissues were prepared for histological analyses.
Histological sections
Lung tissues of rabbits were collected and fixed by 4% polyformalin for >24 h, then sections were hydrated with a series of graded alcohol washes. The tissues were embedded in paraffin and cut serially into coronal and sagittal slices of 4 μm thickness using a microtome. The tissue sections were baked at 60°C, then taken out and preserved at room temperature. Sections were deparaffinized with xylene and hydrated with a series of graded alcohol washes, then each section was stained with H&E for 5 min, then hydrated with a series of graded alcohol washes. The sections were taken out and sealed by neutral balsam after being slightly dried. Finally, the pathological changes of lung tissue were observed under light microscope.
In vivo bio-distribution of PLGA-PEG/PLGA-FITC/PFOB emulsion
Nude mice were used to evaluate in vivo bio-distribution of PLGA-PEG/PFOB emulsion. Mice were anesthetized with 5% chloral hydrate at 10 mL·kg−1. About 0.05 mL PLGA-PEG/PFOB emulsion containing PLGA-FITC was instilled into the trachea at a speed of 0.1 mL/min. In vivo bio-distribution imaging was performed every 1 h. Finally, the mice were anatomized to confirm the organ type.
Statistical analysis
All data are presented as means ± standard deviation (SD). Student’s t-test was used for comparison of the 2 groups. Statistical difference was considered significant at a P-value of <0.05.
Results and discussion
According to our previous reports,22 the PLGA-PEG molecule had been successfully synthesized to further use to prepare PLGA-PEG/PFOB emulsion. Figure 1A shows the TEM image in which the sphere-like structure with the core in gray and the shell in a dark shade could be observed, and the average diameter of the emulsion was about 222 nm (Figure 1B). Additionally, the content of PFOB in the freeze-dried powder of PLGA-PEG/PFOB emulsion has been evaluated by high performance ion chromatography, which was calculated to be about 9.43%. The oxygen accumulation capacity of PLGA-PEG/PFOB emulsions was performed at 25°C and 1 atm, and was about 12 mL/dL.
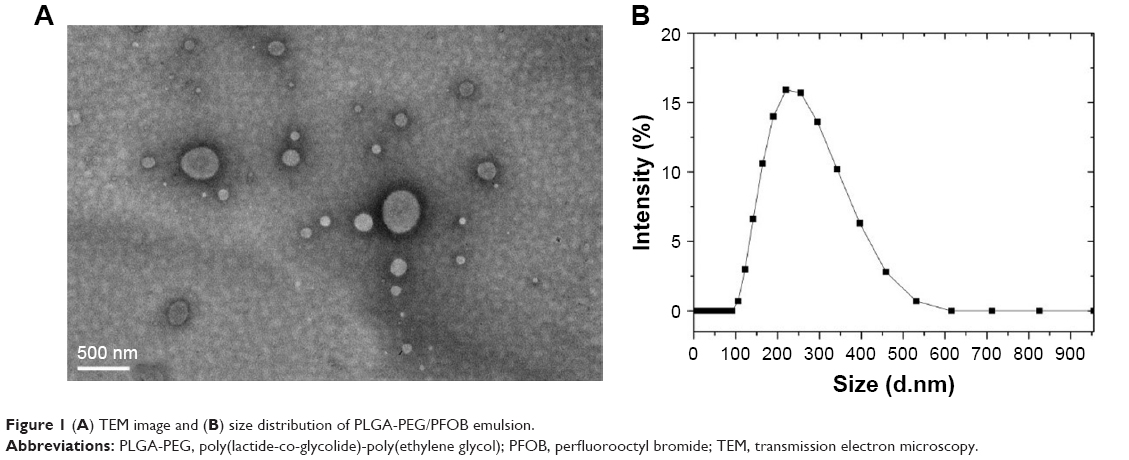 | Figure 1 (A) TEM image and (B) size distribution of PLGA-PEG/PFOB emulsion. |
In order to evaluate the effect of oxygen on the cell growth, A549 cells were cultured with different oxygen concentrations. Figure 2A shows that the cell viability improved with increasing oxygen concentration. Low oxygen concentrations contributed to the production of ROS, which was consistent with previous reports.35 Moreover, ROS were implicated in the regulation of many indispensable cellular events, such as transcription factor activation, gene expression, as well as cellular proliferation.36–38 However, excessive production of ROS gave rise to activation of events of cell injury or death.39 Therefore, intracellular ROS has been measured by DCFH-DA to explore the correlation between oxygen concentration and generation of ROS. Figure 2B1–B4 shows green cells from DCF fluorescence under different oxygen conditions in the fluorescent microscopic image, which implies the level of ROS increased with the decreasing oxygen concentration. Consequently, the A549 cell growth showed dependence on oxygen supply, and related to ROS levels at different oxygen concentrations.
 | Figure 2 (A) OD value and (B) fluorescent microscopic images of cellular ROS production under different oxygen conditions. Oxygen concentration: (B1) 1%, (B2) 5%, (B3) 10% and (B4) normoxia. |
CCK-8 assay was performed to estimate in vitro cytotoxicity of PLGA-PEG/PFOB emulsion at different oxygen concentrations. Figure 3 shows the viabilities of A549 cells after 12 h of incubation with different concentrations of PLGA-PEG/PFOB emulsion (0.025–0.8 mg/mL) at 1%, 5%, 10%, and normal oxygen concentration. They were elevated gradually with the increasing concentration of PLGA-PEG/PFOB emulsion at 1% oxygen concentration and even reached about 123% with PLGA-PEG/PFOB emulsion of 0.8 mg/mL concentration. However, the cell viability increased initially and decreased afterwards under 5% oxygen concentration, and the maximal viability was 122% with PLGA-PEG/PFOB emulsion of 0.1 mg/mL concentration. Similarly, the same results were obtained at 10% oxygen concentration except that the maximal viability was 115% when 0.05 mg/mL PLGA-PEG/PFOB emulsion was applied. Nevertheless, the cell viability also improved in normoxia condition, which was attributed to the oxygen-vector of PLGA-PEG/PFOB emulsion and the low level of ROS from cell injury (Figure 2B4). These results implied that the promotion of cell viability may be attributed to the ability to dissolve the oxygen of PFOB in emulsion and the decrease afterwards was due to the generation of ROS. Specifically, the oxygen contained in PFOB emulsion is sufficient to recover the cell viability under the condition of severe hypoxia (1%), which led to the constant improvement of cell viability. However, it is not the same at moderate hypoxia (5%–10%), and a balance between cell recovery and apoptosis might exist with the addition of different PLGA-PEG/PFOB emulsions.
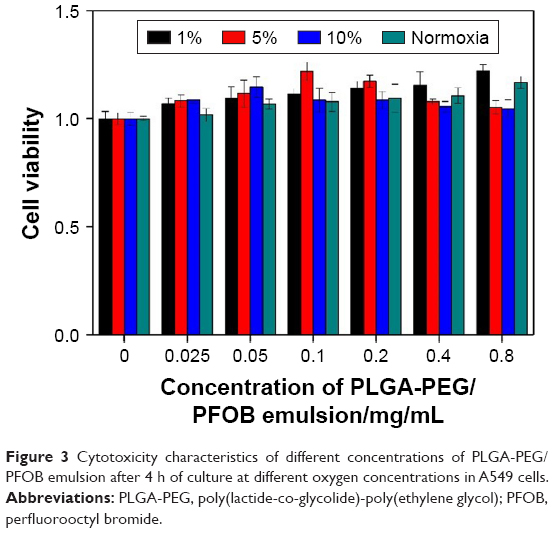 | Figure 3 Cytotoxicity characteristics of different concentrations of PLGA-PEG/PFOB emulsion after 4 h of culture at different oxygen concentrations in A549 cells. |
Because 10% oxygen concentration is superior to 5% oxygen concentration for cell reoxygenation through PLGA-PEG/PFOB emulsion treatment, to shed light on the mechanism of the kind of balance between cell recovery and apoptosis, the levels of ROS and HIF-1α in A549 cells were measured under 10% oxygen condition. Our previous reports have shown that the excessive production of ROS was unfavorable to the cell viability, but the stabilization of HIF-1α could be seen as a crucial factor for cell viability during hypoxia (Figure 4A).22 The release of ROS was required for the hypoxic stabilization of HIF-1α, because ROS could affect the rate of HIF-1α hydroxylation, promoting the accumulation and activation of HIF-1α by partially inhibiting the activity of PHDs. Therefore, the expressions of ROS and HIF-1α during hypoxia were estimated respectively. Figure 4B1 shows there was almost no DCF fluorescence in the control group, while green cells from DCF fluorescence can be seen in the fluorescent microscopic image after 12 h of hypoxia treatment. It was implied that the ROS level in cells cultured under normal oxygen condition was extremely low and hypoxia condition can promote the generation of ROS. Green cells from DCF fluorescence could be seen distinctly in the fluorescent microscopic image with increase in the concentration of PLGA-PEG/PFOB emulsion, which indicated that the ROS level in cells also enhanced gradually (Figure 4B2–B7). These results revealed that the hypoxic condition could be propitious to the production of intracellular ROS, which may further influence the concentration and activity of HIF-1α.
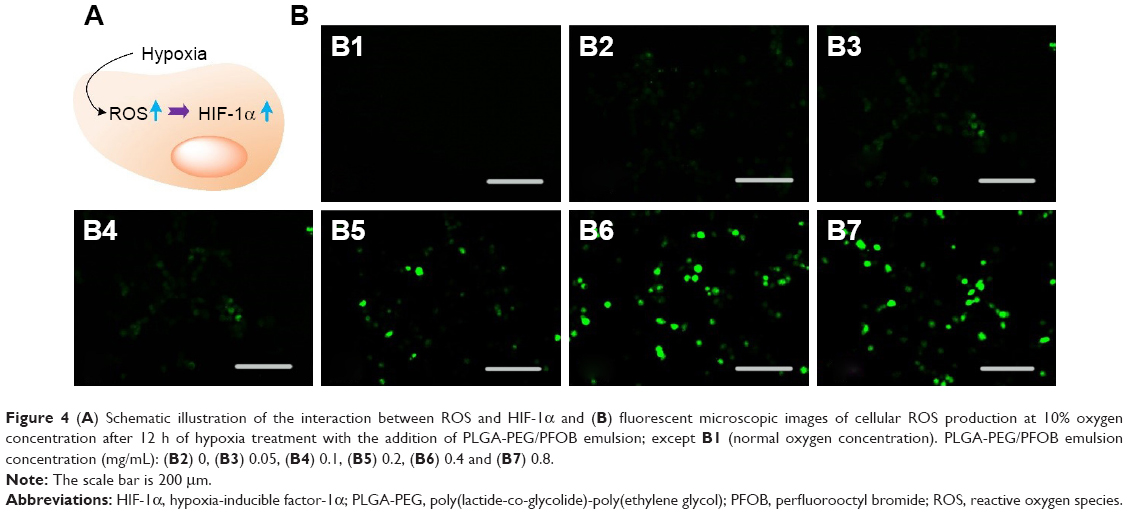 | Figure 4 (A) Schematic illustration of the interaction between ROS and HIF-1α and (B) fluorescent microscopic images of cellular ROS production at 10% oxygen concentration after 12 h of hypoxia treatment with the addition of PLGA-PEG/PFOB emulsion; except B1 (normal oxygen concentration). PLGA-PEG/PFOB emulsion concentration (mg/mL): (B2) 0, (B3) 0.05, (B4) 0.1, (B5) 0.2, (B6) 0.4 and (B7) 0.8. |
On the other hand, Western blot analysis was performed to examine the expression of HIF-1α in cells using β-actin as internal control. Figure 5 shows the expression level of HIF-1α in the control group, cultured under 10% oxygen condition, was low, relatively, because of the degradation by PHDs. The addition of 0.025–0.05 mg/mL PLGA-PEG/PFOB emulsion significantly promoted the expression of HIF-1α, while the increasing concentration of PLGA-PEG/PFOB emulsion (0.05–0.8 mg/mL) caused decrease in the expression of HIF-1α. Thus, we can surmise that the balance of ROS and HIF-1α may have an important contribution to cell viability during the addition of PLGA-PEG/PFOB emulsion under moderate hypoxia. Generally, ROS plays a positive role in adjusting HIF-1α, as it has an inhibitory effect on the expression of HIF-1α when the concentration and activity of HIF-1α are increased excessively by external stimulation. Some other papers have mentioned that the body produces and removes ROS continuously to maintain a dynamic equilibrium under physiological circumstances. Once the balance is disrupted, ROS can bind intracellular proteins and nucleic acids to damage cell structure and function, even leading to apoptosis.40–42 Therefore, the counterpoise of interaction of ROS and HIF-1α has contributed to the increase in cell viability initially and decrease afterwards under moderate hypoxia.
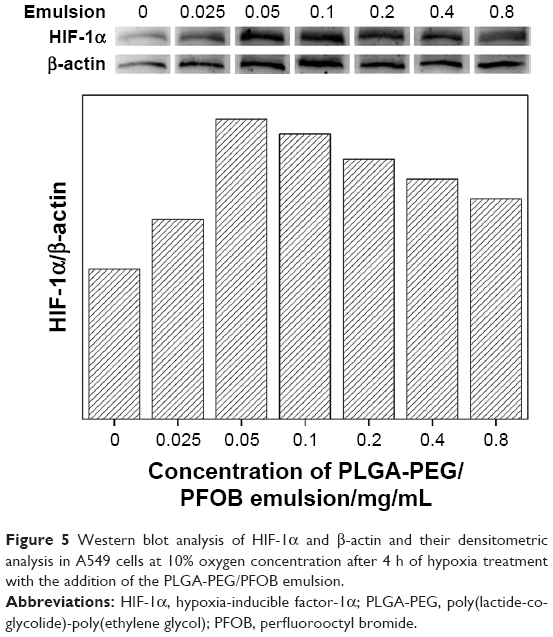 | Figure 5 Western blot analysis of HIF-1α and β-actin and their densitometric analysis in A549 cells at 10% oxygen concentration after 4 h of hypoxia treatment with the addition of the PLGA-PEG/PFOB emulsion. |
The regulating mechanism is suggested. As is well known, ROS can regulate the level and activity of HIF-1 in conditions of hypoxia or normoxia, which are always affected by many factors, including cell type, oxygen partial pressure, additive, and so on.43–46 Under hypoxic conditions, ROS regulate HIF-1 with 2 opposite effects. One is the positive regulation by inhibiting PHDs activity.47 The other is the negative regulation through the redox active site of HIF-1.48 On the other hand, under normoxic conditions, the factors that influence the content and activity regulation of HIF-1 include growth factors, vasoactive peptides and metal ions, which can play a regulatory role by promoting the production of ROS. For example, the overexpression of nicotinamide adenine dinucleotide phosphate (NADPH) oxidase in A549 cells can increase the level of HIF-1.49 In the present experiment using 10% oxygen concentration, the low PLGA-PEG/PFOB emulsion concentration (0.025–0.05 mg/mL) results in the increase in the level of ROS in A549 cells, which significantly promotes the expression of HIF-1α by the inhibiting activity of PHD and overexpressing NADPH oxidase. However, at a higher PLGA-PEG/PFOB emulsion concentration (0.05–0.8 mg/mL), the increase in the level of ROS causing decrease in the expression of HIF-1α is attributed to the increase in redox factors from the dissolved oxygen in PLGA-PEG/PFOB emulsion. The integrated regulating factors between ROS and HIF-1α could lead to the results shown in Figures 4 and 5.
To estimate the reoxygenation ability of PLGA-PEG/PFOB emulsion, the viability of A549 cells was detected through hypoxia-reoxygenation model of the 3 gas incubator. Figure 6A shows that a remarkable enhancement of cell viability was exhibited after 12 h of hypoxia treatment and 2 h of reoxygenation treatment with the addition of PLGA-PEG/PFOB emulsion. Moreover, the increasing concentration of PLGA-PEG/PFOB emulsion (0.025–0.8 mg/mL) had constantly increasing cell viability. The reason for the enhancement in cell viability could be due to the high ability to dissolve oxygen of PFOB, which supplies sufficient oxygen to help cell reoxygenation, thus restoring it back from the hypoxic state. However, closer observation has revealed that the rate of cell reoxygenation varied at different oxygen concentrations. The highest was in normoxia and the lowest in severe hypoxia (1%), as shown in Figure 2, which could result from the cell injury at low oxygen concentration. Furthermore, similar results could be found in Figure 6B. The different times of incubation at 1% oxygen concentration have contributed to the different rates of reoxygenation. The rate of cell reoxygenation was the lowest after 48 h of hypoxia intervention, but the strongest after 12 h of hypoxia intervention, which could be explained by more severe cell injury caused by prolonged hypoxic intervention. The results indicate that the PLGA-PEG/PFOB emulsion could be applied as oxygen-carrier to enhance cell viability and help reoxygenation by supplying oxygen.
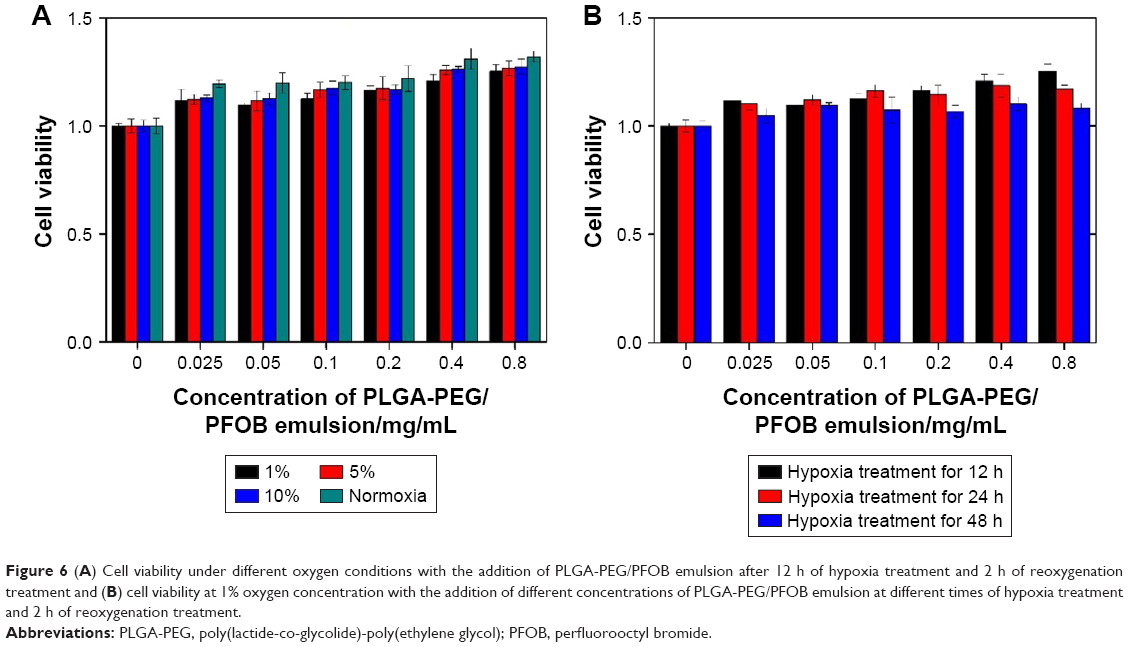 | Figure 6 (A) Cell viability under different oxygen conditions with the addition of PLGA-PEG/PFOB emulsion after 12 h of hypoxia treatment and 2 h of reoxygenation treatment and (B) cell viability at 1% oxygen concentration with the addition of different concentrations of PLGA-PEG/PFOB emulsion at different times of hypoxia treatment and 2 h of reoxygenation treatment. |
To confirm the oxygen supply of PLGA-PEG/PFOB emulsion in vivo, a rabbit administration model was established (Figure 7A), in which the experimental group was treated with aerosolized PLGA-PEG/PFOB emulsion for 20 min, while the control group was treated with nebulized 0.9% NaCl for the same time. The levels of arterial blood gases were measured after intratracheal drug delivery, and the arterial partial pressure of oxygen (PaO2) was observed. As shown in Figure 7B, compared with the control group, we have observed marked decrease in PaO2 in the experimental group after the induction of lung injury, which could suggest that saline lavage led to temporary suffocation in rabbits. After emulsion treatment, PaO2 increased continuously while PaO2 in the control group increased slightly, depending on the natural recovery of the rabbits. Therefore, the result indicated that the PLGA-PEG/PFOB emulsion could supply oxygen to rabbits and improve lung ventilation enormously.
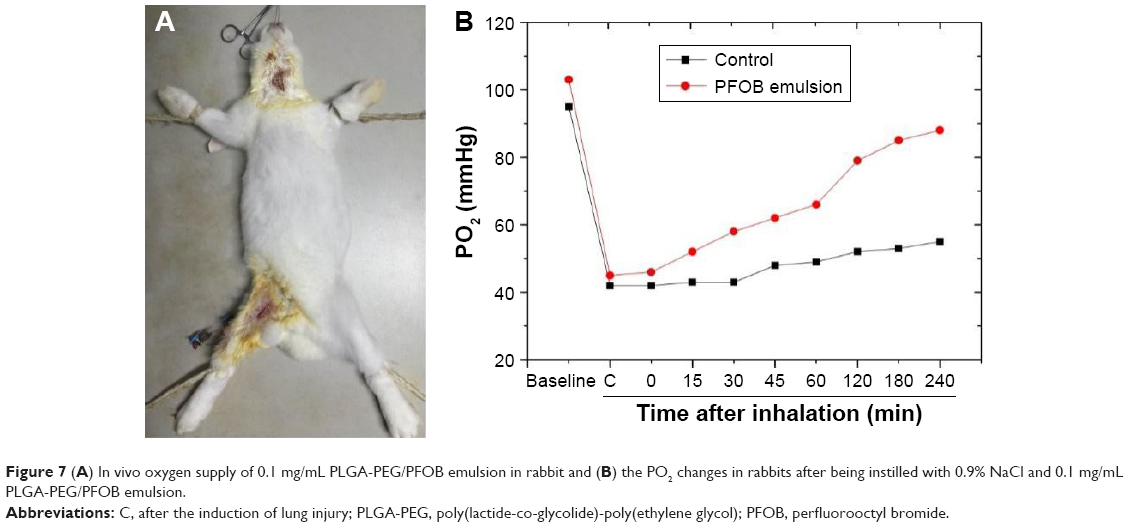 | Figure 7 (A) In vivo oxygen supply of 0.1 mg/mL PLGA-PEG/PFOB emulsion in rabbit and (B) the PO2 changes in rabbits after being instilled with 0.9% NaCl and 0.1 mg/mL PLGA-PEG/PFOB emulsion. |
Lung tissue sections were made to further evaluate the effect of PLGA-PEG/PFOB emulsion on lung injury. As seen from the 2 images, the pulmonary congestion region of the control group proved to be larger and more severe than the experimental group (Figure 8A1 and B1). More severe pulmonary edema and congestion were observed in the experimental group. Furthermore, the lung tissue sections were observed under light microscope. Figure 8A2 and A3 show a large number of inflammatory cells aggregating in the airspace in the control group compared with the experimental group (Figure 8B2 and B3, labeled by red arrows). Additionally, more dilated and congested capillaries of the alveolar wall were also discovered in the control group (labeled by black arrows). The different intensity between the control group (Figure 8A2 and A3) and the experimental group (Figure 8B2 and B3) could be explained by the fact that PLGA-PEG/PFOB emulsion can relieve pulmonary edema and congestion, and inflammatory cell aggregation. Therefore, the experimental group has less tissue marginal alveolar wall cells, and the alveolar phrenic of that are more loose and stained slightly. These results implied that PLGA-PEG/PFOB emulsion administration could greatly reduce pulmonary inflammation. The possible reasons are as follows: the production of inflammatory cytokines and the aggregation of inflammatory cells could be inhibited by perfluorocarbons (such as PFOB), and the addition of the emulsion could act as surfactant and reduce the surface tension so that lung ventilation could be improved greatly; the emulsion was able to better spread in the lungs, while 0.9% NaCl might cause airway obstruction.
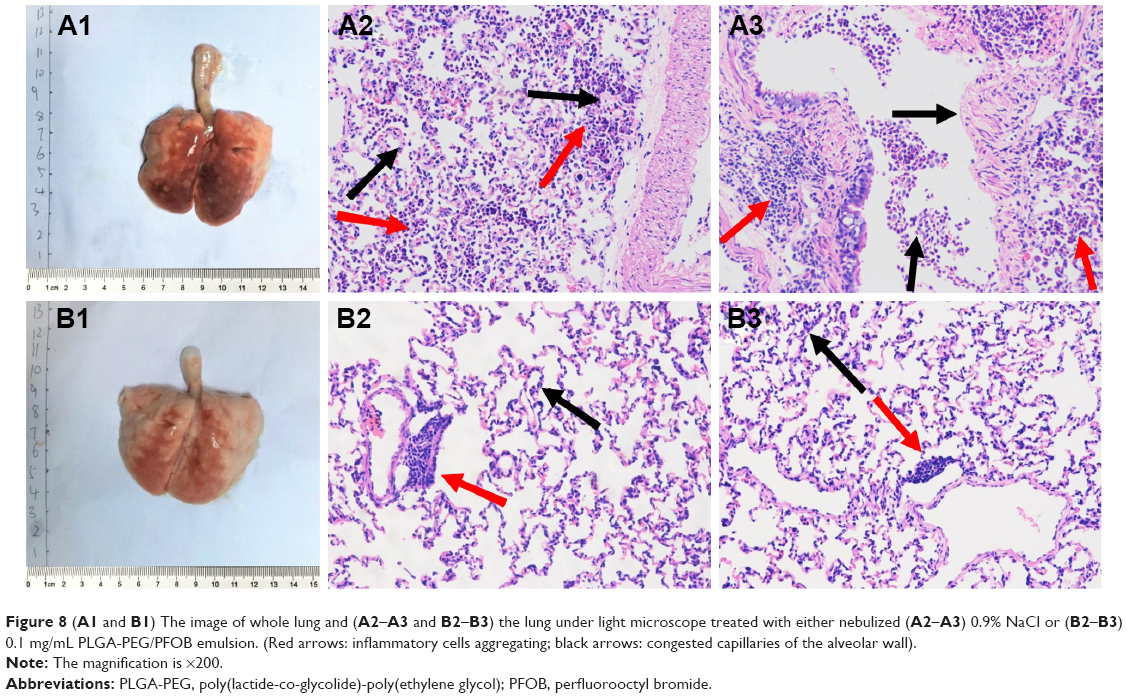 | Figure 8 (A1 and B1) The image of whole lung and (A2–A3 and B2–B3) the lung under light microscope treated with either nebulized (A2–A3) 0.9% NaCl or (B2–B3) 0.1 mg/mL PLGA-PEG/PFOB emulsion. (Red arrows: inflammatory cells aggregating; black arrows: congested capillaries of the alveolar wall). |
PLGA-PEG/PLGA-FITC/PFOB emulsion was prepared in which PLGA-FITC acts as a marker to trace the emulsion. In vivo bio-distribution and metabolism of the emulsion in some nude mice were observed after the administration of 0.05 mL emulsion by inhalation. As shown in Figure 9A, the emulsion was mainly distributed in the bronchus initially, then transferred to various organs, such as the lungs, heart, liver, intestines, and kidneys (Figure 9B) an hour later. Over time, the concentration of the emulsion in kidneys was found to be the highest, which revealed that the emulsion was concentrated in the kidneys (Figure 9C–E). However, it was found that the concentration of the emulsion gradually decreased over time, which indicated that the emulsion was likely to be metabolized gradually by the kidneys (Figure 9F).
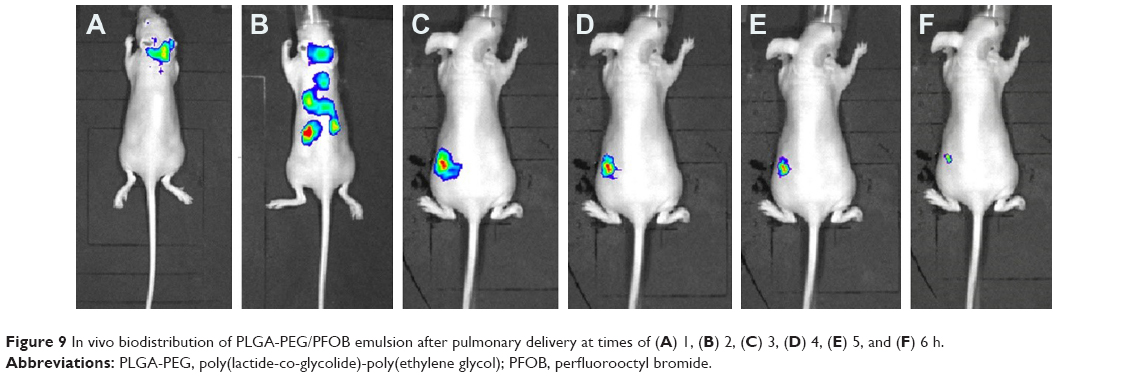 | Figure 9 In vivo biodistribution of PLGA-PEG/PFOB emulsion after pulmonary delivery at times of (A) 1, (B) 2, (C) 3, (D) 4, (E) 5, and (F) 6 h. |
Conclusion
We have successfully synthesized PLGA-PEG. The characterization of TEM and DLS showed that nano PLGA-PEG was coated on the surface of PFOB. The cytotoxicity experiment showed that the emulsion had lower cell toxicity. In addition, hypoxia-reoxygenation experiments indicated that cell viability significantly increased after the addition of PLGA-PEG/PFOB emulsion due to the ability to dissolve the oxygen of PFOB, probably. Meanwhile, the level of intracellular ROS distinctly increased at 10% oxygen concentration with the increase in concentration of the emulsion. The expression level of HIF-1α indicated that certain emulsions could decrease the level of HIF-1α and improve hypoxia, which revealed the interaction of ROS and HIF-1α. Increasing ROS could enhance the expression of HIF-1, but ROS might also inhibit its production when the content and activity of HIF-1 increased excessively by external stimulation. Therefore, the balance between the production of ROS and HIF-1α played an indispensable role in cell proliferation. Oxygen supply in vivo was studied by establishing the rabbit’s saline lavage acute lung injury model for pulmonary drug delivery, which showed that the emulsion could provide oxygen to improve lung ventilation in animals. The lung tissue sections were observed to study the effect of the emulsion on the lung tissue of rabbits, which illustrated the emulsion had lower cell toxicity. Finally, the biodistribution of the emulsion in vivo showed that it could flow to the majority of organs through the blood circulation, and is eventually metabolized by the kidneys. As a result, the emulsion has great potential application value in the field of alleviating hypoxemia in future.
Acknowledgment
The work is supported by Shanghai Science and Technology Innovation Action Project (number 15441907000).
Author contributions
All authors contributed toward data analysis, drafting and critically revising the paper and agree to be accountable for all aspects of the work.
Disclosure
The authors report no conflicts of interest in this work.
References
Arab A, Kuemmerer K, Wang J, Bode C, Hehrlein C. Oxygenated perfluorochemicals improve cell survival during reoxygenation by pacifying mitochondrial activity. J Pharmacol Exp Ther. 2008;325(2):417–424. | ||
Guzy RD, Hoyos B, Robin E, et al. Mitochondrial complex III is required for hypoxia-induced ROS production and cellular oxygen sensing. Cell Metab. 2005;1(6):401–408. | ||
Hsieh CH, Kuo JW, Lee YJ, Chang CW, Gelovani JG, Liu RS. Construction of mutant TKGFP for real-time imaging of temporal dynamics of HIF-1 signal transduction activity mediated by hypoxia and reoxygenation in tumors in living mice. J Nucl Med. 2009;50(12):2049–2057. | ||
Li S, Tabar SS, Malec V, et al. NOX4 regulates ROS levels under normoxic and hypoxic conditions, triggers proliferation, and inhibits apoptosis in pulmonary artery adventitial fibroblasts. Antioxid Redox Signal. 2008;10(10):1687–1698. | ||
Luo L, Lu J, Wei L, et al. The role of HIF-1 in up-regulating MICA expression on human renal proximal tubular epithelial cells during hypoxia/reoxygenation. BMC Cell Biol. 2010;11:91. | ||
Shao ZH, Li CQ, Vanden Hoek TL, et al. Extract from Scutellaria baicalensis Georgi attenuates oxidant stress in cardiomyocytes. J Mol Cell Cardiol. 1999;31(10):1885–1895. | ||
Li C, Jackson RM. Reactive species mechanisms of cellular hypoxia-reoxygenation injury. Am J Physiol Cell Physiol. 2002;282(2):C227–C241. | ||
Chang TC, Huang CJ, Tam K, et al. Stabilization of hypoxia-inducible factor-1α by prostacyclin under prolonged hypoxia via reducing reactive oxygen species level in endothelial cells. J Biol Chem. 2005;280(44):36567–36574. | ||
Biswas S, Gupta MK, Chattopadhyay D, Mukhopadhyay CK. Insulin-induced activation of hypoxia-inducible factor-1 requires generation of reactive oxygen species by NADPH oxidase. AM J Physiol Heart Circ Physiol. 2007;292(2):H758–H766. | ||
Prabhakar NR, Kumar GK, Nanduri J. Intermittent hypoxia augments acute hypoxic sensing via HIF-mediated ROS. Resp Physiol Neurobiol. 2011;174(3):230–234. | ||
Chandel NS, Mcclintock DS, Feliciano CE, et al. Reactive oxygen species generated at mitochondrial complex III stabilize hypoxia-inducible factor-1α during hypoxia: a mechanism of O2 sensing. J Biol Chem. 2000;275(33):25130–25138. | ||
Griffiths EA, Pritchard SA, Valentine HR. Hypoxia-inducible factor-1α expression in the gastric carcinogenesis sequence and its prognostic role in gastric and gastro-oesophageal adenocarcinomas. Brit J Cancer. 2007;96(1):95–103. | ||
Moeller BJ, Cao Y, Vujaskovic Z, Dewhirst MW. Reactive oxygen species and hypoxia inducible factor-1α serve as important vascular stabilizing elements in tumors following radiotherapy. In J Radiat Oncol. 2003;57(2):S320–S321. | ||
Dewhirst MW, Cao Y, Moeller B. Cycling hypoxia and free radicals regulate angiogenesis and radiotherapy response. Nat Rev Cancer. 2008;8(6):425–437. | ||
Wyatt CN, Buckler KJ. The effect of mitochondrial inhibitors on membrane currents in isolated neonatal rat carotid body type I cells. J Physiol. 2004;556(Pt 1):175–191. | ||
Hool LC, Arthur PG. Decreasing cellular hydrogen peroxide with catalase mimics the effects of hypoxia on the sensitivity of the L-type Ca2+ channel to beta-adrenergic receptor stimulation in cardiac myocytes. Circ Res. 2002;91(7):601–609. | ||
Kaelin WG Jr. ROS: really involved in oxygen sensing. Cell Metab. 2005;1(6):357–358. | ||
Belaiba RS, Djordjevic T, Bonello S, et al. Redox-sensitive regulation of the HIF pathway under non-hypoxic conditions in pulmonary artery smooth muscle cells. Biol Chem. 2004;385(3–4):249–257. | ||
Zhu XY, Rodriguez-Porcel M, Bentley MD, et al. Antioxidant intervention attenuates myocardial neovascularization in hypercholesterolemia. Circulation. 2004;109(17):2109–2115. | ||
Kietzmann T, Gorlach A. Reactive oxygen species in the control of hypoxia-inducible factor-mediated gene expression. Semin Cell Dev Biol. 2005;16(4–5):474–486. | ||
Richard DE, Berra E, Pouyssegur J. Nonhypoxic pathway mediates the induction of hypoxia-inducible factor 1α in vascular smooth muscle cells. J Biol Chem. 2000;275(35):26765–26771. | ||
Yao Y, Zhang M, Liu T, et al. Perfluorocarbon-Encapsulated PLGA-PEG emulsions as enhancement agents for highly efficient reoxygenation to cell and organism. Acs Appl Mater Interfaces. 2015;7(33):18369–18378. | ||
Yoneki N, Takami T, Ito T, et al. One-pot facile preparation of PEG-modified PLGA nanoparticles: effects of PEG and PLGA on release properties of the particles. Colloids Surf A. 2015;469:66–72. | ||
Cheng J, Teply BA, Sherifi I, et al. Formulation of functionalized PLGA–PEG nanoparticles for in vivo targeted drug delivery. Biomaterials. 2007;28(5):869–876. | ||
van der Vlies AJ, O’Neil CP, Hasegawa U, Hammond N, Hubbell JA. Synthesis of pyridyl disulfide-functionalized nanoparticles for conjugating thiol-containing small molecules, peptides, and proteins. Bioconjug Chem. 2010;21(4):653–662. | ||
Diaz-Lopez R, Tsapis N, Santin M, et al. The performance of PEGylated nanocapsules of perfluorooctyl bromide as an ultrasound contrast agent. Biomaterials. 2010;31(7):1723–1731. | ||
Pisani E, Tsapis N, Paris J, Nicolas V, Cattel L, Fattal E. Polymeric nano/microcapsules of liquid perfluorocarbons for ultrasonic imaging: physical characterization. Langmuir. 2006;22(9):4397–4402. | ||
Cui W, Bei J, Wang S, et al. Preparation and evaluation of poly(L-lactide-co-glycolide) (PLGA) microbubbles as a contrast agent for myocardial contrast echocardiography. J Biomed Mater Res B Appl Biomater. 2005;73(1):171–178. | ||
Wang Z, Ting Z, Li Y, Chen G, Lu Y, Hao X. MicroRNA-199a is able to reverse cisplatin resistance in human ovarian cancer cells through the inhibition of mammalian target of rapamycin. Oncol Lett. 2013;6(3):789–794. | ||
Wu ZB, Cai L, Lin SJ, et al. High-mobility group box 2 is associated with prognosis of glioblastoma by promoting cell viability, invasion, and chemotherapeutic resistance. Neuro Oncol. 2013;15(9):1264–1275. | ||
Yang L, Wu XH, Wang D, Luo CL, Chen LX. Bladder cancer cell-derived exosomes inhibit tumor cell apoptosis and induce cell proliferation in vitro. Mol Med Rep. 2013;8(4):1272–1278. | ||
Millar TM, Phan V, Tibbles LA. ROS generation in endothelial hypoxia and reoxygenation stimulates MAP kinase signaling and kinase-dependent neutrophil recruitment. Free Radic Biol Med. 2007;42(8):1165–1177. | ||
Kamiyama J, Jesmin S, Sakuramoto H, et al. Hyperinflation deteriorates arterial oxygenation and lung injury in a rabbit model of ARDS with repeated open endotracheal suctioning. BMC Anesthesiol. 2015;15:73. | ||
Engel M, Nowacki RM, Boden P, et al. The effects of dexamethasone and oxygen in ventilated adult sheep with early phase acute respiratory distress syndrome. Lung. 2015;193(1):97–103. | ||
Murphy MP. How mitochondria produce reactive oxygen species. Biochem J. 2009;417(1):1–13. | ||
Sermeus A, Rebucci M, Fransolet M, et al. Differential effect of hypoxia on etoposide-induced DNA damage response and p53 regulation in different cell types. J Cell Physiol. 2013;228(12):2365–2376. | ||
Garridourbani S, Jaquet V, Imhof BA. [ROS and NADPH oxidase: key regulators of tumor vascularization]. Med Sci (Paris). 2014;30(4):415–421. French. | ||
Sato A, Okada M, Shibuya K, et al. Pivotal role for ROS activation of p38 MAPK in the control of differentiation and tumor-initiating capacity of glioma-initiating cells. Stem Cell Res. 2014;12(1):119–131. | ||
Lin CM, Chen CT, Lee HH, Lin JK. Prevention of cellular ROS damage by isovitexin and related flavonoids. Planta Med. 2002;68(4):365–367. | ||
Ramsey MR, Sharpless NE. ROS as a tumour suppressor? Nat Cell Biol. 2006;8(11):1213–1215. | ||
Inoue M, Sato EF, Nishikawa M, et al. Mitochondrial generation of reactive oxygen species and its role in aerobic life. Curr Med Chem. 2003;10(23):2495–2505. | ||
Andreyev AY, Kushnareva YE, Starkov AA. Mitochondrial metabolism of reactive oxygen species. Biochemistry (Mosc). 2005;70(2):200–214. | ||
Kim JH, Park SH, Park SG, Choi JS, Xia Y, Sung JH. The pivotal role of reactive oxygen species generation in the hypoxia-induced stimulation of adipose-derived stem cells. Stem Cells Dev. 2011;20(10):1753–1761. | ||
Maltepe E, Saugstad OD. Oxygen in health and disease: regulation of oxygen homeostasis-clinical implications. Pediatr Res. 2009;65(3):261–268. | ||
Faubert B, Vincent EE, Griss T, et al. Loss of the tumor suppressor LKB1 promotes metabolic reprogramming of cancer cells via HIF-1α. Proc Natl Acd Sci U S A. 2014;111(7):2554–2559. | ||
Hirota K, Semenza GL. Regulation of hypoxia-inducible factor 1 by prolyl and asparaginyl hydroxylases. Biochem Biophys Res Commun. 2005;338(1):610–616. | ||
Carrero P, Okamoto K, Coumailleau P, O’Brien S, Tanaka H, Poellinger L. Redox-regulated recruitment of the transcriptional coactivators CREB-binding protein and SRC-1 to hypoxia-inducible factor 1α. Mol Cell Biol. 2000;20(1):402–415. | ||
Yang ZZ, Zhang AY, Yi FX, Li PL, Zou AP. Redox regulation of HIF-1α levels and HO-1 expression in renal medullary interstitial cells. Am J Physiol Renal Physiol. 2003;284(6):F1207–F1215. | ||
Lachmann B, Robertson B, Vogel J. In vivo lung lavage as an experimental model of the respiratory distress syndrome. Acta Anaesth Scand. 1980;24(3):231–236. |
 © 2018 The Author(s). This work is published and licensed by Dove Medical Press Limited. The full terms of this license are available at https://www.dovepress.com/terms.php and incorporate the Creative Commons Attribution - Non Commercial (unported, v3.0) License.
By accessing the work you hereby accept the Terms. Non-commercial uses of the work are permitted without any further permission from Dove Medical Press Limited, provided the work is properly attributed. For permission for commercial use of this work, please see paragraphs 4.2 and 5 of our Terms.
© 2018 The Author(s). This work is published and licensed by Dove Medical Press Limited. The full terms of this license are available at https://www.dovepress.com/terms.php and incorporate the Creative Commons Attribution - Non Commercial (unported, v3.0) License.
By accessing the work you hereby accept the Terms. Non-commercial uses of the work are permitted without any further permission from Dove Medical Press Limited, provided the work is properly attributed. For permission for commercial use of this work, please see paragraphs 4.2 and 5 of our Terms.