")
Back to Journals » Open Access Journal of Sports Medicine » Volume 8
High lateral plantar pressure is related to an increased tibialis anterior/fibularis longus activity ratio in patients with recurrent lateral ankle sprain
Authors Mineta S, Inami T, Mariano R, Hirose N
Received 4 January 2017
Accepted for publication 21 April 2017
Published 1 June 2017 Volume 2017:8 Pages 123—131
DOI https://doi.org/10.2147/OAJSM.S131596
Checked for plagiarism Yes
Review by Single anonymous peer review
Peer reviewer comments 2
Editor who approved publication: Prof. Dr. Andreas Imhoff
Shinshiro Mineta,1 Takayuki Inami,2 Raldy Mariano,3 Norikazu Hirose4
1Graduate School of Sport Sciences, 2Institute of Physical Education, Keio University, Hiyoshi, Yokohama, 3Graduate School of Asia-Pacific Studies, Waseda University, Shinjuku, Tokyo, 4Faculty of Sport Sciences, Waseda University, Higashifushimi, Nishitokyo, Japan
Introduction: Center of pressure (COP) is a sudden displacement at the time of a lateral ankle sprain (LAS). It has been suggested that the distribution of plantar pressure and the quantity of COP displacement are important for assessing the risk of LAS. Therefore, we evaluated the plantar pressure during a single-leg balance test with eyes closed (SLB-C) to identify the factors and characteristics of plantar pressure in people with repeated cases of LAS.
Methods: We recruited 22 collegiate athletes and divided them into an instability group (IG; n=11) and a control group (CG; n=11). We measured the distribution of plantar pressure and lower extremity muscle activity during a SLB-C along with static alignment and isometric ankle strength.
Results: The fibularis longus (FL) activity was significantly lower in the IG than in the CG. The lateral plantar pressure (LPP)/medial plantar pressure (MPP) ratio was also higher in the IG than in the CG. In addition, the LPP/MPP ratio was correlated with the tibialis anterior (TA)/FL ratio.
Conclusion: These results suggest that increased lateral plantar pressure is related to decreased FL activity and increased TA/FL ratio.
Keywords: chronic ankle instability, ankle sprain, postural stability, soccer, prevention
Introduction
Lateral ankle sprain (LAS) is a common injury in a collegiate athletic population, and according to a previous study by Gerber et al,1 it accounts for ~21% of all injuries in the collegiate athletic population. In addition, at 7 years of follow-up, in 648 patients with LAS, >30% of patients still had some sequelae (e.g., pain, swelling, recurrent injury) and >70% of patients felt functionally impaired.2 In addition, since repeated LAS is a risk factor for the early onset of posttraumatic ankle osteoarthritis, which impairs quality of life (QoL) in the future,3 it is necessary to improve performance while screening clearly. From the abovementioned findings, as indicated in the 2016 consensus statement of the International Ankle Consortium,4,5 LAS has a harmful effect on not only current sports activities but also future QoL. Moreover, it has been reported that an increasing lateral plantar pressure (LPP) and a considerable lateral displacement of the center of pressure (COP) are hallmarks of LAS injury.6 Thus, the increasing LPP and the lateral displacement of COP are harmful characteristics that can cause LAS,6 and it is clear that muscle activity has a large influence on plantar pressure distribution.7 However, further research on the relationship between LPP and muscle activity related to hypofunction (especially, the fibularis longus [FL]) is needed.8–10
It has been revealed that the FL contributes to ankle stability.11 In particular, the FL contributes to frontal plane ankle stability during single-leg tasks12 and is correlated with the amount of lateral–medial COP displacement.13 From these studies, it can be considered that FL has an influence on the plantar pressure distribution. However, the influence of other muscles (tibialis anterior [TA] and gastrocnemius [GASTRO]), in terms of muscle activity interaction (e.g., agonist/antagonist activity ratio), on plantar pressure distribution is not clear. Since plantar pressure distribution is influenced by factors such as static alignment,14 ankle strength,15,16 and postural control17,18 we have to measure many factors comprehensively to elucidate the relationship between muscle activity and plantar pressure distribution.
In the context of this background, this study aimed to investigate the relationship between increased LPP, characteristic of LAS, and lower extremity muscle activities, using a single-leg balance task with eyes closed (SLB-C) and assessing the ankle strength and static alignment. We believe that it is important to identify the factors that are related to increasing LPP and beneficial for designing training to prevent increasing LPP.
Methods
Subjects and study design
This study was conducted in a single-blind method as a retrospective cross-sectional study. A total of 68 collegiate athletes were screened for anthropometric data (height, weight, dominant leg, and history of LAS with medical examination) and Cumberland Ankle Instability Tool (CAIT) score using the CAIT questionnaire (Table 1).19 In all, 11 athletes met the following inclusion criteria for the instability group (IG), based on a consensus statement and endorsement from the International Ankle Consortium:20 1) more than four counts of LAS with medical examination; 2) ongoing giving way experiences or feeling fear during sports activity; 3) CAIT score <24; 4) at least one LAS within the past year; and 5) no history of LAS within the past 3 months. We required the IG of more than four counts of LAS with medical examination to ensure that the subjects had repeated LAS. A total of 11 participants were included in the control group (CG) based on the following criteria: 1) no history of LAS in either leg, and 2) no history of lower extremity injuries within 1 year. An LAS was defined as an ankle injury with an inversion mechanism requiring the player to miss at least one game or practice after a medical examination of the LAS by a physician. An ongoing giving way experience was defined as uncontrolled and unpredictable episodes of excessive inversion of the ankle at least two times in the 6 months prior to study enrollment.20 Subjects were excluded if they had a history of fractures or surgery in the lower extremity or trunk. None of the subjects in either group reported a history of neurological or vestibular impairment. The target leg was selected at random in the CG. The dominant leg was determined by asking which leg the subject would use to kick a ball. The selection of subjects and the target leg was conducted by an author (S.M.). On the first day, we measured static alignment and ankle isokinetic strength. On another day, we measured COP displacement, distribution of plantar pressure, and muscle activity during the SLB-C task. The subjects were blinded during the measurement of variables.
 | Table 1 Physical characteristics of participants Notes: **p<0.01. All results are shown by mean ± standard deviation. Abbreviations: IG, instability group; CG, control group. |
SLB-C is the task of maintaining balance standing barefoot on one leg with eyes closed for 15 seconds.21 We instructed subjects to put their hands on their waist and maintain a contralateral hip joint flexion at 90°. A trial was discarded if subjects did not keep their hands on their hips, if the balancing foot shifted, if the contralateral foot touched the ground, or if both legs were pushed together for balance.22 After a practice trial, the SLB-C was repeated until two successful trials were completed. We set a rest period of 1 minute between SLB-C tasks.
We finished all the measurements within 2 weeks (Figure 1). This study was carried out in accordance with the principles outlined in the Declaration of Helsinki of the World Medical Association and was approved by the ethics committee of Medical and Health Research Involving Human Subjects of Waseda University, and all the participants signed an informed consent form.
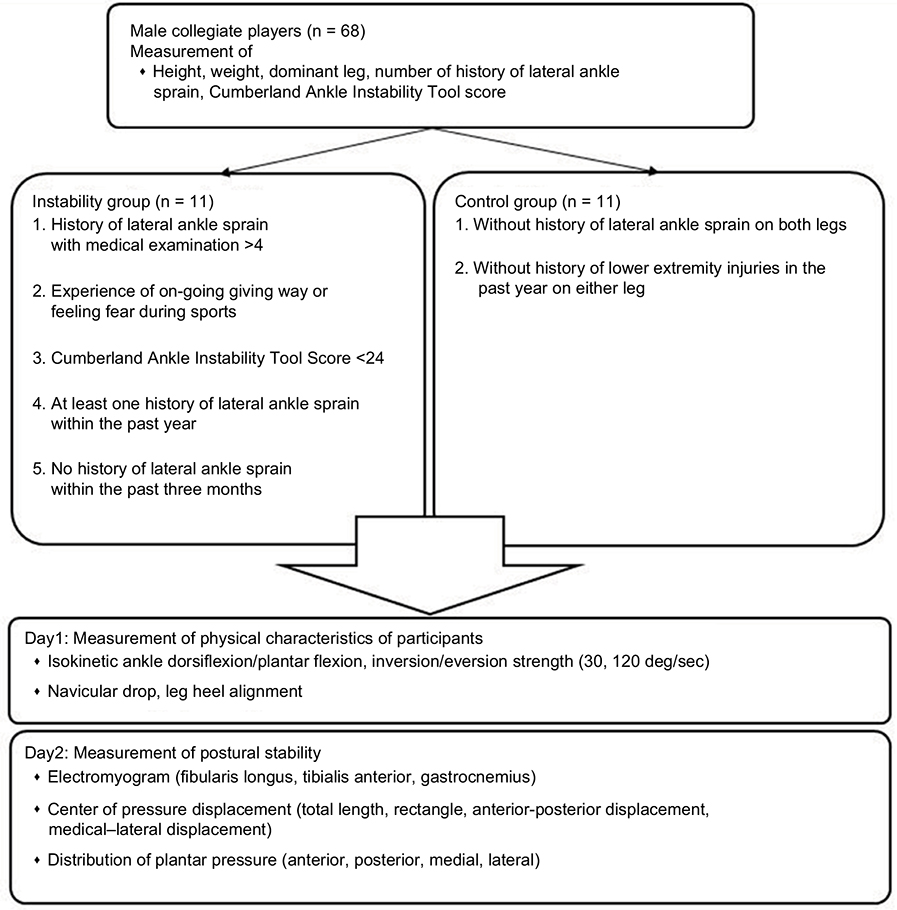 | Figure 1 General procedure. Note: ‘On-going giving way’ is defined as uncontrolled and unpredictable episodes of excessive inversion of the ankle at least two times in the 6 months prior to study enrollment. |
Measurement of isokinetic strength
We measured ankle isokinetic concentric dorsiflexion, plantar flexion, and inversion and eversion strength using a Biodex System III Dynamometer (Biodex Medical Systems; Shirley, NY, USA). These tests were conducted at speeds of 30°/second and 120°/second. The knee was positioned at 0°, and the ankle joint was positioned such that the subtalar joint became dorsi-/plantarflexion 0° during dorsi-/plantarflexion measurement. The trunk and femur were fixed to the seat and the ankle to the footplate with straps. Both arms were crossed in front of the chest during measurement. The rotational axis of the dynamometer was positioned on the lateral malleolus.23 For the inversion test, the knee was flexed 60° and the ankle joint was positioned such that the subtalar joint became dorsi-/plantarflexion 0° during inversion/eversion measurement. The range of motion stop angle was set at full range of motion. Before testing, a warm-up session was performed to allow familiarization with the testing protocol. The warm-up session consisted of a submaximal five trials (~50%)24 before each test. Five maximal repetitions were recorded for each of the test conditions. Consistent verbal encouragement for each maximal effort was given to the subject throughout the test. A 3-minute rest period was provided between efforts, and subjects were instructed that their best effort was required. The average torque value (normalized to body weight) for each condition was used in the data analysis to detect group differences.
Navicular drop
Navicular drop (ND) was calculated using an iron ruler in a seated position. Subjects sat on a chair and placed their foot on a scale (HA552; Tanita, Itabashi Ward, Tokyo, Japan). We regulated the height of the chair so that their thigh was parallel to the ground, and their ankle position was dorsi-/plantarflexion 0° to load for 10% of weight. We measured the distance between the navicular tuberosity and the ground in the sitting and standing positions and defined the difference as the ND. The measurement was performed two times, and the average value was used in the data analysis.
Leg heel alignment
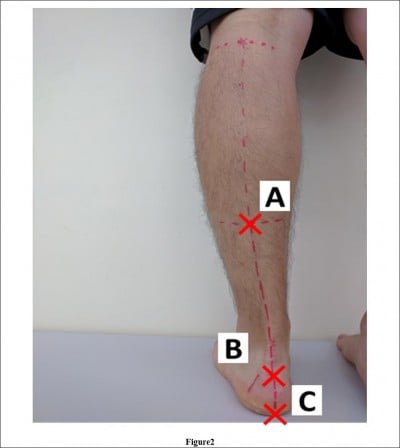
We marked three points on the subject’s leg and defined the angle created by segments A–B and B–C as leg heel alignment (LHA; Figure 2).25 We marked point A in the lower one-third, central part of the leg, point B on the calcaneal tuberosity, and point C on the heel so that the segment B–C divided the heel in half. We took a picture of the lower limb from behind the subject using a digital camera (EXILIM EX-FX1; Casio, Shibuya Ward, Tokyo, Japan). LHA was determined from the picture using the 2D image analysis software (Dartfish; gsport, Bunkyo Ward, Tokyo, Japan).
 | Figure 2 The definition of leg heel alignment Notes: Point A is on a lower one-third central part of the tibia. Point B is on a calcaneal tuberosity. Point C is on a heel so that line B–C divided a heel in a half. |
Distribution of plantar pressure and COP displacement
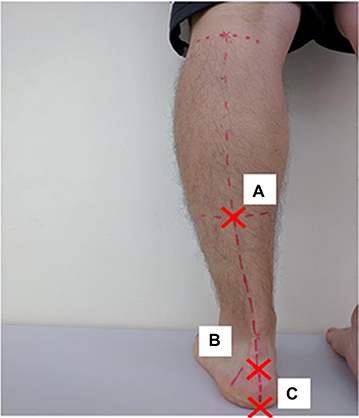
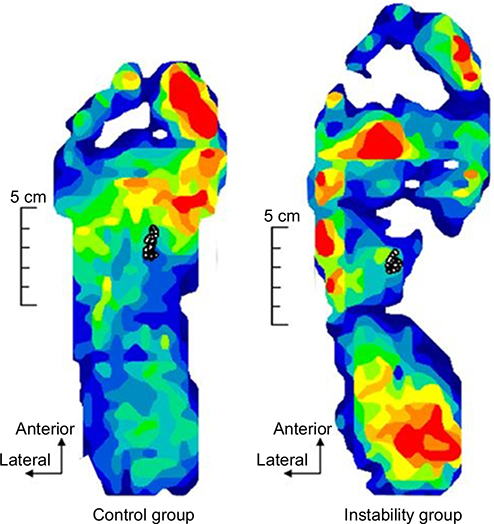
We measured anterior plantar pressure (APP), posterior plantar pressure (PPP), medial plantar pressure (MPP), LPP, total length of COP anterior–posterior (A–P) displacement, total length of COP medial–lateral (M–L) displacement, total length of COP (LNG), and rectangle area (RA) during the balance task. We calculated the PPP/APP ratio and LPP/MPP ratio from the data. Plantar pressure distribution and COP displacement data were measured at 100 Hz using the plantar pressure sensor (F-scan II; Nitta, Osaka, Japan). Plantar pressure distribution was recorded per unit area (kg/cm2). We recorded plantar pressure distribution during a balance task for 15 seconds, and the results were normalized to body weight.21 We defined line A as the connection between the second distal phalanx and the calcaneus and line B as the line crossing line A at a right angle. We determined the portion one-third anterior to line B as the APP area and the portion one-third posterior to line B as the PPP area. In addition, we determined the portion one-third inside of line A as the MPP area and one-third outside of line A as the LPP area (Figure 3). Since this definition of plantar pressure area was used in the original method, we calculated an intraclass correlation coefficient (ICC) value before data collection (n = 8). All areas had a high reliability (ICC [1, 2]: APP = 0.985, PPP =0.878, LPP =0.997, MPP =0.992, LPP/MPP ratio =0.973, PPP/APP ratio =0.778; Table 2). Thus, the average value of plantar pressure and COP displacement in two SLB-C tasks was used for analysis.
 | Figure 3 Distribution of plantar pressure. Notes: Line A connects the second distal phalanx and calcaneus. Line B crosses line A at a right angle. |
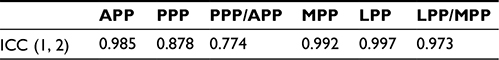 | Table 2 Intra-class correlation coefficient value of plantar pressure Abbreviations: APP, anterior plantar pressure; PPP, posterior plantar pressure; MPP, medial plantar pressure; LPP, lateral plantar pressure; ICC, intraclass correlation coefficient. |
Electromyography
We measured the FL, TA, and GASTRO lateral muscle activity by means of surface electromyography (TeleMyo 2400T; Noraxon, Scottsdale, AZ, USA) at 1500 Hz during SLB-C. The preparation consisted of shaving the skin over the area of electrode placement, followed by cleaning the skin with alcohol swabs. Disposable Ag/AgCl circular electrodes were placed over each muscle. Electrode placement was consistent with a previous study.26 Before recording the SLB-C trial, 5-second maximum voluntary isometric contractions (MVICs) against manual resistance were recorded to normalize the electromyography (EMG) amplitude during the SLB-C trials. We calculated root mean square (RMS) value from an interval of the middle 3 seconds and assumed the value as 100% RMS. We normalized the EMG signals during SLB-C to 100% RMS and the average value of RMS during 15 seconds of SLB-C. All muscle activities during SLB-C and MVICs, after full-wave rectification, were filtered by a band-pass filter with a cutoff frequency of 5–500 Hz using the TRAIS System (DKH, Itabashi Ward, Tokyo, Japan).
Statistical analysis
First, we performed the Kolmogorov–Smirnov test as the test of normality. We performed independent t-tests for the variables that had a normal distribution. We performed the Mann–Whitney U test for the variables that were not normally distributed. In addition, Spearman’s rank-order correlation analysis was used to evaluate the relationships among static alignment (LHA and ND), EMG, isokinetic strength, and all of the plantar pressure measures. The level of significance was set a priori at p < 0.05 using the statistical software program (Excel analysis; SSRI, Shinjuku Ward, Tokyo, Japan) for all analyses. We calculated the effect size, using Cohen’s d coefficient, and 95% confidence intervals (CIs) around Cohen’s d (Figure 4).27
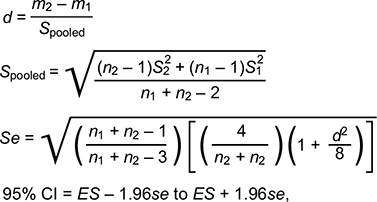 | Figure 4 Calculation of Cohen’s d and 95% CIs around Cohen’s d. Notes: “m1” and “m2” are the average of two groups. “n1” and “n2” are the sample size of two groups. “S12” and “S22” are the variance of two groups. Abbreviations: CI, confidence interval; ES, effect size (Cohen’s d). |
Results
Kolmogorov–Smirnov testing revealed a non-normal distribution for FL activity, dosiflexion/plantarflexion strength ratio (30°/second), inversion strength (30/second), and eversion strength (30°/second).
Distribution of plantar pressure, muscle activity, and COP displacement
MPP during SLB-C was lower in the IG compared to the CG (p<0.05, Cohen’s d = −1.12 [95% CI, −1.10 to 3.38], 1 − b =0.70), and LPP/MPP ratio was higher in the IG compared to the CG (p<0.05, Cohen’s d =1.00 [95% CI, −1.19 to 3.29], 1 − b =0.61; Table 3). FL activity was significantly lower in the IG than in the CG (p<0.05, Cohen’s d =0.99 [95% CI, −1.20 to 3.27], 1 − b =0.58), and TA/FL ratio was significantly higher in the IG than in the CG (p<0.05, Cohen’s d =1.44 [95% CI, −0.77 to 3.75], 1 − b =0.89; Table 3 and 5). In addition, FL activity was correlated with LPP and LPP/MPP ratio. The TA/FL ratio was correlated with MPP and the LPP/MPP ratio (Table 4). No significant difference was found in APP, PPP, LPP, or PPP/APP; COP A–P displacement; COP M–L displacement; LNG; or RA (Tables 3 and 5 and Figure 6).
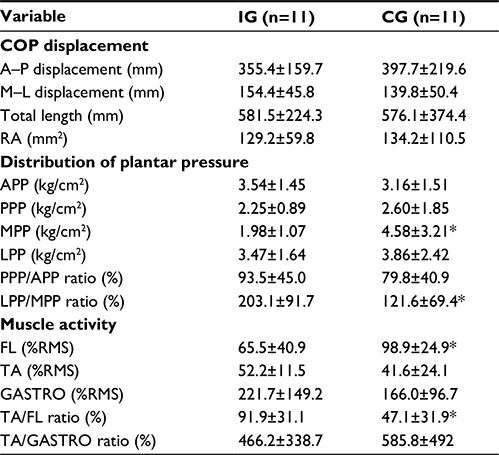 | Table 3 Variables measured during the balance task Notes: *p<0.05. All results are shown by mean ± standard deviation. Abbreviations: IG, instability group; CG, control group, COP, center of pressure; A–P, anterior–posterior; M–L, medial–lateral; RA, rectangle area; APP, anterior plantar pressure; PPP, posterior plantar pressure; MPP, medial plantar pressure; LPP, lateral plantar pressure; FL, fibularis longus; RMS, root mean square; TA, tibialis anterior; GASTRO, gastrocnemius. |
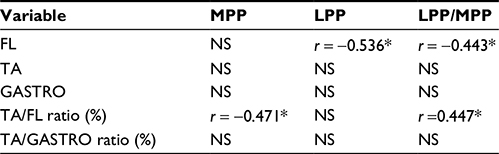 | Table 4 Correlation coefficient value between muscle activities and plantar pressure Note: *p<0.05. Abbreviations: MPP, medial plantar pressure; LPP, lateral plantar pressure; FL, fibularis longus; NS, not significant; TA, tibialis anterior; GASTRO, gastrocnemius. |
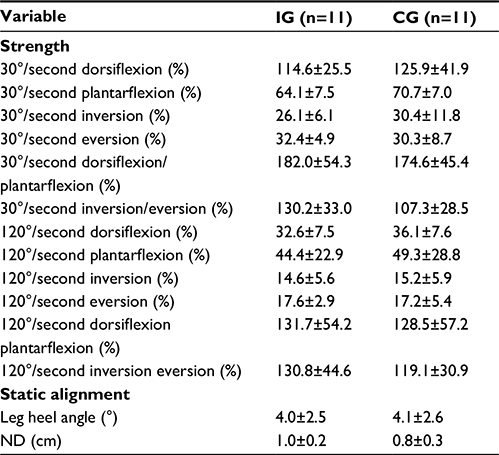 | Table 5 Characteristics of strength and foot posture Notes: All results are shown by mean ± standard deviation. Abbreviations: IG, instability group; CG, control group; ND, navicular drop. |
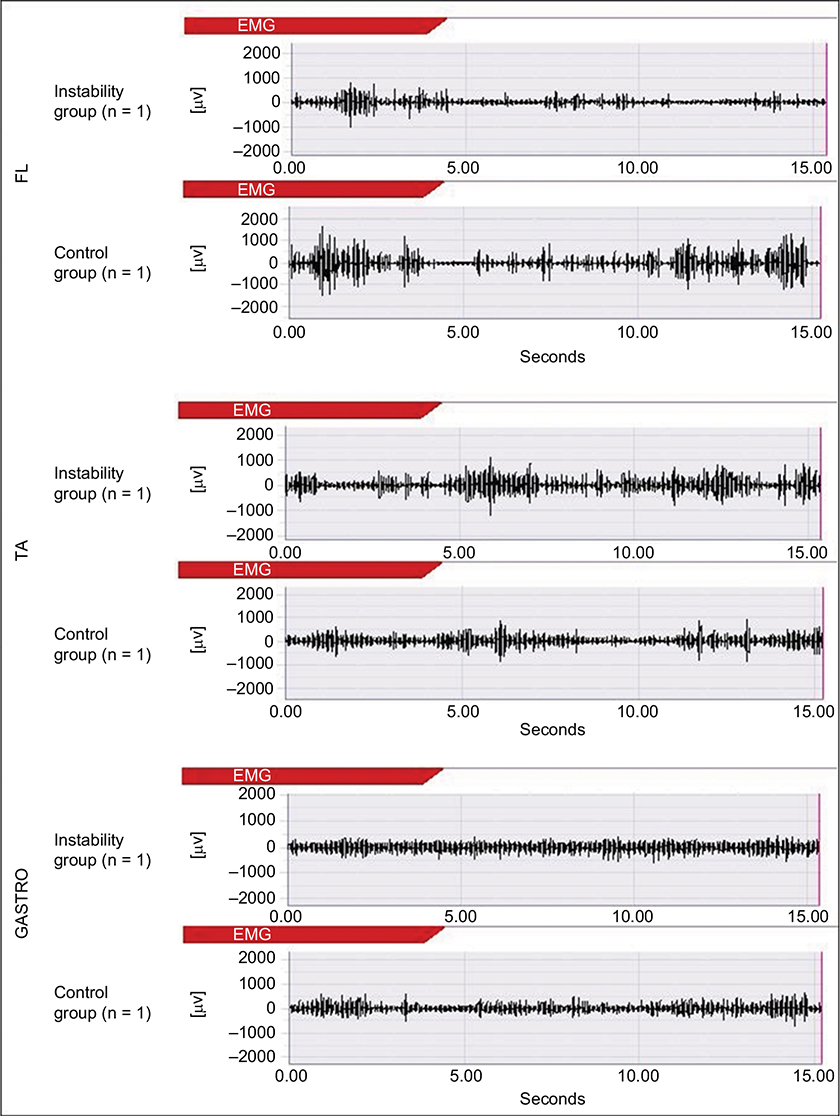 | Figure 5 An example of the raw wave of muscle activities (n = 1). Abbreviations: GASTRO, gastrocnemius; TA, tibialis anterior; FL, fibularis longus; EMG, electromyography. |
 | Figure 6 An example of the raw data of the COP displacement (n = 1). Abbreviation: COP, center of pressure. |
Measurement of ankle isokinetic strength and static alignment
There were no significant differences in concentric isokinetic ankle strength, LHA, and ND between IG and CG (Table 5).
Discussion
In this study, we investigated the characteristics of the distribution of plantar pressure and muscle activity and the relationships between these measures. Our results showed that in the IG, there was more loading toward the outside of the foot during SLB-C than in the CG and the FL was lower and TA/FL ratio was higher. In addition, the MPP was correlated with the TA/FL ratio. The LPP was correlated with FL activity. The LPP/MPP ratio was correlated with the FL activity and the TA/FL ratio. Our study showed that the LPP/MPP ratio was increased with decreasing MPP in chronic ankle instability (CAI) patients, and this was related to diminished FL activity and increasing TA/FL ratio. To the best of our knowledge, this result is shown first by our study. The increasing LPP/MPP ratio with decreasing MPP indicates increasing loading in the lateral direction, which is considered as a harmful position that could lead to re-sprain.6
A previous study has shown that FL activity contributes to frontal plane ankle stability,13 and our study suggests that FL activity prevents loading toward the outside of the foot. In addition, a previous study showed that FL activity prevents the ankle from inverting excessively12 and increases with added perturbation, which increases LPP.28 From these previous studies, it can be considered that FL has the function of preventing increasing LPP by exhibiting eversion torque, and in the IG in our study, this preventive function may have been diminished. In addition, there were no significant differences in static alignment,14 ankle strength,15,16 and postural control,17,18 which have an influence on plantar pressure distribution. So it was suggested that the increasing LPP/MPP is related to decreasing FL function, which prevents LPP from increasing, and the relative enhancement of the inversion function of TA.
Decreasing FL activity was consistent with the findings of a previous study.29 Rodriguez-Fernandez et al30 suggested decreased excitability of the common peroneal nerve in people with a history of LAS. In addition, Kim et al31 showed a decrease in the Hoffmann’s reflex (H-reflex) in an injured group compared to a CG. It was suggested that there are some changes not only in peripheral function but also in the central nervous system. Futatsubashi et al32 showed increasing gains of the suppressive cutaneous reflex (CR) and implied that impairment of the CR pathway, including the spinal and supraspinal pathways, occurs in CAI patients.32,33 In addition, the CR is important for motor control of the closed kinetic chain (CKC) and is affected by the cutaneous mechanoreceptor.34 It has been shown that the sensitivity of the calcaneal cutaneous mechanoreceptor is diminished in CAI patients.35 Furthermore, Pietrosimone and Gribble 36 showed a relationship between FL motor threshold of corticomotor pathway as assessed using transcranial magnetic stimulation (TMS) and subjective feelings of instability. From these studies, it is clear that the reflex pathway, including the spinal and supraspinal levels, is impaired in CAI patients. Thus, it is possible that this diminished FL activity is related to the impaired reflex pathway and sensorimotor deficits. On the other hand, Tokuno et al37 showed that the COP displacement has an effect on the H-reflex and stretch reflex excitability. Additionally, the amplitude of the H-reflex following conditioning cutaneous stimulation depends on the stimulation area of the plantar cutaneous.38 From these previous studies, it can be concluded that it is possible that the altered FL activity was influenced by the plantar pressure distribution itself. Delahunt et al39 have suggested that the increasing activity of the FL occurs by feed-forward motor control to increase ankle stability after landing. Thus, it is possible that the feed-forward mechanism of our subjects was altered in our study. Consequently, it is considered that the decreasing FL activity might be related to these altered spinal-level or supraspinal-level motor control mechanisms.
Our results showed that MPP is correlated with the TA/FL ratio and not only FL activity, and this result suggests that interaction of the FL and TA is important to control MPP. Pozzi et al40 have suggested that the increasing TA activity is important to increase ankle inversion torque (i.e., increasing LPP) during the SLB-C task. In addition, Feger and Hertel41 showed that increasing FL activity leads to loading more toward the inside of the foot. In other words, it implies that the FL eversion function and TA inversion function lead to increasing MPP and LPP, respectively. This result indicates that increasing FL function relative to the TA may induce MPP dominance. In a previous study, since TA activity leads the ankle to a close-packed dorsiflexed position, it was found that increasing TA activity before landing is important for ankle stability after landing.39 However, our study results suggest that to increase TA activity in the state of remaining decreased FL activity may cause increasing plantar pressure in the lateral direction.
In general, strength and postural stability are important for an LAS rehabilitation program. Our research suggests increasing LPP/MPP if FL activity is not fully activated, even if ankle strength and postural stability have been fully recovered. Therefore, according to our research, we need to introduce not only the typical concentric ankle training and balance training used for LAS rehabilitation but also FL activation training, which can prevent the increasing LPP that occurs during some movements.
Limitations
Henry et al28 showed that thigh- and trunk-muscle activities are important for postural control. Thus, one limitation of this study was a lack of information about thigh- and trunk-muscle activities. However, it has been reported that most of the postural control during SLB-C is achieved by the ankle joint;42 therefore, this limitation likely had little influence on the results. Second, in this study, the selection of subjects and target leg was conducted by a single athletic trainer, which could imply a conflict with the double-blind study design. However, since it was analyzed by the consolidated possible anonymous, the author was not able to know the subjects’ attributes (IG or CG) during analysis. Therefore, the bias of measurement and analysis is considered to be small. In addition, in regard to the plantar pressure distribution area definition that can be biased, we defined the plantar pressure area using an objective landmark (Figure 3), and the ICC of plantar pressure analysis was high (Table 2). So we think the influence of bias on the results was small. Last, since only 11 athletes met the IG inclusion criteria, we did not perform prior power analysis. Also, the 95% CIs of the effect size crossed zero. However, when we performed a post hoc analysis, all results met medium power (LPP/MPP ratio: 1 − b =0.61, MPP: 1 − b =0.70, FL activity: 1 − b =0.58, TA/FL ratio: 1 − b =0.89). In addition, regarding the 95% CIs of the effect size crossing zero, we thought that it was caused by large individual differences in plantar pressure distribution and the values of muscle activity. However, since the values of plantar pressure distribution and muscle activity were almost the same in previous studies14,21,43 and the ICCs of the measuring methods were high (Table 2), our results are reliable. Thus, these results likely show accurately the characteristics of plantar pressure distribution of the patients of recurrent sprain and its factors.
Disclosure
The authors report no conflicts of interest in this work.
References
Gerber JP, Williams GN, Scoville CR, Arciero RA, Taylor DC. Persistent disability associated with ankle sprains: a prospective examination of an athletic population. Foot Ankle Int. 1998;19(10):653–660. | ||
Konradsen L, Bech L, Ehrenbjerg M, Nickelsen T. Seven years follow-up after ankle inversion trauma. Scand J Med Sci Sports. 2002;12(3):129–135. | ||
Brown TD, Johnston RC, Saltzman CL, Marsh JL, Buckwalter JA. Posttraumatic osteoarthritis: a first estimate of incidence, prevalence, and burden of disease. J Orthop Trauma. 2006;20(10):739–744. | ||
Gribble PA, Bleakley CM, Caulfield BM, et al. 2016 consensus statement of the International Ankle Consortium: prevalence, impact and long-term consequences of lateral ankle sprains. Br J Sports Med. 2016;50(24):1493–1495. | ||
Gribble PA, Bleakley CM, Caulfield BM, et al. Evidence review for the 2016 International Ankle Consortium consensus statement on the prevalence, impact and long-term consequences of lateral ankle sprains. Br J Sports Med. 2016;50(24):1496–1505. | ||
Kristianslund E, Bahr R, Krosshaug T. Kinematics and kinetics of an accidental lateral ankle sprain. J Biomech. 2011;44(14):2576–2578. | ||
Koldenhoven RM, Feger MA, Fraser JJ, Saliba S, Hertel J. Surface electromyography and plantar pressure during walking in young adults with chronic ankle instability. Knee Surg Sports Traumatol Arthrosc. 2016;24(4):1060–1070. | ||
Rosen A, Swanik C, Thomas S, Glutting J, Knight C, Kaminski TW. Differences in lateral drop jumps from an unknown height among individuals with functional ankle instability. J Athl Train. 2013;48(6):773–781. | ||
Kavanagh JJ, Bisset LM, Tsao H. Deficits in reaction time due to increased motor time of peroneus longus in people with chronic ankle instability. J Biomech. 2012;45(3):605–608. | ||
Sedory EJ, McVey ED, Cross KM, Ingersoll CD, Hertel J. Arthrogenic muscle response of the quadriceps and hamstrings with chronic ankle instability. J Athl Train. 2007;42(3):355–360. | ||
Louwerens JW, van Linge B, de Klerk LW, Mulder PG, Snijders CJ. Peroneus longus and tibialis anterior muscle activity in the stance phase. A quantified electromyographic study of 10 controls and 25 patients with chronic ankle instability. Acta Orthop Scand. 1995;66(6):517–523. | ||
Ty Hopkins J, McLoda T, McCaw S. Muscle activation following sudden ankle inversion during standing and walking. Eur J Appl Physiol. 2007;99(4):371–378. | ||
Mitchell A, Dyson R, Hale T, Abraham C. Biomechanics of ankle instability. Part 2: postural sway-reaction time relationship. Med Sci Sports Exerc. 2008;40(8):1522–1528. | ||
Jonely H, Brismee JM, Sizer PS Jr, James CR. Relationships between clinical measures of static foot posture and plantar pressure during static standing and walking. Clin Biomech (Bristol, Avon). 2011; 26(8):873–879. | ||
Fourchet F, Kuitunen S, Girard O, Beard AJ, Millet GP. Effects of combined foot/ankle electromyostimulation and resistance training on the in-shoe plantar pressure patterns during sprint in young athletes. J Sports Sci Med. 2011;10(2):292–300. | ||
Mehlhorn AT, Walther M, Yilmaz T, et al. Dynamic plantar pressure distribution, strength capacity and postural control after Lisfranc fracture-dislocation. Gait Posture. 2017;52:332–337. | ||
Johansson R, Magnusson M. Human postural dynamics. Crit Rev Biomed Eng. 1991;18(6):413–437. | ||
Song K, Burcal C, Hertel J, Wikstrom EA. Increased visual utilization in chronic ankle instability: a meta-analysis. Med Sci Sports Exerc. Epub 2016 May 17. | ||
Kunugi S, Masunari A, Noh B, Mori T, Yoshida N, Miyakawa S. Cross-cultural adaptation, reliability, and validity of the Japanese version of the Cumberland ankle instability tool. Disabil Rehabil. 2017;39(1):50–58. | ||
Gribble PA, Delahunt E, Bleakley C, et al. Selection criteria for patients with chronic ankle instability in controlled research: a position statement of the International Ankle Consortium. Br J Sports Med. 2014;48(13):1014–1018. | ||
Feger MA, Donovan L, Hart JM, Hertel J. Lower extremity muscle activation during functional exercises in patients with and without chronic ankle instability. PM R. 2014;6(7):602–611. quiz 611. | ||
De Ridder R, Willems T, Vanrenterghem J, Roosen P. Influence of balance surface on ankle stabilizing muscle activity in subjects with chronic ankle instability. J Rehabil Med. 2015;47(7):632–638. | ||
Keles SB, Sekir U, Gur H, Akova B. Eccentric/concentric training of ankle evertor and dorsiflexors in recreational athletes: muscle latency and strength. Scand J Med Sci Sports. 2014;24(1):e29–e38. | ||
Kaminski TW, Perrin DH, Gansneder BM. Eversion strength analysis of uninjured and functionally unstable ankles. J Athl Train. 1999;34(3):239–245. | ||
Kondou A, Inoue Y, Okamoto K. The method guidelines for range of motion measurement. J Rehabil Med. 1995;32(4):207–217. | ||
Delagi EF, Perotto AO, Daniel M. Anatomical Guide for the Electromyographer: the Limbs and Trunk. 5 ed. Springfield, IL: Charles C Thomas Pub Ltd; 2014:140,146,154. | ||
Nakagawa S, Cuthill I. Effect size, confidence interval and statistical significance: a practical guide for biologists. Biol Rev Camb Philos Soc. 2007;82(4):591–605. | ||
Henry SM, Fung J, Horak FB. EMG responses to maintain stance during multidirectional surface translations. J Neurophysiol. 1998; 80(4):1939–1950. | ||
Delahunt E, Monaghan K, Caulfield B. Changes in lower limb kinematics, kinetics, and muscle activity in subjects with functional instability of the ankle joint during a single leg drop jump. J Orthop Res. 2006;24(10):1991–2000. | ||
Rodriguez-Fernandez AL, Rebollo-Roldan J, Jimenez-Rejano JJ, Gueita-Rodriguez J. Strength-duration curves of the common fibular nerve show hypoexcitability in people with functional ankle instability. PMR. 2016;8(6):536–544. | ||
Kim KM, Hart JM, Saliba SA, Hertel J. Modulation of the fibularis longus Hoffmann reflex and postural instability associated with chronic ankle instability. J Athl Train. 2016;51(8):637–643. | ||
Futatsubashi G, Sasada S, Tazoe T, Komiyama T. Gain modulation of the middle latency cutaneous reflex in patients with chronic joint instability after ankle sprain. Clin Neurophysiol. 2013;124(7):1406–1413. | ||
Duysens J, Hoogkamer W, Levin O. Is there “arthrogenic inhibition” of cutaneous reflexes in subjects with functional ankle instability? Clin Neurophysiol. 2013;124(7):1264–1266. | ||
Drew T, Rossignol S. A kinematic and electromyographic study of cutaneous reflexes evoked from the forelimb of unrestrained walking cats. J Neurophysiol. 1987;57(4):1160–1184. | ||
Burcal CJ, Wikstrom EA. Plantar cutaneous sensitivity with and without cognitive loading in people with chronic ankle instability, copers, and uninjured controls. J Orthop Sports Phys Ther. 2016;46(4):270–276. | ||
Pietrosimone BG, Gribble PA. Chronic ankle instability and corticomotor excitability of the fibularis longus muscle. J Athl Train. 2012;47(6):621–626. | ||
Tokuno CD, Carpenter MG, Thorstensson A, Garland SJ, Cresswell AG. Control of the triceps surae during the postural sway of quiet standing. Acta Physiol (Oxf). 2007;191(3):229–236. | ||
Sayenko DG, Vette AH, Obata H, Alekhina MI, Akai M, Nakazawa K. Differential effects of plantar cutaneous afferent excitation on soleus stretch and H-reflex. Muscle Nerve. 2009;39(6):761–769. | ||
Delahunt E, Monaghan K, Caulfield B. Altered neuromuscular control and ankle joint kinematics during walking in subjects with functional instability of the ankle joint. Am J Sports Med. 2006;34(12):1970–1976. | ||
Pozzi F, Moffat M, Gutierrez G. Neuromuscular control during performance of a dynamic balance task in subjects with and without ankle instability. Int J Sports Phys Ther. 2015;10(4):520–529. | ||
Feger MA, Hertel J. Surface electromyography and plantar pressure changes with novel gait training device in participants with chronic ankle instability. Clin Biomech (Bristol, Avon). 2016;37:117–124. | ||
Woollacott M, Shumway-Cook A. Attention and the control of posture and gait: a review of an emerging area of research. Gait Posture. 2002;16(1):1–14. | ||
Deschamps K, Birch I, Mc Innes J, Desloovere K, Matricali GA. Inter- and intra-observer reliability of masking in plantar pressure measurement analysis. Gait Posture. 2009;30(3):379–382. |
 © 2017 The Author(s). This work is published and licensed by Dove Medical Press Limited. The full terms of this license are available at https://www.dovepress.com/terms.php and incorporate the Creative Commons Attribution - Non Commercial (unported, v3.0) License.
By accessing the work you hereby accept the Terms. Non-commercial uses of the work are permitted without any further permission from Dove Medical Press Limited, provided the work is properly attributed. For permission for commercial use of this work, please see paragraphs 4.2 and 5 of our Terms.
© 2017 The Author(s). This work is published and licensed by Dove Medical Press Limited. The full terms of this license are available at https://www.dovepress.com/terms.php and incorporate the Creative Commons Attribution - Non Commercial (unported, v3.0) License.
By accessing the work you hereby accept the Terms. Non-commercial uses of the work are permitted without any further permission from Dove Medical Press Limited, provided the work is properly attributed. For permission for commercial use of this work, please see paragraphs 4.2 and 5 of our Terms.