")
Back to Journals » Diabetes, Metabolic Syndrome and Obesity » Volume 13
High-Intensity Interval Training Attenuates Ketogenic Diet-Induced Liver Fibrosis in Type 2 Diabetic Mice by Ameliorating TGF-β1/Smad Signaling
Authors Zhang Q, Shen F, Shen WQ, Xia J, Wang J, Zhao Y, Zhang Z, Sun Y, Qian M, Ding SZ
Received 10 August 2020
Accepted for publication 14 October 2020
Published 6 November 2020 Volume 2020:13 Pages 4209—4219
DOI https://doi.org/10.2147/DMSO.S275660
Checked for plagiarism Yes
Review by Single anonymous peer review
Peer reviewer comments 3
Editor who approved publication: Prof. Dr. Juei-Tang Cheng
Qiang Zhang,1,2,* Fei Shen,1,2,* WenQing Shen,1,2 Jie Xia,1,2 Jing Wang,1,2 Yu Zhao,1,3 Zhe Zhang,1,2 Yi Sun,1,2 Min Qian,4 ShuZhe Ding1,2
1Key Laboratory of Adolescent Health Assessment and Exercise Intervention of Ministry of Education, East China Normal University, Shanghai 200241, People’s Republic of China; 2School of Physical Education & Health, East China Normal University, Shanghai 200241, People’s Republic of China; 3Center for Physical Education, Xi’an Jiaotong University, Xi’an, Shaanxi 710049, People’s Republic of China; 4Shanghai Key Laboratory of Regulatory Biology, Institute of Biomedical Sciences and School of Life Sciences, East China Normal University, Shanghai 200241, People’s Republic of China
*These authors contributed equally to this work
Correspondence: ShuZhe Ding Tel +86 13601798505
Email [email protected]
Objective: Ketogenic diet (KD) and high-intensity interval training (HIIT) have preclinical benefits for type 2 diabetes (Db). However, the health risks of long-term KD use in diabetes should be ascertained and prevented. We hypothesized that KD-induced liver fibrosis in type 2 diabetic mice could be ameliorated by HIIT.
Methods: Streptozotocin-induced type 2 diabetic mice were divided into high-fat diet (HFD) control (Db+HFD+Sed), KD control (Db+KD+Sed), HFD coupled with HIIT (Db+HFD+HIIT), and KD coupled with HIIT (Db+KD+HIIT) groups (n=6, per group). Control mice were kept in sedentary (Sed), while HIIT group mice underwent 40-minute high-intensity interval training three alternate days per week. After 8-week intervention, the indicators of body weight and insulin resistance, oxidative stress markers, hepatic fibrosis, genetic and protein expression of related pathways were tested.
Results: We found that fasting blood glucose level was reduced in the Db+HFD+HIIT, Db+KD+Sed, and Db+KD+HIIT groups. Insulin sensitivity was increased in diabetic mice of these groups, whereas ROS levels were decreased in mice that underwent HIIT. The immunohistochemical staining of liver, serum index, and hepatic parameters of diabetic mice in the KD group revealed liver fibrosis, which was significantly attenuated by HIIT. Besides, these effects of HIIT were the outcome of hepatic stellate cell’s inactivation, reduced protein expression of matrix metalloproteinases and tissue inhibitor of metalloproteinases, and the inhibition of TGF-β 1/Smad signaling.
Conclusion: KD had a profound fibrotic effect on the liver of type 2 diabetic mice, whereas HIIT ameliorated this effect. KD did not show any apparent benefit as far as glucose tolerance and homeostasis were concerned. Concisely, our results demonstrated that KD should be coupled with HIIT for the prevention and preclinical mitigation of type 2 diabetes.
Keywords: diabetes, ketogenic diet, high-intensity interval training, hepatic fibrosis, ROS, TGF-β 1/Smad signal
Introduction
Type 2 diabetes mellitus is closely associated with obesity. According to the 9th edition (2019) of the International Diabetes Federation (IDF) Diabetes Atlas, around 463 million adults (20–79 years) were afflicted with type 2 diabetes (Db) worldwide.1 It was characterized by impaired insulin function or insulin production by the pancreatic beta cells.2 The elevated inflammation and reactive oxygen species (ROS) in type 2 Db also affected multiple organs, such as heart, blood vessels, eyes, kidneys, feet, and nerves, culminating in disability or premature death.3–5 Although clinical interventions could treat type 2 diabetes, it could be prevented in the first place through weight management and the adoption of a healthy lifestyle.6,7
In the past decades, the ketogenic diet (KD) as a new dietary intervention has gained a lot of attention for treating obesity and type 2 diabetes, as it restricts calorie and liquid intake along with significant therapeutic effects. The underlying mechanism for these effects included augmented mitochondrial efficiency and regulated the activation of AMPK, leptin and adiponectin levels, lipogenesis, ketogenesis, lipolysis, and gluconeogenesis.8–10 KD effectively reversed the fasting hyperglycemia, reduced the hepatic glucose production, and increased the hepatic insulin sensitivity within a few days without affecting body weight significantly.11–13 However, KD-fed mice showed increased serum triacylglycerol and cholesterol levels along with a higher hepatic lipid accumulation, which possibly increased the ROS levels.14,15 Moreover, some studies stated that KD induced nephrolithiasis, muscle cramps, bone fractures, and hepatic injury in mice.16,17 Thus, the health risk imposed by the long-term use of KD for glycemic control in type 2 diabetic mice demands further investigation.
High-intensity interval training (HIIT) has become a widespread practice to burn fat. The essential framework of HIIT is identical. It included all-out work periods, followed by short rest periods.18 It was considered to be a highly effective method for the treatment and prevention of type 2 diabetes.19,20 As per the previous reports, HIIT mitigated hepatic injury in animals and humans.21,22 The activation of hepatic stellate cells (HSCs) played a decisive role in liver fibrosis.23 Increasing evidence demonstrated that transforming growth factor-beta 1 (TGF-β1) was crucial for HSC activation.24 Moreover, previous studies have shown a close relationship between TGF-β1 and ROS in the pathological process of nonalcoholic steatohepatitis (NASH).25,26 Thus, we hypothesized that KD might induce TGF-β1-mediated HSC activation whereas HIIT might ameliorate this process through inhibition of ROS accumulation. We speculated that KD, coupled with HIIT (KD-HIIT), could be an effective approach to preclinical mitigation of type 2 diabetes.
In this study, streptozotocin (STZ)- and high-fat diet (HFD)-induced diabetic mice were fed with either HFD or KD and treated with or without HIIT. We found that glucose metabolism was significantly improved in diabetic mice fed with KD, but it was accompanied with hepatic fibrosis. However, hepatic fibrosis was attenuated by 8-weeks of HIIT. Besides, long-term KD-induced hepatic fibrosis was accompanied by escalated levels of oxidative stress and TGF-β1. HIIT mitigated this process and inhibited hepatic Smad3 phosphorylation (ser 423/425) in type 2 diabetic mice. Taken together, our study suggested that 8-weeks of KD-HIIT considerably prevented type 2 diabetes mellitus in STZ-HFD-induced diabetic mice.
Materials and Methods
Animals
Forty 5-week-old male C57BL/6J mice were provided by the Shanghai Laboratory Animal Company (SLAC, Shanghai, China). All male C57BL/6 mice received human care as per the standards set by the National Academy of Sciences and the Laboratory Animal Care and Use Guide (NIH Publication, 8th Edition, 2011). Mice were housed in the hygienic animal facility at 22±2°C temperature, 40–70% relative humidity with 12/12 light-dark cycle. Mice were fed with HFD or KD containing 45% or 91.74% kcal derived from fat, respectively (SLAC, Shanghai, China). The body weight and fasting blood glucose of mice were evaluated before and after the experiment. All animal experiments were operated as per the procedures approved by the Animal Experiment Committee of East China Normal University (M20170203).
Animal Models of Type 2 Diabetes and Experimental Design
To induce type 2 diabetes, mice were injected with Streptozocin intraperitoneally (STZ, Sigma-Aldrich, 100 mg/kg b.w., diluted by fresh sodium citrate buffer, pH=4.5), only once. Mouse tail-vein blood was collected to test the fasting blood glucose levels, once a week, by using a glucose monitor (Roche, Germany). After STZ administration, mice were fed with HFD. Thirty-four mice with fasting blood glucose levels above 11.1 mmol/L for consecutive three weeks were characterized as type 2 diabetic mice. Considering the operability and accuracy of the experiment, the model mice were screened according to the uniformity of body weights. Twenty-four mice were randomly divided into four groups: high-fat diet control group (Db+HFD+Sed), ketogenic diet control group (Db+KD+Sed), high-fat diet with high-intensity interval training group (Db+HFD+HIIT) and ketogenic diet with high-intensity interval training group (Db+KD+HIIT), containing 6 mice in each group. The detailed experimental design is provided in Supplementary Figure 1.
High-Intensity Interval Exercise Intervention
Mice in the Db+HFD+HIIT and Db+KD+HIIT groups received HIIT through treadmill running exercise for three days per week for 8-weeks, while animals in control groups kept in sedentary (Sed) in their cages throughout the experiment. The treadmill running (inclination 25°) exercise was conducted as described previously but with slight modifications.27 Mice were acclimatized to exercise-environment by making them run on the treadmill for 10 min at the speed of 8 m/min for 5 days. HIIT included ten sets of 2 min high-intensity running, which equated to 85–90% of the maximum oxygen uptake, with 2 min active rest time (8 m/min) in each interval for a total 40 min. The intermittent speed was gradually increased from 15 m/min to 22 m/min, 1 m/min per week, during the 8-week treadmill running exercise period.28,29 During this training, the room temperature was set to 22±2°C.
Glucose and Insulin Tolerance Test
After overnight (about 16 hours) fasting, mice (n=6 each group) were intraperitoneally injected with D-glucose solution diluted in 0.9% saline (1 g/kg b.w. i.p, Sigma-Aldrich, USA). Glucose tolerance test (IPGTT) was conducted by using a glucose meter (Accu-Chek Aviva; Roche Diagnostics). Four days later, for insulin tolerance test (IPITT), after 4 hours of fasting, mice were injected with insulin diluted in 0.9% saline (0.75 U//kg b.w. i.p, Novolin R, Novo Nordisk) intraperitoneally. Blood glucose levels were determined in saphenous-vein blood after 0, 15, 30, 60, 90, and 120 min, post glucose or insulin injection. The area under the curve (AUC) was determined by the GraphPad Prism software, as described previously.30
Serum and Liver Biochemical Analysis
After the experimental intervention, mice (n=6 each group) were sacrificed by cervical dislocation under 5% isoflurane as anesthesia. Serum samples were processed and stored at −80°C for further analysis. Nanjing Jiancheng Biotechnology Research Institute tested the malondialdehyde (MDA, A003-1-2), hydrogen peroxide (H2O2, A007-2-1), nitric oxide (NO, A013-2-1), glutathione peroxidase (GSH-PX, A005-1-2), and superoxide dismutase (SOD, A001-1-2) levels in mice serum or liver tissue samples. The content of hydroxyproline in the liver was expressed in µg/g wet weight of the liver and detected using the ELISA kit (CUSABIO, E08839m). All tests were conducted as per the manufacture’s instruction.
Liver Histology and Histological Grading of Fibrosis
After harvesting tissues of mice (n=6 each group), livers were extracted and immersed in 10% neutral buffered formalin for overnight and dehydrated using 70% ethanol. Liver tissue blocks were embedded in the paraffin, cut into 5 μm thick sections, and transferred to slides. These tissue sections were stained with hematoxylin and eosin (Solarbio, G1120), Sirius Red (Abcam, ab150681) or Masson’s trichrome (Solarbio, G1345). The stained tissue sections were visualized, and images were captured using the optical microscope (Olympus Optical Co., Ltd., Tokyo, Japan). The macro examinations were carried out by two independent observers. The total fibrosis density score was determined by dividing the image intensity by the image area, as described previously.31
Immunohistochemistry
Collagen content was measured by immunohistochemistry. After routine deparaffinization and dehydration followed by peroxidase quenching. Microwave antigen repair was carried out for immunohistochemical staining. These sections were incubated with goat serum for 1 h at room temperature followed by overnight incubation with collagen I antibody at 4°C (Abcam, ab34710, 1:100 dilution). After incubation, these tissue sections were washed with PBS and incubated with HRP-coupled secondary antibody for 1 h at room temperature. Immunoreactivity was visualized using DAB (NJJCBI, I025-1-1) staining. Lastly, the slides were counterstained using Harris hematoxylin (NJJCBI, D006-1-3). The staining intensity was quantified using Image-Pro Plus 6.0 (National Institutes of Health, USA), and integrated optical density (IOD) was measured using an optical microscope.
Immunofluorescence
Five-micrometer-thick liver sections were sealed with anti-α-SMA antibody (Proteintech, 14395-1-AP, 1:200 dilution) and incubated at 4°C overnight followed by incubation with secondary antibody coupled with Alexa fluor® 594 (Thermo Fisher, A32740, 1:200 dilution) for 30 minutes at room temperature. Nuclei were visualized using 4ʹ,6-diamidino-2-phenylindole (DAPI) staining. Images were captured using a Leica DMRB microscope equipped with a Canon EOS 600D and Canon EOS Utility 2 software version 2.14.
RNA Extraction and Real-Time PCR Analysis
Total RNA was extracted from pulverized liver samples (20 mg for each sample) using the TRIzol method (Invitrogen) and RNAeasy™ Plus mini columns (Beyotime), as per the manufacturer’s instruction. For real-time PCR (qPCR) analysis, RNA was reverse transcribed using a cDNA reverse transcription kit (Takara, Japan) and further analyzed using qPCR reaction mixture containing SYBR-green fluorescent dye (Takara, Japan). The 2−ΔΔCt method was adopted to determine the relative mRNA abundance by using the β-actin gene as an internal reference. The ABI-7600HTPCR thermocycler (Applied Biosystems, United States) was used for the qPCR analysis. Supplementary Table 1 lists the primers used for the qPCR analysis.
Western Blotting
Liver tissues (40 mg for each sample) were lysed in RIPA buffer (0.1% sodium deoxycholate, 0.5% NP-40, 150 mM NaCl, 50 mM Tris-Cl, pH 7.5). Bradford method (BCA Protein Assay Kit, 23227, Thermo Scientific™, USA) determined the protein concentration of total homogenate. Around 20–40 µg of protein sample was taken from each of the samples, resolved on 6–12% SDS-PAGE gel, and transferred to the PVDF membrane (Millipore). Proteins were detected using anti-α-SMA (Proteintech, 14395-1-AP, 1:1000 dilution), anti-TGF-β (CST, #3711, 1:1000 dilution), anti-phospho-Smad3 (Ser423/425) (CST, #9520, 1:1000 dilution), anti-Smad3 (CST, #9513, 1:1000 dilution), anti-GAPDH (CST, #97166, 1:1000 dilution) primary antibodies and horseradish peroxidase-conjugated secondary antibodies (ARIGO, ARG65251, 1:5000 dilution, ARG65250, 1:5000 dilution). The images of protein bands were captured and analyzed by the FluorChem FC2 system (Alpha, Germany). GAPDH was used as a loading control.
Quantification and Statistical Analyses
Statistical analysis was performed using GraphPad Prism version 7.0 (GraphPad Software, La Jolla, CA, USA). Shapiro–Wilk test and Levene test were used to examine the data distribution and the homogeneity of variance. Two-way ANOVA with Bonferroni post hoc test was employed to compare groups (unless otherwise denoted). GTT and ITT data were analyzed using repeated-measures ANOVA, while blood glucose data were analyzed using the ANCOVA. N=6 each group, P-value < 0.05 was considered as statistically significant. Results are shown as mean ± SD.
Results
The Effect of KD and HIIT on Glucose Homeostasis in Diabetic Mice
STZ- and HFD-induced diabetic mice were divided into four groups before initiating the experimental interventions. No significant differences were observed in the baseline body weights (Figure 1A) and fasting blood glucose levels (Figure 1C) between these four groups. However, ANOVA demonstrated a significant interaction between diet and HIIT after 8-weeks of HIIT intervention, affecting the fasting blood glucose levels (F(1,28)=13.2, P=0.0011). Post hoc analysis showed that fasting blood glucose levels were significantly improved in Db+HFD+HIIT (P=0.0005), Db+KD+Sed (P=0.0001), and Db+KD+HIIT groups (P=0.0001) than the Db+HFD+Sed group (Figure 1D). However, the interaction between diet (F[1,28]=10.95, P=0.0026) and HIIT (F[1,28]=2.297, P=0.1408) did not affect the weight of mice (Figure 1B). After an 8-week intervention, IPGTT (Figure 1E and F) and IPITT (Figure 1G and H) were performed. As per the outcomes of these tests, significant improvement in glucose tolerance and insulin sensitivity in the Db+KD+Sed (P=0.0001) and Db+KD+HIIT (P=0.0001) groups as compared to the Db+HFD+Sed group were observed. In addition, the ITT-AUC was significantly decreased in the mice of the Db+HFD+HIIT group as compared to the Db+HFD+Sed group (P=0.0119). Thus, our data suggested that both KD and HIIT improved glycemic control and glucose homeostasis in diabetic mice.
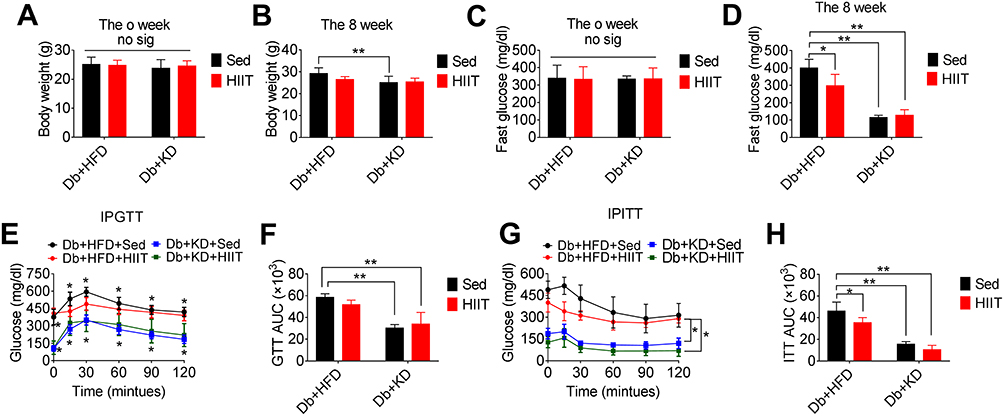 |
Figure 1 Effect of the ketogenic diet and the ketogenic diet coupled high-intensity interval on body weight and glucose homeostasis in diabetic mice. The analysis of body weight (A) before the intervention, (B) after 8-week HIIT intervention; fasting blood glucose (C) before the intervention, (D) after HIIT intervention; (E, F) glucose tolerance test, and (G, H) insulin tolerance test, after HIIT intervention. Data were presented as means ± SD (n=6 each group) and *P <0.05, **P <0.01, compared to Db+HFD+Sed group, no sig. indicates no significance. |
The Effect of KD on Oxidative Stress in Diabetic Mice
The oxidative stress-induced damage was evaluated by determining the levels of MDA, NO, H2O2, SOD, and GSH-PX in the serum of diabetic mice. Two-way ANOVA showed a significant interaction between diet and HIIT (MDA: F(1,20)=19.8, P=0.0002; H2O2: F(1,20)=11.16, P=0.0033; NO: F(1,20)=7.05, P=0.0063; SOD: F(1,20)=3.25, P=0.0039; GSH-PX: F(1,20)=9.59, P =0.0057). The Db+KD+HIIT group showed a significantly lower serum MDA, NO levels, and a higher serum SOD level, as per post hoc comparison (Figure 2B, C, and E). Besides, the Db+KD+Sed group showed increased MDA levels (P=0.0005), H2O2 (P=0.0017), NO (P=0.0001) (Figure 2A–C), and reduced SOD levels (P=0.0015) (Figure 2E) as compared to the Db+HFD+Sed group. However, after 8-weeks of HIIT intervention, the levels of MDA (P=0.0001), H2O2 (P=0.0022), NO (P=0.0006) in serum were significantly decreased (similar outcomes were observed in liver tissue, supplementary Figure 2A-B). Besides, the levels of SOD (P=0.0010), GSH-PX (P=0.0001) were markedly increased in the Db+KD+HIIT group as compared to the Db+KD+Sed group. These data suggested that the KD-HIIT significantly reversed the negative effect of KD on oxidative stress markers in diabetic mice.
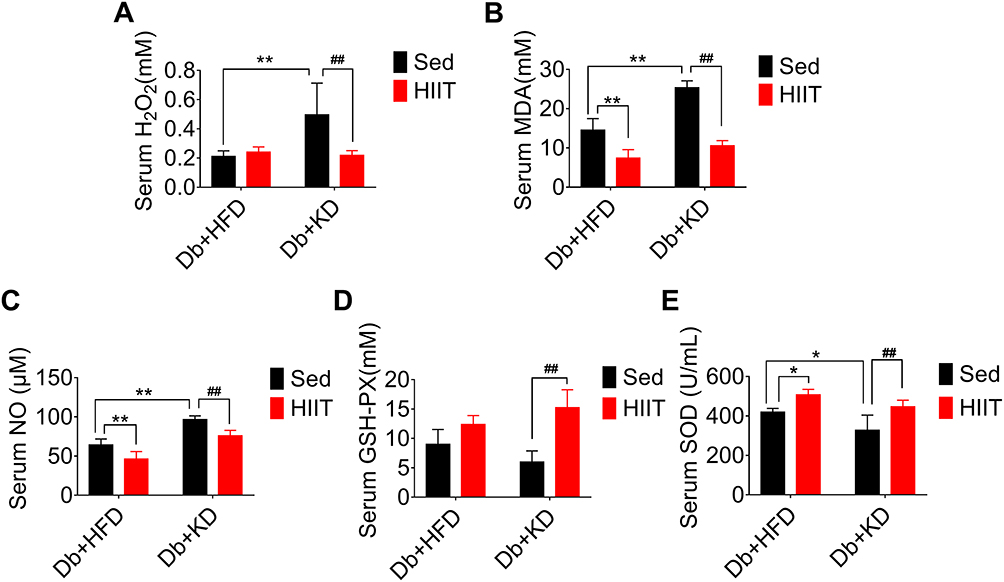 |
Figure 2 Ketogenic diet treatment-induced oxidative stress in diabetic mice. The diabetic mice were exposed to HFD or KD with or without HIIT for 8-week. Analysis of (A) serum H2O2, (B) serum MDA, (C) serum NO, (D) serum GSH-PX and (E) serum SOD in the mice of Db+HFD+Sed, Db+KD+Sed, Db+HFD+HIIT, and Db+KD+HIIT groups. Data were presented as means ± SD (n=6 each group). Groups were statistically compared using two-way ANOVA and Bonferroni post hoc tests. *P <0.05, **P <0.01, compared to Db+HFD+Sed group, ##P <0.01, compared to Db+KD+Sed group. |
HIIT Attenuated Ketogenic Diet-Induced Hepatic Steatosis and Hepatic Fibrosis in Diabetic Mice
We performed Masson trichrome, Sirius red staining, and α-SMA immunofluorescence of liver sections to prove the effects of HIIT on hepatic fibrosis in diabetic mice. KD’s intervention effectively reduced body weight and improved glucose homeostasis. However, it induced severe hepatic fibrosis, thick fibrotic septa, and pseudo-lobe formation in KD fed mice. As per the Sirius red and Masson staining, HIIT reduced liver fibrosis (Figure 3A). Two-way ANOVA analysis demonstrated a significant interaction between diet and HIIT (Sirius Red area (%): F(1,16)= 30.03, P=0.0001; fibrotic (%): F(1,16)=8.011, P=0.0121). In addition, post hoc analysis revealed that Sirius Red area (%) (Figure 3A and C) and fibrotic area (%) (Figure 3A and B) were significantly increased in the Db+KD+Sed group as compared to the Db+HFD+Sed group. However, KD-HIIT significantly decreased KD treatment led fibrotic area (%) and Sirius Red stained area (%) (P=0.001). Consistent with the morphological staining data, after HIIT intervention, the hepatic hydroxyproline content was significantly reduced in the Db+KD+HIIT group as compared to the Db+KD+Sed group (Figure 3E).
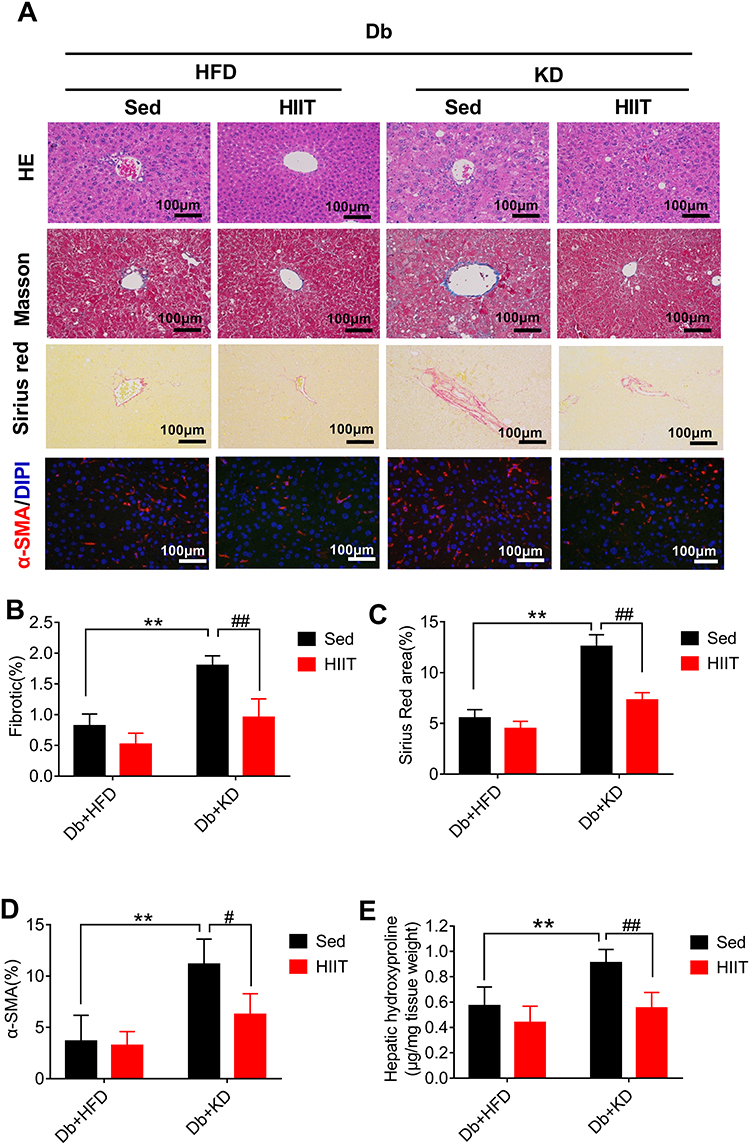 |
Figure 3 High-intensity interval training attenuated ketogenic diet-induced hepatic fibrosis and histological changes in livers of diabetic mice. Analysis of mice liver (A), fibrotic area (%) (B), Sirius Red area (%) (C), α-SMA (%) (D) and hepatic hydroxyproline levels (E). Immunostaining was performed to determine the α-SMA expression (red, 200×), and nuclear counterstaining was done using DAPI (blue). Scale bars: 100 μm. Data were presented as means ± SD (n=6 each group). Groups were statistically compared using two-way ANOVA and Bonferroni post hoc tests. **P <0.01, compared to Db+HFD+Sed group, #P <0.05, ##P <0.01 compared to Db+KD+Sed group. |
Immunofluorescent staining of the liver section from HFD-fed diabetic mice showed diminutive α-SMA (a marker of HSCs activation) staining. Conversely, the liver sections of KD-fed diabetic mice showed increased α-SMA staining. However, α-SMA-positive areas were significantly reduced in liver sections of diabetic mice treated with KD and HIIT (Figure 3A and D). Taken together, these data indicated that KD-HIIT significantly attenuated KD-induced hepatic steatosis and fibrosis in diabetic mice, and it could be correlated to the HSCs activation.
HIIT Attenuated Hepatic Fibrosis by Ameliorating TGF-β1/Smad Signaling Pathway
Hepatic stellate cells (HSCs) were the primary effector cells in liver fibrosis.32 Activated HSCs were converted to fibrogenic myofibroblast-like cells, and collagen I act as the biomarker of these cells.33 In this study, we hypothesized that HIIT could attenuate hepatic fibrosis in diabetic mice by inhibiting HSC’s activation and matrix reduction. Thus, collagen production, HSCs activation, and matrix degradation in mice liver after 8-weeks of KD-HIIT intervention were evaluated. We observed a significant interaction between diet and exercise (F(1,20)=8.348, P=0.0091), and post hoc comparisons indicated that the collagen I was significantly increased in the Db+KD+Sed group while it was reduced in the Db+KD+HIIT group after the 8-weeks intervention (Figure 4A and B).
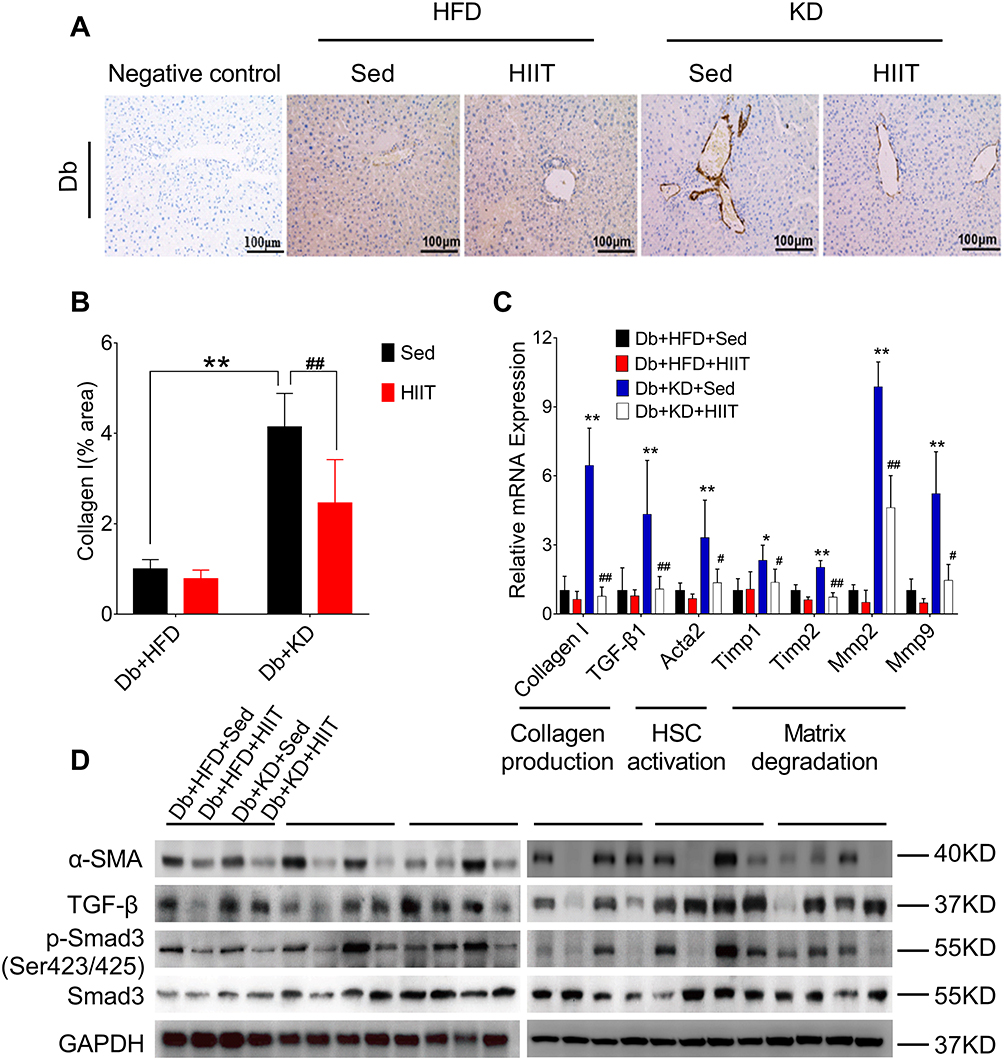 |
Figure 4 High-intensity interval training attenuated ketogenic diet-induced liver fibrosis. (A) Collagen production was compared between different groups by collagen I antibody staining. (B) Percentages of immunoreactive (collagen (I) areas in liver tissue sections were measured and expressed as relative values obtained by comparing the Db+HFD+Sed group of mice. (C) Gene expression analysis of collagen production, HSCs activation, and matrix degradation in the liver of diabetic mice of different groups. (D) Western blot analysis of mouse liver lysates by using specific antibodies against α-SMA, TGF-β, p-Smad3 (ser 423/425), or Smad3. Data were presented as means ± SD (n=6 each group). Groups were statistically compared using two-way ANOVA and Bonferroni post hoc test. Scale bars: 100 μm. *P <0.05, **P <0.01, compared to Db+HFD+Sed group, #P <0.05, ##P <0.01 compared to the Db+KD+Sed group. |
The activation of TGF-β1/Smad signaling plays a crucial role in hepatic fibrosis. The outcome of the qPCR analysis showed a significant increase in TGF-β1, collagen I, and its target genes, such as Acata2, Timp1, Timp2, Mmp2, Mmp9 levels in the Db+KD+Sed group; however, KD-HIIT treatment decreased the expression levels of these genes (Figure 4C). In addition, compared to the Db+KD+Sed group, though TGF-β protein expression showed no significant change, both α-SMA and p-Smad3 (ser423/425) levels were significantly reduced in liver of Db+KD+HIIT group mice, as per the immunoblot analysis (Figure 4D). These results collectively suggested that 8-weeks of HIIT training significantly ameliorated the KD-induced hepatic fibrosis and attenuated the TGF-β1/Smad signaling pathway activation in the liver of diabetic mice.
Discussion
Metabolic diseases are closely related to lack of exercise and unhealthy eating habits.11 Ketogenic diets (KDs) are high-fat, low-carbohydrate diets, which have been used therapeutically for decades, most notably in the epilepsy treatment.34 Recently, KD has gained much attention due to its efficient management in obesity and type 2 diabetes.35 In current study, KD-fed diabetic mice showed substantial improvement in glycemic control (Figure 1C–G), which was in line with previous studies.35,36 However, its underlying mechanism remains unclear. Perry et al showed that the 3 days of low-calorie diet improved the glucose metabolism in a type-2 diabetes rat model by reducing the hepatic glycogenolysis, acetyl-CoA-driven pyruvate carboxylase flux, and TAG-DAG-PKCε-mediated insulin resistance.37 In addition, other mechanisms, such as mitochondrial biogenesis enhancement, FGF21 regulation, phospho-AMP-activated protein kinases, and histone deacetylase (HDAC) activation, could be involved.38–41 Although KD is widely used, its complete long-term effect remains ambiguous. Some studies showed that long-term KD increased low-density lipoprotein cholesterol accumulation, inflammation, and liver steatosis in type 2 diabetes.42,43
In type 2 diabetic subjects, exercise played crucial roles, as it prevented obesity and insulin resistance. High-intensity interval training (HIIT) was contemplated as a time-effective exercise intervention with benefits similar to that of moderate-intensity aerobic exercise. Martinez-Huenchullan et al declared that HIIT improved systemic metabolism compared to constant-moderate endurance, which might have resulted due to the normalization of AdipoR1 levels in muscle and increased uncoupling protein 1 (UCP1) in subcutaneous adipose tissue.44 In addition, its underlying mechanism could involve an increased level of glucose transporter protein 4 (GLUT4) through activated adenosine 5‘-monophosphate (AMP)-activated protein kinase (AMPK) and skeletal muscle hypertrophy.45,46 Our data also demonstrated that 8-week HIIT reduced the weight and improved the glucose homeostasis in HFD-fed diabetic mice. Besides, previous studies elucidated that exercise training markedly reduced the level of hepatic tumor necrosis factor-alpha (TNF-a) level and hepatic fibrosis markers in the liver through attenuation of F4/80-positive cells and chemokine expression.47,48 Herein, we observed that KD-fed diabetic mice showed severe hepatic fibrosis, which was ameliorated by 8-weeks of HIIT intervention (Figure 3A–E). It indicated that KD had a fibrotic effect on the liver, which was ameliorated by HIIT.
Liver fibrosis was characterized by extracellular matrix accumulation that was induced by chronic liver injury. The underlying molecular mechanism for it involved the accumulation of activated α-smooth muscle actin (α-SMA) and hepatic stellate cells (HSCs) activation,49 although precise molecular mechanisms underlying liver fibrosis remains uncertain. In the past decades, multiple studies have shown the significance of the TGF-β1/Smad signaling pathway in liver disorders.24,50 TGF-β1, a key member of the TGF-β superfamily, had an apoptotic and cytostatic role in hepatocytes. In addition, TGF-β1 overexpression in the transgenic mice liver was associated with multiple organ fibrosis along with liver fibrosis.51 Therefore, inhibition of TGF-β1 and its downstream effectors may inhibit liver fibrosis effectively. Previous studies have demonstrated that regular exercise was crucial for diabetes mellitus management and mitigation of liver fibrosis through regulating TGF-β1.48,52 In the current study, we observed that the TGF-β1 expression level was significantly increased in liver samples of KD fed diabetic mice (Figure 4C). However, KD-HIIT reduced the hepatic levels of TGF-β1 and its target gene’s (collagen I, α-SMA, TIMP, Mmp, and so on) activation in diabetic mice during the experimental period of 8-weeks. Therefore, our results indicated that the TGF-β1/Smad signaling pathway inactivation might have mediated the improvement of KD-induced hepatic fibrosis.
Oxidative stress was a pathogenetic factor for liver fibrosis, imbalance of which escalated the reactive oxygen species (ROS) levels and reduced the innate antioxidant defense mechanism of the human body.53 Previous studies have shown that ROS stimulated the collagen I production in HSCs/myofibroblasts.54–56 Collagen I mediated intracellular TGF-β1 signaling, which induced fibrosis.57 Conversely, observational studies and clinical trials demonstrated the correlation between regular exercise and reduced oxidative stress. Alternatively, exercise training exerted an antioxidant effect.58 Over the past few decades, a plethora of studies have investigated the process of oxidative stress and inflammation. The outcomes of these investigations have established the link between inflammation and oxidative stress.59,60 This was concordant with the findings in other studies where a significant increase of inflammation was detected after a very low carbohydrate diet intervention.14,61 In this study, we observed that the serum levels of pro-oxidant molecules in KD fed diabetic mice were significantly higher than the HFD-fed diabetic mice (Figure 2A–C). This is in line with the previous study, which has demonstrated a significant increase in oxidative stress after KD intervention. However, KD-HIIT significantly decreased the level of oxidative stress in mice serum by elevating the activity of antioxidant enzymes (Figure 2D–E). Thus, our results showed that regular HIIT played a vital role in KD-induced liver fibrosis by ameliorating ROS mediate intracellular signaling of TGF-β1 in the liver of diabetic mice.
Thus, as per the outcome of the current study, HIIT exerted a hepatoprotective effect against KD-induced hepatic fibrosis by ameliorating ROS mediate TGF-β1/Smad signaling pathway in type 2 diabetic mice. Although the findings from this study provide support for our hypotheses, it should be acknowledged that several salient limitations apply. We were able to test only the effect of this intervention on STZ-HFD-induced diabetic mice and no causal effects were obtained by TGF-β microinjections or gene manipulation. Thus, more experimental evidence is required to validate the outcomes of this study. Even then, this study opens a potential avenue for the clinical use of KD and exercise intervention in the treatment of diabetes mellitus without liver-damaging.
In conclusion, we demonstrated that although KD improved glucose homeostasis in type 2 diabetic mice, it caused severe liver fibrosis. The adverse effects of KD surpassed its benefits, such as glucose tolerance and homeostasis. However, HIIT ameliorated this process through the impediment of the ROS mediate TGF-β1/Smad signaling pathway.
Acknowledgments
This work is supported by the National Natural Science Foundation of China (grant numbers 31671241, 31600967).
Disclosure
Dr. Yi Sun and Dr. ShuZhe Ding report grants from the National Natural Science Foundation of China, during the conduct of the study. The authors report no other potential conflicts of interest for this work.
References
1. Organisation IDF. IDF Diabetes Atlas Ninth Edition. IDF. 2019;1(9):34–36. doi:10.1016/j.diabres.2018.05.033
2. American Diabetes Association. Classification and diagnosis of diabetes. Sec. 2. in standards of medical care in diabetes-2016. Diabetes Care. 2016;39(Suppl.1):S13–S22.
3. American Diabetes Association. Diagnosis and Classification of Diabetes Mellitus. Diabetes Care. 2009;32(Suppl 1):S62–S67. doi:10.2337/dc13-S067
4. Lancet T. The diabetes pandemic. Lancet. 2011;378(9786):99. doi:10.1016/S0140-6736(11)61068-4
5. Watson JD. Type 2 Diabetes As A Redox Disease. Lancet. 2014;383(9919):841–843. doi:10.1016/S0140-6736(13)62365-X
6. Holman RR, Paul SK, Bethel MA. 10-year follow-up of intensive glucose control in type 2 diabetes. N Eng J Med. 2008;359(15):1577–1589. doi:10.1056/NEJMoa0806470
7. Tuomilehto J, Lindstrom J, Eriksson JG, et al. Prevention Of Type 2 Diabetes Mellitus By Changes In Lifestyle Among Subjects With Impaired Glucose Tolerance. N Eng J Med. 2001;344(18):1343–1350. doi:10.1056/NEJM200105033441801
8. Roberts MN, Wallace MA, Tomilov AA, et al. A Ketogenic Diet Extends Longevity and Healthspan in Adult Mice. Cell Metab. 2017;26(3):539–546. doi:10.1016/j.cmet.2017.08.005
9. Samaha FF, Iqbal N, Seshadri P, et al. As Compared With A Low-Fat Diet In Severe Obesity. N Eng J Med. 2003;348(21):2074–2081. doi:10.1056/NEJMoa022637
10. Li R-J, Liu Y, Liu H-Q, Li J. Ketogenic diets and protective mechanisms in epilepsy, metabolic disorders, cancer, neuronal loss, and muscle and nerve degeneration. J Food Biochem. 2020;44(3):3. doi:10.1111/jfbc.13140
11. Hu FB. Diet And Exercise For New-Onset Type 2 Diabetes? Lancet. 2011;378(9786):101–102. doi:10.1016/S0140-6736(11)60692-2
12. Abbasi J. Interest in the Ketogenic Diet Grows for Weight Loss and Type 2 Diabetes. JAMA. 2018;319(3):215–217. doi:10.1001/jama.2017.20639
13. Brehm BJ, Lattin BL, Summer SS, et al. One-Year Comparison of a High-Monounsaturated Fat Diet With a High-Carbohydrate Diet in Type 2 Diabetes. Diabetes Care. 2009;32(2):215–220. doi:10.2337/dc08-0687
14. Rosenbaum M, Hall KD, Guo J, et al. Glucose and lipid homeostasis and inflammation in humans following an isocaloric ketogenic diet. Obesity. 2019;27(6):971–981. doi:10.1002/oby.22468
15. Ballieux BE, Dijck LV, Doelder RD, Koning ED. Long-Term Ketogenic Diet (22 Weeks) in Mice Leads to Weight Gain, Hepatic Steatosis and Impaired Glucose Tolerance. AJP Endocrinol Metab. 2011. doi:10.1210/endo-meetings.2011.PART3.P34.P3-397
16. Zhang X, Qin J, Zhao Y, et al. Long-Term Ketogenic Diet Contributes To Glycemic Control But Promotes Lipid Accumulation And Hepatic Steatosis In Type 2 Diabetic Mice. Nutr Res. 2016;36(4):349–358. doi:10.1016/j.nutres.2015.12.002
17. Zhang Q, Xu L, Xia J, Wang D. Treatment of diabetic mice with a combination of ketogenic diet and aerobic exercise via modulations of PPARs Gene Programs. PPAR Res. 2018;2018:1–13. doi:10.1155/2018/4827643
18. Kraemer WJ, Ratamess NA. Fundamentals of Resistance Training: progression and Exercise Prescription. Med Sci Sports Exerc. 2004;36(4):674–688. doi:10.1249/01.MSS.0000121945.36635.61
19. Rooijackers HM, Wiegers EC, van der Graaf M, et al. A Single Bout of High-Intensity Interval Training Reduces Awareness of Subsequent Hypoglycemia in Patients With Type 1 Diabetes. Diabetes. 2017;66(7):1990–1998. doi:10.2337/db16-1535
20. Jelleyman C, Yates T, O’Donovan G. The effects of high-intensity interval training on glucose regulation and insulin resistance: a meta-analysis. Obesity Reviews. 2015;16(11):942–961. doi:10.1111/obr.12317
21. Zhang H, He J, Pan L, et al. Effects of Moderate and Vigorous Exercise on Nonalcoholic Fatty Liver Disease. JAMA Intern Med. 2016;176(8):1074. doi:10.1001/jamainternmed.2016.3202
22. Cassidy S, Thoma C, Hallsworth K, Parikh J, Hollingsworth KG, Taylor R. High intensity intermittent exercise improves cardiac structure and function and reduces liver fat in patients with type 2 diabetes: a randomised controlled trial. Diabetologia. 2016;59(1):56–66. doi:10.1007/s00125-015-3741-2
23. Zhao M, Perry JM, Marshall H, Venkatraman A, Qian P, He XC. Megakaryocytes maintain homeostatic quiescence and promote post-injury regeneration of hematopoietic stem cells. Nat Med. 2014;20(11):1321–1326. doi:10.1038/nm.3706
24. Meng X, Nikolic-Paterson DJ, Lan HYTGF-Β. The Master Regulator Of Fibrosis. Nat Rev Nephrol. 2016;12(6):325–338. doi:10.1038/nrneph.2016.48
25. Bettaieb A, Jiang JX, Sasaki Y, et al. Hepatocyte Nicotinamide Adenine Dinucleotide Phosphate Reduced Oxidase 4 Regulates Stress Signaling, Fibrosis, and Insulin Sensitivity During Development of Steatohepatitis in Mice. Gastroenterology. 2015;149(2):468–480. doi:10.1053/j.gastro.2015.04.009
26. De Bleser PJ, Xu G, Rombouts K, Rogiers V, Geerts A. Glutathione Levels Discriminate between Oxidative Stress and Transforming Growth Factor-β Signaling in Activated Rat Hepatic Stellate Cells. J Biol Chem. 1999;274(48):33881–33887. doi:10.1074/jbc.274.48.33881
27. Hafstad A, Jim L, Elin H, Hoper AC, Larsen TS, Aasum E. High- And Moderate-Intensity Training Normalizes Ventricular Function And Mechanoenergetics In Mice With Diet-Induced Obesity. Diabetes. 2013;62(7):2287–2294. doi:10.2337/db12-1580
28. Chavanelle V, Boisseau N, Otero YF, et al. Effects of high-intensity interval training and moderate-intensity continuous training on glycaemic control and skeletal muscle mitochondrial function in db/db mice. Sci Rep. 2017;7(1):1. doi:10.1038/s41598-017-00276-8
29. Baker EJ, Gleeson TT. The Effects Of Intensity On The Energetics Of Brief Locomotor Activity. J Exp Biol. 1999;202(Pt 22):3081–3087.
30. Ma X, Xu L, Alberobello AT, et al. Celastrol protects against obesity and metabolic dysfunction through activation of a hsf1-pgc1α transcriptional axis. Cell Metab. 2015;22(4):695–708. doi:10.1016/j.cmet.2015.08.005
31. Angulo P, Hui JM, Marchesini G, et al. The NAFLD fibrosis score: A Noninvasive System That Identifies Liver Fibrosis In Patients With NAFLD. Hepatology. 2007;45(4):846–854. doi:10.1002/hep.21496
32. Puche JE. Hepatic Stellate cells and liver fibrosis. Compr Physiol. 2013;3(4):1473–1492. doi:10.1002/cphy.c120035
33. Higashi T. Hepatic stellate cells as key target in liver fibrosis. Adv Drug Deliv Rev. 2017;121:27–42. doi:10.1016/j.addr.2017.05.007
34. Neal EG, Chaffe H, Schwartz RH, Lawson MS, Edwards N, Fitzsimmons G. The ketogenic diet for the treatment of childhood epilepsy: a randomised controlled trial. Lancet Neurol. 2008;7(6):500–506. doi:10.1016/S1474-4422(08)70092-9
35. Willi SM, Martin K, Datko FM and Brant BP. Treatment Of Type. 2 Diabetes In Childhood Using A Very-Low-Calorie Diet. Diabetes Care. 2004;27(2):348–353. doi:10.2337/diacare.27.2.348
36. Tattikota SG, Rathjen T, McAnulty SJ, et al. Argonaute2 Mediates Compensatory Expansion of the Pancreatic β Cell. Cell Metab. 2014;19(1):122–134. doi:10.1016/j.cmet.2013.11.015
37. Perry RJ, Peng L, Cline GW, et al. Mechanisms by which a very-low-calorie diet reverses hyperglycemia in a rat model of type 2 diabetes. Cell Metab. 2017;1(27):210–217. doi:10.1016/j.cmet.2017.10.004
38. Badman MK, Pissios P, Kennedy AR, Koukos G, Flier JS, Hepatic Fibroblast M-FE. Growth Factor 21 Is Regulated By Pparalpha And Is A Key Mediator Of Hepatic Lipid Metabolism In Ketotic States. Cell Metab. 2007;5(6):426–437. doi:10.1016/j.cmet.2007.05.002
39. Casanueva FF, Castellana M, Bellido D, et al. Ketogenic Diets As Treatment Of Obesity And Type 2 Diabetes Mellitus. Rev Endocr Metab Disord. 2020;21(3):381–397. doi:10.1007/s11154-020-09580-7
40. Cheng C, Biton M, Haber AL, et al. Ketone Body Signaling Mediates Intestinal Stem Cell Homeostasis and Adaptation to Diet. Cell. 2019;178(5):1115–1131. doi:10.1016/j.cell.2019.07.048
41. Newman JC, Verdin E. Ketone bodies as signaling metabolites. Trends in Endocrinol Metab. 2014;25(1):42–52. doi:10.1016/j.tem.2013.09.002
42. Ellenbroek JH, van Dijck L, Tons HA, Rabelink TJ, Carlotti F. Long-term ketogenic diet causes glucose intolerance and reduced beta- and alpha-cell mass but no weight loss in mice. Am J Physiol Endocrinol Metab. 2014;306(5):E552–E558. doi:10.1152/ajpendo.00453.2013
43. Asrih M, Altirriba J. Ketogenic diet impairs FGF21 Signaling and promotes differential inflammatory responses in the liver and white adipose tissue. PLoS One. 2015;10(5):e126364. doi:10.1371/journal.pone.0126364
44. Martinez-Huenchullan SF, Ban LA, Olaya-Agudo LF, Maharjan BR, Williams PF, Tam CS. Constant-moderate and high-intensity interval training have differential benefits on insulin sensitive tissues in high-fat fed mice. Front Physiol. 2019.
45. Hawley JA, Hargreaves M. Integrative biology of exercise. Cell. 2014;159(4):738–749. doi:10.1016/j.cell.2014.10.029
46. Gabriel BM, Zierath JR. The Limits of Exercise Physiology: from Performance to Health. Cell Metab. 2017;25(5):1000–1011. doi:10.1016/j.cmet.2017.04.018
47. Kawanishi N, Yano H, Mizokami T, Takahashi M. Exercise training attenuates hepatic inflammation, fibrosis and macrophage infiltration during diet induced-obesity in mice. Brain Behavior Immunity. 2012;26(6):931–941. doi:10.1016/j.bbi.2012.04.006
48. Tandon P, Ismond KP, Riess K, et al. Exercise in cirrhosis: translating evidence and experience to practice. J Hepatol. 2018;69(5):1164–1177. doi:10.1016/j.jhep.2018.06.017
49. Lan T, Li C, Yang G, et al. 1 Promotes Liver Fibrosis By Preventing Mir-19b-3p-Mediated Inhibition Of CCR2. Hepatology. 2018;68(3):1070–1086. doi:10.1002/hep.29885
50. Huang M, Kim HG, Zhong X, et al. Sesn3 Protects Against Diet‐Induced Nonalcoholic Steatohepatitis In Mice Via Suppression Of The TGFβ Signal Transduction. Hepatology. 2019. doi:10.1002/hep.30820
51. Liu D, Zhang P, Zhou J, et al. TNFAIP3 Interacting Protein 3 Overexpression Suppresses Nonalcoholic Steatohepatitis by Blocking TAK1 Activation. Cell Metab. 2020;31(4):726–740. doi:10.1016/j.cmet.2020.03.007
52. Colberg SR, Sigal RJ, Fernhall B, et al. Type 2 Diabetes: the American College of Sports Medicine and the American Diabetes Association: joint Position Statement Executive Summary. Diabetes Care. 2010;33(12):2692–2696. doi:10.2337/dc10-1548
53. Cho YE, Kim DK, Seo W, Gao B. Fructose promotes leaky gut, endotoxemia, and liver fibrosis through ethanol‐inducible cytochrome P450‐2E1–Mediated oxidative and nitrative stress. Hepatology. 2019:1–16. doi:10.1002/hep.30652
54. Dai X, Yan X, Wintergerst KA, Cai L, Keller BB. Redox and Metabolic Regulator of Stem Cell State and Function. Trends Mol Med. 2020;26(2):185–200. doi:10.1016/j.molmed.2019.09.007
55. Pang Q. HSCs: stressing Out Over ROS. Blood. 2011;118(11):2932–2934. doi:10.1182/blood-2011-07-367755
56. Maryanovich M, Gross A, Rheostat For AROS. Cell Fate Regulation. Trends Cell Biol. 2013;23(3):129–134. doi:10.1016/j.tcb.2012.09.007
57. Caviglia JM, Yan J, Jang M, et al. MicroRNA-21 and Dicer Are Dispensable For Hepatic Stellate Cell Activation And The Development Of Liver Fibrosis. Hepatology. 2018;67(6):2414–2429. doi:10.1002/hep.29627
58. de Sousa CV, Sales MM, Rosa TS, Lewis JE. The antioxidant effect of exercise: a systematic review and meta-analysis. Sports Medicine. 2017;47(2):277–293. doi:10.1007/s40279-016-0566-1
59. Guzik TJ, Touyz RM, Stress O. Inflammation, and Vascular Aging in Hypertension. Hypertension. 2017;70(4):660–667. doi:10.1161/HYPERTENSIONAHA.117.07802
60. Steven S, Frenis K, Oelze M, et al. Oxidative Stress: major Triggers for Cardiovascular Disease. Oxid Med Cell Longev. 2019;2019:1–26. doi:10.1155/2019/7092151
61. Joshi S. The ketogenic diet for obesity and diabetes-enthusiasm outpaces evidence. JAMA Intern Med. 2019;179(9):1163–1164. doi:10.1001/jamainternmed.2019.2633
 © 2020 The Author(s). This work is published and licensed by Dove Medical Press Limited. The full terms of this license are available at https://www.dovepress.com/terms.php and incorporate the Creative Commons Attribution - Non Commercial (unported, v3.0) License.
By accessing the work you hereby accept the Terms. Non-commercial uses of the work are permitted without any further permission from Dove Medical Press Limited, provided the work is properly attributed. For permission for commercial use of this work, please see paragraphs 4.2 and 5 of our Terms.
© 2020 The Author(s). This work is published and licensed by Dove Medical Press Limited. The full terms of this license are available at https://www.dovepress.com/terms.php and incorporate the Creative Commons Attribution - Non Commercial (unported, v3.0) License.
By accessing the work you hereby accept the Terms. Non-commercial uses of the work are permitted without any further permission from Dove Medical Press Limited, provided the work is properly attributed. For permission for commercial use of this work, please see paragraphs 4.2 and 5 of our Terms.