")
Back to Journals » Journal of Inflammation Research » Volume 16
High Infiltration of CD203c+ Mast Cells Reflects Immunosuppression and Hinders Prognostic Benefit in Stage II-III Colorectal Cancer
Authors Li J, Mo Y, Wei Q, Chen J, Xu G
Received 8 December 2022
Accepted for publication 14 February 2023
Published 21 February 2023 Volume 2023:16 Pages 723—735
DOI https://doi.org/10.2147/JIR.S400233
Checked for plagiarism Yes
Review by Single anonymous peer review
Peer reviewer comments 3
Editor who approved publication: Dr Adam D Bachstetter
Jing Li,1,* Yuzhen Mo,2,* Qingqing Wei,1 Jian Chen,3 Guozeng Xu1
1Department of Oncology, Liuzhou People’s Hospital of Guangxi Medical University, Liuzhou, Guangxi, People’s Republic of China; 2Department of Radiation Oncology, Guangzhou Red Cross Hospital of Jinan University, Guangzhou, Guangdong, People’s Republic of China; 3Department of Medical Oncology, Yantai Yuhuangding Hospital of Qingdao University, Yantai, Shandong, People’s Republic of China
*These authors contributed equally to this work
Correspondence: Guozeng Xu; Jian Chen, Email [email protected]; [email protected]
Background: Activated mast cells (AMCs) have been fully researched in inflammation and allergic reactions. However, the protumoral role of AMCs and their biomarker CD203c has not yet been investigated in colorectal cancer (CRC).
Methods: We retrospectively collected 449 postoperative patients with stage II–III CRC at two different hospitals as the training (n=310) and validation (n=139) cohorts. These findings were further validated in the independent cohort (Integration of GSE39582 and GSE17536, n=489). The AMC density was assessed using CD203c staining or the CIBERSORT method. The main analysis was recurrence-free survival (RFS) and overall survival (OS).
Results: As an independent factor, high AMC infiltration was associated with worse RFS/OS in the training (hazard ratio [HR]=3.437/3.014, all p< 0.001) and validation (HR=3.537/2.382, all p< 0.001) cohorts. We developed and validated an AMC-based nomogram for better stratification for postoperative recurrence in these two cohorts. The role of AMC density was further validated in the independent cohort. High AMC infiltration was associated with decreased RFS/OS after adjuvant chemotherapy (all p< 0.05). Approximately 74.2% of intramural CD203c+ AMCs expressed a high level of PD-L1. Multiple immunosuppressive pathways were enriched in high AMC infiltration tumors, including upregulation of the TNF-α/NF-κB and angiogenesis pathways and downregulation of the IFN-γ and IFN-α responses. AMC infiltration was reversely associated with CD8+ T-cell infiltration (all p< 0.05).
Conclusion: High AMC infiltration is associated with worse survival outcomes in stages II–III CRC. AMC density may serve as a potential biomarker for survival benefit in patients receiving adjuvant chemotherapy. This AMC-based nomogram could provide better recurrence stratification. Immunosuppression in tumors with high AMC infiltration might contribute to promoting tumor progression.
Keywords: CD203c, colorectal cancer, activated mast cell, immunosuppression, prognostic benefit
Introduction
Mast cells have been fully researched in inflammation and allergic reactions.1–3 Mast cells are an immune cellular subtype of the tumor microenvironment (TME).4 However, the prognostic role of mast cells remains largely unknown in most tumors. Mast cells may generate many cytokines and play a crucial role in tumor progression.4 Mast cells also interact with other immune cells to regulate tumor progression in the TME.5,6 Accumulating evidence indicates that tryptase is expressed in almost all mast cells and thus labeled a pan-biomarker of mast cells.7–11 However, there is no consistent opinion about the role of tryptase+ mast cells in colorectal cancer (CRC). Several studies revealed that high infiltration of tryptase+ mast cells was remarkably related to better treatment outcome,7–10 whereas most studies supported that its high infiltration was markedly associated with worse prognosis.11–18 This may attributed to a pan-biomarker of tryptase for mast cells, which could not effectively differentiate mast cells in different states.
According to the activated state, mast cells are classified into two subtypes, including resting mast cells and activated mast cells (AMCs). As a surface biomarker of AMCs, CD203c is highly expressed in gynecologic cancer, renal cell cancer, and CRC.19–21 However, no study has revealed the relationship between CD203c+ AMCs and CRC prognosis. Therefore, we assessed the prognostic role of CD203c+ AMCs in the training and validation cohorts. We developed and validated an AMC-based nomogram using CD203c staining in these two cohorts. The protumor role of AMC density was further validated in the combined microarray cohort by the CIBERSORT algorithm. We further performed gene set enrichment analysis (GSEA) to explore the crosstalk between AMCs and TME in a microarray dataset (GSE39582).
Materials and Methods
Study Population
We retrospectively collected 449 CRC patients at two different hospitals as training and validation cohorts. This study was authorized by the ethics committees of Yantai Yuhuangding Hospital (Approval No.2018–118) and Guangzhou Red Cross Hospital (Approval No.2019–227-01) and conformed to the declaration of Helsinki. Informed consent was obtained from all patients for the acquisition and use of clinical data and tumor sections. The training cohort was comprised of 310 patients receiving curative resection at Yantai Yuhuangding Hospital between 2012 and 2015, with a median follow-up duration of 57.5 months. The last follow-up time for the training cohort was August 2019. The validation cohort consisted of 139 patients receiving curative resection at Guangzhou Red Cross Hospital between 2013 and 2015, with a median follow-up duration of 65.0 months. The last follow-up time for the validation cohort was January 2020. The inclusion criteria were as follows: (i) colon cancer or middle-high rectal cancer; (ii) stage II–III disease; (iii) tumor specimens and survival information; (iv) the absence of distant metastasis; and (v) the absence of neoadjuvant chemoradiotherapy. The reason is that neoadjuvant chemoradiotherapy may affect the infiltration of immune cells in tumor tissues.
The microarray datasets (GSE39582 and GSE17536) were downloaded from the Gene Expression Omnibus repository. The levels of gene expression were first normalized by the limma package and further log2-transformed. For these genes with multiple probe sets, those with median levels were used. The batch effects between these two microarray datasets were removed by the RobustRankAggreg package. After removing batch effects, the combined microarray (GSE39582 and GSE17536) was used for calculating the estimated proportion of AMCs using the CIBERSORT algorithm,22 including 571 stage II–III cases with complete clinical and follow-up data. A threshold of p value <0.05 is recommended for further analysis.22 And 82 cases were excluded because of these cases with a p value of ≥0.05. Four hundred and eighty-nine cases with a median follow-up of 53.0 months were finally fitted in the subsequent analysis as the independent cohort.
Immunohistochemistry Staining
Single Immunohistochemistry Staining
The staining of CD203c+ AMCs in 449 CRC patients was accomplished by an automated immunohistochemistry platform (Roche Benchmark-XT, Switzerland). Rabbit anti-human CD203c (1:150, SinoBiologial, USA) primary antibody and enzyme-labeled anti-mouse/rabbit polymerized secondary antibody (ready to use, Roche Company, Switzerland) were utilized for immunohistochemistry staining. CD203c+ AMCs were stained brown. Two experienced researchers assessed the infiltrating number of three random fields (×400) and were blinded to the clinicopathological information, and the average number was adopted.
Dual Immunohistochemistry Staining
Fifteen randomly selected cases from these 449 cases were used for dual immunohistochemistry staining. Dual staining manipulation was implemented according to the direction of the anti-double staining kit (Mo/HRP+Rb/AP, Zhongshan Company, China). Mouse anti-human EpCAM (1:250, Immunoway Biotechnology Company, USA), rabbit anti-human TNF-α (1:200, Proteintech Group Inc, USA), rabbit anti-human CD203c (1:200, Sino Biological Inc, USA), and mouse anti-human PD-L1 (1:10,000, Proteintech Group Inc, USA) were used as primary antibodies. CD203c- and PD-L1-positive cells were separately stained with brown and red for CD203c+PD-L1+ mast cells. TNF-α- and EpCAM-positive cells were separately stained with brown and red for EpCAM+TNF-α+ tumor cells. Two experienced researchers assessed the infiltration number of CD203c+PD-L1+ mast cells under five randomized fields (×600) and were blinded to the clinicopathological information, and the mean number was adopted.
GSEA
To identify the enriched pathways between the high- and low-infiltration groups of AMCs, we performed GSEA on all the mRNAs of GSE39582 by using hallmark gene sets.23 The optimal cutoff of AMC density was determined by the MaxStat method.24 We carried out 1000 random sample permutations using the GSEA desktop application (version 4.3.0) to determine if a given get set was associated with high AMC infiltration. Based on this optimal cutoff, this cohort was divided into low- and high-infiltration subgroups. A threshold value of p<0.01 was significant.
Statistical Analysis
All statistical analyses were performed with R software (v4.2.1). The chi-square test was used to evaluate the association between AMC density and clinicopathological parameters. The main analysis was recurrence-free survival (RFS) and overall survival (OS).
Kaplan‒Meier analysis and Log rank tests were utilized to analyze the relationship between AMC density and survival data. The optimal cutoff of AMC density in the training cohort was calculated using the Youden index and used in the validation cohort.25,26 We could find that the optimal cutoff value of AMC density for predicting tumor recurrence within 48 months by the Youden index analysis. This optimal cutoff value could provide the best tradeoff between sensitivity and specificity. The optimal cutoff of AMC proportion in the independent cohort was also determined according to the Youden index. Multivariate Cox analysis was used to identify whether AMC density was independent of those clinicopathological variables.
In the training cohort, we constructed a nomogram model based on tumor and AMC density with the “rms” package. We applied the calibration plot and concordance index (C-index) to examine its prediction abilities in the training and validation cohorts.27,28 Receiver operating characteristic (ROC) curves were also performed to assess its predictive ability using timeROC package.
Results
Prognostic Values of AMC Density in the Training, Validation, and Independent Cohorts
Training Cohort
Using the optimal cutoff (16.77), 310 patients were divided into high- (n=200) and low-infiltration (n=110) groups in the training cohort. High- and low-infiltration of AMCs by CD203c staining are shown in Figure 1A and B. The clinical parameters of the high- and low-infiltration subgroups did not vary significantly (Table 1). Decreased RFS (hazard ratio [HR]=3.370, p<0.001, Figure 2A) and OS (HR=3.094, p<0.001, Figure 2B) were associated with the high infiltration subgroup of the training cohort. The multivariate analysis revealed that AMC density (HR=3.437/3.014, all p<0.001) and tumor stage (HR=3.528/3.840, all p<0.001) were independent risk factors for RFS/OS (Table 2).
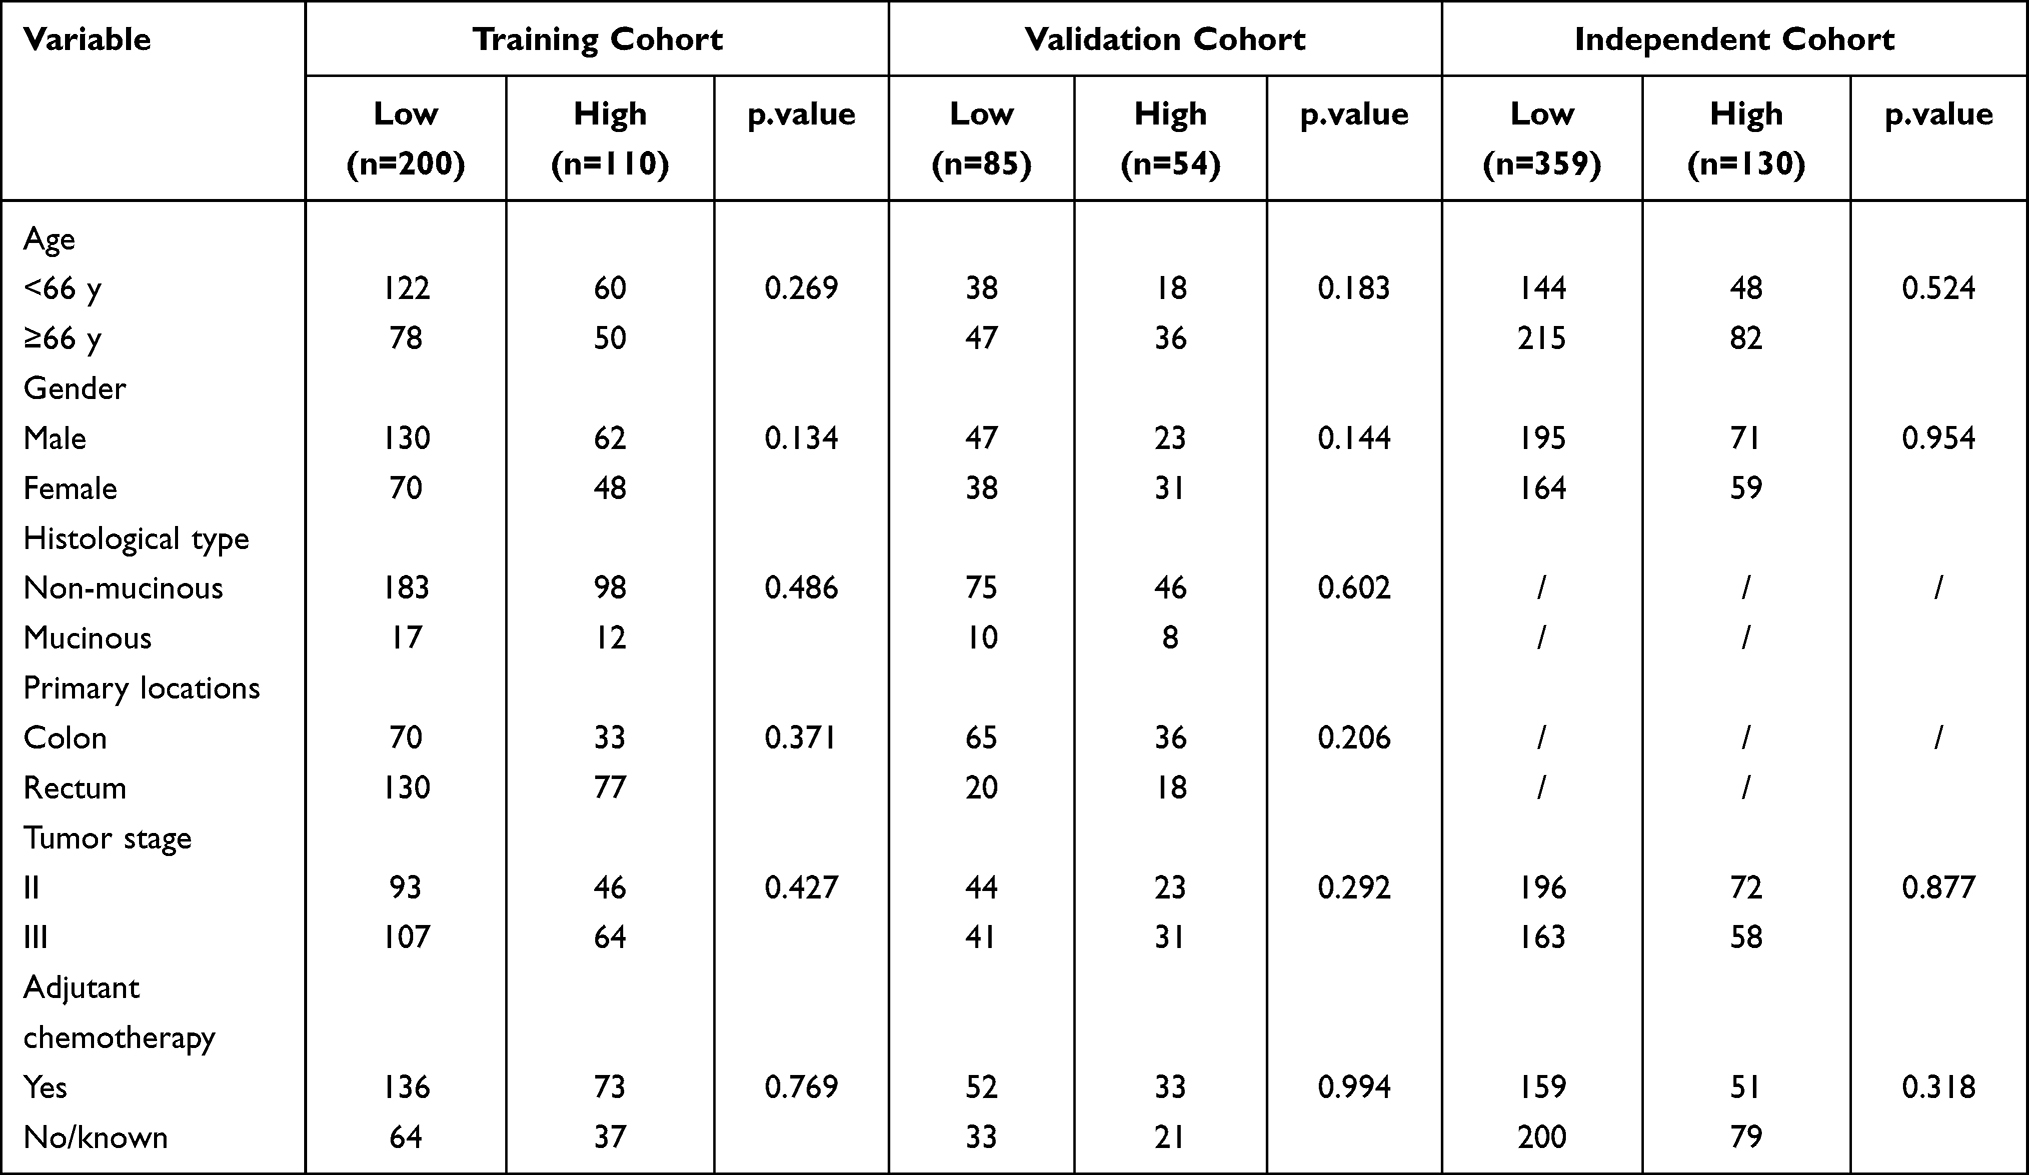 |
Table 1 Clinical Characteristics of CRC Patients According to AMC Density in Training, Validation, and Independent Cohorts |
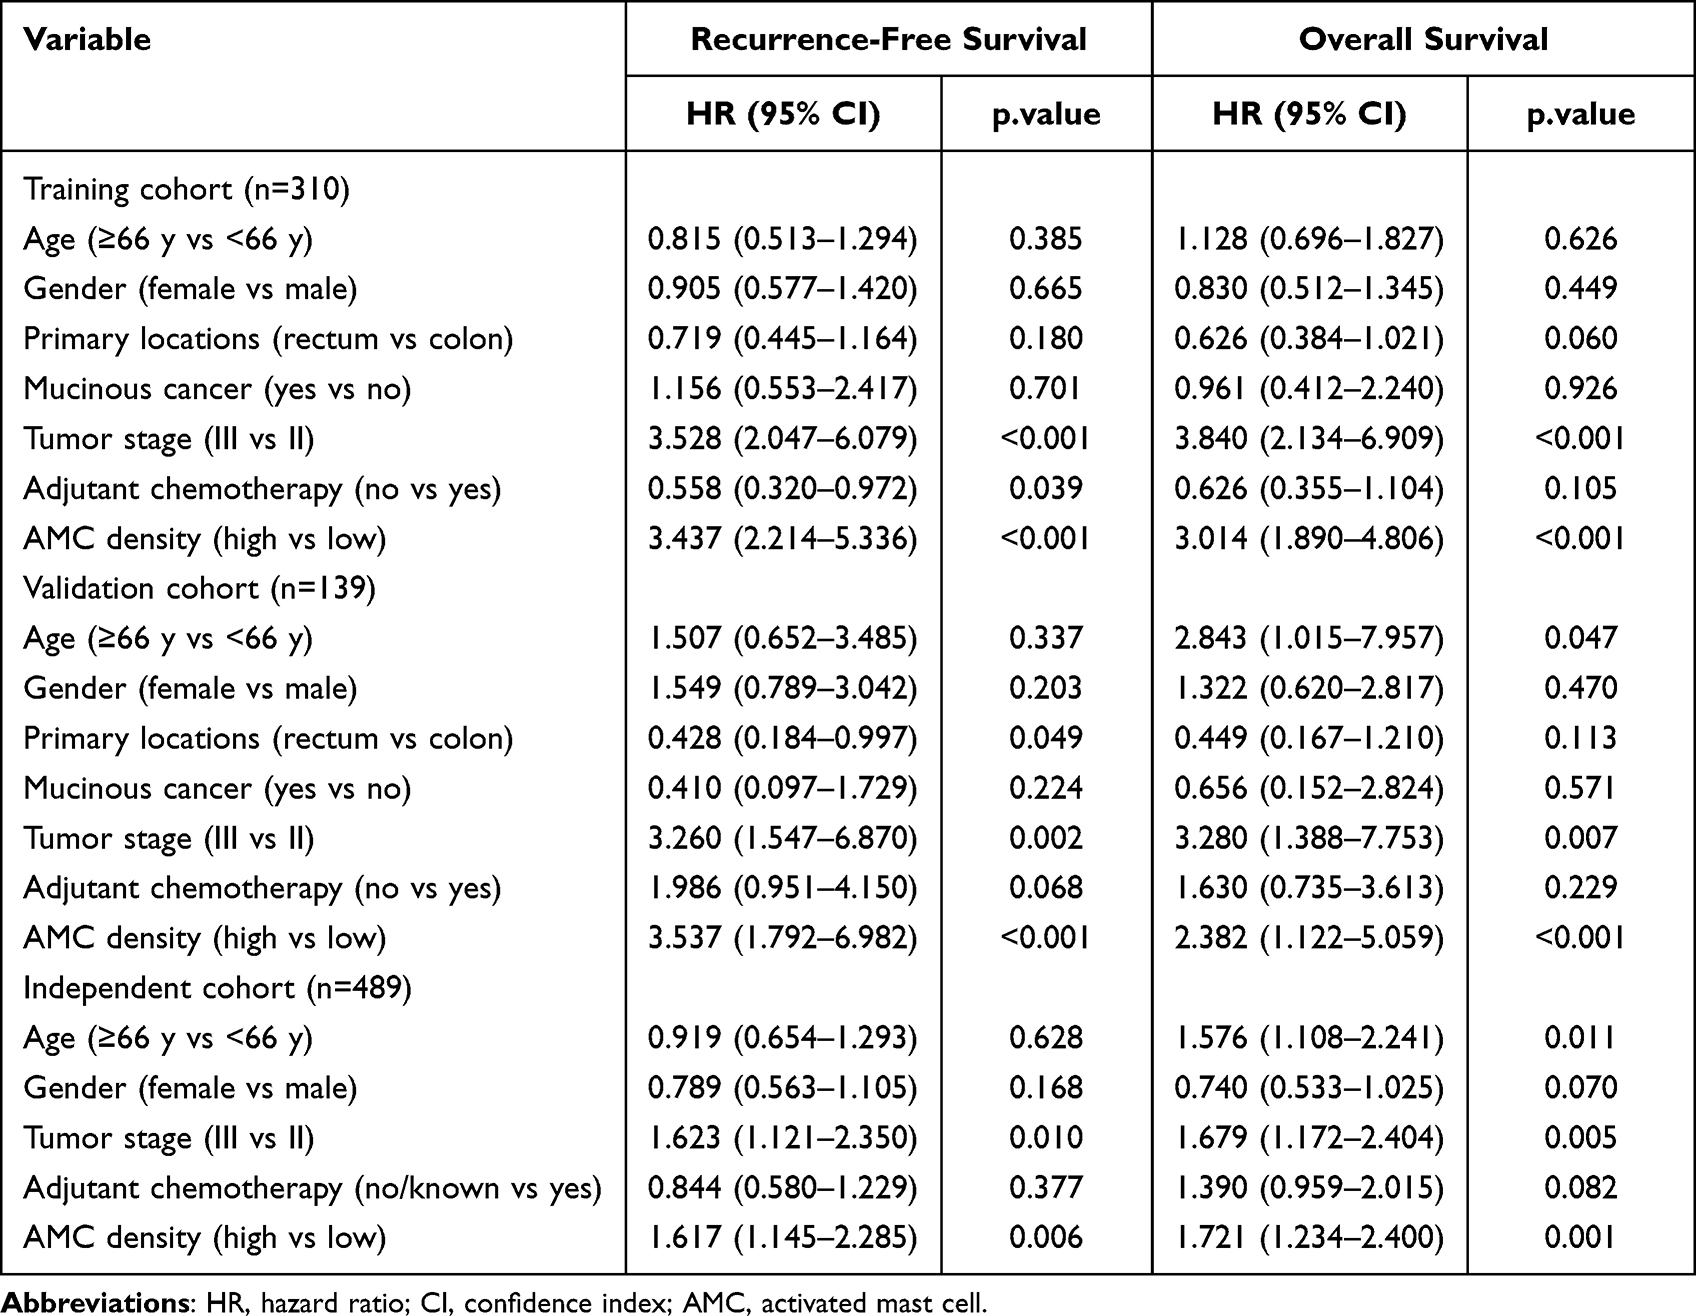 |
Table 2 Multivariate Cox Analysis of AMC Density, Clinical Factors, and Survival in Training, Validation, and Independent Cohorts |
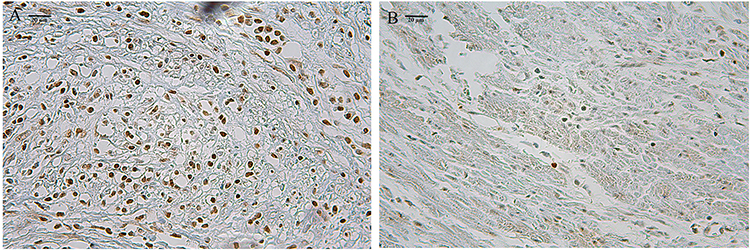 |
Figure 1 The high- (A) and low-infiltration (B) mast cells by CD203c staining (×400). |
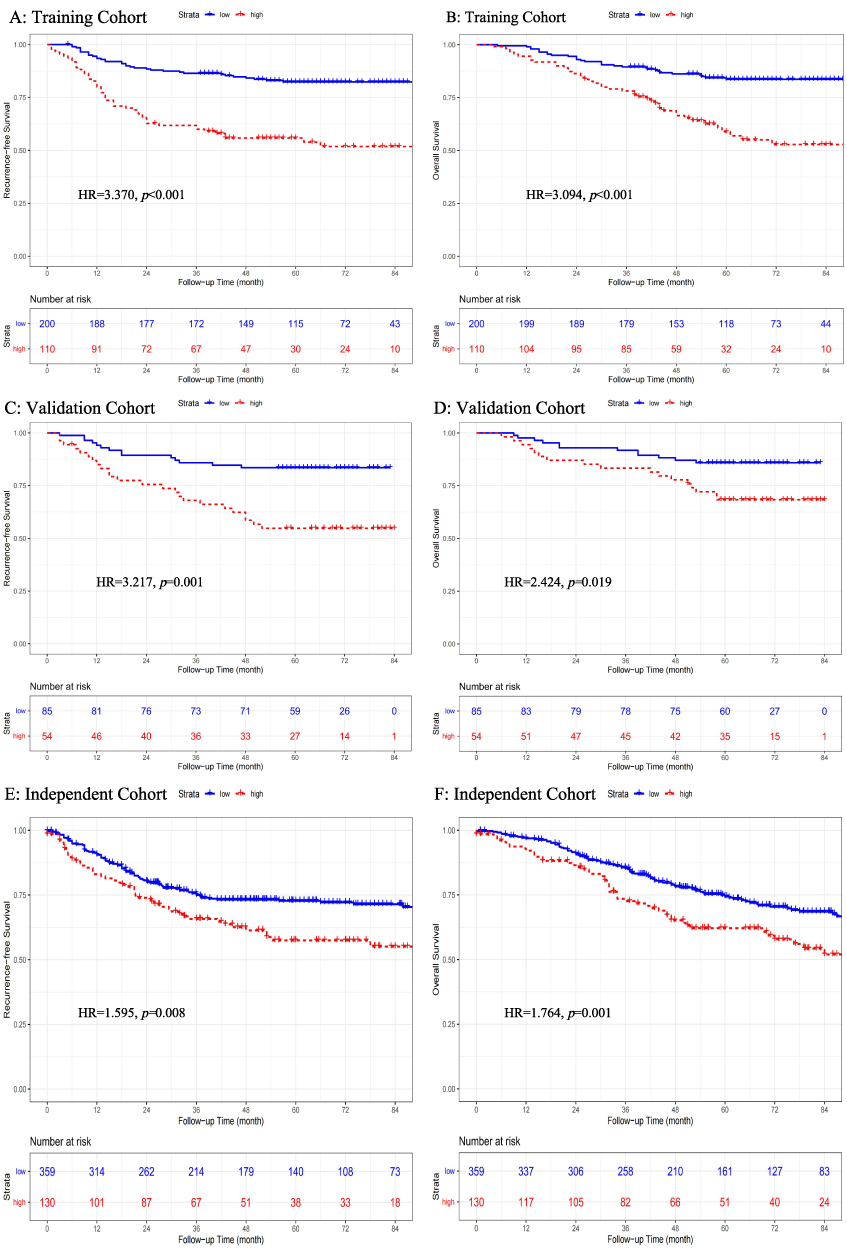 |
Figure 2 Kaplan‒Meier curves of recurrence-free survival and overall survival stratified by AMC density in the training (A and B), validation (C and D), and independent (E and F) cohorts. |
Validation Cohort
Using the same cutoff (16.77) in the validation cohort, 139 patients were divided into high- (n=81) and low-infiltration (n=58) subgroups. The clinical parameters of the high- and low-infiltration subgroups did not vary significantly (Table 1). Decreased RFS (HR=3.217, p=0.001, Figure 2C) and OS (HR=2.424, p=0.019, Figure 2D) were associated with the high infiltration subgroup of the validation cohort. The multivariate analysis revealed that AMC density (HR=3.537/2.382, all p<0.001) and tumor stage (HR=3.260/3.280, all p<0.01) were independent risk factors for RFS/OS (Table 2).
Independent Cohort
Using the optimal cutoff (0.1551) in the independent cohort, 489 patients were divided into high- (n=359) and low-infiltration (n=130) subgroups. The clinical parameters of the high- and low-infiltration subgroups did not vary significantly (Table 1). Decreased RFS (HR=1.595, p=0.008, Figure 2E) and OS (HR=1.764, p=0.001, Figure 2F) were associated with the high-infiltration subgroup of the independent cohort. The multivariate analysis demonstrated that AMC density (HR=1.617/1.721, all p<0.01) and tumor stage (HR=1.623/1.679, all p≤0.01) were independent risk factors for RFS/OS (Table 2).
The Prognostic Value of AMC Density for CRC Patients Receiving Adjuvant Chemotherapy
Adjuvant chemotherapy is the standard treatment for decreasing the relapse risk of stages II (high-risk factors) and III CRC.29–34 The combined training and validation cohort was comprised of 294 stage II–III patients receiving adjuvant chemotherapy. In this immunohistochemistry cohort, patients with high AMC infiltration had worse RFS (HR=3.768, p<0.001, Figure 3A) and OS (HR=3.463, p<0.001, Figure 3B) than patients with low AMC infiltration. The independent cohort was comprised of 210 stage II–III patients receiving adjuvant chemotherapy. In this microarray cohort, decreased RFS (HR=1.734, p=0.024, Figure 3C) and OS (HR=1.936, p=0.013, Figure 3D) were associated with the high-infiltration subgroup.
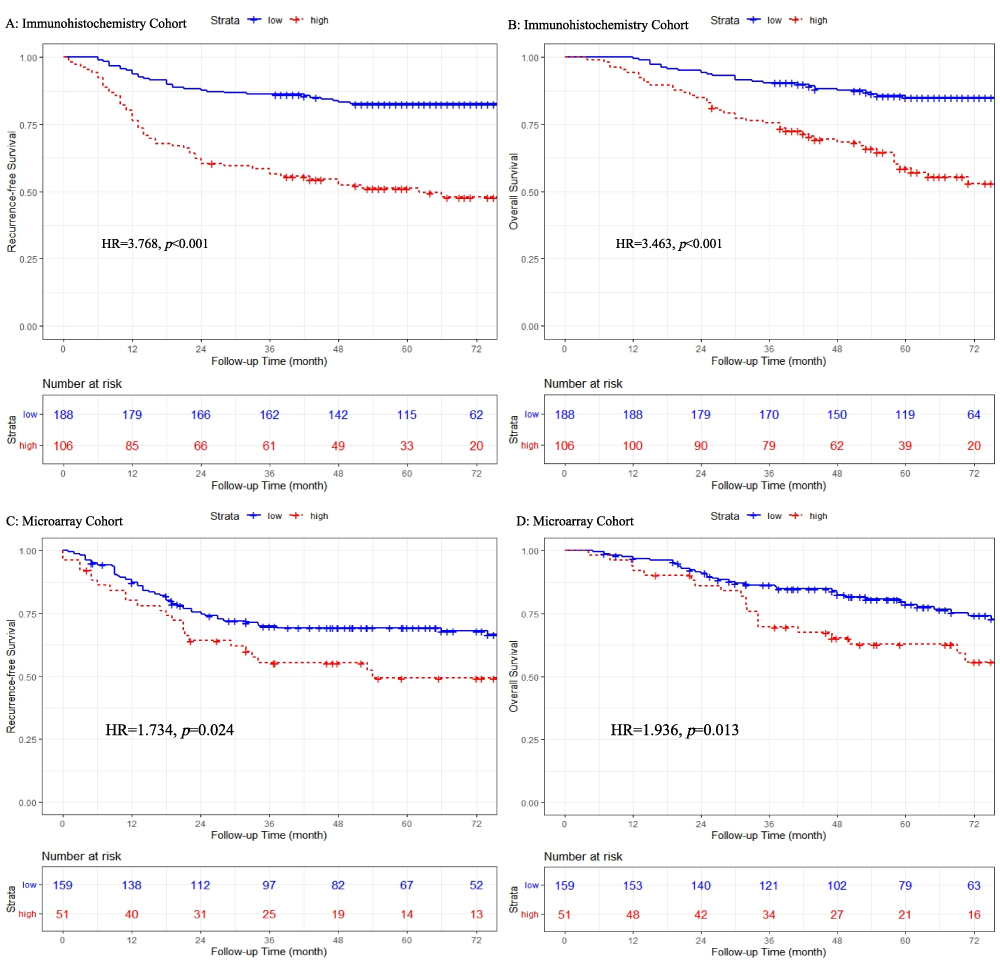 |
Figure 3 Kaplan‒Meier curves of recurrence-free survival and overall survival stratified by AMC density in the immunohistochemistry (A and B) and microarray (C and D) cohorts. |
Construction of an AMC-Based Nomogram Achieved by Immunohistochemistry
We developed and validated an AMC-based nomogram in the training and validation cohorts, which could be achieved by immunohistochemistry (Figure 4A). The calibration plots demonstrated that this nomogram predicted tumor recurrence within 48 months well in the training (C-index=0.732, Figure 4B) and validation (C-index=0.673, Figure 4C) cohorts. The ROC curves also revealed that this nomogram predicted tumor recurrence within 48 months well in the training (area under the curve [AUC]=0.733, Figure 4D) and validation (AUC=0.718, Figure 4E) cohorts (Figure 4D and E).
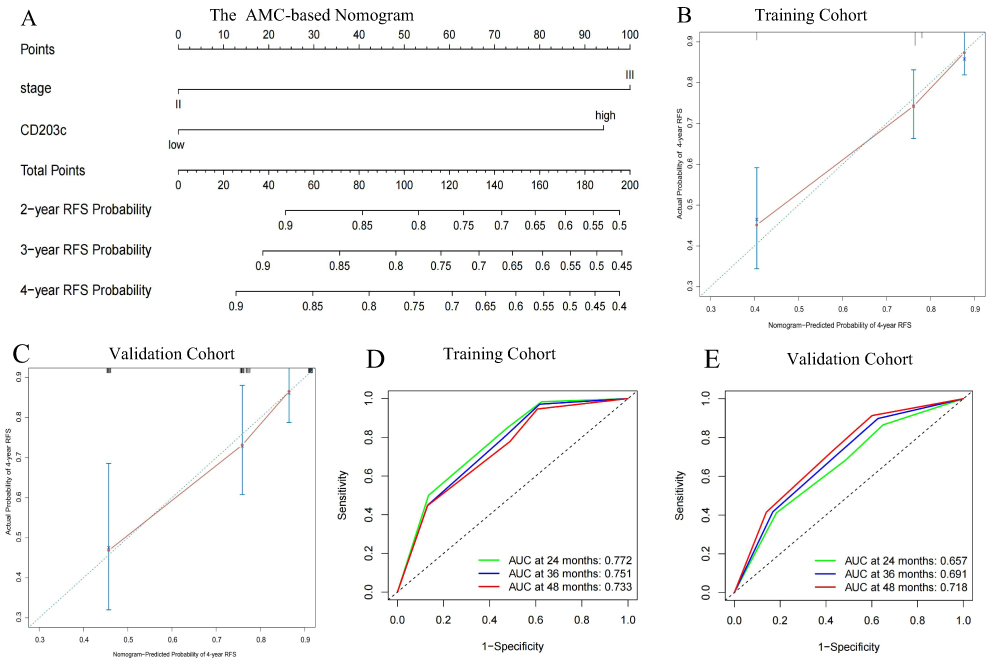 |
Figure 4 An AMC-based nomogram to predict recurrence-free survival within 48 months in the training cohort (A), calibration curve analysis of this nomogram in the training (B) and validation (C) cohorts, and further ROC curve analysis of this nomogram in the training (D) and validation (E) cohorts. |
AMC-Related Immune Microenvironment
The high AMC infiltration in the TME might promote treatment recurrence and mortality in CRC, and its regulatory mechanism is still unclear. High- and low-infiltration of intratumoral CD203c+PD-L1+ mast cells by dual immunohistochemistry staining is shown in Figure 5A and B. As shown in Figure 5C and D, intratumoral CD203c+ AMCs expressed a higher level of PD-L1 than non-tumor CD203c+ AMCs. The subpopulation of CD203c+PD-L1+ mast cells was involved in approximately 74.2% of CD203c+ AMCs (Figure 5E). AMC infiltration was reversely associated with CD8+ T-cell infiltration in two microarray datasets (GSE39582/GSE17536: R=−0.32/-0.19, all p<0.05, Figure 6A and B).
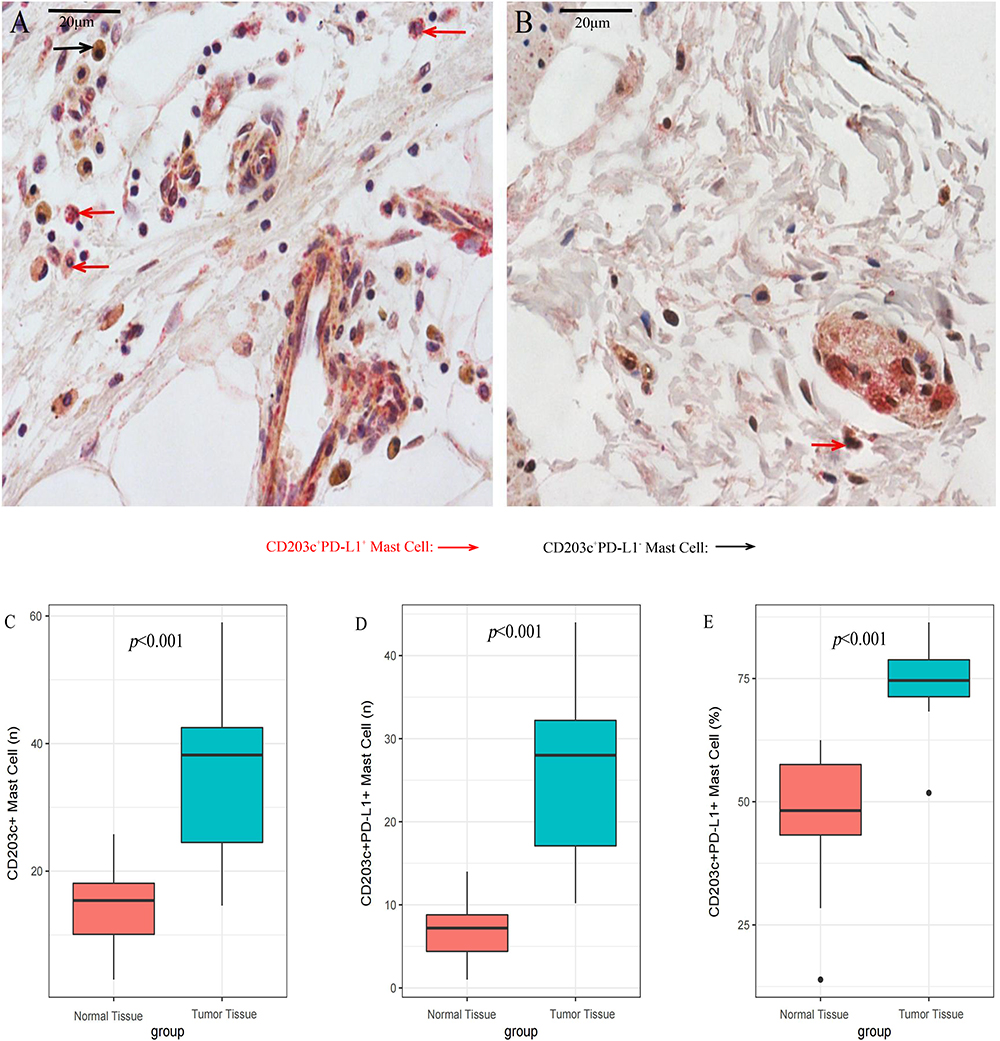 |
Figure 5 The expression level of PD-L1 on intratumoral CD203c+ mast cells in CRC tissue. (A) The high infiltration of CD203c+PD-L1+ mast cells in tumor tissue (×600); (B) The low infiltration of CD203c+PD-L1+ mast cells in tumor tissue (×600); (C) The infiltrating number of CD203c+ mast cells between tumor tissue and adjacent normal tissue; (D) The infiltrating number of CD203c+PD-L1+ mast cells between tumor tissue and adjacent normal tissue; (E) The percent of CD203c+PD-L1+ mast cells between tumor tissue and adjacent normal tissue. |
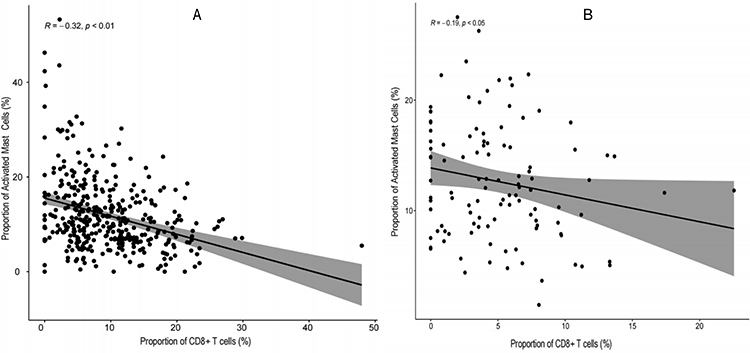 |
Figure 6 Correlation analysis of AMC infiltration and CD8+ T-cell infiltration in two microarray datasets ((A) GSE39582, (B) GSE17536). |
Dual-immunohistochemistry staining demonstrated that almost all EpCAM+ tumor cells expressed a high level of TNF-α in CRC tissues (Figure 7A and B). GSEA results implied that high AMC infiltration was correlated with the activation of the TNF-α/NF-κB pathway (Figure 8A), the decreased response of IFN-a (Figure 8B) and IFN-γ (Figure 8C), and upregulation of angiogenesis pathway (Figure 8D).
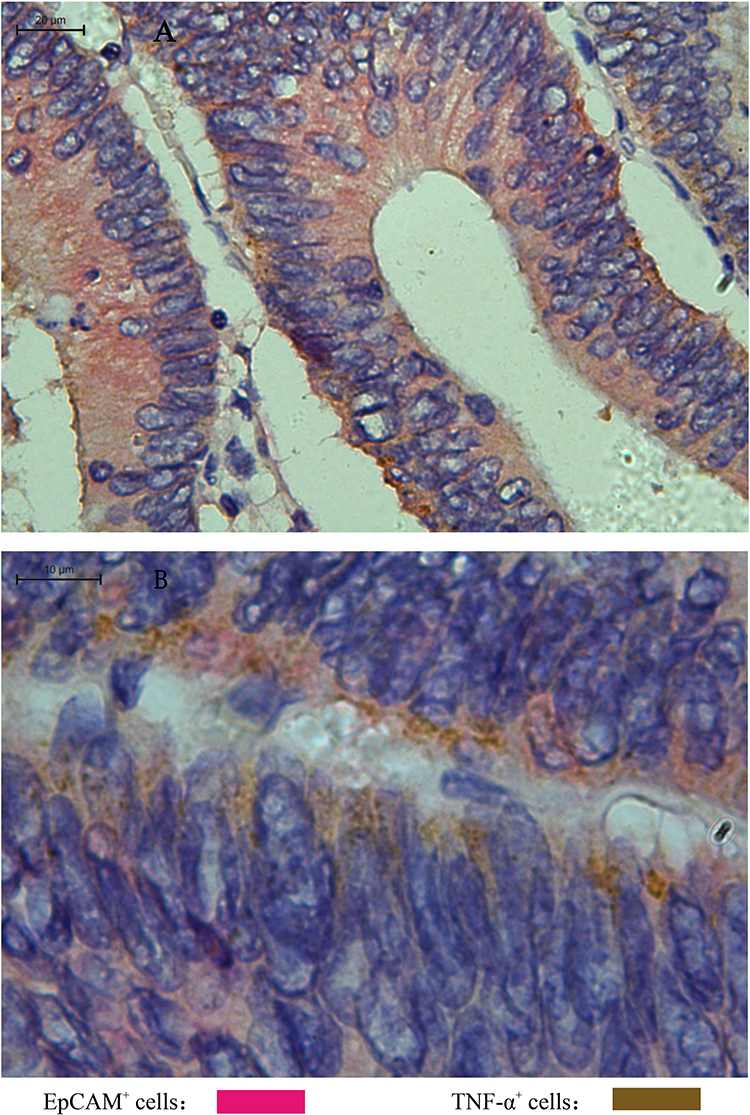 |
Figure 7 The high expression of TNF-α on EpCAM+ tumor cells in CRC tissue ((A) ×400, (B)×1000). |
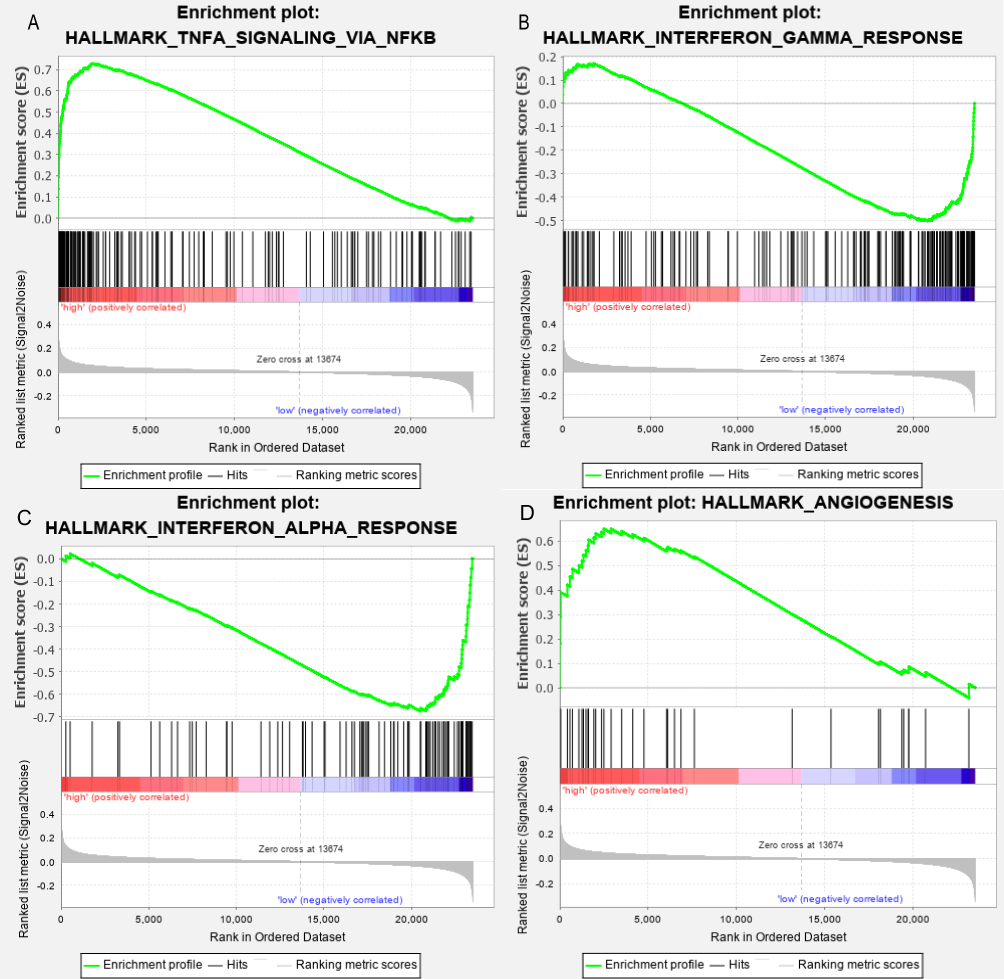 |
Figure 8 The immune-related pathways enriched in the high-infiltration group of AMCs. (A) TNF-α/NF-κB pathway, (B) IFN-α response, (C) IFN-γ response, and (D) angiogenesis. |
Discussion
Most mast cell-related studies highlighted a pan-biomarker of tryptase in CRC.7–18 This growing evidence has associated high infiltration of tryptase+ mast cells with increased microvascular density, increased microvascular invasion, worse overall survival, and disease-free survival in CRC patients.12–18 The role of AMCs and their biomarker CD203c in the progression of CRC has never been reported. In our study, we performed a semi-quantitative analysis of AMC density in 449 CRC patients by CD203c staining. We constructed a risk stratification tool based on tumor stage and CD203c+ AMC density. CD203c+ AMC density will effectively stratify these patients into two risk groups of postoperative recurrence and mortality. CRC patients with low AMC infiltration may exhibit a good prognosis, whereas CRC patients with high AMC infiltration may have a higher rate of postoperative recurrence and mortality. CD203c+ AMC density could effectively predict postoperative recurrence and mortality independent of potential confounding factors. This is the first study revealing that CD203c+ AMC density achieved by the standard immunohistochemistry procedure is recommended as a predictive tool for treatment recurrence and mortality.
The regulatory mechanism of AMCs in the microenvironment is unclear. In our study, GSEA results implied that downregulation of IFN-α and IFN-γ response, upregulation of TNF-α/NF-κB and angiogenesis pathways with immunosuppressive functions were significantly enriched in high AMC infiltration tumors. AMC infiltration was reversely associated with CD8+ T-cell infiltration. Approximately 74.2% of intratumoral CD203c+ AMCs expressed relatively high levels of PD-L1. High AMC infiltration in the TME might be associated with an immunosuppressive phenotype. A recent study found that gastric cancer-derived TNF-α might activate the NF-κB pathway to increase the PD-L1 expression on mast cells.35 There is also evidence that high AMC infiltration was associated with a lack of CD8+ T cells and resistance to anti-PD-1 therapy.36 The combined application of a c-Kit inhibitor (imatinib/sunitinib) and anti-PD-1 might contribute to the exhaustion of mast cells and tumor regression.36 These two studies implied that the exhaustion of mast cells was beneficial to anti-PD-1 responses.35,36
Adjuvant chemotherapy is the standard treatment for decreasing the risk of treatment recurrence in stages II (high risk) and III CRC.29–34,37 According to previous studies,29,30,34 the short duration and reduced toxicity of adjuvant chemotherapy may become the standard treatment for stage II (high-risk factors) and stage III (low-risk factors) CRC. The long duration of adjuvant chemotherapy should become the standard treatment for high-risk stage III CRC.31–33,37 In our analysis, stage II–III CRC could be further divided into two recurrence subgroups according to AMC density. It was also identified that patients with lower AMC density had better prognostic benefit after adjuvant chemotherapy in both immunohistochemistry and microarray cohorts. This risk stratification tool may contribute to avoiding overtreatment or undertreatment in some specific patients.
In summary, low AMC infiltration was associated with better survival outcome and served as a potential biomarker for chemotherapy benefit in stage II/III CRC. This AMC-based nomogram based on CD203c staining could provide better stratification of postoperative recurrence. CRC patients with low infiltration AMC conferred survival benefits that might be attributed to an immune-activated phenotype. It is the first study revealing the prognostic role of AMCs and their biomarker CD203c. With further multiple-center prospective studies, this biomarker application of CD203c+ AMCs will contribute to the implementation of personalized treatment strategies.
Data Sharing Statement
The main contributions are included in this article. If you have further inquiry, please consult with the corresponding authors (Guozeng Xu and Jian Chen).
Ethics Statement
This study plan was authorized by the Ethics Committees of Yantai Yuhuangding Hospital (Approval No.2018-118) and Guangzhou Red Cross Hospital (Approval No.2019-227-01).
Funding
This study was funded by the Self-funded Project of Guangxi Health Committee (No. Z20210472), the Specific Research Project of Research Bases and Talents in Guangxi (No. 2021AC19104), the Basic Ability Promotion Project of Middle-aged and Young Teachers in Guangxi (No. 2021KY0111), the Science and Technology Plan Project of Liuzhou (No. 2022CAC0102), the High-level Talents Project of Liuzhou People’s Hospital (No. lzrygcc202106).
Disclosure
Jing Li and Yuzhen Mo are co-first authors for this study. The authors report no conflicts of interest in this work.
References
1. Galli SJ, Borregaard N, Wynn TA. Phenotypic and functional plasticity of cells of innate immunity: macrophages, mast cells and neutrophils. Nat Immunol. 2011;12:1035–1044. doi:10.1038/ni.2109
2. Galli SJ, Tsai M, Piliponsky AM. The development of allergic inflammation. Nature. 2008;454(7203):445–454. doi:10.1038/nature07204
3. Amin K. The role of mast cells in allergic inflammation. Respir Med. 2012;106(1):9–14. doi:10.1016/j.rmed.2011.09.007
4. Khazaie K, Blatner NR, Khan MW, et al. The significant role of mast cells in cancer. Cancer Metastasis Rev. 2011;30(1):45–60. doi:10.1007/s10555-011-9286-z
5. Dudeck A, Dudeck J, Scholten J, et al. Mast cells are key promoters of contact allergy that mediate the adjutant effects of haptens. Immunity. 2011;34:973–984. doi:10.1016/j.immuni.2011.03.028
6. de Vries VC, Pino-Lagos K, Nowak EC, et al. Mast cells condition dendritic cells to mediate allograft tolerance. Immunity. 2011;35:550–561. doi:10.1016/j.immuni.2011.09.012
7. Tan SY, Fan Y, Luo HS, et al. Prognostic significance of mast cell infiltrations of immunosurveillance in colorectal cancer. World J Gastroenterol. 2005;11:1210–1214. doi:10.3748/wjg.v11.i8.1210
8. Nielsen HJ, Hansen U, Christensen IJ, et al. Independent prognostic value of eosinophil and mast cell infiltration in colorectal cancer tissue. J Pathol. 1999;189:487–495. doi:10.1002/(SICI)1096-9896(199912)189:4<487::
9. Malfettone A, Silvestris N, Saponaro C, et al. High density of tryptase-positive mast cells in human colorectal cancer: a poor prognostic factor related to protease-activated receptor 2 expression. J Cell Mol Med. 2013;17:1025–1037. doi:10.1111/jcmm.12073
10. Mehdawi L, Osman J, Topi G, et al. High tumor mast cell density is associated with longer survival of colon cancer patients. Acta Oncol. 2016;55:1434–1442. doi:10.1080/0284186X.2016.1198493
11. Acikalin MF, Oner U, Topçu I, et al. Tumour angiogenesis and mast cell density in the prognostic assessment of colorectal carcinomas. Dig Liver Dis. 2005;37:162–169. doi:10.1016/j.dld.2004.09.028
12. Gulubova M, Vlaykova T. Prognostic significance of mast cell number and microvascular density for the survival of patients with primary colorectal cancer. J Gastroenterol Hepatol. 2009;24:1265–1275. doi:10.1111/j.1440-1746.2007.05009.x
13. Elezoglu B, Tolunay S. The relationship between the stromal mast cell number, micro-vessel density, c-erbB-2 staining and survival and prognostic factors in colorectal carcinoma. Turk Patoloji Derg. 2012;28(2):110–118. doi:10.5146/tjpath.2012.01109
14. Wu X, Zou Y, He X, et al. mast cells in colorectal cancer as a poor prognostic factor. Int J Surg Pathol. 2013;21(2):111–120. doi:10.1177/1066896912448836
15. Ammendola M, Sacco R, Sammarco G, et al. Correlation between serum tryptase, mast cells positive to tryptase and microvascular density in colorectal cancer patients: possible biological-clinical significance. PLoS One. 2014;9(6):e9851. doi:10.1371/journal.pone.0099512
16. Suzuki S, Ichikawa Y, Nakagawa K, et al. High infiltration of mast cells positive to tryptase predicts worse outcome following resection of colorectal liver metastases. BMC Cancer. 2015;15:840. doi:10.1186/s12885-015-1863-z
17. Chen Y, Yuan R, Wu X, et al. A novel immune marker model predicts oncological outcomes of patients with colorectal cancer. Ann Surg Oncol. 2016;23(3):826–832. doi:10.1245/s10434-015-4889-1
18. Mao Y, Feng Q, Zheng P, et al. Low tumor infiltrating mast cell density confers prognostic benefit and reflects immunoactivation in colorectal cancer. Int J Cancer. 2016;143(9):2271–2280. doi:10.1002/ijc.31613
19. Yano Y, Hayashi Y, Sano K, et al. Expression and localization of ectonucleotide pyrophosphatase/phosphodiesterase I-3(E-NPP3/CD203c/PD-Ibeta/B10/gp130RB13-6) in human colon carcinoma. Int J Mol Med. 2003;12(5):763–766.
20. Doñate F, Raitano A, Morrison K, et al. AGS16F is a novel antibody drug conjugate directed against ENPP3 for the treatment of renal cell carcinoma. Clin Cancer Res. 2016;22(8):1989–1999. doi:10.1158/1078-0432.CCR-15-1542
21. Iwamoto T, Yuta A, Tabata T, et al. Evaluation of basophil CD203c as a predictor of carboplatin-related hypersensitivity reaction in patients with gynecologic cancer. Biol Pharm Bull. 2012;35(9):1487–1495. doi:10.1248/bpb.b12-00150
22. Chen B, Khodadoust MS, Liu CL, et al. Profiling tumor infiltrating immune cells with CIBERSORT. Methods Mol Biol. 2018;1711:243–259. doi:10.1007/978-1-4939-7493-1_12
23. Subramanian A, Tamayo P, Mootha VK, et al. Gene set enrichment analysis: a knowledge-based approach for interpreting genome-wide expression profiles. Proc Natl Acad Sci. 2005;102(43):15545–15550. doi:10.1073/pnas.0506580102
24. Ogłuszka M, Orzechowska M, Jędroszka D, et al. Evaluate cutpoints: adaptable continuous data distribution system for determining survival in Kaplan-Meier estimator. Comput Methods Programs Biomed. 2019;177:133–139. doi:10.1016/j.cmpb.2019.05.023
25. Hu X, Li C, Chen J, Qin G. Confidence intervals for the Youden index and its optimal cut-off point in the presence of covariates. J Biopharm Stat. 2021;31(3):251–272. doi:10.1080/10543406.2020.1832107
26. Martínez-Camblor P, Pardo-Fernández JC. The Youden Index in the Generalized Receiver Operating Characteristic Curve Context. Int J Bio Stat. 2019;15(1). doi:10.1515/ijb-2018-0060
27. Harrell FE, Lee KL, Mark DB. Multivariable prognostic models: issues in developing models, evaluating assumptions and adequacy, and measuring and reducing errors [J]. Stat Med. 1996;15:361–387. doi:10.1002/(SICI)1097-0258(19960229)15:4<361::
28. Iasonos A, Schrag D, Raj GV, et al. How to build and interpret a nomogram for cancer prognosis [J]. J Clin Oncol. 2008;26:1364–1370. doi:10.1200/JCO.2007.12.9791
29. Iveson TJ, Sobrero AF, Yoshino T, et al. Duration of adjutant doublet chemotherapy (3 or 6 months) in patients with high-risk stage II colorectal cancer. J Clin Oncol. 2021;39(6):631–641. doi:10.1200/JCO.20.01330
30. Yamazaki K, Yamanaka T, Shiozawa M, et al. Oxaliplatin-based adjuvant chemotherapy duration (3 versus 6 months) for high-risk stage II colon cancer: the randomized Phase III ACHIEVE-2 trial. Ann Oncol. 2021;32(1):77–84. doi:10.1016/j.annonc.2020.10.480
31. Yothers G, O’Connell MJ, Allegra CJ, et al. Oxaliplatin as adjuvant therapy for colon cancer: updated results of NSABP C-07 trial, including survival and subset analyses. J Clin Oncol. 2011;29(28):3768–3774. doi:10.1200/JCO.2011.36.4539
32. Haller DG, Tabernero J, Maroun J, et al. Capecitabine plus oxaliplatin compared with fluorouracil and folinic acid as adjuvant therapy for stage III colon cancer. J Clin Oncol. 2011;29(11):1465–1467. doi:10.1200/JCO.2010.33.6297
33. André T, Meyerhardt J, Iveson T, et al. Effect of duration of adjuvant chemotherapy for patients with stage III colon cancer (IDEA collaboration): final results from a prospective, pooled analysis of six randomised, Phase 3 trials. Lancet Oncol. 2020;21(12):1620–1629. doi:10.1016/S1470-2045(20)30527-1
34. O’Connor ES, Greenblatt DY, LoConte NK, et al. Adjuvant chemotherapy for stage II colon cancer with poor prognostic features. J Clin Oncol. 2011;29(25):3381–3388. doi:10.1200/JCO.2010.34.3426
35. Lv Y, Zhao Y, Wang X, et al. Increased intratumoral mast cells foster immune suppression and gastric cancer progression through TNF-α-PD-L1 pathway. J Immunother Cancer. 2019;7(1):54. doi:10.1186/s40425-019-0530-3
36. Somasundaram R, Connelly T, Choi R, et al. Tumor-infiltrating mast cells are associated with resistance to anti-PD-1 therapy. Nat Commun. 2021;12(1):346. doi:10.1038/s41467-020-20600-7
37. Grothey A, Sobrero AF, Shields AF, et al. Duration of adjuvant chemotherapy for stage III colon cancer. N Engl J Med. 2018;378(13):1177–1188. doi:10.1056/NEJMoa1713709
 © 2023 The Author(s). This work is published and licensed by Dove Medical Press Limited. The full terms of this license are available at https://www.dovepress.com/terms.php and incorporate the Creative Commons Attribution - Non Commercial (unported, v3.0) License.
By accessing the work you hereby accept the Terms. Non-commercial uses of the work are permitted without any further permission from Dove Medical Press Limited, provided the work is properly attributed. For permission for commercial use of this work, please see paragraphs 4.2 and 5 of our Terms.
© 2023 The Author(s). This work is published and licensed by Dove Medical Press Limited. The full terms of this license are available at https://www.dovepress.com/terms.php and incorporate the Creative Commons Attribution - Non Commercial (unported, v3.0) License.
By accessing the work you hereby accept the Terms. Non-commercial uses of the work are permitted without any further permission from Dove Medical Press Limited, provided the work is properly attributed. For permission for commercial use of this work, please see paragraphs 4.2 and 5 of our Terms.