")
Back to Journals » Journal of Pain Research » Volume 11
High glucose induces a priming effect in macrophages and exacerbates the production of pro-inflammatory cytokines after a challenge
Authors Grosick R , Alvarado-Vazquez PA, Messersmith AR, Romero-Sandoval EA
Received 3 February 2018
Accepted for publication 14 May 2018
Published 7 September 2018 Volume 2018:11 Pages 1769—1778
DOI https://doi.org/10.2147/JPR.S164493
Checked for plagiarism Yes
Review by Single anonymous peer review
Peer reviewer comments 3
Editor who approved publication: Dr Erica Wegrzyn
Rachel Grosick,1 Perla Abigail Alvarado-Vazquez,2 Amy R Messersmith,1 E Alfonso Romero-Sandoval2
1Department of Pharmaceutical and Administrative Science, Presbyterian College School of Pharmacy, Clinton, SC, USA; 2Department of Anesthesiology, Wake Forest University School Medicine, Winston-Salem, NC, USA
Introduction: Painful diabetic neuropathy is associated with chronic inflammation, in which macrophages are the key effectors. We utilized an in vitro approach to determine the effects of high glucose on macrophage phenotype.
Materials and methods: We exposed human THP-1 macrophages to normal glucose (5 mM) and a clinically relevant high glucose environment (15 mM) and measured the expression and concentration of molecules associated with a diabetic cellular phenotype.
Results: We found that THP-1 macrophages in high glucose conditions did not influence the basal expression of cyclooxygenase-2, Toll-like receptor-4, or class A scavenger receptor mRNA, or the concentrations of the cytokines interleukin (IL)-6, monocyte chemoattractant protein (MCP)-1, and IL-10, but induced a priming effect on tumor necrosis factor (TNF)-α. Then, we stimulated THP-1 macrophages with a strong pro-inflammatory stimulus lipopolysaccharide (LPS; 5 µg/mL). After stimulation with LPS, we observed an exacerbated increase in TNF-α, IL-6, and MCP-1 concentration in the high glucose condition compared to the normal glucose environment. THP-1 macrophages in high glucose conditions developed tolerance to IL-10 anti-inflammatory effects (TNF-α production) when challenged with LPS.
Conclusion: Our in vitro approach allows the study of macrophages as potential targets for therapeutic purposes since it compares them to primary human macrophages exposed to high glucose and macrophages from patients with diabetes or complications of painful diabetic neuropathy (i.e. ulcers, adipocytes, and pancreas).
Keywords: diabetes, hyperglycemia, THP-1, monocyte, TNF, inflammation
Introduction
According to the Prevention CfDCa. National Diabetes Statistics Report: Estimates of Diabetes and Its Burden in the United States. Atlanta, GA: U.S. Department of Health and Human Services; 2014, over 9% of the adult population in the US suffers from diabetes. Diabetes is a chronic condition that is derived from suboptimal glycemic control over time. Sustained increases in glucose levels have been associated with persistent systemic and localized inflammation observed in diabetes.1,2 This inflammation can become chronic and may eventually lead to the development of painful diabetic neuropathy or other comorbidities associated with diabetes.3 Additionally, hyperglycemia has been linked to the dysfunction of immune cells, including macrophages, which could contribute to the increased susceptibility to infections and poor wound healing seen in individuals with diabetes.4
Macrophages play an instrumental role in inflammation, due to their phenotypic plasticity. These cells can adopt a pro- (M1) or an anti-inflammatory (M2) phenotype, and transition from one to the other in the inflammatory process. Pro-inflammatory macrophages produce, release, and respond to cytokines and chemokines that regulate inflammation of the surrounding environment (i.e. tumor necrosis factor [TNF]-α, interleukin [IL]-6, IL-1, and monocyte chemoattractant protein [MCP]-1).5,6 Once the environment no longer requires a predominantly pro-inflammatory response, macrophages adopt an M2 phenotype.7 These anti-inflammatory macrophages allow for the resolution of the inflammatory process.8 The anti-inflammatory cytokines and growth factors released from the M2 macrophages (i.e. IL-1 receptor antagonist, IL-10, and transforming growth factor [TGF]-β),5 in addition to other related signals, result in a decrease of pro-inflammatory factors, which subsequently deactivate the macrophages. The deactivation of macrophages marks the end of acute inflammation.6 If this process is defective, resolution of inflammation cannot be achieved, and chronic inflammation ensues. Constant inflammation hinders the wound-healing process, and even causes damage to the surrounding tissues due to prolonged immune cell presence. Therefore, these immune cells under chronic inflammatory conditions are detrimental to healthy or healing tissues by producing a foreign body-like reaction.9 Hyperglycemic conditions seem to activate monocytes, which further contributes to the expression of an M1 macrophage phenotype.1 These macrophages under hyperglycemic conditions persistently express a pro-inflammatory phenotype, even though there is no tissue damage or infection present.1 Therefore, macrophages are a key target for potential therapies and treatments for patients with diabetes.10
Isolating monocytes/macrophages from patients can be costly and laborious, so continual studies using macrophages from healthy volunteers and individuals with diabetes are expensive and time-consuming. Finding an accurate and cost-efficient way to replicate (in vitro) the different functions and mechanisms of macrophages from patients with diabetes would provide a significant advancement in diabetes research. We hypothesize that by culturing immortalized human macrophages under high glucose conditions we can identify specific immune changes or alterations that are present in human primary macrophages exposed to high glucose, or macrophages from patients with diabetes. Thus far, this hypothesis has not been fully explored since most of the available data came from studies using monocytes. Even though understanding the functional role of monocytes in diabetic conditions is important, monocytes are not the direct effectors during inflammatory or tissue damage conditions observed in diabetes. Macrophages, on the other hand, are the type of cells that are actively present in the inflamed and/or damaged tissue, such as in diabetic neuropathy, ulcers, adipose tissue, muscles, or even the pancreas. Therefore, macrophages (rather than monocytes) are preferable local targets for potential cell-directed therapies to resolve inflammation or, for example, prevent neuronal damage or promote wound healing. Currently, there are few available studies on macrophages under high glucose conditions, which have been performed only under non-stimulatory conditions.
When human primary macrophages are exposed to high glucose concentrations in vitro, they do not have changes in the production of IL-611 or TNF-α11,12 protein (some reports show a reduction of IL-1012 or no changes in this cytokine),11 and an increase in the expression of class A scavenger receptor (SR-A) mRNA expression.13 However, to our knowledge, there are no studies that evaluate the immune capabilities of THP-1 macrophages under high glucose concentrations, and therefore, it is not known whether they can be used as surrogates of human primary macrophages for the study of diabetic inflammation. Therefore, our first aim is to study the capabilities of THP-1 macrophages to produce cytokines or express key mRNA molecules under high glucose conditions.
Currently, to our knowledge, only monocytes (not macrophages) from patients with diabetes have been studied using lipopolysaccharide (LPS) as a stimulus in vitro, showing an enhanced production of IL-614 and TNF-α14 protein, an enhanced expression of toll-like receptor-4 (TLR4)15 mRNA, and a resistance to IL-10 anti-inflammatory effects (reduction of TNF-α).1 In patients with diabetes, the fluid of chronic diabetic foot ulcers16,17 and macrophages found in chronic diabetic wounds18 have higher levels of TNF-α compared to healthy subjects, which demonstrate that local macrophages exposed to high glucose and exogenous stimulus (i.e. bacteria) for long periods of time display a persistent inflammatory phenotype. Therefore, our second aim is to study the immune capabilities of THP-1 macrophages exposed to an exogenous stimulus using LPS.
Materials and methods
Cell culture
Immortalized human THP-1 monocytes were obtained from ATCC (American Type Culture Collection; Manassas, VA, USA) and cultured in 75 cm2 flasks at 8 × 10⁴ cells/cm2 with glucose-free Roswell Park Memorial Institute 1640 medium (RPMI 1640; Gibco, Grand Island, NY, USA) supplemented with 10% fetal bovine serum and 1% penicillin/streptomycin. Anhydrous glucose (Gibco) was added to the RPMI to yield concentrations of 5 and 15 mM. Clinically, one of the recommended criteria for diagnosing diabetes in a patient is having a fasting blood glucose level of 7 mM or higher (World Health Organization. [2016]. Global report on diabetes. World Health Organization. http://www.who.int/iris/handle/10665/204871). To simulate an uncontrolled diabetic state, we chose to culture cells in a glucose concentration that was about twice the amount of the fasting plasma glucose in patients with diabetes. For an osmotic control, regular media (5 mM glucose) was supplemented with 10 mM of mannitol to yield a media with a similar osmotic pressure to the 15 mM glucose-supplemented media: 10 mM mannitol plus regular (5 mM) media.19,20 The cells were incubated in the aforementioned concentration at 37°C in a 5% CO2 atmosphere throughout the experiment. THP-1 monocytes were differentiated into macrophages with 60 ng/mL phorbol-12-myristate-13-acetate (Sigma, St. Louis, MO, USA) for 36 hours (incubated at 37°C, 5% CO2 and were collected as follows: media was removed, 5 mL of trypsin/ethylene diamine tetraacetic acid (Mediatech Inc., Manassas, VA, USA) was added, and cells were incubated for 5 minutes at 37°C.21 The reaction was stopped using an appropriate amount of glucose-supplemented or glucose- and mannitol-supplemented media, and the cells were centrifuged at 1,200 rpm for 5 minutes.
Cell viability was determined using trypan blue. The cells were then resuspended at a concentration of 250,000 cells/mL and seeded on 24-well plates (250,000 cells/well) for 1 hour. Predetermined groups of cells were stimulated with 5 µg/mL LPS (Escherichia coli O111:B4; Sigma) and incubated (37°C, 5% CO2) for 6, 24, or 48 hours.
The cell viability in each experiment, determined by trypan blue staining, was >90% in all conditions, and no differences were observed among groups.
RNA isolation and quantitative real-time polymerase chain reaction of THP-1 macrophages
The cells were plated for 1 hour, as previously stated (on 24-well plates, 37°C, 5% CO2), and then stimulated with 5 µg/mL LPS for 24 or 48 hours. Then, the cells were washed with 1 mL of cold sterile PBS (1X). The cells were then collected using BL + TG (PBS and 1-thioglycerol) buffer and 1-thioglycerol and stored at –80°C until RNA isolation. RNA was isolated using Reliaprep™ RNA Cell Miniprep System (Promega, Madison, WI, USA). Cyclooxygenase-2 (COX-2) and TLR4 mRNA levels were measured following 24 hours of incubation, and SR-A mRNA levels were measured following 48 hours. These molecules and time points were chosen based on the findings from previous studies using monocytes from patients with diabetes15,22 or primary human macrophages exposed to high glucose conditions.13
Total RNA from each sample was reverse-transcribed using iScript™ Reverse Transcription Supermix (BioRad, Hercules, CA, USA) in the following environmental conditions: 5 minutes at 25°C, 30 minutes at 42°C, and 5 minutes at 85°C. We quantified the expression of β-actin (57°C), COX-2 (53.5°C), SR-A (57°C), and TLR4 (55°C) using SsoAdvanced™ Universal SYBR Green Supermix (BioRad) in the following environmental conditions: 1 cycle of 98°C for 30 seconds, 45 cycles of 98°C for 15 seconds, and 30 seconds of the primer-specific annealing temperature. The mRNA expression for each molecule of interest was normalized to the β-actin expression level. Each sample was run in duplicate. Each primer was purchased from Integrated DNA Technologies (Coralville, IA, USA). Sequences for the primers used are shown in Table 1.
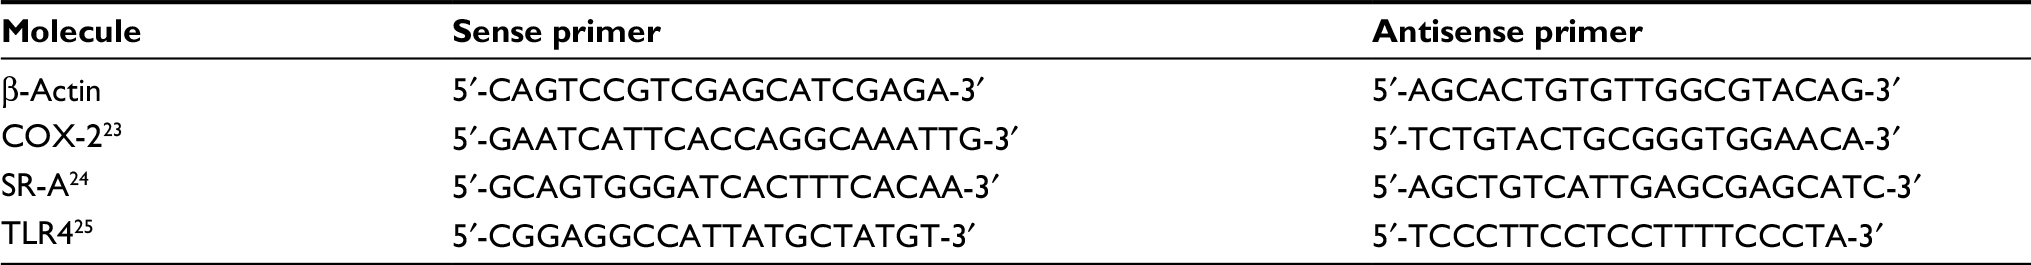 | Table 1 Primers used for polymerase chain reaction Abbreviations: COX-2, cyclooxygenase-2; SR-A, class A scavenger receptor; TLR4, toll-like receptor-4. |
ELISAs
Supernatant concentrations of IL-6, IL-10, MCP-1, and TNF-α were measured from THP-1 macrophages exposed to normal glucose, high glucose, or osmotic pressure control conditions in the presence or absence of LPS. The cells were plated for 1 hour as stated before (on 24-well plates, 37°C, 5% CO2), and then stimulated with 5 µg/mL LPS for 6, 24, or 48 hours. This LPS concentration was chosen based on the previous findings from our laboratory using THP-1 and human primary macrophages.26,27 These time points were chosen based on the available literature using THP-1 monocytes cultured in high glucose28 and primary human macrophages exposed to high glucose.11,12 Supernatants were collected following LPS stimulation and stored at –80°C until use. Commercial sandwich enzyme-linked immunosorbent assay (ELISA) kits (Human IL-6, IL-10, MCP-1, or TNF-α, ELISA Ready-SET-Go!; eBioscience, San Diego, CA, USA) were used to measure the concentrations of IL-6, IL-10, MCP-1, or TNF-α in supernatants, according to the manufacturer’s protocol. All data were compared to the control groups (non-stimulated and mannitol). The sensitivities of the ELISA kits were as follows: 2 pg/mL (IL-6), 2 pg/mL (IL-10), 7 pg/mL (MCP-1), and 4 pg/mL (TNF-α).
Effect of recombinant IL-10 on TNF-α production
Recombinant IL-10 reduces the production of TNF-α from whole-blood cultures from healthy individuals stimulated with LPS. This anti-inflammatory effect of IL-10 is not reproduced in whole-blood cultures from individuals with diabetes.1 Therefore, we tested whether THP-1 macrophages exposed to high levels of glucose developed this resistance to IL-10 (via TNF-α reduction). The cells were plated for 1 hour, as mentioned previously (on 24-well plates, 37°C, 5% CO2), and then stimulated with 5 µg/mL LPS in the presence or absence of recombinant IL-10 (10 ng/mL; R&D systems, Minneapolis, MN, USA). Supernatants were collected after 6 hours of incubation and frozen at –80°C to be further studied for TNF-α cytokine concentration, as described elsewhere.1
Statistical analysis
All tests were performed in duplicate in two to three independent experiments for a total n >10. Statistical analysis was performed using GraphPad Prism 6.01 (GraphPad Software Inc., La Jolla, CA, USA). Two-way analysis of variance (ANOVA) was performed to determine the significance between the groups. A P value <0.05 was considered significant. Data are presented as mean ± SD.
Results
COX-2, TLR4, and SR-A mRNA expression in high glucose conditions in the presence or absence of an LPS challenge
The levels of mRNA were determined in THP-1 macrophages under normal (5 mM), high (15 mM) glucose, or mannitol (control) conditions. Predetermined groups of cells in each group were incubated in the presence or absence of LPS (5 µg/mL). Our results show the expression of mRNA from three independent experiments. The values for mRNA levels are represented as fold changes compared to the non-stimulated group of cells in normal (5 mM) glucose for each gene.
The levels of COX-2 mRNA were quantified at 24 hours after incubation. In high glucose (15 mM) conditions without an LPS challenge (1.839 ± 1.264), the COX-2 mRNA level was not different compared to the glucose control (5 mM, 1.000 ± 0.4462) or the mannitol control (1.339 ± 0.5680, Figure 1A). After LPS stimulation, the level of COX-2 mRNA was increased compared to the non-stimulated groups in normal glucose (5 mM, 6.431 ± 5.012 vs. 1.000 ± 0.4462), high glucose (15 mM, 7.491 ± 3.071 vs. 1.839 ± 1.264), and the mannitol control (7.262 ± 2.734 vs. 1.339 ± 0.5680, Figure 1A). In high glucose (15 mM) conditions after an LPS challenge (7.491 ± 3.071), the COX-2 mRNA level was not different compared to the glucose control (5 mM, 6.431 ± 5.012) or the mannitol control (7.262 ± 2.734, Figure 1A).
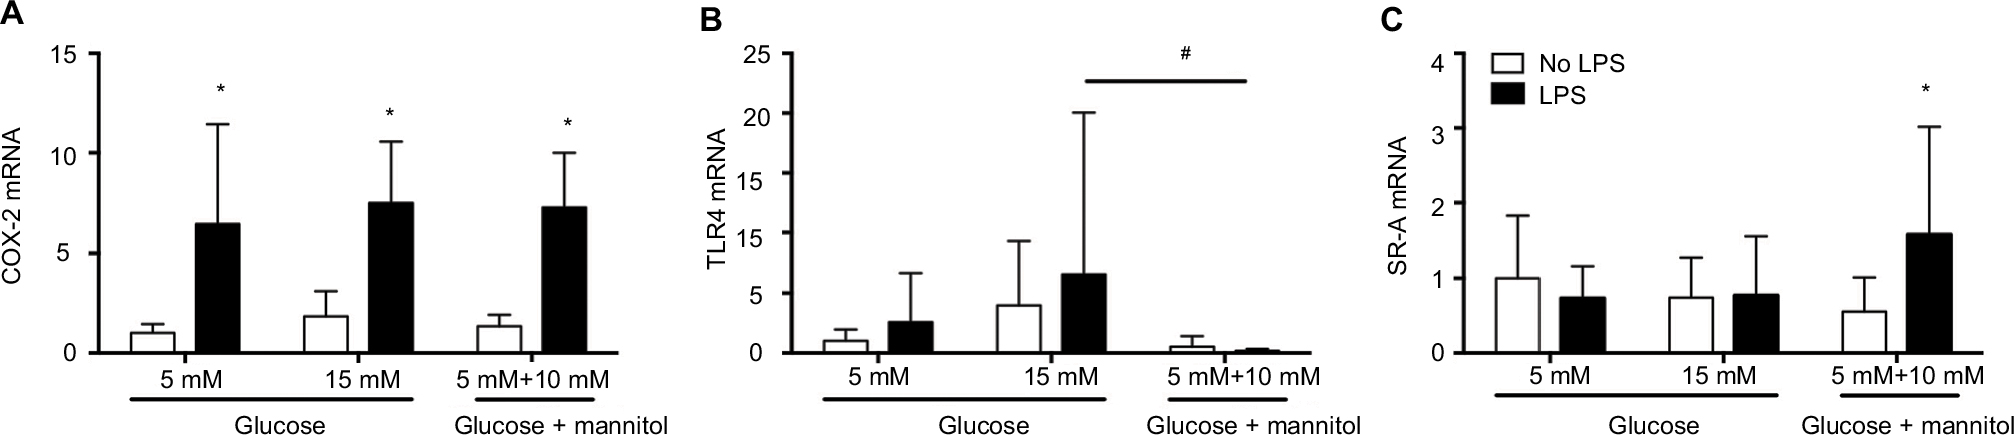 | Figure 1 Expression of COX-2 (A), TLR4 (B), and SR-A (C) mRNA in THP-1 macrophages under normal glucose (5 mM), high glucose (15 mM), or mannitol (10 mM) conditions after LPS stimulation or without any stimulation after 24 or 48 hours. Notes: The mRNA expression for each gene was normalized to the respective levels of β-actin in each group and calculated as the fold change against the unstimulated 5 mM glucose control group. N = 10–18. *P < 0.05 vs. respective no LPS group. #P < 0.05 between groups, by two-way ANOVA followed by Bonferroni post hoc test. Abbreviations: COX-2, cyclooxygenase-2; TLR4, toll-like receptor-4; SR-A, class A scavenger receptor; LPS, lipopolysaccharide; ANOVA, analysis of variance. |
The levels of TLR4 mRNA were quantified at 24 hours of incubation. In high glucose (15 mM, 3.975 ± 5.313) conditions without an LPS challenge, the TLR4 mRNA level was not different compared to the glucose control (5 mM, 1.000 ± 0.9564) or the mannitol control (0.5366 vs. 0.8585, Figure 1B). After LPS stimulation, the level of TLR4 mRNA did not change compared to the non-stimulated groups in each condition (Figure 1B). In high glucose (15 mM) conditions after an LPS challenge (6.581 ± 13.46), the TLR4 mRNA was not different compared to the glucose control (5 mM, 1.563 ± 2.056), but it was significantly higher vs. the mannitol control group (0.4101 ± 0.5813, Figure 1B).
The levels of SR-A mRNA were quantified at 48 hours of incubation. In high glucose (15 mM, 0.7400 ± 0.5393) conditions without an LPS challenge, the SR-A mRNA level was not different compared to the glucose control (5 mM, 1.000 ± 0.8279) or the mannitol control (0.5537 ± 0.4577, Figure 1C). After LPS stimulation, the level of SR-A mRNA did not change compared to the non-stimulated groups in normal (0.7331 ± 0.4286 vs. 1.000 ± 0.8279) or high glucose (0.7690 ± 0.7792 vs. 0.7400 ± 0.5393), but it increased significantly in the mannitol control group (1.573 ± 1.444 vs. 0.5537 ± 0.4577, Figure 1C). In high glucose (15 mM) conditions after an LPS challenge (0.7690 ± 0.7792), the SR-A mRNA was not different compared to the glucose control (5 mM, 0.7331 ± 0.4286) or the mannitol control group (1.573 ± 1.444, Figure 1C).
Cytokine release in high glucose conditions in the presence or absence of an LPS challenge
The levels of cytokines were determined in THP-1 macrophages under normal (5 mM) glucose, high (15 mM) glucose, or mannitol (control) conditions. Predetermined groups of cells in each group were incubated in the presence or absence of LPS (5 µg/mL). Our results show the cytokine concentration from three independent experiments and at 24 hours of incubation.
In high glucose (15 mM, 58.92 ± 19.94 pg/mL) conditions without an LPS challenge, the IL-6 concentration was not different compared to the glucose control (5 mM, 45.08 ± 21.62 pg/mL) or the mannitol control (49.79 ± 19.32 pg/mL, Figure 2A). After LPS stimulation, the concentration of IL-6 was increased compared to the non-stimulated groups in normal glucose (5 mM, 184.1 ± 57.20 pg/mL vs. 45.08 ± 21.62 pg/mL), increased glucose (15 mM, 244.0 ± 46.59 pg/mL vs. 58.92 ± 19.94 pg/mL), and the mannitol control (250.5 ± 33.09 pg/mL vs. 49.79 ± 19.32 pg/mL, Figure 2A). In high glucose (15 mM) + LPS (244.0 ± 46.59 pg/mL) or mannitol + LPS (250.5 ± 33.09 pg/mL), the IL-6 concentration was significantly higher compared to the glucose control (5 mM) + LPS (184.1 ± 57.20 pg/mL, Figure 2A). The concentration of IL-6 was not different in high glucose (15 mM) + LPS (244.0 ± 46.59 pg/mL) vs. mannitol + LPS group (250.5 ± 33.09 pg/mL, Figure 2A).
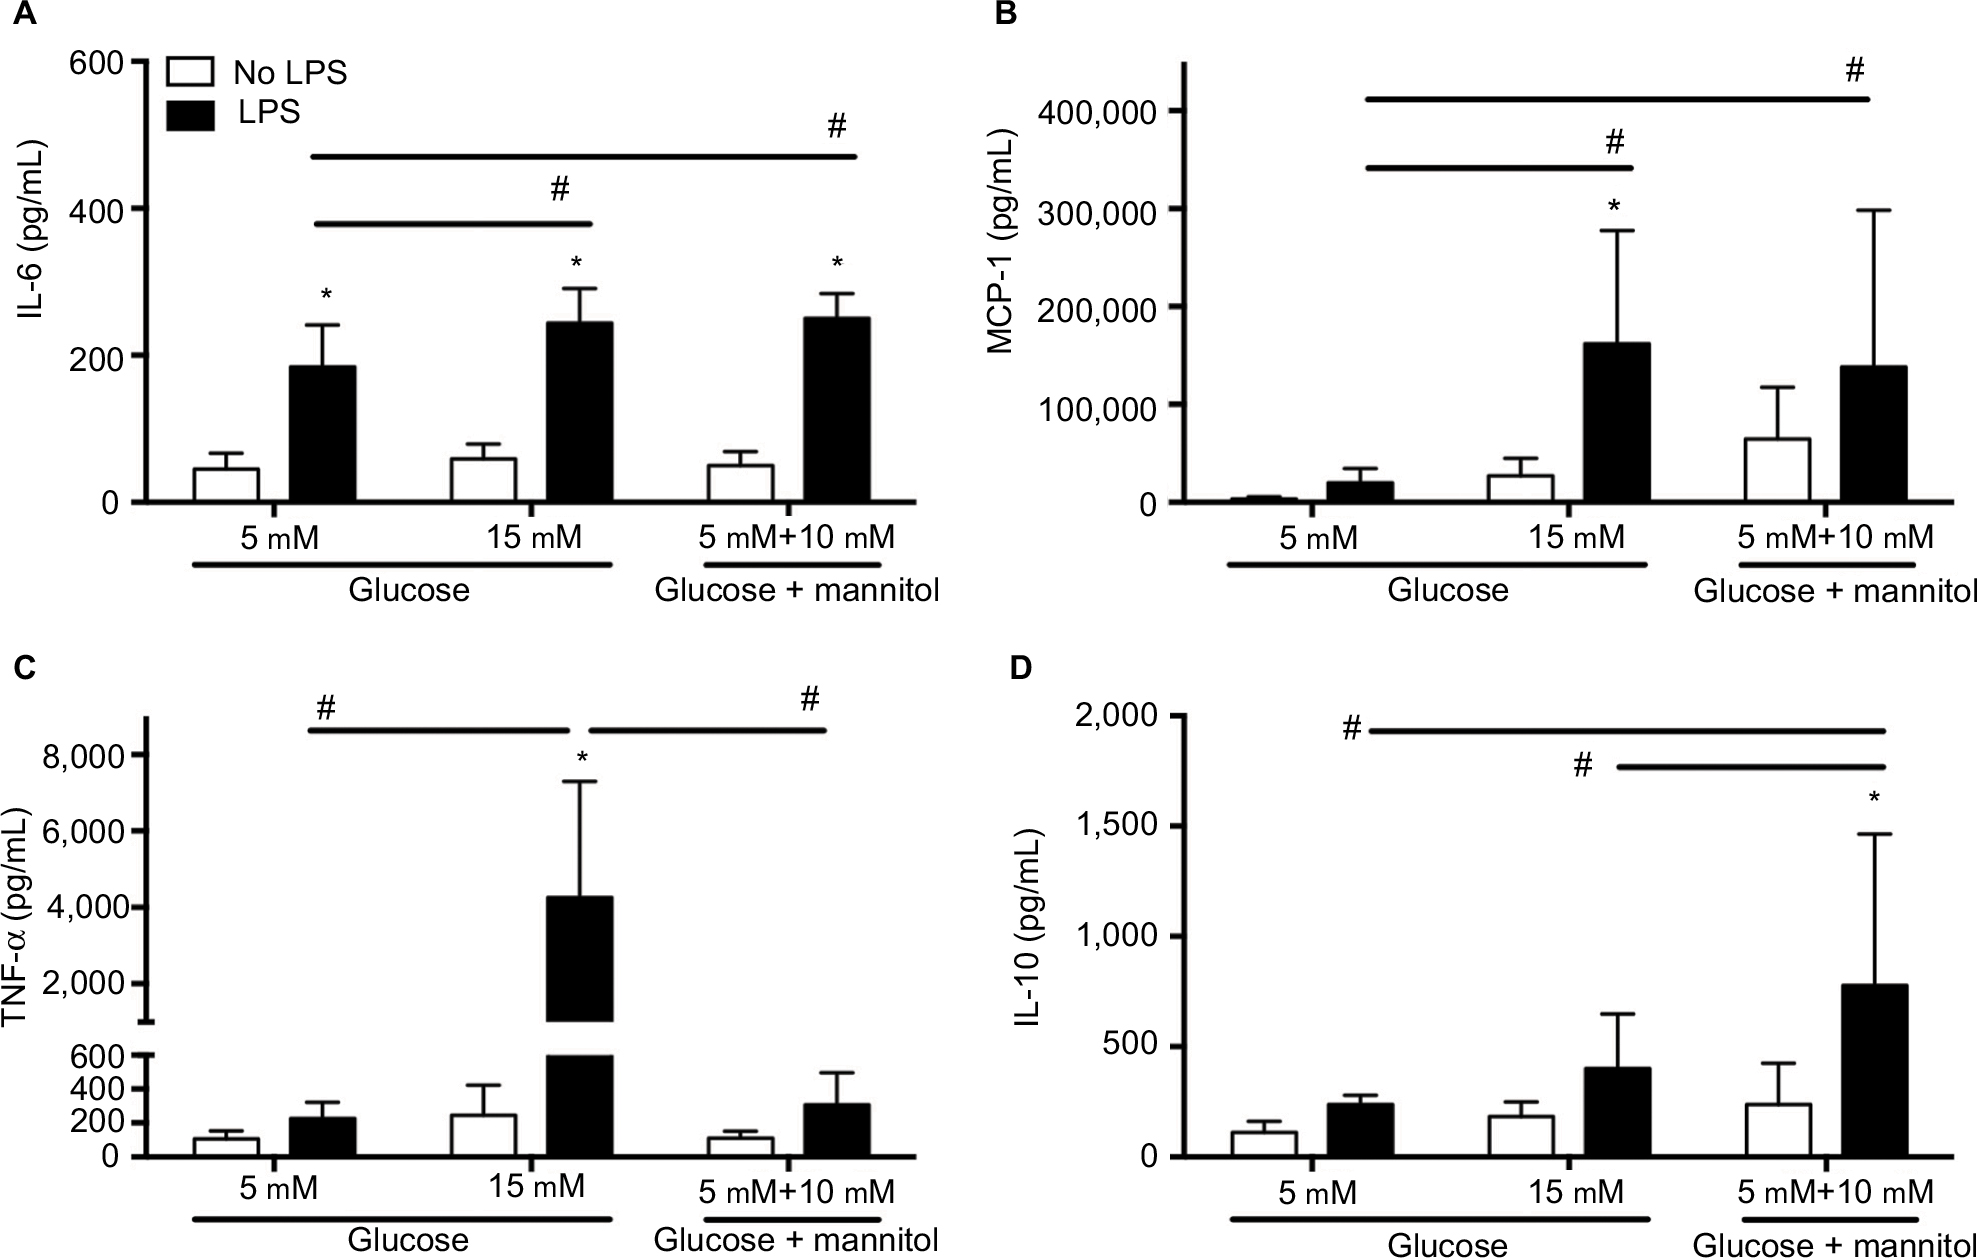 | Figure 2 Cytokine concentration in THP-1 macrophages under normal glucose (5 mM), high glucose (15 mM), or mannitol conditions. Notes: Quantification of IL-6 (A), MCP-1 (B), TNF-α (C), and IL-10 (D) after stimulation with LPS or without any stimulation after 24 hours. N = 11–18. *P < 0.05 vs. respective no LPS group. #P < 0.05 between groups, by two-way ANOVA followed by Bonferroni post hoc test. Abbreviations: IL, interleukin; MCP, monocyte chemoattractant protein; TNF, tumor necrosis factor; LPS, lipopolysaccharide; ANOVA, analysis of variance. |
In high glucose (15 mM, 26,976 ± 18,100 pg/mL) conditions without an LPS challenge, the MCP-1 concentration was not different compared to the glucose control (5 mM, 3,315 ± 2,417 pg/mL) or the mannitol control (64,332 ± 53,031 pg/mL, Figure 2B). After LPS stimulation, the concentration of MCP-1 was increased compared to the non-stimulated groups in high glucose only (162,016 ± 115,733 pg/mL vs. 26,976 ± 18,100 pg/mL), and no differences were observed in normal glucose (20,001 ± 14,696 pg/mL vs. 3,315 ± 2,417 pg/mL) or mannitol group (138,127 ± 160,313 pg/mL vs. 64,332 ± 53,031 pg/mL, Figure 2A). In high glucose (15 mM) + LPS (162,016 ± 115,733 pg/mL) or mannitol + LPS (138,127 ± 160,313 pg/mL), the MCP-1 concentration was significantly higher compared to the normal glucose control (5 mM) + LPS (20,001 ± 14,696 pg/mL, Figure 2B). The concentration of MCP-1 was not different in high glucose (15 mM) + LPS (162,016 ± 115,733 pg/mL) vs. mannitol + LPS group (138,127 ± 160,313 pg/mL, Figure 2B).
In high glucose (15 mM, 245.3 ± 178.0 pg/mL) conditions without an LPS challenge, the TNF-α concentration was not different compared to the glucose control (5 mM, 105.9 ± 47.24 pg/mL) or the mannitol control (110.3 ± 189.1 pg/mL, Figure 2C). After LPS stimulation, the concentration of TNF-α was increased compared to the non-stimulated groups in high glucose only (4,259 ± 3,038 pg/mL vs. 245.3 ± 178.0 pg/mL), and no differences were observed in normal glucose or mannitol group (Figure 2C). In high glucose (15 mM) + LPS (4,259 ± 3,038 pg/mL), the TNF-α concentration was significantly higher compared to the normal glucose control (5 mM) + LPS (2,26.9 ± 94.80 pg/mL) or mannitol + LPS control group (306.8 ± 189.1 pg/mL, Figure 2C).
In high glucose (15 mM, 182.4 ± 66.05 pg/mL) conditions without an LPS challenge, the IL-10 concentration was not different compared to the glucose control (5 mM, 109.7 ± 51.56 pg/mL) or the mannitol control (236.7 ± 188.7 pg/mL, Figure 2D). After LPS stimulation, the concentration of IL-10 was increased compared to the non-stimulated groups in mannitol control only (776.7 ± 687.9 pg/mL vs. 236.7 ± 188.7 pg/mL), and no differences were observed in high glucose (400.6 ± 247.6 pg/mL vs. 182.4 ± 66.05 pg/mL) or normal glucose group (237.2 ± 42.59 pg/mL vs. 109.7 ± 51.56 pg/mL, Figure 2D). In high glucose (15 mM) + LPS (400.6 ± 247.6 pg/mL), the IL-10 concentration was not different compared to the normal glucose control (5 mM) + LPS (237.2 ± 42.59 pg/mL, Figure 2D). The concentration of IL-10 was significantly higher in the mannitol control + LPS (776.7 ± 687.9 pg/mL) compared to the high glucose (15 mM) + LPS (400.6 ± 247.6 pg/mL) and normal glucose (5 mM) + LPS groups (237.2 ± 42.59 pg/mL, Figure 2D). The inconsistency of the findings in the mannitol and high glucose groups could be due to an unspecific effect, but an osmotic vs. metabolic effect cannot be ruled out.
TNF-α production in THP-1 cells exposed to recombinant IL-10
The production of TNF-α was measured in cells that were challenged with LPS or LPS + IL-10, or received no stimulation at 6 hours of incubation. Without any stimulation, macrophages cultured in high glucose conditions (15 mM, 522.6 ± 232.9 pg/mL) displayed a higher concentration of TNF-α compared to the normal glucose (5 mM, 137.2 ± 74.78 pg/mL) or osmotic control groups (173.9 ± 60.58 pg/mL, Figure 3). There were no differences in the concentration of TNF-α between the normal glucose (5 mM) and the osmotic control groups (Figure 3). After LPS stimulation, the concentration of TNF-α was increased compared to the non-stimulated groups in normal glucose (254.0 ± 106.0 pg/mL vs. 137.2 ± 74.78 pg/mL), high glucose (901.1 ± 167.9 pg/mL vs. 522.6 ± 232.9 pg/mL), and the osmotic control (286.6 ± 96.42 pg/mL vs. 173.9 ± 60.58 pg/mL, Figure 3).
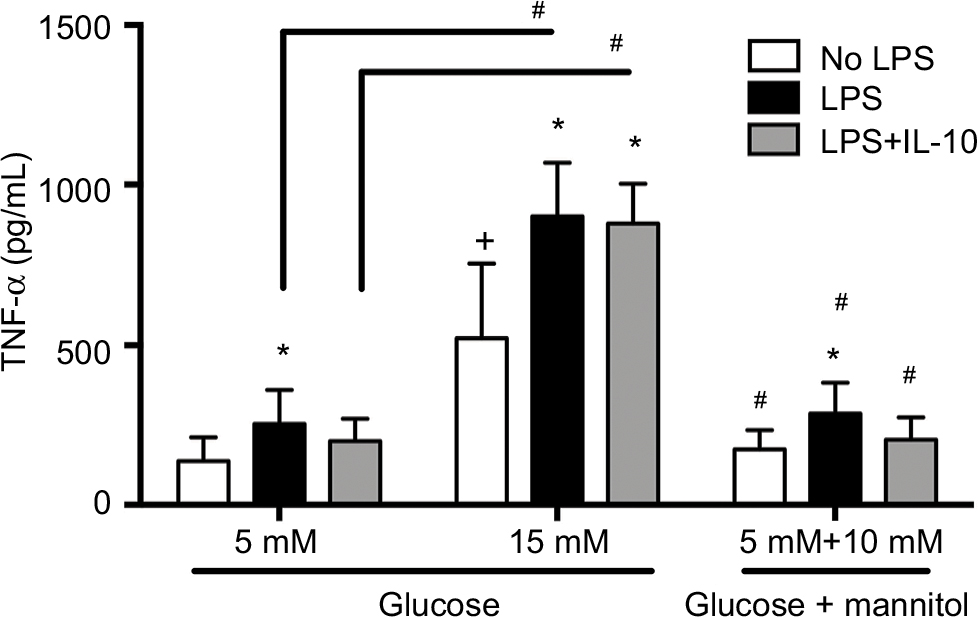 | Figure 3 TNF-α protein concentration in THP-1 macrophages under normal glucose (5 mM), high glucose (15 mM), or mannitol (10 mM) conditions. Notes: Quantification of TNF-α 6 hours after LPS stimulation, LPS + IL-10 stimulation, or no stimulation. N = 13 – 16. *P < 0.05 vs. respective no LPS group. +P < 0.05 vs. 5 mM no LPS. #P < 0.05 between connecting lines or vs. the corresponding 15 mM groups, by two-way ANOVA followed by Bonferroni post hoc test. Abbreviations: TNF, tumor necrosis factor; LPS, lipopolysaccharide; IL, interleukin; ANOVA, analysis of variance. |
Similarly, macrophages cultured in high glucose conditions (15 mM) + LPS (901.1 ± 167.9 pg/mL) displayed a higher concentration of TNF-α compared to the normal glucose (5 mM) + LPS (254.0 ± 106.0 pg/mL) or osmotic control + LPS groups (286.6 ± 96.42 pg/mL, Figure 3). This pattern was also seen after the LPS stimulation and after the concomitant addition of LPS + IL-10. Macrophages cultured in high glucose conditions (15 mM) + LPS + IL-10 (878.0 ± 124.5 pg/mL) displayed a higher concentration of TNF-α compared to the normal glucose (5 mM) + LPS + IL-10 (200.1 ± 69.70 pg/mL) or osmotic control + LPS + IL-10 groups (204.4 ± 69.44 pg/mL, Figure 3). However, the addition of LPS + IL-10 did not promote any changes in TNF-α concentration compared to the LPS-stimulated group (without IL-10) in any of the studied conditions, high glucose, normal glucose, or mannitol control groups. Interestingly, macrophages cultured in high glucose conditions (15 mM) + LPS + IL-10 (878.0 ± 124.5 pg/mL) displayed a higher concentration of TNF-α compared to the non-stimulated macrophages cultured in high glucose conditions (15 mM, 522.6 ± 232.9 pg/mL). However, TNF-α concentration did not differ between LPS + IL-10 and non-stimulated groups in normal glucose (5 mM) or mannitol control (Figure 3).
Discussion
The major findings of our study are as follows: 1) THP-1 macrophages exposed to a high glucose environment in vitro respond similarly to human primary macrophages exposed to high glucose conditions in vitro, and resemble a primed phenotype; 2) THP-1 macrophages exposed to high glucose and to an LPS challenge adopt an exacerbated pro-inflammatory phenotype that is in accordance with the phenotype of macrophages found in diabetic foot ulcers or other tissues (pancreas, adipose tissue, muscle, etc.) in patients with diabetes.
When we studied the response of THP-1 macrophages exposed to high glucose without any other stimulation, we found minimal changes in terms of cytokine protein production. We observed that high glucose (15 mM) did not change the concentration of IL-6 or TNF-α, as it has been shown in human primary macrophages under high glucose conditions.11,12 Some of these studies used higher concentrations of glucose, 2511 and 15 mM,12 for IL-6 and TNF-α production, respectively, which suggests that a high level of glucose, such as those observed in patients with noncontrolled glycemia, is not a sufficient stimulus to induce a clear macrophage overproduction of these factors. It is noteworthy to point out that for these sets of experiments, we noticed that when THP-1 macrophages were exposed to 15 mM glucose, TNF-α concentration (245.3 ± 53.7 pg/mL) increased approximately twofold when compared to normal glucose exposure (5 mM, 105.9 ± 16.7 pg/mL). However, this change was not statistically significant (two-way ANOVA plus Bonferroni multiple comparison test). In our other set of experiments (IL-10 anti-inflammatory tolerance studies), we found an approximately fourfold increase in TNF-α from THP-1 macrophages under high glucose (522.6 ± 64.6 pg/mL) when compared to TNF-α concentration from THP-1 macrophages exposed to normal glucose conditions (137.2 ± 19.3 pg/mL), in which we found a statistically significant difference (P < 0.05, two-way ANOVA plus Bonferroni multiple comparison test), and this effect was not observed in the mannitol control group. These data reflect the variability that these studies entail under our experimental conditions. Others have observed similar variable results in human primary macrophages exposed to high glucose regarding IL-10 production.11,12 We did not observe any change in IL-10 concentration under 15 mM high glucose condition. Similarly, we did not find any changes in the mRNA expression of COX-2, TLR4, or SR-A in THP-1 macrophages in high glucose (15 mM). These findings are in contrast with the previous observations in which higher level of glucose (27.5 mM) produced an increase in the expression of SR-A mRNA in human primary macrophages.13 All together, these mixed results could reflect that our system does not fully mimic all aspects of macrophage function (without LPS stimulation) in diabetes. Alternatively, the high variability in the response of macrophages to glucose might be indicative of changes in subgroups of macrophages, which may display a general priming effect manifested in a subtle modulation of some genes related to their immune capabilities; in our case, this is reflected in TNF-α.
We consistently observed an increase in TNF-α when exposed to high glucose (Figures 2 and 3); the fact that this increase did not reach a statistical significance in Figure 2 but it did in Figure 3 is consistent with a priming effect, rather than with a strong or clear pro-inflammatory phenotype. Previous studies suggest that a chronic subclinical inflammatory state (a primed system) could be the cause (and, therefore, a predictor) of the development of type 2 diabetes due to insulin resistance.29 Interestingly, macrophages and TNF-α have been described as prominent effectors in the development of insulin resistance and obesity in the context of diabetes.30–32 In fact, macrophages with a pro-inflammatory phenotype (produce high levels of IL-8) are also found to infiltrate pancreatic islets in patients with diabetes.33 Furthermore, it has been shown that patients with diabetic neuropathy and high TNF-α plasma levels or high TNF-α (or inducible nitric oxide synthase) expression in circulating macrophages have higher risk of developing painful diabetic neuropathy.34 TNF-α (mRNA) is also increased in muscles from insulin-resistant diabetic patients and in obese individuals with diabetes.35
Obesity and cardiovascular disease are common comorbidities in diabetes. Interestingly, obese individuals have macrophage infiltration into their subcutaneous adipose tissue, and the degree of infiltration is positively correlated to their body mass index.36 These macrophages are, presumably, the major source of TNF-α production observed in adipose tissue under obese conditions, based on mouse studies.36 Consistent with those studies, macrophages expressing high levels of TNF-α and IL-6 have been found in human atheromas,37–39 which could produce vascular impairments and contribute to the generation of painful diabetic neuropathy. Our findings suggest that further complications could be expected in obese patients under hyperglycemic conditions, and our in vitro approach could be useful to identify potential therapeutic targets in macrophages.
To further investigate whether the exposure to high glucose resulted in a priming effect in THP-1 macrophages, we decided to add a strong pro-inflammatory stimulus to our preparation using LPS. In fact, we found that the addition of LPS to THP-1 macrophages exposed to high glucose (15 mM) induced an enhanced production of IL-6 and MCP-1. These effects do not seem to be dependent on the molecular interaction of glucose, but rather on the osmotic pressure changes induced by its high concentration since the mannitol control group displayed similar effects in the concentration of these cytokines. These findings are interesting because MCP-1 is a strong chemoattractant for macrophages40 and IL-6 promotes the differentiation of naïve T-cells into CD4+ T helper cells and regulatory T cells.41,42 In accordance with our findings, the serum levels of MCP-140 and IL-643,44 in patients with diabetic foot ulcers are higher than in patients with diabetes without foot ulcers. Similarly, increased serum levels of MCP-1 are correlated with the degree of obesity in patients with type 2 diabetes vs. lean, healthy patients,45 and increased levels of IL-6 are found in adipose tissues of obese subjects, and they are also positively related to insulin resistance in humans.46
When we studied the production of TNF-α, we found that LPS induced a higher production of this cytokine in THP-1 macrophages exposed to high glucose (15 mM). Since we did not observe any changes in the mannitol control, we can conclude that the osmotic pressure induced by glucose is not the mechanism by which high glucose produces this exacerbated pro-inflammatory effect. This is consistent with our findings on TNF-α production in the absence of LPS stimulation, which suggest that high glucose produces intracellular molecular changes that induce a priming effect in THP-1 macrophages independently of its osmotic pressure effects.
We further investigated the effects of high glucose on TNF-α production in a different paradigm. It has been described that in whole-blood cultures under normal glucose conditions the production of TNF-α induced by LPS is reduced by recombinant IL-10 in vitro.1 However, this anti-inflammatory effect of IL-10 is not observed in whole-blood cultures from patients with diabetes or in an immortalized mouse macrophage cell line (hyporesponsiveness or tolerance to IL-10 anti-inflammatory effects).1 As described in the “Results” section, we observed that IL-10 blocked the increase of TNF-α concentration induced by LPS in THP-1 macrophages under normal glucose (5 mM) conditions, but IL-10 failed to reduce TNF-α under high glucose (15 mM) conditions. We confirmed that these effects were not due to the changes in osmotic pressure induced by glucose. These data further confirm that high glucose induces a priming effect in THP-1 macrophages that results in an exacerbated pro-inflammatory response when exposed to an inflammatory stimulation manifested as an increase in TNF-α (but also MCP-1 and IL-6) production, and a resistance to IL-10 anti-inflammatory effects.
Some of the major complications of diabetes are peripheral painful diabetic neuropathy (or not painful) and foot ulcers.47 The delayed wound healing process suffered by patients with diabetes is the major cause of amputations in this population.3 Macrophages are more abundant in chronic diabetic wounds when compared to acute wounds.48 These macrophages infiltrate the wound edge in these chronic ulcers; therefore, they are directly exposed to the environment, including bacteria. In fact, chronic diabetic foot ulcers contain LPS and the antimicrobial molecule S100A8/A9.49 The abundant presence of macrophages and their interaction with external pathogens provide a perfect medium for further activation, yet they are unable to promote the proliferative phase that is necessary for a proper wound healing, suggesting that these macrophages are under an unpaired persistent pro-inflammatory phenotype. Our studies using LPS, a strong challenge that is similar to the challenge imposed by bacteria, are in accordance with these findings in diabetic foot ulcers. In fact, these infiltrating macrophages in chronic diabetic wounds have been shown to have a clear M1 pro-inflammatory phenotype, with increased expression of M1-related genes, including TNF-α and IL-1β, and lower expression of M2-related genes, including CD206, TGF-β, and IL-10.18 Similarly, patients with diabetic foot ulcers display higher levels of serum TNF-α and IL-6 (and other acute-phase proteins) compared to patients with diabetes without foot ulcers.43,44 These findings are in accordance with local high numbers of macrophages with higher expression of TNF-α protein found in chronic venous leg ulcers.48,50 The pivotal role of macrophages and TNF-α in the impairment of tissue repair in diabetes has further been demonstrated in rodents.51,52 In small clinical studies, it has been shown that infiltrating macrophages in diabetic foot ulcers were higher in non-healed wounds than in healed wounds after transdermal continuous oxygen therapy16 or noncontact low-frequency ultrasound.17 In those pilot studies, some pro-inflammatory cytokines (IL-6, TNF-α, IL-8, or IL-1β) in the wound fluid were reduced in relation to the healing process in the treated and healed diabetic foot ulcers, while these cytokines remained increased in the non-healed ulcers. 16,17 All these data together show that our approach shares multiple aspects observed in macrophages that infiltrate diabetic wounds.
We conclude that the use of in vitro THP-1 macrophages with clinically relevant high glucose conditions is an approach that mimics the pro-inflammatory phenotype of macrophages found in patients with diabetes (i.e. diabetic ulcers, adipose tissue, and liver), and interestingly painful diabetes neuropathy. We have identified that in our system TNF-α seems to be a consistent and clinically relevant biomarker. Therefore, our approach could be useful to further study the molecular mechanisms by which glucose promotes these immunomodulatory effects that result in diabetic complications, such as painful diabetic neuropathy, but also conditions such as wound healing delay, obesity, cardiovascular complications, or insulin resistance. In our opinion, our approach could be used as an additional tool to find novel therapeutic approaches to prevent the development of diabetic complications using macrophages as potential cellular targets.
Acknowledgment
The authors would like to acknowledge the 2016 South Carolina-Institutional Development Award (IDeA) Networks of Biomedical Research Excellence (SC-INBRE) Summer Fellows Program (RG, EAR-S) and National Institutes of Health – The National Institute of General Medical Sciences (NIH/NIGMS) R15GM109333 (EAR-S).
Disclosure
The authors report no conflicts of interest in this work.
References
Barry JC, Shakibakho S, Durrer C, et al. Hyporesponsiveness to the anti-inflammatory action of interleukin-10 in type 2 diabetes. Sci Rep. 2016;6:21244. | ||
Mirza RE, Fang MM, Novak ML, et al. Macrophage PPARgamma and impaired wound healing in type 2 diabetes. J Pathol. 2015;236(4):433–444. | ||
Callaghan BC, Cheng HT, Stables CL, Smith AL, Feldman EL. Diabetic neuropathy: clinical manifestations and current treatments. Lancet Neurol. 2012;11(6):521–534. | ||
Mirza R, Koh TJ. Dysregulation of monocyte/macrophage phenotype in wounds of diabetic mice. Cytokine. 2011;56(2):256–264. | ||
Koh TJ, DiPietro LA. Inflammation and wound healing: the role of the macrophage. Expert Rev Mol Med. 2011;13:e23. | ||
Melton DW, McManus LM, Gelfond JA, Shireman PK. Temporal phenotypic features distinguish polarized macrophages in vitro. Autoimmunity. 2015;48(3):161–176. | ||
Mantovani A, Biswas SK, Galdiero MR, Sica A, Locati M. Macrophage plasticity and polarization in tissue repair and remodelling. J Pathol. 2013;229(2):176–185. | ||
Mosser DM. The many faces of macrophage activation. J Leukoc Biol. 2003;73(2):209–212. | ||
Witherel CE, Graney PL, Freytes DO, Weingarten MS, Spiller KL. Response of human macrophages to wound matrices in vitro. Wound Repair Regen. 2016;24(3):514–524. | ||
Meshkani R, Vakili S. Tissue resident macrophages: key players in the pathogenesis of type 2 diabetes and its complications. Clin Chim Acta. 2016;462:77–89. | ||
Lachmandas E, Vrieling F, Wilson LG, et al. The effect of hyperglycaemia on in vitro cytokine production and macrophage infection with Mycobacterium tuberculosis. PLoS One. 2015;10(2):e0117941. | ||
Torres-Castro I, Arroyo-Camarena UD, Martinez-Reyes CP, et al. Human monocytes and macrophages undergo M1-type inflammatory polarization in response to high levels of glucose. Immunol Lett. 2016;176:81–89. | ||
Fukuhara-Takaki K, Sakai M, Sakamoto Y, Takeya M, Horiuchi S. Expression of class A scavenger receptor is enhanced by high glucose in vitro and under diabetic conditions in vivo: one mechanism for an increased rate of atherosclerosis in diabetes. J Biol Chem. 2005;280(5):3355–3364. | ||
Dasu MR, Devaraj S, Park S, Jialal I. Increased toll-like receptor (TLR) activation and TLR ligands in recently diagnosed type 2 diabetic subjects. Diabetes Care. 2010;33(4):861–868. | ||
Devaraj S, Dasu MR, Rockwood J, Winter W, Griffen SC, Jialal I. Increased toll-like receptor (TLR) 2 and TLR4 expression in monocytes from patients with type 1 diabetes: further evidence of a proinflammatory state. J Clin Endocrinol Metab. 2008;93(2):578–583. | ||
Driver VR, Yao M, Kantarci A, Gu G, Park N, Hasturk H. A prospective, randomized clinical study evaluating the effect of transdermal continuous oxygen therapy on biological processes and foot ulcer healing in persons with diabetes mellitus. Ostomy Wound Manage. 2013;59(11):19–26. | ||
Yao M, Hasturk H, Kantarci A, et al. A pilot study evaluating non-contact low-frequency ultrasound and underlying molecular mechanism on diabetic foot ulcers. Int Wound J. 2014;11(6):586–593. | ||
Mirza RE, Fang MM, Ennis WJ, Koh TJ. Blocking interleukin-1beta induces a healing-associated wound macrophage phenotype and improves healing in type 2 diabetes. Diabetes. 2013;62(7):2579–2587. | ||
Devaraj S, Jialal I. Increased secretion of IP-10 from monocytes under hyperglycemia is via the TLR2 and TLR4 pathway. Cytokine. 2009;47(1):6–10. | ||
Li L, Sawamura T, Renier G. Glucose enhances human macrophage LOX-1 expression: role for LOX-1 in glucose-induced macrophage foam cell formation. Circ Res. 2004;94(7):892–901. | ||
Landry RP, Jacobs VL, Romero-Sandoval EA, DeLeo JA. Propentofylline, a CNS glial modulator does not decrease pain in post-herpetic neuralgia patients: in vitro evidence for differential responses in human and rodent microglia and macrophages. Exp Neurol. 2012;234(2):340–350. | ||
Shanmugam N, Gaw Gonzalo IT, Natarajan R. Molecular mechanisms of high glucose-induced cyclooxygenase-2 expression in monocytes. Diabetes. 2004;53(3):795–802. | ||
Suzuki T, Nakajima K, Yamamoto A, Suzuki K, Yamamoto K, Yamanaka H. Binding of metallothionein to rat spermatozoa. Tohoku J Exp Med. 1994;174(1):19–30. | ||
Liao D, Wang X, Li M, Lin PH, Yao Q, Chen C. Human protein S inhibits the uptake of AcLDL and expression of SR-A through Mer receptor tyrosine kinase in human macrophages. Blood. 2009;113(1):165–174. | ||
Brown M, Hughes KR, Moossavi S, Robins A, Mahida YR. Toll-like receptor expression in crypt epithelial cells, putative stem cells and intestinal myofibroblasts isolated from controls and patients with inflammatory bowel disease. Clin Exp Immunol. 2014;178(1):28–39. | ||
Bernal L, Alvarado-Vazquez A, Ferreira DW, et al. Evaluation of a nanotechnology-based approach to induce gene-expression in human THP-1 macrophages under inflammatory conditions. Immunobiology. 2017;222(2):399–408. | ||
Alvarado-Vazquez PA, Bernal L, Paige CA, et al. Macrophage-specific nanotechnology-driven CD163 overexpression in human macrophages results in an M2 phenotype under inflammatory conditions. Immunobiology. 2017;222(8–9):900–912. | ||
Dasu MR, Devaraj S, Zhao L, Hwang DH, Jialal I. High glucose induces toll-like receptor expression in human monocytes: mechanism of activation. Diabetes. 2008;57(11):3090–3098. | ||
Festa A, D’Agostino R Jr, Tracy RP, Haffner SM; Insulin Resistance Atherosclerosis Study. Elevated levels of acute-phase proteins and plasminogen activator inhibitor-1 predict the development of type 2 diabetes: the insulin resistance atherosclerosis study. Diabetes. 2002;51(4):1131–1137. | ||
Shoelson SE, Lee J, Goldfine AB. Inflammation and insulin resistance. J Clin Invest. 2006;116(7):1793–1801. | ||
Hotamisligil GS. Inflammatory pathways and insulin action. Int J Obes Relat Metab Disord. 2003;27 Suppl 3:S53–S55. | ||
Moller DE. Potential role of TNF-alpha in the pathogenesis of insulin resistance and type 2 diabetes. Trends Endocrinol Metab. 2000;11(6):212–217. | ||
Ehses JA, Perren A, Eppler E, et al. Increased number of islet-associated macrophages in type 2 diabetes. Diabetes. 2007;56(9):2356–2370. | ||
Purwata TE. High TNF-alpha plasma levels and macrophages iNOS and TNF-alpha expression as risk factors for painful diabetic neuropathy. J Pain Res. 2011;4:169–175. | ||
Saghizadeh M, Ong JM, Garvey WT, Henry RR, Kern PA. The expression of TNF alpha by human muscle. Relationship to insulin resistance. J Clin Invest. 1996;97(4):1111–1116. | ||
Weisberg SP, McCann D, Desai M, Rosenbaum M, Leibel RL, Ferrante AW Jr. Obesity is associated with macrophage accumulation in adipose tissue. J Clin Invest. 2003;112(12):1796–1808. | ||
Barath P, Fishbein MC, Cao J, Berenson J, Helfant RH, Forrester JS. Detection and localization of tumor necrosis factor in human atheroma. Am J Cardiol. 1990;65(5):297–302. | ||
Seino Y, Ikeda U, Ikeda M, et al. Interleukin 6 gene transcripts are expressed in human atherosclerotic lesions. Cytokine. 1994;6(1):87–91. | ||
Rus HG, Vlaicu R, Niculescu F. Interleukin-6 and interleukin-8 protein and gene expression in human arterial atherosclerotic wall. Atherosclerosis. 1996;127(2):263–271. | ||
Wood S, Jayaraman V, Huelsmann EJ, et al. Pro-inflammatory chemokine CCL2 (MCP-1) promotes healing in diabetic wounds by restoring the macrophage response. PLoS One. 2014;9(3):e91574. | ||
Ferreira RC, Rainbow DB, Rubio Garcia A, et al. Human IL-6RhiTIGIT– CD4+CD127lowCD25+ T cells display potent in vitro suppressive capacity and a distinct Th17 profile. Clin Immunol. 2017;179:25–39. | ||
Xu E, Pereira MMA, Karakasilioti I, et al. Temporal and tissue-specific requirements for T-lymphocyte IL-6 signalling in obesity-associated inflammation and insulin resistance. Nat Commun. 2017;8:14803. | ||
Tecilazich F, Dinh T, Pradhan-Nabzdyk L, et al. Role of endothelial progenitor cells and inflammatory cytokines in healing of diabetic foot ulcers. PLoS One. 2013;8(12):e83314. | ||
Weigelt C, Rose B, Poschen U, et al. Immune mediators in patients with acute diabetic foot syndrome. Diabetes Care. 2009;32(8):1491–1496. | ||
Janowska J, Chudek J, Olszanecka-Glinianowicz M, Semik-Grabarczyk E, Zahorska-Markiewicz B. Interdependencies among selected pro-inflammatory markers of endothelial dysfunction, C-peptide, anti-inflammatory interleukin-10 and glucose metabolism disturbance in obese women. Int J Med Sci. 2016;13(7):490–499. | ||
Kern PA, Ranganathan S, Li C, Wood L, Ranganathan G. Adipose tissue tumor necrosis factor and interleukin-6 expression in human obesity and insulin resistance. Am J Physiol Endocrinol Metab. 2001;280(5):E745–E751. | ||
Ndip A, Ebah L, Mbako A. Neuropathic diabetic foot ulcers – evidence-to-practice. Int J Gen Med. 2012;5:129–134. | ||
Loots MA, Lamme EN, Zeegelaar J, Mekkes JR, Bos JD, Middelkoop E. Differences in cellular infiltrate and extracellular matrix of chronic diabetic and venous ulcers versus acute wounds. J Invest Dermatol. 1998;111(5):850–857. | ||
Trostrup H, Holstein P, Christophersen L, et al. S100A8/A9 is an important host defence mediator in neuropathic foot ulcers in patients with type 2 diabetes mellitus. Arch Dermatol Res. 2016;308(5):347–355. | ||
Sindrilaru A, Peters T, Wieschalka S, et al. An unrestrained proinflammatory M1 macrophage population induced by iron impairs wound healing in humans and mice. J Clin Invest. 2011;121(3):985–997. | ||
Khanna S, Biswas S, Shang Y, et al. Macrophage dysfunction impairs resolution of inflammation in the wounds of diabetic mice. PLoS One. 2010;5(3):e9539. | ||
Goren I, Muller E, Schiefelbein D, et al. Systemic anti-TNFalpha treatment restores diabetes-impaired skin repair in ob/ob mice by inactivation of macrophages. J Invest Dermatol. 2007;127(9):2259–2267. |
 © 2018 The Author(s). This work is published and licensed by Dove Medical Press Limited. The full terms of this license are available at https://www.dovepress.com/terms.php and incorporate the Creative Commons Attribution - Non Commercial (unported, v3.0) License.
By accessing the work you hereby accept the Terms. Non-commercial uses of the work are permitted without any further permission from Dove Medical Press Limited, provided the work is properly attributed. For permission for commercial use of this work, please see paragraphs 4.2 and 5 of our Terms.
© 2018 The Author(s). This work is published and licensed by Dove Medical Press Limited. The full terms of this license are available at https://www.dovepress.com/terms.php and incorporate the Creative Commons Attribution - Non Commercial (unported, v3.0) License.
By accessing the work you hereby accept the Terms. Non-commercial uses of the work are permitted without any further permission from Dove Medical Press Limited, provided the work is properly attributed. For permission for commercial use of this work, please see paragraphs 4.2 and 5 of our Terms.