")
Back to Journals » International Journal of General Medicine » Volume 14
High DSCC1 Level Predicts Poor Prognosis of Lung Adenocarcinoma
Authors Chang S , Zhu Y, Xi Y, Gao F, Lu J, Dong L, Ma C, Li H
Received 15 July 2021
Accepted for publication 20 August 2021
Published 20 October 2021 Volume 2021:14 Pages 6961—6974
DOI https://doi.org/10.2147/IJGM.S329482
Checked for plagiarism Yes
Review by Single anonymous peer review
Peer reviewer comments 2
Editor who approved publication: Dr Scott Fraser
Sisi Chang,1 Yahui Zhu,2 Yutan Xi,2 Fuyan Gao,2 Juanjuan Lu,2 Liang Dong,1 Chunzheng Ma,1 Honglin Li1
1Department of Oncology, Henan Provincial Hospital of Traditional Chinese Medicine (The Second Affiliated Hospital of Henan University of Traditional Chinese Medicine), Zhengzhou, Henan Province, People’s Republic of China; 2Department of Oncology, Henan University of Traditional Chinese Medicine, Zhengzhou, Henan Province, People’s Republic of China
Correspondence: Chunzheng Ma; Honglin Li
Henan Provincial Hospital of Traditional Chinese Medicine (The Second Affiliated Hospital of Henan University of Traditional Chinese Medicine), Zhengzhou, Henan Province, People’s Republic of China
Tel +86-18801611544
Email [email protected]; [email protected]
Purpose: To evaluate the role of DSCC1 in LUAD.
Patients and Methods: Based on TCGA and GTEx, the Wilcoxon rank-sum test was used to compare the expression differences of DSCC1 between the normal samples of GTEx combined TCGA and the unpaired tumor samples of TCGA, and to compare DSCC1 expression values between tumor tissues and paired normal LUAD tissues in the TCGA cohort. Kruskal–Wallis rank-sum test, Wilcoxon rank-sum test, and logistics regression were used to compare the relationship between the expression of DSCC1 and the clinicopathological parameters. The biological function of DSCC1 was annotated by GSEA and ssGSEA, while Kaplan–Meier and Cox regression analysis were used to evaluate the prognostic value of DSCC1. Furthermore, the time-dependent ROC curve was used to analyze the diagnostic efficacy of DSCC1 in LUAD.
Results: We downloaded the RNA-Seq data of 513 LUAD cases. The expression of DSCC1 was significantly correlated with T stage (OR = 1.04(1.02– 1.07), P = 0.002), pathological stage (OR=1.03 (1.01– 1.05), P = 0.008) and TP53 status (OR=1.10 (1.07– 1.14), P < 0.001). The high expression of DSCC1 was significantly correlated with DSS (HR=1.56 (1.07– 2.26), P = 0.021) and OS (HR=1.53 (1.14– 2.05), P = 0.004). Moreover, ROC curve analysis (AUC=0.845, CI (0.820-0.870)) indicated DSCC1 as a potential diagnostic molecule for LUAD. In the group with high DSCC1 expression phenotype, down-regulation of EGFR signal, reduction of IL-6 deprivation, cell cycle, and p53 signal pathway were significantly abundant. Spearman correlation analysis showed that the expression of DSCC1 was positively correlated with the infiltration of Th2 cells, T Helper cells.
Conclusion: Our results suggest that DSCC1 may be an important biomarker for the treatment of LUAD.
Keywords: DSCC1, LUAD, GSEA, prognosis, biomarker
Introduction
Lung cancer is one of the most common cancers and the main cause of cancer-related death.1 It is divided into two main subtypes: SCLC and NSCLC, accounting for 15 and 85% of all cases, respectively.2 LUAD is the most common histological type of NSCLC, found in more than 40% of patients.3,4 The incidence of LUAD has been steadily increasing.5 Over recent years, comprehensive treatments such as chemotherapy and targeted therapy have brought more possibilities to improve the prognosis of patients with LUAD.4 Conventional chemotherapy is effective in most cases; yet, it has serious side effects and can seriously affect patients’ quality of life. In addition, the effectiveness of molecular targeted therapeutic drugs is limited, and new targeted drugs tend to fail due to the development of drug resistance.6 For patients at advanced stages and those who cannot use targeted drugs, the survival rate is greatly reduced. At present, the treatment of advanced NSCLC is mainly based on immunotherapy of PD-1 or PD-L1 antibody, which can be used alone or in combination with chemotherapy;7 however, the remission rate is very low. Therefore, it is urgent to improve the prognosis, diagnosis, and treatment of patients with LUAD. Moreover, there is no effective biomarker to predict the adverse prognosis and treatment of LUAD.
DSCC1, also known as DCC1, is a component of selective replication factor c complex (RFC),8 which participates in the S phase of the cell cycle. In all eukaryotes, RFC is a complex composed of 1–5 subunits of RFC, ie, a large subunit, Rfc1, and four small subunits, Rfc2 to Rfc5. Previous studies have reported that RFC can load PCNA onto completely duplex DNA9,10 and unload PCNA.11,12 The alignment marker of chromosome transmission fidelity protein 18 (Ctf18) is RFC1.13,14 Sister chromatid cohesion requires using the RFC complex, in which the RFC1 subunit is substituted to form isoheptamer Ctf18-RFC complex.15,16 Its loader complex Ctf18-RFC contains Ctf18-DSCC1-Ctf8 modules, in which two non-RFC subunits include unique DSCC1 and CTF8 binding.17 Complex Ctf18-RFC, targeting PCNA, contributes to the activation of sister chromatid cohesion and replication of stress checkpoints.8 A previous study showed that Ctf18-RFC and double-stranded DNA bind to the same winglike helix domain on DSCC1.18 In addition, it had been reported that DSCC1 contains mitotic genes and could directly participate in the cell cycle.19 These processes suggested that DSCC1 had a critical role in DNA replication, which led us to think about its role in tumor proliferation. In breast cancer, colorectal cancer, and hepatocellular carcinoma, DSCC1 was highly expressed in tumor tissues and promoted the proliferation of tumor cells.8,13 However, the role of DSCC1 in LUAD still remains unclear.
In this study, we analyzed the expression of DSCC1 in LUAD based on TCGA data. The possible signal transduction pathways of DSCC1 in LUAD were analyzed by GSEA. The relationship between the expression of DSCC1 and immune cell infiltration in LUAD was analyzed by the ssGSEA method. Subsequently, we further analyzed the value of DSCC1 expression in evaluating the prognosis of LUAD.
Materials and Methods
Data Source and Preprocessing
We downloaded RNAseq data and clinical information in level 3HT Seq-FPKM format from the lung adenocarcinoma project in TCGA database (https://cancergenome.nih.gov). RNAseq data from cases with no or incomplete clinical information and from those follow-up for <30 days were discarded. The design and process of our study are shown in the flowchart (Figure 1), included data selection and exclusion. Among them, the RNAseq data in FPKM format were converted into TPM format for expression comparison between samples. In addition, we downloaded RNAseq data in TCGA and GTEx TPM format from UCSC XENA (https://xenabrowser.net/datapages/), which has been uniformly processed by the Toil process.20 The median of the expression level of DSCC1 was used as the cut-off value, and the tumor samples were divided into high expression group and low expression group. In this study, the clinical data of 513 patients with LUAD were collected, including T stage, N stage, M stage, pathological stage, primary treatment outcome, sex, race, smoking status, tumor status, TP53 status, and KARS status. Data on 57 cases of LUAD with paired normal lung tissues were also included.
Different Expression Gene in TCGA and GTEx
Based on TCGA and GTEx, we compared the expression of DSCC1 in different types of human cancers. In addition, the expression level of DSCC1 was compared between LUAD in TCGA and normal samples in GTEx combined with TCGA. We also compared the DSCC1 expression levels in LUAD and matched normal lung tissues in the TCGA cohort.
Gene Set Enrichment Analysis
Based on the gene expression matrix, GSEA was divided into high expression and low expression groups according to the median level. GSEA can analyze the difference in signal pathway enrichment between the two groups and infer phenotypes and signaling pathways that might be related to genes. In this study, we used the R package clusterProfiler for GSEA analysis and visualization. We analyzed the functions and signal pathways with significant differences between the high and low expression groups. Based on the default weighted enrichment statistical method, the procedure was repeated 1000 times for each analysis. FDR < 0.25 and a family‐wise error rate <0.05 were set for gene sets. Significant differences were demonstrated in the rich set of MSigDB (C2.all.v7.0.symbols.GMT) collection.
Immune Infiltration Analysis
According to the gene markers of 24 immune cells, ie, DCs, iDCs, aDCs, eosinophils, mast cells, macrophages, NKs, NK CD56dim cells, NK CD56bright cells, neutrophils, B cells, T cells, T helper cells, Th1, Th2, Tγδ, CD8+ T, Tcm, Tem, Tfh cells, Th17 cells, Treg cells, and cytotoxic cells, mentioned in the literature,21 the infiltration of 24 immune cells in the tumor was evaluated by ssGSEA method in GSVA software package,22 and the correlation between DSCC1 and relative infiltration abundance of immune cells was analyzed by Spearman correlation. Wilcoxon rank-sum test was used to analyze the differences in immunocyte infiltration between the DSCC1 high expression group and low expression. P-value <0.05 was considered statistically significant.
Statistical Analysis
R (v4.0.0) software was used for statistical analysis. Wilcoxon rank-sum test was used to compare the expression of DSCC1 normal samples of GTEx combined with TCGA and the expression of DSCC1 in tumor samples of TCGA. Wilcoxon rank-sum test also was used to compare values in DSCC1 expression between tumor tissues and paired normal LUAD tissues in the TCGA cohort. Then, we used the Kruskal–Wallis rank-sum test, Wilcoxon rank-sum test, and logistics regression methods to compare the relationship between the expression of DSCC1 and the clinicopathological parameters. Furthermore, we used Cox regression to analyze the prognostic factors of LUAD. The variables with P < 0.1 in the single-factor Cox regression were included in the multi-factor Cox regression. We also used the Kaplan–Meier method to evaluate the prognostic value of DSCC1 in LUAD. The primary endpoints of prognostic analysis was OS, and DSS. The primary endpoints of prognostic analysis was OS, and the secondary end point was DSS. Finally, ROC curve, AUC, and Uno’s C-index were identified to evaluate the predictive value of the gene for overall survival using the R package “survival ROC.23” P < 0.05 was considered statistically significant.
Results
Clinical Characteristics
As shown in Table 1, data on 513 primary tumors with clinical and gene expression data were downloaded from TCGA, including TNM stage, pathological stage, primary treatment outcome, sex, race, smoking status, tumor status, TP53 status, KARS status, and smoking age. In the subsequent correlation analysis, the expression level of DSCC1 was significantly correlated with T stage (P=0.002), N stage (P=0.005), M stage (P=0.048), pathological stage (P<0.001), primary treatment outcome (P=0.027), sex (P=0.004), smoking status (P=0.007) and TP53 status (P<0.001).
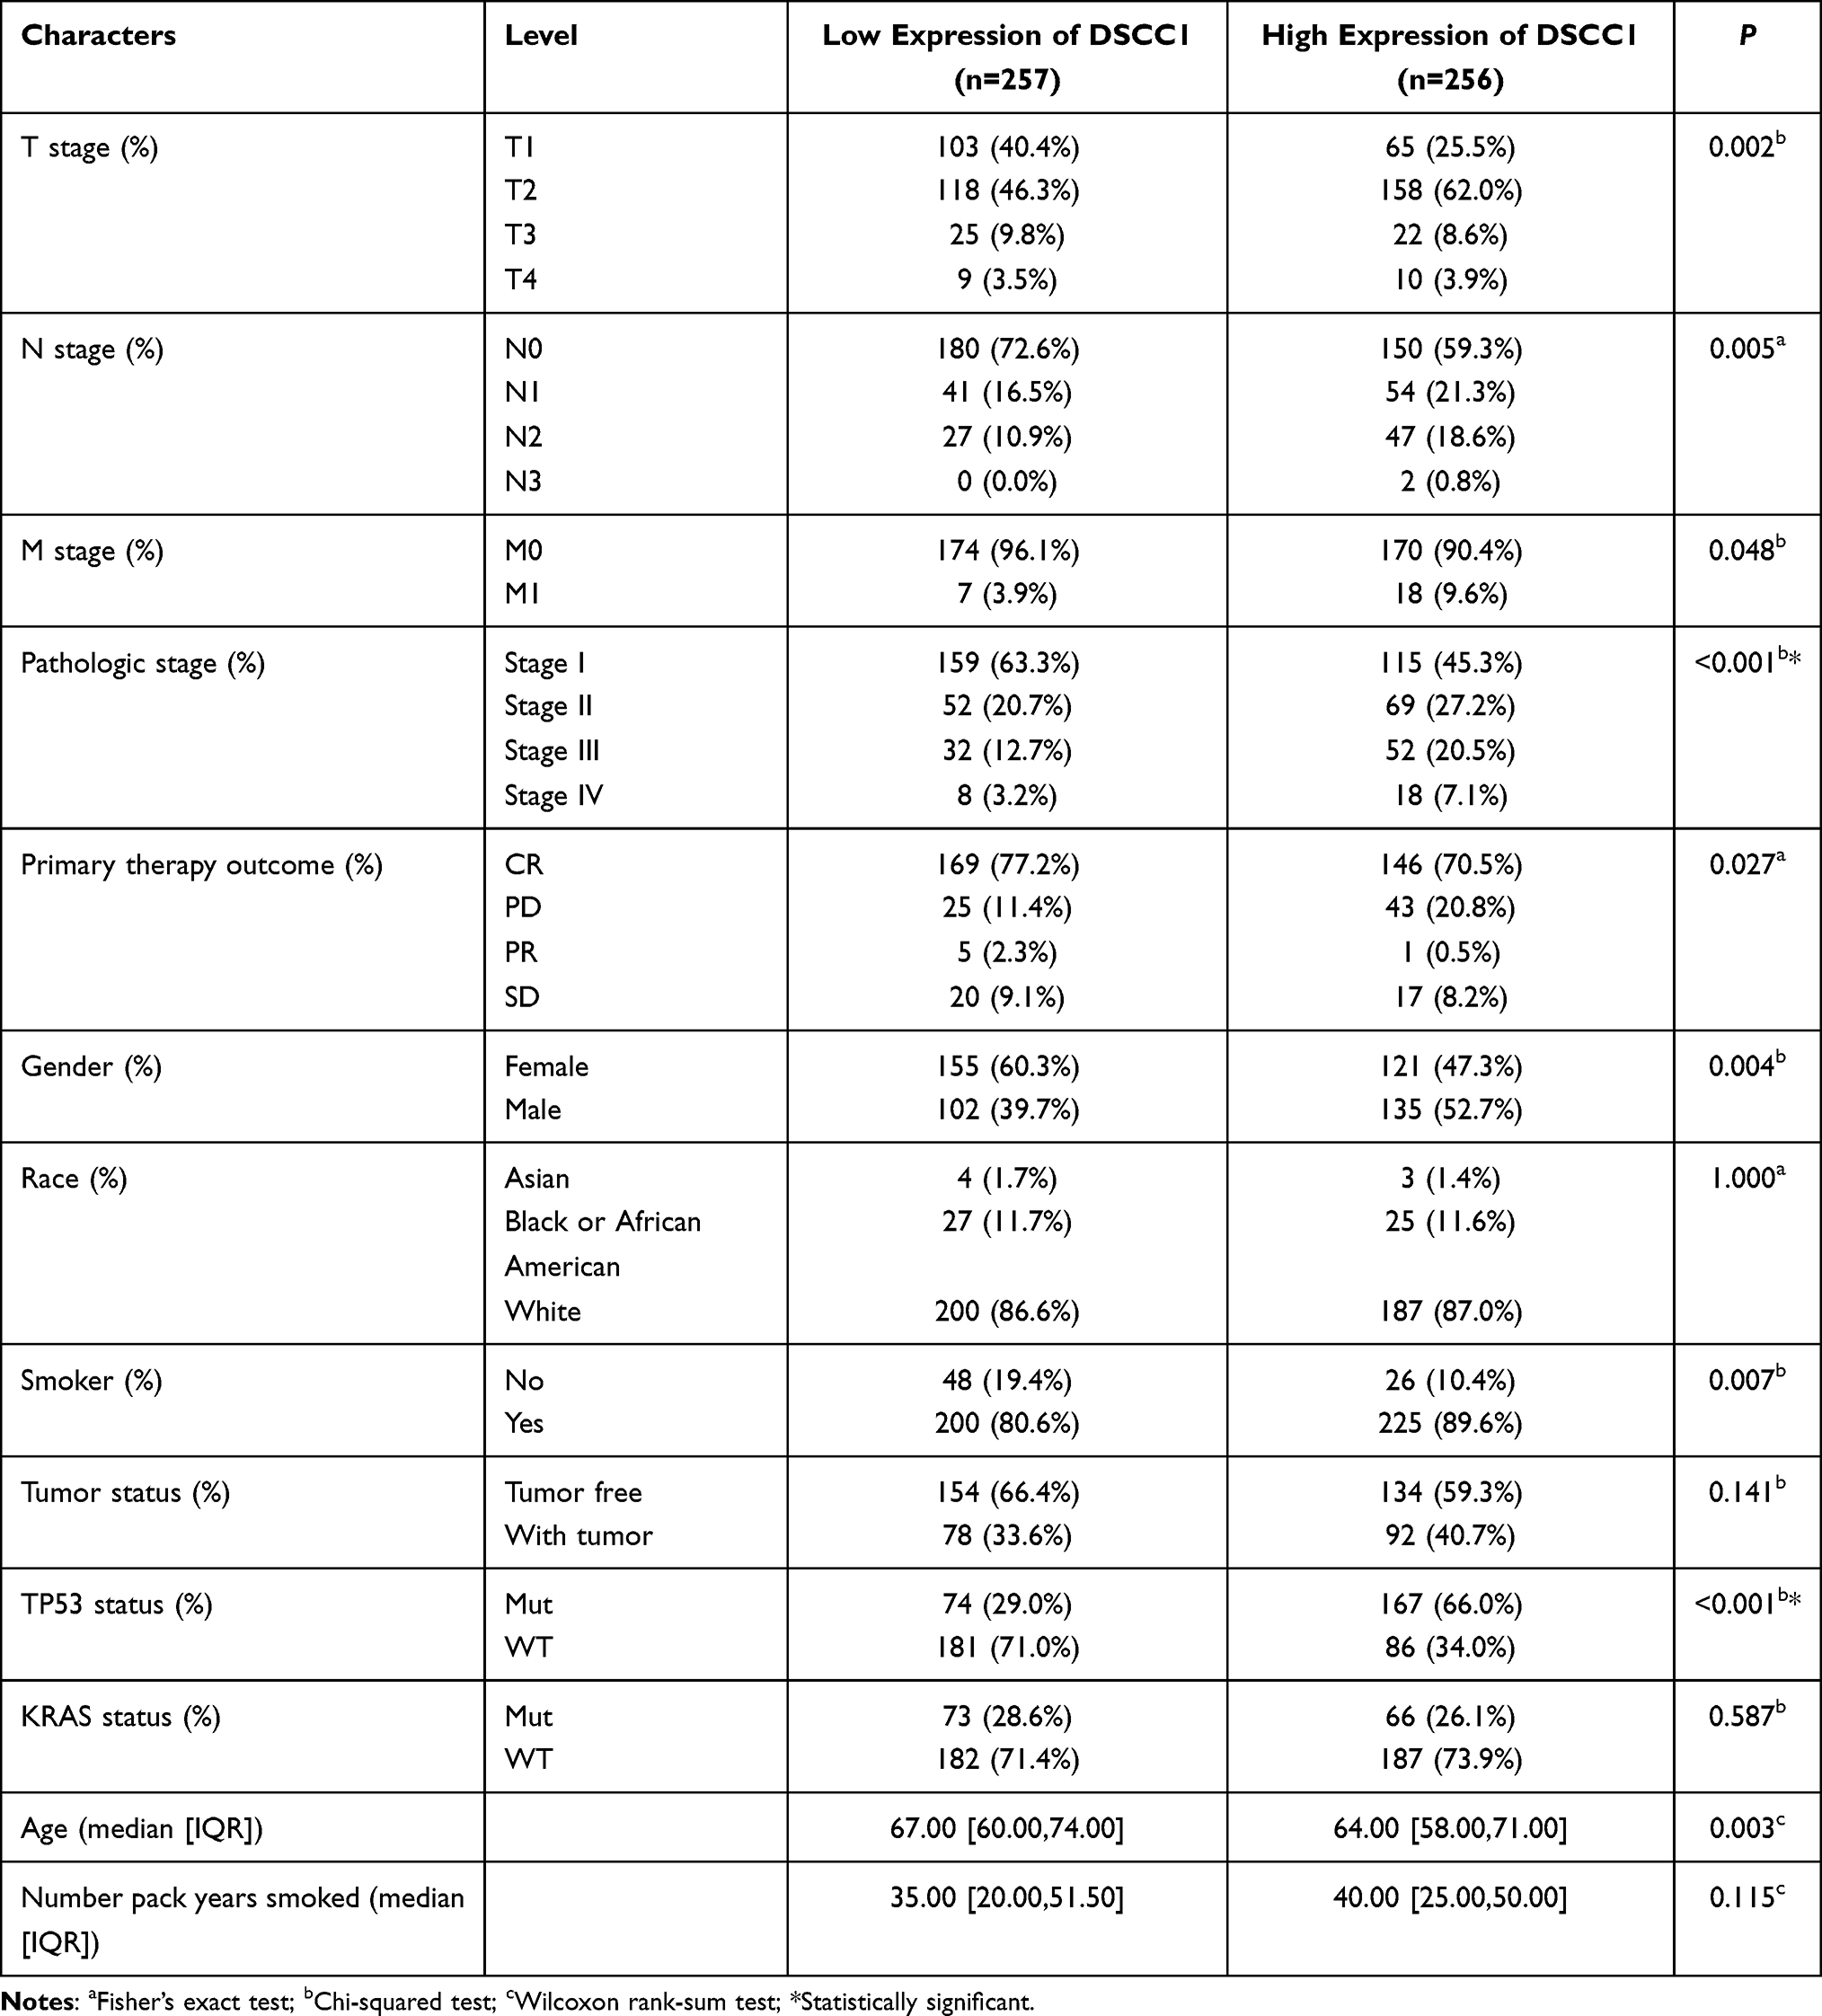 |
Table 1 The Characteristics of LUAD Patients in TCGA |
Relationship Between DSCC1 Expression and Clinicopathological Parameters of LUAD
Wilcoxon signed-rank test was used to evaluate the expression effect of DSCC1 in tumor patients. The expression of DSCC1 in GTEX combined with TCGA was compared with that in unpaired TCGA tumor tissues (Figure 2A). It was finally concluded that the expression of DSCC1 in BLCA, BRCA, CESC, CHOL, COAD, DLBC, ESCA, GBM, HNSC, KICH, KIRC, KIRP, LAML, LGG, LIHC, LUAD, LSC, OV, PAAD, PCPG, PRAD, READ, SARC, SKCM, STAD, TGCT, THCA, THYM, UCEC, and UCS was remarkably high (P<0.05). Also, it was also found that DSCC1 was highly expressed in LUAD, and the results were statistically significant (P<0.001) (Figure 2B). Moreover, DSCC1 expression values in 57 tumor tissues were significantly higher than that in 57 paired normal LUAD tissues in the TCGA cohort (P<0.001) (Figure 2C). The above results showed that the expression of DSCC1 was significantly higher in LUAD samples.
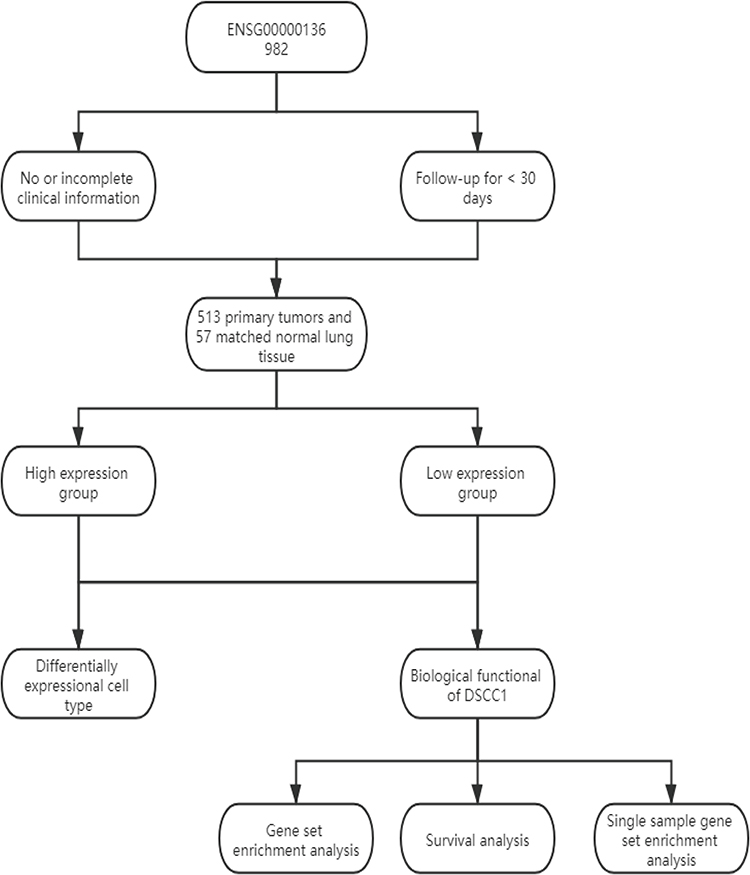 |
Figure 1 Flowchart showed the analysis strategy. The design and process of our study are shown in the flowchart, included data selection and exclusion. |
Relationship Between DSCC1 Expression and Clinical Variables
As shown in Figure 3, Wilcoxon rank-sum test showed that high expression of DSCC1 was significantly correlated with T stage (Figure 3A, P< 0.001), N stage (Figure 3B, P = 0.002), M stage (Figure 3C, P = 0.043), pathological stage (Figure 3D, P < 0.001), tumor status (Figure 3E, P = 0.007), primary treatment outcome (Figure 3F, P = 0.010), TP53 status (Figure 3G, P < 0.001), smoking (Figure 3H, P = 0.011), sex (Figure 3I, P = 0.008) and so on. The relationship between the clinicopathologic features of LUAD and DSCC1 expression was analyzed using logistics regression. Logistic regression univariate analysis showed that the expression of DSCC1 as a classification dependent variable was associated with the clinicopathological features of poor prognosis (Table 2). The results suggested that high expression of DSCC1 was significantly correlated with T stage (OR = 1.04(1.02–1.07), P=0.002) and pathological stage (OR = 1.03 (1.01–1.05),P=0.008). In addition, it was also significantly related to TP53 status (OR = 1.10 (1.07–1.14), P<0.001). These results suggest that LUAD with high expression of DSCC1 may be more likely to progress to the advanced stage than those with low expression of DSCC1.
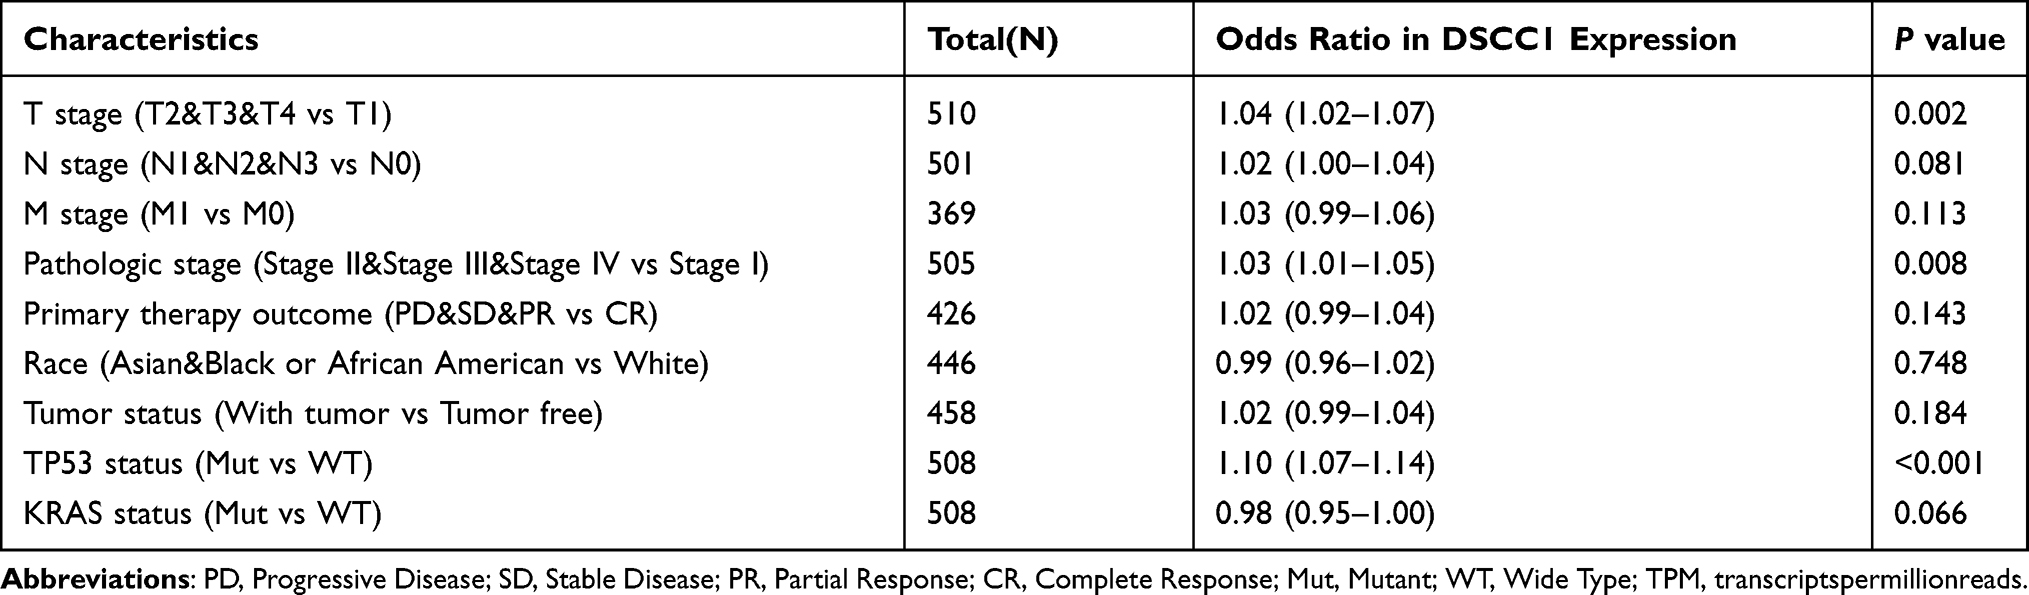 |
Table 2 Relationship Between Clinicopathologic Features and Gene TPM in LUAD |
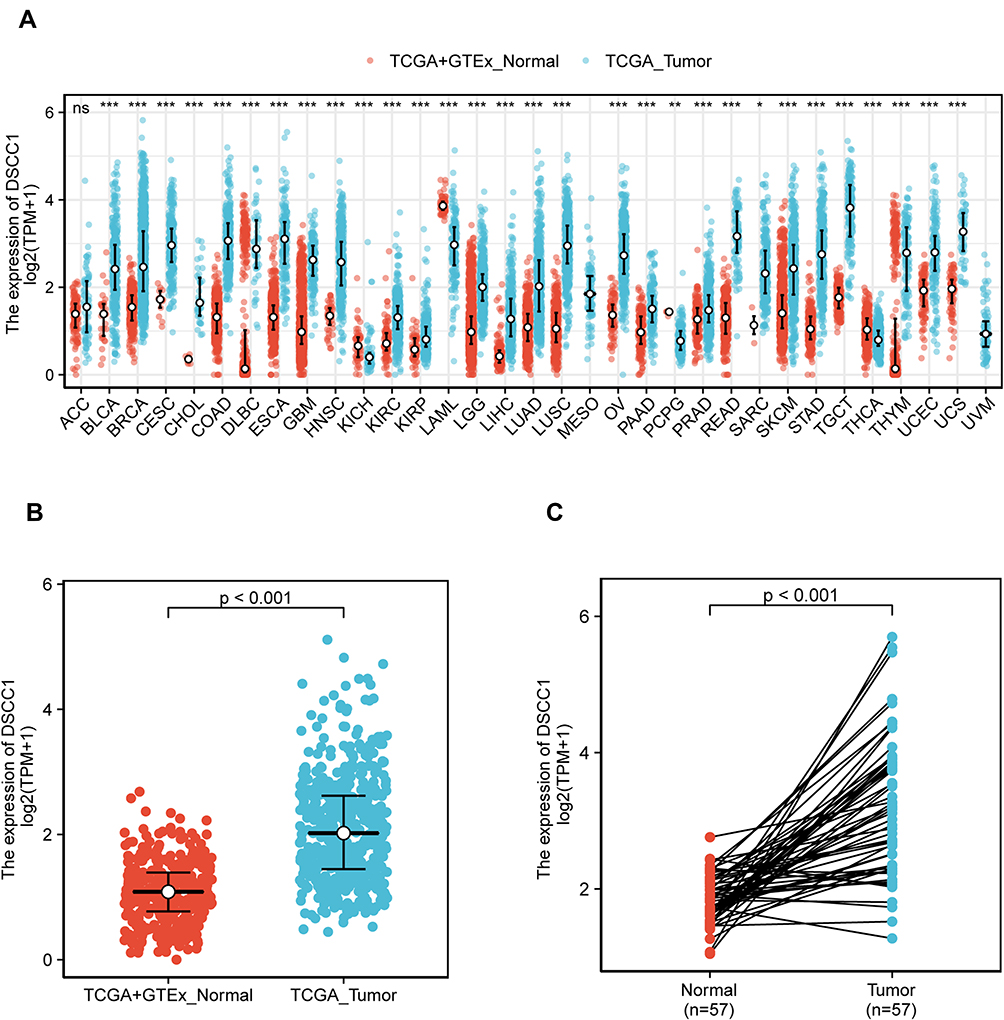 |
Figure 2 DSCC1 expression levels in different types of human cancers (A), ns, P≥0.05; *P < 0.05; **P < 0.01; ***P < 0.001. The higher expression level of DSCC1 is shown in LUAD compared with normal samples (P < 0.001) (B). DSCC1 expression levels in LUAD and matched normal lung tissues in TCGA cohort (P < 0.001) (C). Abbreviations: ACC, adrenocortical carcinoma; BLCA, bladder urothelial carcinoma; BRCA, breast invasive carcinoma; CESC, cervical and endocervical cancers; CHOL, cholangiocarcinoma; COAD, colon adenocarcinoma; DLBC, lymphoid neoplasm diffuse large B-cell lymphoma; ESCA, esophageal carcinoma; GBM, glioblastoma multiforme; HNSC, head and neck squamous cell carcinoma; KICH, kidney chromophobe; KIRC, kidney renal clear cell carcinoma; KIRP, kidney renal papillary cell carcinoma; LAML, acute myeloid leukemia; LGG, brain lower grade glioma; LIHC, liver hepatocellular carcinoma; LUAD, lung adenocarcinoma; LUSC, lung squamous cell carcinoma; MESO, mesothelioma; OV, ovarian serous cystadenocarcinoma; PAAD, pancreatic adenocarcinoma; PCPG, pheochromocytoma and paraganglioma; PRAD, prostate adenocarcinoma; READ, rectum adenocarcinoma; SARC, sarcoma; SKCM, skin cutaneous melanoma; STAD, stomach adenocarcinoma; TGCT, testicular germ cell tumors; THCA, thyroid carcinoma; THYM, thymoma; UCEC, uterine corpus endometrial carcinoma; UCS, uterine carcinosarcoma; UVM, uveal melanoma. |
Univariate and Multivariate Analyses of Survival
Univariate analysis showed that high expression of DSCC1 was significantly correlated with poor OS in patients with LUAD (HR: 1.531; CI: 1.142–2.054), P=0.004) (Table 3). We found OS could reach 43.4 months and DSS 50 months, the median follow-up time reached 43.4 months (Figure 4A and B). Other clinicopathological variables related to poor survival included T stage (HR: 1.668 (1.184–2.349), P=0.003), N stage (HR: 2.606 (1.939–3.503), P < 0.001), M stage (HR: 2.111 (1.232–3.616), P=0.007), primary therapy outcome (HR: 2.818 (2.004–3.963), P < 0.001) and tumor status (HR: 6.211 (4.258–9.059), P < 0.001). In multivariate analysis (Table 3), primary therapy outcome (HR: 1.774 (1.136–2.771), P=0.012) and DSCC1 (HR = 1.683 (1.071–2.643), P=0.024), tumor status (HR: 6.064 (3.596–10.226), P<0.001) were independent prognostic factors affecting OS in patients with LUAD. As shown in Figure 4, the high expression of DSCC1 was significantly correlated with shorter DSS (Figure 4B, HR = 1.56 (1.07–2.26), P=0.021) and OS (Figure 4A, HR=1.53 (1.14–2.05), P=0.004) when compared with the low expression of DSCC1. We also analyzed the diagnostic efficacy of DSCC1 for LUAD by ROC. Our results suggested that DSCC1 might be a potential diagnostic molecule (AUC=0.845, CI (0.820-0.870)) (Figure 4C).
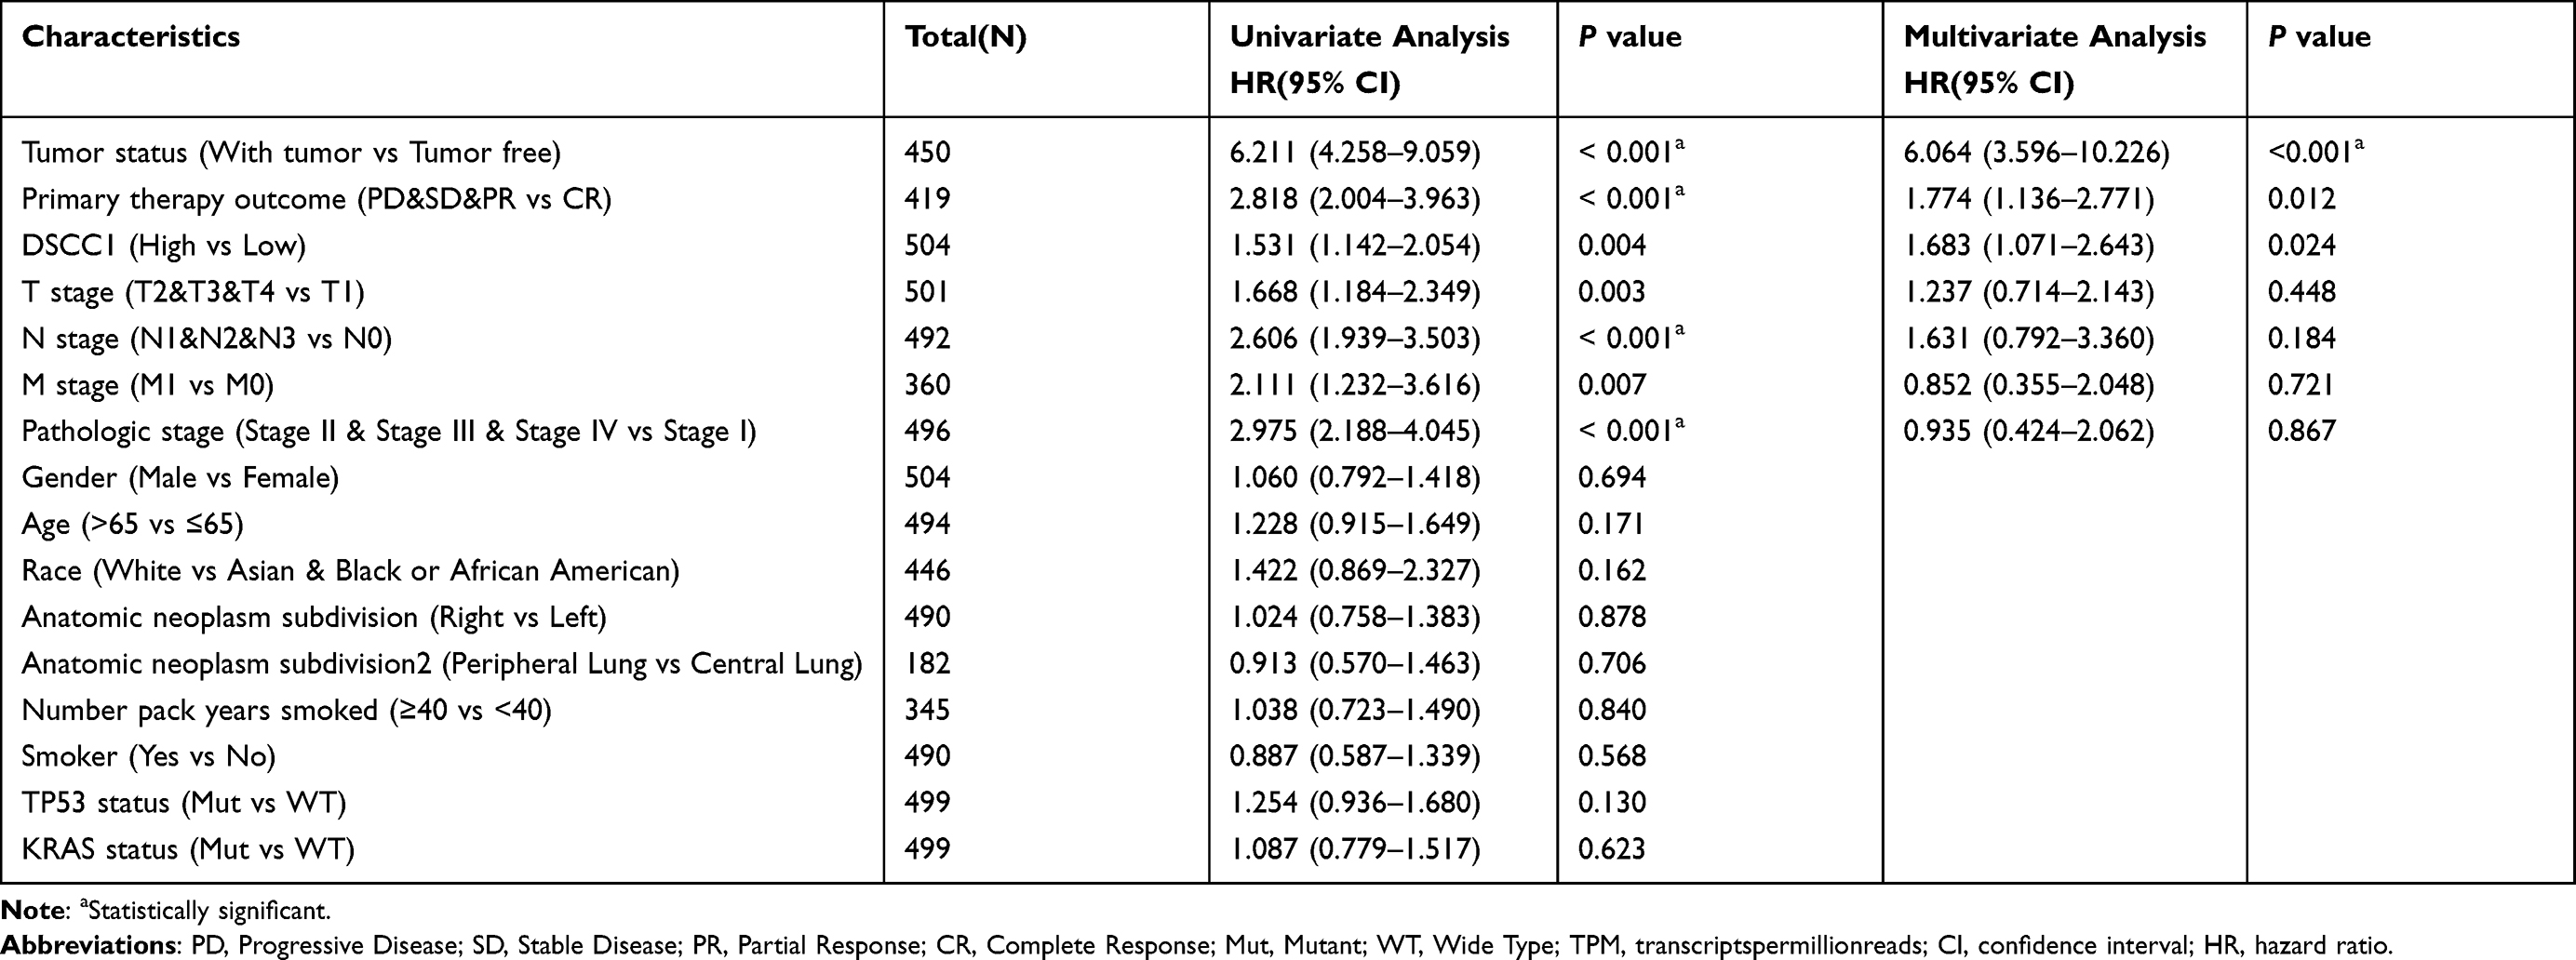 |
Table 3 Univariate and Multivariate COX Proportional Hazards Analysis of OS for Patients |
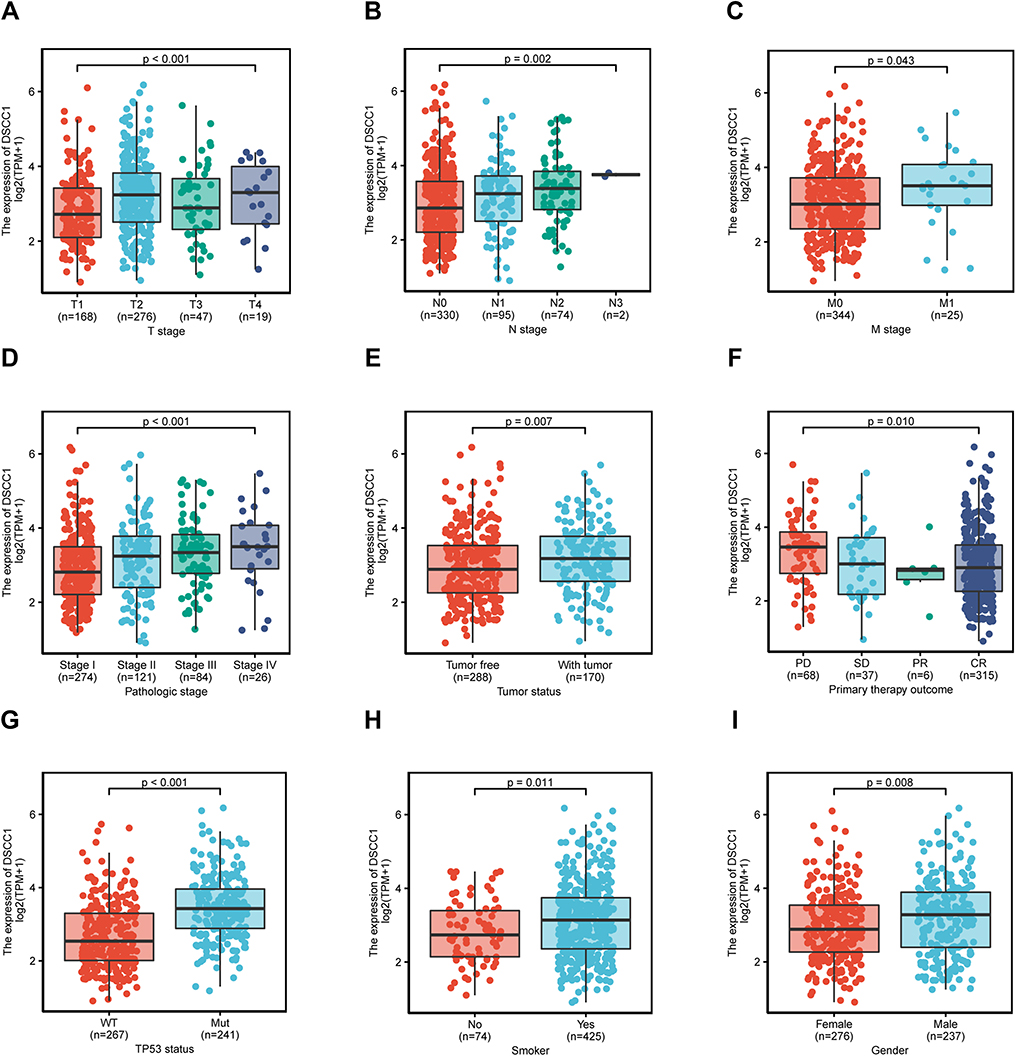 |
Figure 3 Association between DSCC1 expression and clinicopathologic characteristics, including T stage (A), N stage (B), M stage (C), pathological stage (D), tumor status (E), primary treatment outcome (F), and TP53 status (G), smoking (H), and sex (I). Abbreviations: CR, complete response; Mut, mutant; WT, wild type; PD, progressive disease; PR, partial response; SD, stable disease. |
GSEA Identifies DSCC1-Related Signaling Pathways
To identify differentially activated signaling pathways in LUAD, GSEA was used to find the functional and biological pathways between low and high expression of DSCC1 on TCGA expression datasets. Significant differences (FDR <0.25 and P.adjust<0.05) were found in the rich set of MSigDB (C2.all.v7.0.symbols.GMT) collection. We selected the most significant signal pathway according to the NES (Table 4). This analysis showed that the high expression phenotype of DSCC1 was composed of many key pathways and was related to tumorigenesis.
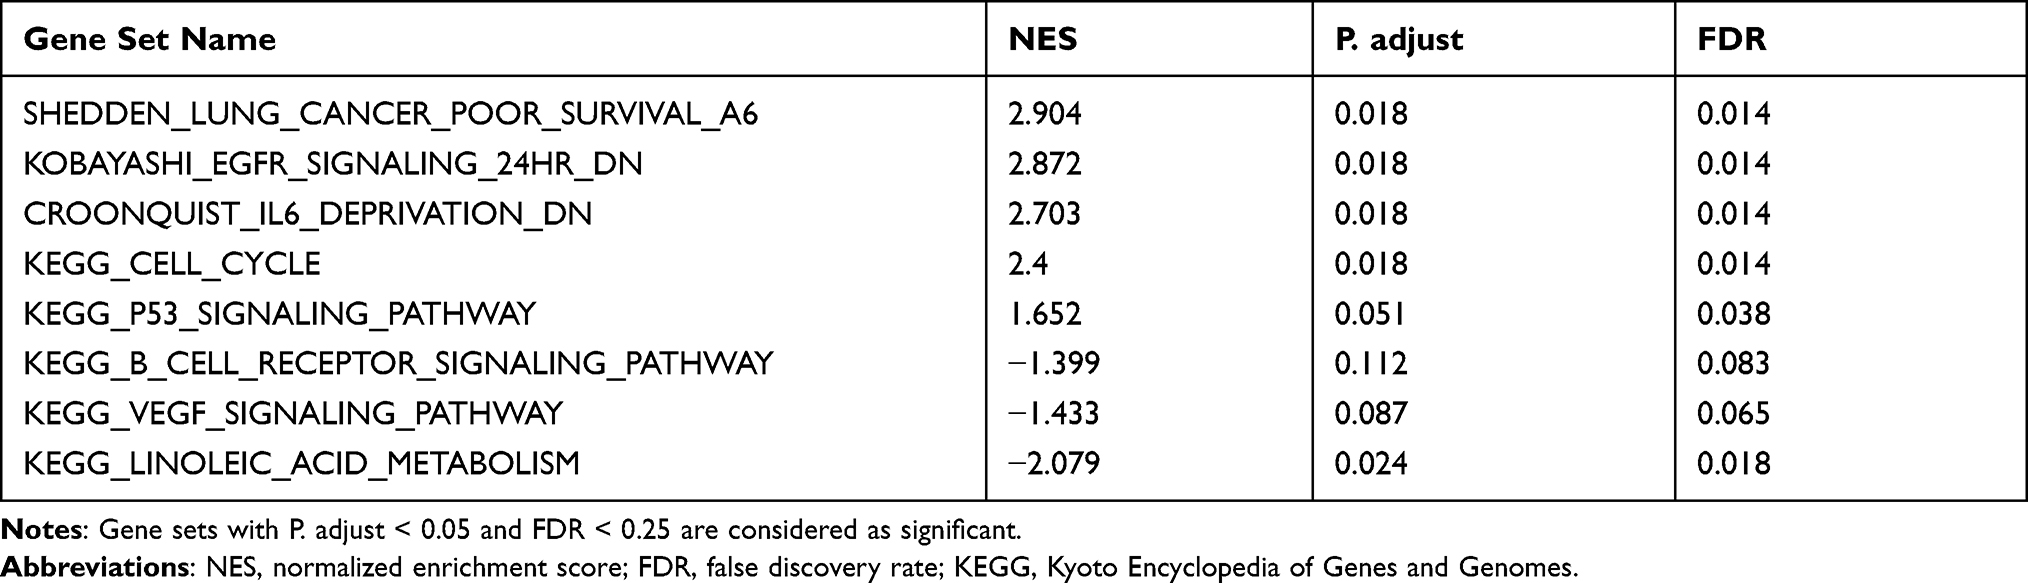 |
Table 4 Gene Sets Enriched in Phenotype High |
Among the high expression phenotypes of DSCC1, DSCC1 showed different degrees of enrichment, such as poor lung cancer survival, down-regulation of EGFR signal, reduction of IL-6 deprivation, cell cycle, and p53 signal pathway. The pathways of DSCC1 with low expression phenotype were also identified, including linoleic acid metabolism, VEGF signal pathway, and B cell receptor signal pathway.
The Relationship Between the Expression of DSCC1 and the Infiltration of Immune Cells
The tumor microenvironment is mainly composed of immune cells, extracellular matrix, tumor-associated fibroblasts, various growth factors, inflammatory factors, and cancer cells. Many studies have proved that there are complex interactions among various cells in the tumor microenvironment, and there are special cell infiltration patterns, which affect the diagnosis, survival, prognosis, and clinical efficacy of the tumor. We used ssGSEA to analyze the relationship between the expression of DSCC1 and immune cell infiltration in the microenvironment of LUAD, as shown in Figure 5A. Spearman correlation analysis showed that the expression of DSCC1 was positively correlated with the infiltration of Th2 cells (Figure 5B, R = 0.750, P<0.001) and T Helper cells (Figure 5C, R = 0.174, P<0.001). Wilcoxon rank-sum revealed that the infiltration level of the immune cells in the high DSCC1 expression group was significantly increased compared with the DSCC1 low-expression group, and the differences were statistically significant (Figure 5D, P<0.001, Figure 5E, P=0.003).
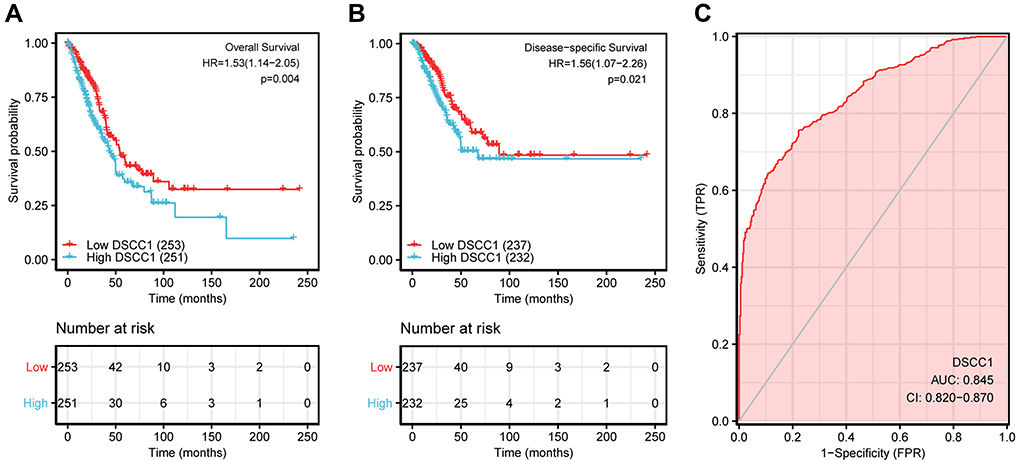 |
Figure 4 Impact of DSCC1 expression on overall survival (A), disease-specific survival (B) in patients with LUAD in TCGA (The Cancer Genome Atlas) cohort. Receiver operating characteristic is used to evaluate the diagnostic efficacy of DSCC1 for LUAD (C). Abbreviations: AUC, area under the curve; CI, confidence interval; FPR, false-positive rate; HR, hazard ratio. |
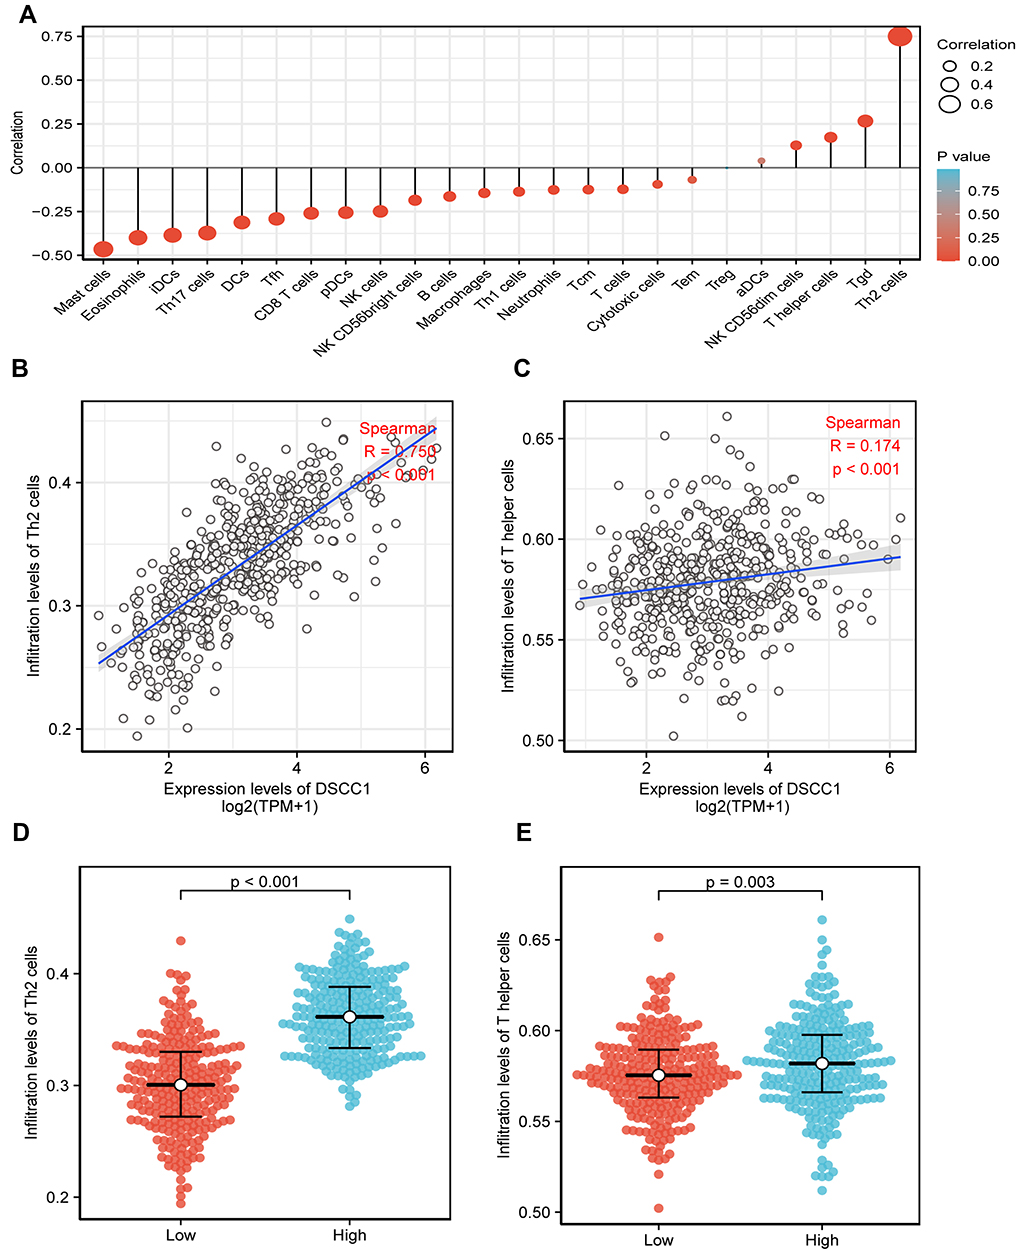 |
Figure 5 The expression level of DSCC1 was associated with the immune infiltration in the tumor microenvironment. The forest plot shows the correlation between DSCC1 expression and immune cell subsets (A). We used Spearman correlation to analyze the correlation between DSCC1 expression and Th2 cells (B) and T helper cells (C). The Wilcoxon rank-sum test was used to analyze the differences in the infiltration level of Th2 cells (D) and T helper cells (E) between the high and low DSCC1 expression groups. Abbreviations: DCs, dendritic cells; pDCs, plasmacytoid dendritic cells; aDCs, activated dendritic cells; iDCs, immature dendritic cells; Tcm, central memory T lymphocyte; Tem, effector memory T lymphocyte; Tfh, follicular helper T lymphocyte; Tgd, gamma delta T lymphocyte. |
Discussion
Over recent years, it has been reported that DSCC1 was highly expressed in colorectal cancer cells24 and hepatocellular carcinoma cells.25 Compared with non-tumor tissues, DSCC1 was also highly expressed in breast cancer.8 Experiments have shown that DSCC1 enhances the vitality, invasiveness, and vitality of breast cancer cells.8 Similar to the above results, we used bioinformatics tools to observe the high expression of DSCC1 in LUAD tissues from the public database. It is worth noting that, consistent with the findings of DSCC1 in hepatocellular carcinoma and breast cancer, DSCC1 is an independent prognostic factor for patients with poor prognoses.8,25 In this study, the results showed that the expression of DSCC1 in LUAD tumor tissues was significantly higher than that in paracancerous tissues. The high expression of DSCC1 in LUAD was related to T stage, pathological stage, TP53 status, shorter survival time, and worse prognosis, thus supporting the theory that the expression of DSCC1 is closely related to the development of LUAD.
In order to further study the role of DSCC1 in LUAD, we used TCGA data for GSEA analysis. GSEA results showed that lung cancer had a low survival rate, down-regulation of EGFR signal, reduction of IL-6 deprivation, cell cycle, p53 signal pathway, and small cell lung cancer were significantly abundant in the DSCC1 high expression phenotype group. Clinically, EGFR-TKI has been accepted as a common strategy for targeted therapy in patients with non-small cell lung cancer.26,27 Moreover, these are among few targeted treatments available.28,29 We speculate that the down-regulation of the EGFR signal could reduce the number of people using targeted drugs, which may further shorten the survival time of patients.
Many studies have shown that the hallmark of cancer is tumor-promoting inflammation.30 Based on the results of our research, the decrease of IL-6 deprivation leads to a relative increase in the amount of IL in serum. Previous reports revealed a relatively poor prognosis31,32 in LUAD patients with increased inflammatory cytokine IL-632,33 and a high number of inflammatory cells in TME. Previously, researchers have found that blocking IL-6 can significantly inhibit lung cancer promotion in mouse models with KRAS mutations. Also, it can inhibit the activation of tumor STAT3 and the proliferation of tumor cells. Among them, STAT3 is an IL-6 reactive transcription factor whose activation can induce tumor to promote the reverse pathway of inflammation.34,35
According to one experimental study, the p53 signal pathway has an important role in the occurrence and development of many kinds of malignant tumors. In one study, up-regulation of central genes (CCNB1, CCNB2, CDK1, CDKN2A, and CHEK1) in the p53 signaling pathway confirmed the p53 signaling pathway as a risk factor for tumorigenesis and survival in LUAD.36 In addition, the abnormality of the cell cycle pathway accelerates the occurrence of LUAD. Some scholars have found that the p53 gene has an important regulatory role in the cell cycle, apoptosis, and genomic stability.37,38 Other studies have found that p53 triggers DNA damage and oncogene activation.39,40 Therefore, we speculated that the p53 signal pathway in LUAD may produce more interaction networks with other signal pathways through molecules such as DSCC1 or may promote tumorigenesis by changing the cell cycle.
Immunotherapy represented by immune checkpoint inhibitor has changed the traditional treatment of LUAD, and it is beneficial to patients clinically.41,42 However, the survival benefit for LUAD patients is still not ideal, and the vast majority of patients have little or no benefit at all. Consequently, we analyzed the relationship between the expression level of DSCC1 in the LUAD microenvironment and immune infiltration. Our results showed that the expression of DSCC1 was negatively correlated with macrophages, NK cells, and T cells. Also, the expression of DSCC1 was low in these immune cells that could kill tumor cells. Compared with the low expression group of DSCC1, the infiltration of DSCC1 in Th2 cells, helper T cells, NKCD56dim cells, and other immune cells was significantly increased. Immune cells in the tumor microenvironment may affect the occurrence and development of malignant tumors.43,44 The proportion of immune cell infiltration is also related to tumor metastasis and drug resistance mechanisms.45 Previous studies46 have shown that different immune cell infiltration may differently affect the clinical outcomes of patients. Among them, T-cell infiltrating tumors may respond to treatments aimed at the mechanism of immune system suppression. Non-T cell infiltrating tumors may require additional interventions to promote inflammation and innate immune activation in the tumor microenvironment. The infiltration of macrophages, dendritic cells, and helper T cells in the center and edge of tumor invasion is related to the resistance to radiotherapy and chemotherapy and the shortening of survival time.47 In a study on the characteristics of immune cell infiltration in the overall tumor microenvironment mediated by molecules,48 the p53 signal transduction pathway and cancer pathway were activated compared with the low-risk group, which may be related to the short survival time of patients. Moreover, the infiltration of regulatory T cells in high-risk groups significantly increased. These results suggest that DSCC1 may be involved in regulating the infiltration of immune cells in the microenvironment of LUAD, thus affecting the prognosis of patients with LUAD.
Despite these new insights, the number of patients with drug resistance and relapse after treatment is still very high. The targeted therapy of the above molecular markers may be effective, but the final treatment effect is disappointing. Therefore, we should try to find new molecular markers. From the ROC curve, it was found that DSCC1 may be a potential diagnostic molecule.
Although we founded its predictive value in LUAD clinical outcomes, there were some limitations. On the one hand, we could not evaluate a specific role for DSCC1 in LUAD treatment due to the incomplete information about details on treatments. On the other hand, the corresponding responses was different and unknown. What is more, we were unable to provide information about the relative protein levels. Therefore, comprehensive studies are needed to confirm our findings and thus promote the clinical utility of DSCC1 in the evaluation of LUAD prognosis.
Conclusion
DSCC1 has an important role in the occurrence and development of LUAD. This report revealed that the expression of DSCC1 was up-regulated in LUAD. Also, the high expression of DSCC1 led to a poor prognosis. In addition, DSCC1 may be a potential diagnostic molecule, which may improve patients’ prognosis.
Abbreviations
DSCC1, DNA replication and sister chromatid cohesion 1; DCC1, DNA replication and sister chromatid cohesion 1; SCLC, small cell lung carcinoma; NSCLC, non-small-cell lung carcinoma; LUAD, lung adenocarcinoma; TCGA, the cancer genome atlas; GTEx, genotype tissue expression; GSEA, gene set enrichment analysis; ssGSEA, single sample gene set enrichment analysis; KEGG, Kyoto Encyclopedia of Genes and Genomes; ROC, receiver operating characteristic; CI, confidence interval; HR, hazard ratio; PD, Progressive Disease; SD, Stable Disease; PR, Partial Response; CR, Complete Response; Mut, Mutant; WT, Wide Type; DSS, disease free survival; OS, overall survival; FDR, false discovery rate; NES, normalized enrichment fraction; ROC, the time-dependent receiver operating characteristic curve; AUC, the area under the curve; PD-1, programmed cell death protein 1; PD-L1, programmed cell death-Ligand 1; RFC, replication factor c complex; PCNA, proliferating cell nuclear antigen; Ctf18, chromosome transmission fidelity protein 18; FPKM, FregmentsPerKilobaseperMil lion; TPM, transcriptspermillionreads; TP53, tumor protein p53; KARS, V-Ki-ras2 Kirsten ratsarcoma viral oncogene homolog; EGFR, epidermal growth factor receptor; IL-6, interleukin-6; p53, tumor protein 53; VEGF, vascular endothelial growth factor; EGFR TKI, epidermal growth factor receptor tyrosine kinase inhibitor; STAT3, signal transducers and activators of transduction-3; CCNB1, cyclin B1; CCNB2, cyclin B2; CDK1, cyclin dependent kinase 1; CDKN2A, cyclin-dependent kinase inhibitor 2A; CHEK1, checkpoint kinase 1; TME, tumor microenvironment mediated; DCs, dendritic cells; iDCs, immature DCs; aDCs, activated DCs; NKs, natural killer cells; Th1, T helper 1; Th2, T helper 2; Tγδ, T gamma delta; Tcm, T central memory; Tem, T effector memory; Tfh, T follicular helper cells; Th17, T helper 17 cells; Treg, regulatory T cells; ACC, adrenocortical carcinoma; BLCA, bladder urothelial carcinoma; BRCA, breast invasive carcinoma; CESC, cervical and endocervical cancers; CHOL, cholangiocarcinoma; COAD, colon adenocarcinoma; DLBC, lymphoid neoplasm diffuse large B-cell lymphoma; ESCA, esophageal carcinoma; GBM, glioblastoma multiforme; HNSC, head and neck squamous cell carcinoma; KICH, kidney chromophobe; KIRC, kidney renal clear cell carcinoma; KIRP, kidney renal papillary cell carcinoma; LAML, acute myeloid leukemia; LGG, brain lower grade glioma; LIHC, liver hepatocellular carcinoma; LUSC, lung squamous cell carcinoma; MESO, mesothelioma; OV, ovarian serous cystadenocarcinoma; PAAD, pancreatic adenocarcinoma; PCPG, pheochromocytoma and paraganglioma; PRAD, prostate adenocarcinoma; READ, rectum adenocarcinoma; SARC, sarcoma; SKCM, skin cutaneous melanoma; STAD, stomach adenocarcinoma; TGCT, testicular germ cell tumors; THCA, thyroid carcinoma; THYM, thymoma; UCEC, uterine corpus endometrial carcinoma; UCS, uterine carcinosarcoma; UVM, uveal melanoma.
Disclosure
The authors report no conflicts of interest in this work.
References
1. Siegel RL, Miller KD, Fuchs HE, Jemal A. Cancer statistics, 2021. CA Cancer J Clin. 2021;71(1):7–33. doi:10.3322/caac.21654
2. Sher T, Dy GK, Adjei AA. Small cell lung cancer. Mayo Clinic Proceedings. 2008;83(3):355–367. doi:10.4065/83.3.355
3. Jordan EJ, Kim HR, Arcila ME, et al. Prospective comprehensive molecular characterization of lung adenocarcinomas for efficient patient matching to approved and emerging therapies. Cancer Discov. 2017;7(6):596–609. doi:10.1158/2159-8290.CD-16-1337
4. Ruiz-Cordero R, Devine WP. Targeted therapy and checkpoint immunotherapy in lung cancer. Surg Pathol Clin. 2020;13(1):17–33. doi:10.1016/j.path.2019.11.002
5. Wu P, Zheng Y, Wang Y, Wang Y, Liang N. Development and validation of a robust immune-related prognostic signature in early-stage lung adenocarcinoma. J Transl Med. 2020;18(1):380. doi:10.1186/s12967-020-02545-z
6. Denisenko TV, Budkevich IN, Zhivotovsky B. Cell death-based treatment of lung adenocarcinoma. Cell Death Dis. 2018;9(2):117. doi:10.1038/s41419-017-0063-y
7. Santarpia M, Aguilar A, Chaib I, et al. Non-small-cell lung cancer signaling pathways, metabolism, and PD-1/PD-L1 antibodies. Cancers. 2020;12(6):1475. doi:10.3390/cancers12061475
8. Jin G, Wang W, Cheng P, Tian Y, Zhang L, Niu HU. DNA replication and sister chromatid cohesion 1 promotes breast carcinoma progression by modulating the Wnt/β-catenin signaling and p53 protein. J Biosci. 2020;45. doi:10.1007/s12038-020-00100-y
9. Gazy I, Kupiec M. The importance of being modified: PCNA modification and DNA damage response. Cell Cycle. 2012;11(14):2620–2623. doi:10.4161/cc.20626
10. Waga S, Stillman B. The DNA replication fork in eukaryotic cells. Annu Rev Biochem. 1998;67:721–751. doi:10.1146/annurev.biochem.67.1.721
11. Cai J, Uhlmann F, Gibbs E, et al. Reconstitution of human replication factor C from its five subunits in baculovirus-infected insect cells. Proc Natl Acad Sci U S A. 1996;93(23):12896–12901. doi:10.1073/pnas.93.23.12896
12. Podust VN, Podust LM, Goubin F, Ducommun B, Hübscher U. Mechanism of inhibition of proliferating cell nuclear antigen-dependent DNA synthesis by the cyclin-dependent kinase inhibitor p21. Biochemistry. 1995;34(27):8869–8875. doi:10.1021/bi00027a039
13. Kim J, MacNeill SA. Genome stability: a new member of the RFC family. Curr Biol. 2003;13(22):R873–875. doi:10.1016/j.cub.2003.10.048
14. Ohta S, Shiomi Y, Sugimoto K, Obuse C, Tsurimoto T. A proteomics approach to identify proliferating cell nuclear antigen (PCNA)-binding proteins in human cell lysates. Identification of the human CHL12/RFCs2-5 complex as a novel PCNA-binding protein. J Biol Chem. 2002;277(43):40362–40367. doi:10.1074/jbc.M206194200
15. Mayer ML, Gygi SP, Aebersold R, Hieter P. Identification of RFC(Ctf18p, Ctf8p, Dcc1p): an alternative RFC complex required for sister chromatid cohesion in S. cerevisiae. Mol Cell. 2001;7(5):959–970. doi:10.1016/S1097-2765(01)00254-4
16. Kouprina N, Tsouladze A, Koryabin M, Hieter P, Spencer F, Larionov V. Identification and genetic mapping of CHL genes controlling mitotic chromosome transmission in yeast. Yeast. 1993;9(1):11–19. doi:10.1002/yea.320090103
17. Pellegrini L. Dual roles of Ctf18-RFC: loading the clamp and angling for the polymerase. Structure. 2018;26(1):1–2. doi:10.1016/j.str.2017.12.009
18. Grabarczyk DB, Silkenat S, Kisker C. Structural basis for the recruitment of Ctf18-RFC to the replisome. Structure. 2018;26(1):137–144.e133. doi:10.1016/j.str.2017.11.004
19. Batra R, Harder N, Gogolin S, et al. Time-lapse imaging of neuroblastoma cells to determine cell fate upon gene knockdown. PLoS One. 2012;7(12):e50988. doi:10.1371/journal.pone.0050988
20. Vivian J, Rao AA, Nothaft FA, et al. Toil enables reproducible, open source, big biomedical data analyses. Nat Biotechnol. 2017;35(4):314–316. doi:10.1038/nbt.3772
21. Bindea G, Mlecnik B, Tosolini M, et al. Spatiotemporal dynamics of intratumoral immune cells reveal the immune landscape in human cancer. Immunity. 2013;39(4):782–795. doi:10.1016/j.immuni.2013.10.003
22. Zhang JA, Zhou XY, Huang D, et al. Development of an immune-related gene signature for prognosis in melanoma. Front Oncol. 2020;10:602555. doi:10.3389/fonc.2020.602555
23. Huang R, Liao X, Li Q. Identification and validation of potential prognostic gene biomarkers for predicting survival in patients with acute myeloid leukemia. Onco Targets Ther. 2017;10:5243–5254. doi:10.2147/OTT.S147717
24. Yamaguchi K, Yamaguchi R, Takahashi N, et al. Overexpression of cohesion establishment factor DSCC1 through E2F in colorectal cancer. PLoS One. 2014;9(1):e85750. doi:10.1371/journal.pone.0085750
25. Xie XW, Wang XY, Liao WJ, et al. Effect of upregulated DNA replication and sister chromatid cohesion 1 expression on proliferation and prognosis in hepatocellular carcinoma. Chin Med J. 2018;131(23):2827–2835.
26. Lin JJ, Riely GJ, Shaw AT. Targeting ALK: precision medicine takes on drug resistance. Cancer Discov. 2017;7(2):137–155. doi:10.1158/2159-8290.CD-16-1123
27. Camidge DR, Pao W, Sequist LV. Acquired resistance to TKIs in solid tumours: learning from lung cancer. Nat Rev Clin Oncol. 2014;11(8):473–481. doi:10.1038/nrclinonc.2014.104
28. Ostrem JM, Shokat KM. Direct small-molecule inhibitors of KRAS: from structural insights to mechanism-based design. Nat Rev Drug Discov. 2016;15(11):771–785. doi:10.1038/nrd.2016.139
29. Herbst RS, Morgensztern D, Boshoff C. The biology and management of non-small cell lung cancer. Nature. 2018;553(7689):446–454. doi:10.1038/nature25183
30. Hanahan D, Coussens LM. Accessories to the crime: functions of cells recruited to the tumor microenvironment. Cancer Cell. 2012;21(3):309–322. doi:10.1016/j.ccr.2012.02.022
31. Bremnes RM, Al-Shibli K, Donnem T, et al. The role of tumor-infiltrating immune cells and chronic inflammation at the tumor site on cancer development, progression, and prognosis: emphasis on non-small cell lung cancer. J Thorac Oncol. 2011;6(4):824–833. doi:10.1097/JTO.0b013e3182037b76
32. Caetano MS, Hassane M, Van HT, et al. Sex specific function of epithelial STAT3 signaling in pathogenesis of K-ras mutant lung cancer. Nat Commun. 2018;9(1):4589. doi:10.1038/s41467-018-07042-y
33. Barrera L, Montes-Servín E, Barrera A, et al. Cytokine profile determined by data-mining analysis set into clusters of non-small-cell lung cancer patients according to prognosis. Ann Oncol. 2015;26(2):428–435. doi:10.1093/annonc/mdu549
34. Yu H, Pardoll D, Jove R. STATs in cancer inflammation and immunity: a leading role for STAT3. Nat Rev Cancer. 2009;9(11):798–809. doi:10.1038/nrc2734
35. Kortylewski M, Yu H. Role of Stat3 in suppressing anti-tumor immunity. Curr Opin Immunol. 2008;20(2):228–233. doi:10.1016/j.coi.2008.03.010
36. Xu S, Liu R, Da Y. Comparison of tumor related signaling pathways with known compounds to determine potential agents for lung adenocarcinoma. Thorac Cancer. 2018;9(8):974–988. doi:10.1111/1759-7714.12773
37. Shakya R, Tarulli GA, Sheng L, et al. Mutant p53 upregulates alpha-1 antitrypsin expression and promotes invasion in lung cancer. Oncogene. 2017;36(31):4469–4480. doi:10.1038/onc.2017.66
38. Tang Y, Wang J, Lian Y, et al. Linking long non-coding RNAs and SWI/SNF complexes to chromatin remodeling in cancer. Mol Cancer. 2017;16(1):42. doi:10.1186/s12943-017-0612-0
39. Giroud M, Guard O, Dumas R. Hemiballismus from hematoma in caudate nucleus. Surg Neurol. 1985;24(5):587–588. doi:10.1016/0090-3019(85)90280-0
40. Slotman GJ, Burchard KW, Yellin SA, Williams JJ. Prostaglandin and complement interaction in clinical acute respiratory failure. Arch Surg. 1986;121(3):271–274. doi:10.1001/archsurg.1986.01400030025002
41. Hellmann MD, Ciuleanu TE, Pluzanski A, et al. Nivolumab plus ipilimumab in lung cancer with a high tumor mutational burden. N Engl J Med. 2018;378(22):2093–2104. doi:10.1056/NEJMoa1801946
42. Camidge DR, Doebele RC, Kerr KM. Comparing and contrasting predictive biomarkers for immunotherapy and targeted therapy of NSCLC. Nat Rev Clin Oncol. 2019;16(6):341–355. doi:10.1038/s41571-019-0173-9
43. Lyssiotis CA, Kimmelman AC. Metabolic interactions in the tumor microenvironment. Trends Cell Biol. 2017;27(11):863–875. doi:10.1016/j.tcb.2017.06.003
44. Sun Y, Zhang Y, Ren S, et al. Low expression of RGL4 is associated with a poor prognosis and immune infiltration in lung adenocarcinoma patients. Int Immunopharmacol. 2020;83:106454. doi:10.1016/j.intimp.2020.106454
45. Waniczek D, Lorenc Z, Śnietura M, Wesecki M, Kopec A, Muc-Wierzgoń M. Tumor-associated macrophages and regulatory T cells infiltration and the clinical outcome in colorectal cancer. Arch Immunol Ther Exp. 2017;65(5):445–454. doi:10.1007/s00005-017-0463-9
46. Gajewski TF, Schreiber H, Fu YX. Innate and adaptive immune cells in the tumor microenvironment. Nat Immunol. 2013;14(10):1014–1022. doi:10.1038/ni.2703
47. Halama N, Michel S, Kloor M, et al. Localization and density of immune cells in the invasive margin of human colorectal cancer liver metastases are prognostic for response to chemotherapy. Cancer Res. 2011;71(17):5670–5677. doi:10.1158/0008-5472.CAN-11-0268
48. Wu Q, Wang L, Wei H, et al. Integration of multiple key molecules in lung adenocarcinoma identifies prognostic and immunotherapeutic relevant gene signatures. Int Immunopharmacol. 2020;83:106477. doi:10.1016/j.intimp.2020.106477
 © 2021 The Author(s). This work is published and licensed by Dove Medical Press Limited. The full terms of this license are available at https://www.dovepress.com/terms.php and incorporate the Creative Commons Attribution - Non Commercial (unported, v3.0) License.
By accessing the work you hereby accept the Terms. Non-commercial uses of the work are permitted without any further permission from Dove Medical Press Limited, provided the work is properly attributed. For permission for commercial use of this work, please see paragraphs 4.2 and 5 of our Terms.
© 2021 The Author(s). This work is published and licensed by Dove Medical Press Limited. The full terms of this license are available at https://www.dovepress.com/terms.php and incorporate the Creative Commons Attribution - Non Commercial (unported, v3.0) License.
By accessing the work you hereby accept the Terms. Non-commercial uses of the work are permitted without any further permission from Dove Medical Press Limited, provided the work is properly attributed. For permission for commercial use of this work, please see paragraphs 4.2 and 5 of our Terms.